Article

Low Reversible Capacity of Nitridated Titanium Electrical Terminals

1
Department of Inorganic Chemistry, Fritz-Haber-Institut der Max-Planck-Gesellschaft, Faradayweg 4-6, D-14195 Berlin, Germany
2
Soft Matter and Functional Materials, Helmholtz Zentrum Berlin für Materialien und Energie, Hahn-Meitner Platz 1, 14109 Berlin, Germany
*
Author to whom correspondence should be addressed.
Batteries 2019, 5(1), 17; https://doi.org/10.3390/batteries5010017
Submission received: 29 November 2018 / Revised: 13 January 2019 / Accepted: 22 January 2019 / Published: 29 January 2019

Abstract

:
The currently preferred manufacturing method for Lithium-ion battery (LIB) electrodes is via the slurry route. While such an approach is appealing, the complexity of the electrode layers containing the active materials, conductivity helpers, and binders, has hampered detailed investigations of the active materials. As an alternative, an active material can be deposited as a thin film on a planar substrate, which enables a more robust and detailed analysis. However, due to the small areal capacity of nanometric thin films, the electrochemical activity of the cell casing must be negligible or at least well determined. We reported on the capacity and the differential capacity metrics of several materials used in the construction of the electrical terminals in LIBs. Among these materials, Ti was revealed to have the minimum reversible capacity for lithium-ion storage. The mechanical and electrochemical properties of the Ti–based materials were further improved through surface nitridation with thermal treatment in an ammonia-rich atmosphere. The nitridated Ti electrical terminal achieved a reversible capacity that was at least fifteen times lower than that of stainless steel, with a featureless differential capacity representation creating quasi-ideal experimental conditions for a detailed investigation of electroactive thin films.

1. Introduction

Since the 1990s and driven by the demand for portable consumer electronics, lithium-ion batteries (LIBs) have gained importance due to their high gravimetric and volumetric energy densities [1]. Lithium metal oxides, LiCoO2, LiMnO2, LiFePO4, or more recently, LiNiMnPO4, are the typical cathode materials for LIBs [2]. On the anode side, metallic Li is attractive due to its low electrochemical potential (−3.04 V versus the standard hydrogen electrode) and gravimetric charge capacity of up to 3862 mAh g−1 [3,4]. Unfortunately, upon cycling, Li forms hazardous dendrites which may cause battery short circuits [5]. As an alternative, graphite has shown excellent properties, such as a low working potential (<0.4 V vs. Li/Li+), low cost, lightweight, high capacity of up to 372 mAh g−1 (LiC6), and a modest volume expansion of ca. 10% [6,7]. Consequently, carbonaceous based anodes have been intensively investigated due to the vast variety of carbon allotropes and nanostructuring possibilities [8]. However, the relatively low specific capacity of graphite has intensified the research to find suitable alternatives [9,10].
Several potential candidates can alloy with Li forming, e.g., LixM (where M = Sn, Si, Ge, Al, …), at low potentials vs. Li/Li+ [11,12,13,14]. As an example, Sn and Si can reach specific capacities of 994 mAh g-1 (Li4.4Sn) and 3592 mAh g-1 (Li15Si4) at room temperature (RT), respectively [15,16,17,18]. Owing to its large reversible capacity, Si represents one of the most promising candidates and has been intensively investigated in both industry and academia [14,19,20]. Conventionally, Si-based anodes are prepared using the slurry route where active materials, additives, and binders are mixed in a solvent. The anode is then obtained by spreading the slurry as a micrometric thick film on a Cu foil [9]. The slurry based approach results in a complex structure which hampers a detailed material investigation. As a solution, Si deposited as nanometric thin films forms a model anode which can be obtained by physical or chemical deposition methods [12,21,22,23]. The anodes composed of Si deposited onto the current collector exhibit a simpler architecture enabling a more detailed investigation, as well as a rational electrode development [23,24,25]. Additionally, Si-based thin film anodes are used for the conception of integrated devices such as microbatteries [26,27,28,29]. However, nanometric thin films have a small areal capacity that is found within a range of several hundred µAh cm−2. In comparison, slurry-produced electrodes have a typical capacity of several mAh cm−2.
The kinetic and first principle modelling of a LIB is challenging. Several electrochemical and physical phenomena must be taken into account, and are described in References [30,31,32,33,34]. Hereafter, the cell capacity is defined using an integrated model which takes into account the active material chemistry and collects any other residual capacity in a single term. The following relationship, Qcell = 1/(1/Qcathode + 1/Qanode + 1/Qw), defines the overall cell capacity, where Qcell, Qcathode, and Qanode correspond to the specific charge capacities of the cell, the cathode, and the anode compartments, respectively. The term Qw corresponds to the time integrated current of any processes, e.g., the capacitive (double layer) or faradaic (degradation processes, charge insertion). In an ideal case, the term Qw is negligible when compared to the electrode capacities and it is constant throughout the cell operation lifetime. While the specific charging capacity of the cathode is currently a limiting factor of the overall cell (Qcell), it is desirable to enhance the anode performance for future development. Based on the above relationship and using standard values for the cathode and cell compartments, the anode specific capacity has the potential to reach about 1000–1500 mAh g−1 [11]. Based on this, it is imperative to minimize the background currents that are unrelated to the material under investigation, i.e., the term Qw of the above relationship, which is not negligible for most frequently used cell casing materials. For example, Myung et al. revealed the presence of small residual currents using standard carbonate based electrolyte and stainless steel type St-304, which resulted in the continuous formation and accumulation of electrolyte degradation products [35]. These parasitic currents are unrelated to the material under investigation though they contribute to the overall cell electrical signal. Therefore, the resultant signal is composed of several components leading to poorly structured problems. Moreover, due to the high reactivity and small atomic size of Li, the selection of an electrochemically inert material remains challenging [14,36,37].
Transition metal nitrides, e.g., TiN and TaN, have been successfully used as diffusion barriers for Si and Li in integrated microbatteries, where the encapsulation of the active material is essential [28,38,39]. The blocking efficiency of TaN and TiN deposited as thin films by magnetron sputtering and atomic layer deposition (ALD) techniques was investigated, and TiN was revealed to have a superior efficiency over TaN, as well as a very low reversible capacity and featureless cyclic voltammograms (CV) [38,40]. Freixas et al. have systematically investigated the electrochemical properties of sputtered TiN deposited at different temperatures [41]. At optimized conditions, the thin film resistivity was close to 105 μΩ cm, with a normalized surface capacity at low charging rates of 0.16 µAh cm−2 μm−1, where the value was further reduced at faster charging rates (0.07 µAh cm−2 at 3.2 mA cm−2). Additionally, the reported cyclic voltammetry of TiN did not show any redox peaks, but had a rather rectangular form with a double layer capacitance found in the range of 40–400 mF cm−2. Based on these investigations, TiN fulfilled the requirements of a current collector for LIBs.
However, TiN deposited by sputtering or via ALD is prone to delamination and requires tedious process optimization. Furthermore, homogeneous deposition on complex three dimensional architectures or porous conductive substrates is challenging. As an alternative, TiN surface can be obtained through the thermal treatment of Ti in a nitrogen rich atmosphere [42,43,44,45]. This nitriding process allows the treatment of a large number of samples in a single batch, including complex geometries and porous materials, owing to the excellent infiltration capabilities of gas. Additionally, the TiN produced via nitrogen infiltration, as an element diffusion blocking layer, is homogeneous and will not lead to delamination. To the best of the authors’ knowledge, the nitriding process was used for the first time in this study, to produce battery elements with low reversible capacities.
The present work aimed to quantify the reversible capacities of the materials that are frequently encountered in electrochemical cells. The second objective was to minimize the cell background capacity by the formation of a TiN surface via nitridation of Ti-based electrode terminals in an ammonia atmosphere. The influence of electrolytes and the surface roughness of the electrical terminals were also investigated.
The reversible capacity and differential capacity metrics of Ti-based materials were compared to the selected standard materials (i.e., stainless steel (St-304 and St-316L), Cu, Fe/Ni alloy and coin cell case), which are exploited as representative experimental benchmarks. As a next step, the data were extended and compared to nitridated Ti-based electrical terminals.

2. Materials and Methods

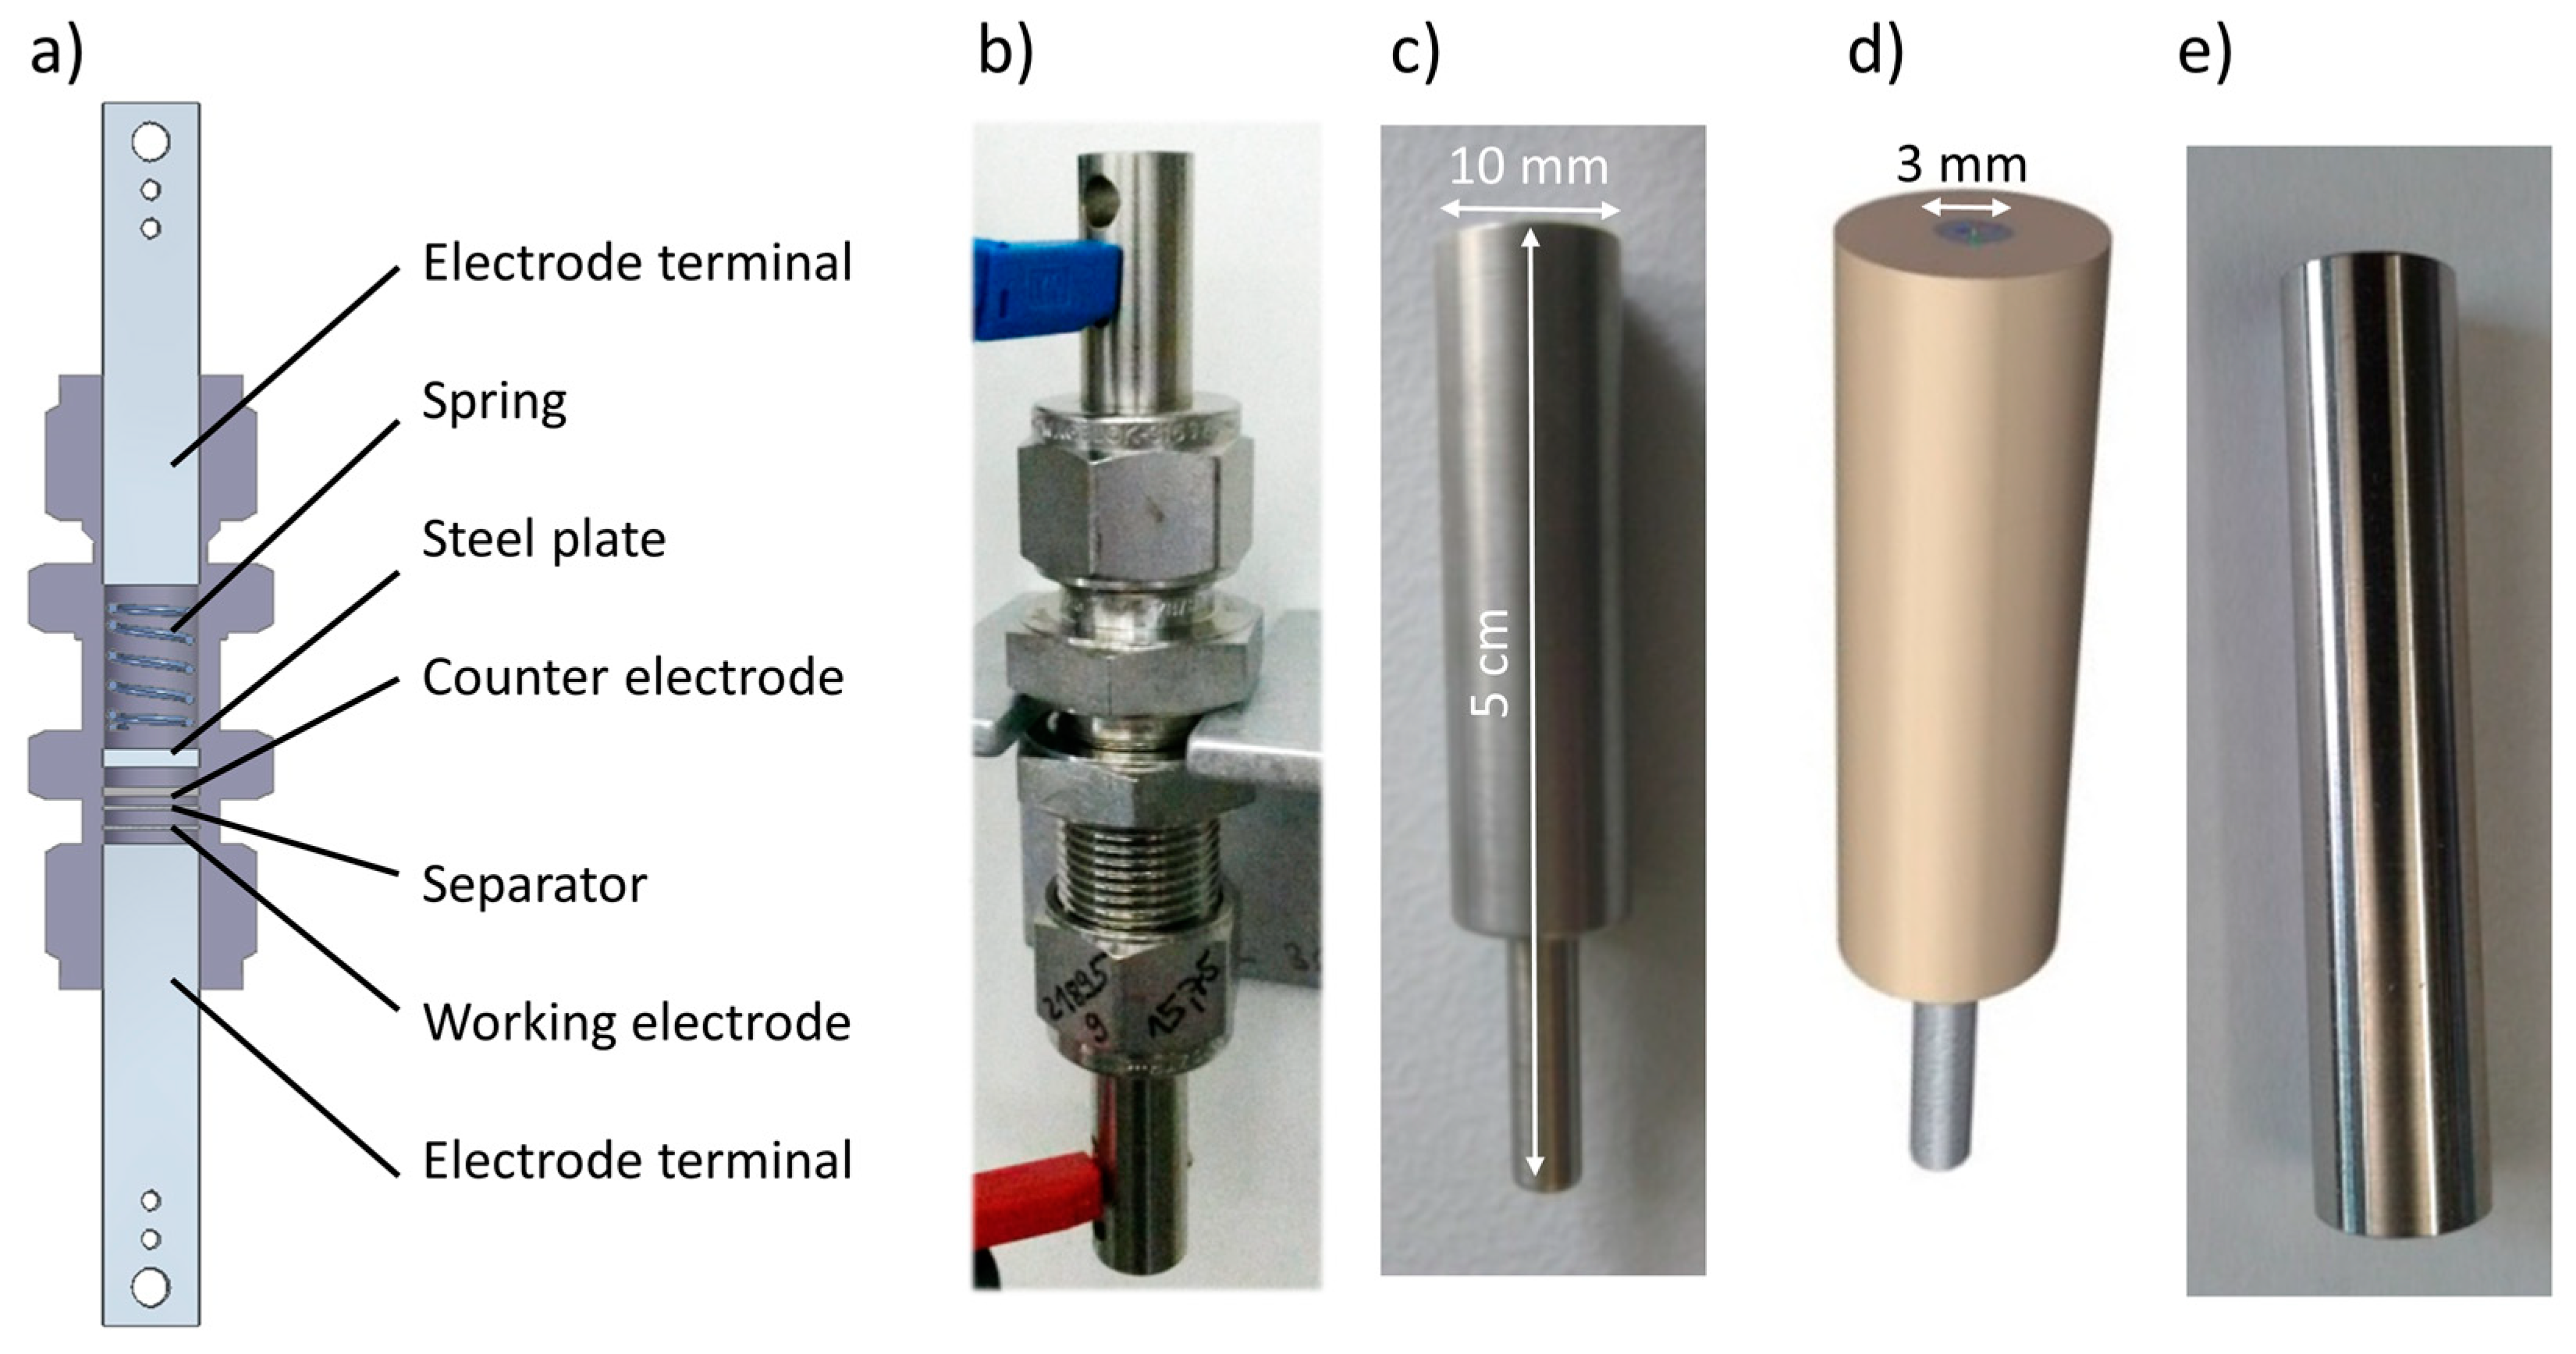
2.1. Electrochemical Cells

A 10 mm diameter stainless steel Swagelok tube fitting, with an inner surface that was electrically insulated by a 75 µm thick Kapton foil, was used for the electrochemical investigations as presented in Figure 1a,b. The working electrode terminals were machined using several materials and tested against Li (Li foil 99.9% trace metals basis, 0.6 mm thick, Sigma-Aldrich, St. Louis, MO, USA). Two polypropylene separators (25 µm, C2500, Celgard Inc., Charlotte, NC, USA) were used to avoid electrical short circuits. The working electrolyte was 140 μL 1 M LiPF6 in a 1:1 vol.% mixture of ethylene carbonate (EC) and diethyl carbonate (DEC), or in a 1:1:1 vol.% mixture of EC, DEC, and dimethyl carbonate (DMC) (BASF selectilyte LP 40/LP 71). A standard coin cell made of stainless steel St-304 with a 2032 geometry was acquired from MTI Corp. (Richmond, CA, USA), and also tested as a reference. The electrolytes were used as received with a certified water content of less than 20 ppm and were stored in an argon-filled glove box (O2 and H2O < 1 ppm).

2.2. Electrical Terminals

The electrical terminals were machined as 10 mm in diameter by 5 cm long rods using stainless steel type 304 (Figure 1c), type 316L, FeNi (60/40) alloy, oxygen-free Cu (Gemmel Metalle Berlin, GmbH), or Ti (grade 1, Ankuro) (Figure 1e). The material compositions are given in the supporting information (SI), Table S1. The cathode terminal and plate (Figure 1a) were made of nitrided Ti and St-304, respectively. Figure 1d shows an electrical terminal made of PEEK with a central core of a 3 mm St-304 shaft. The electrical terminal roughness’s were determined using a surface roughness tester (Mitutoyo, SJ-201P) after sample cleaning. The standard roughness parameters (Ra, Rq, Rz) as defined in DIN ISO 1302 were evaluated over a distance of about 5 mm on the disc section of the electrode in contact with the electrolyte.

2.3. Nitridation of Ti Electrode Terminals

Several Ti electrical terminals were machined as described in Section 2.2, and they were thoroughly cleaned and thermally treated in a hot wall oven for two hours at 700 °C, at an absolute pressure of 100 mbar with a 100/150 sccm (standard cubic centimeter per minute) flow of ammonia/argon (NH3 99.99%, Ar, 99.99%, Air liquid). The nitrided Ti terminals were cooled to RT (ca 21 °C) via thermal inertia (for about 10 hours), under a constant flow of 150 sccm Ar.

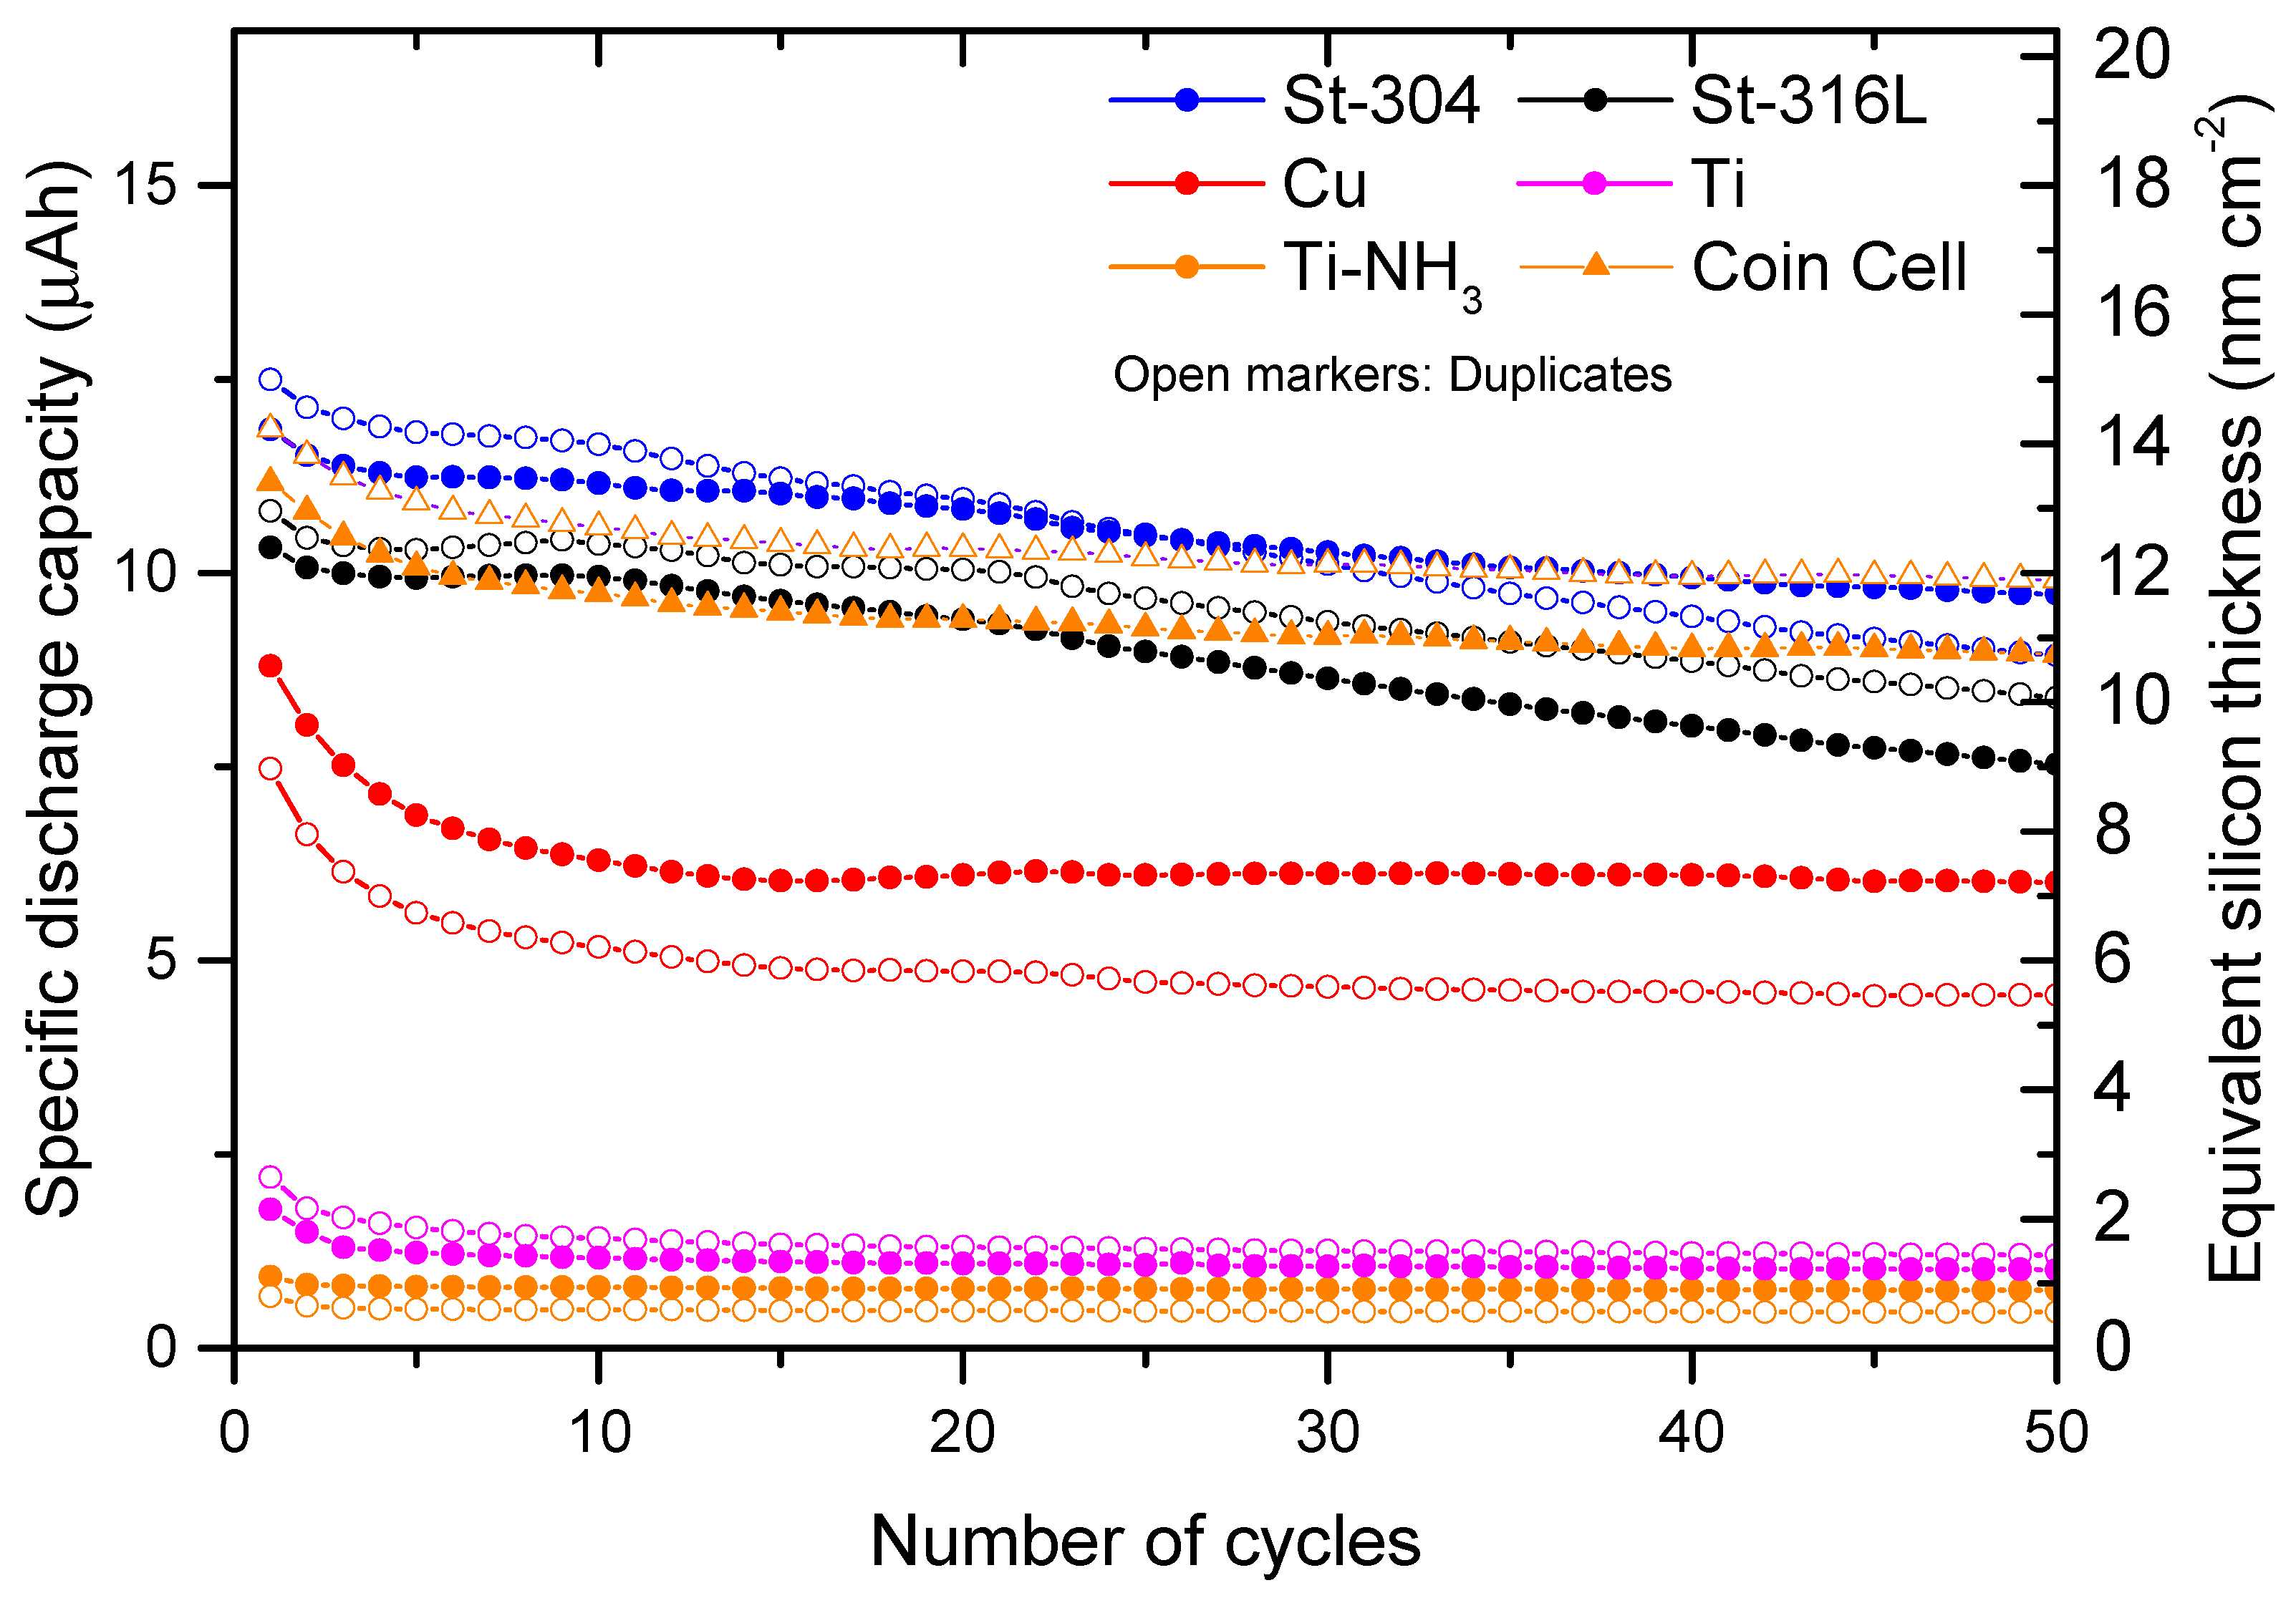
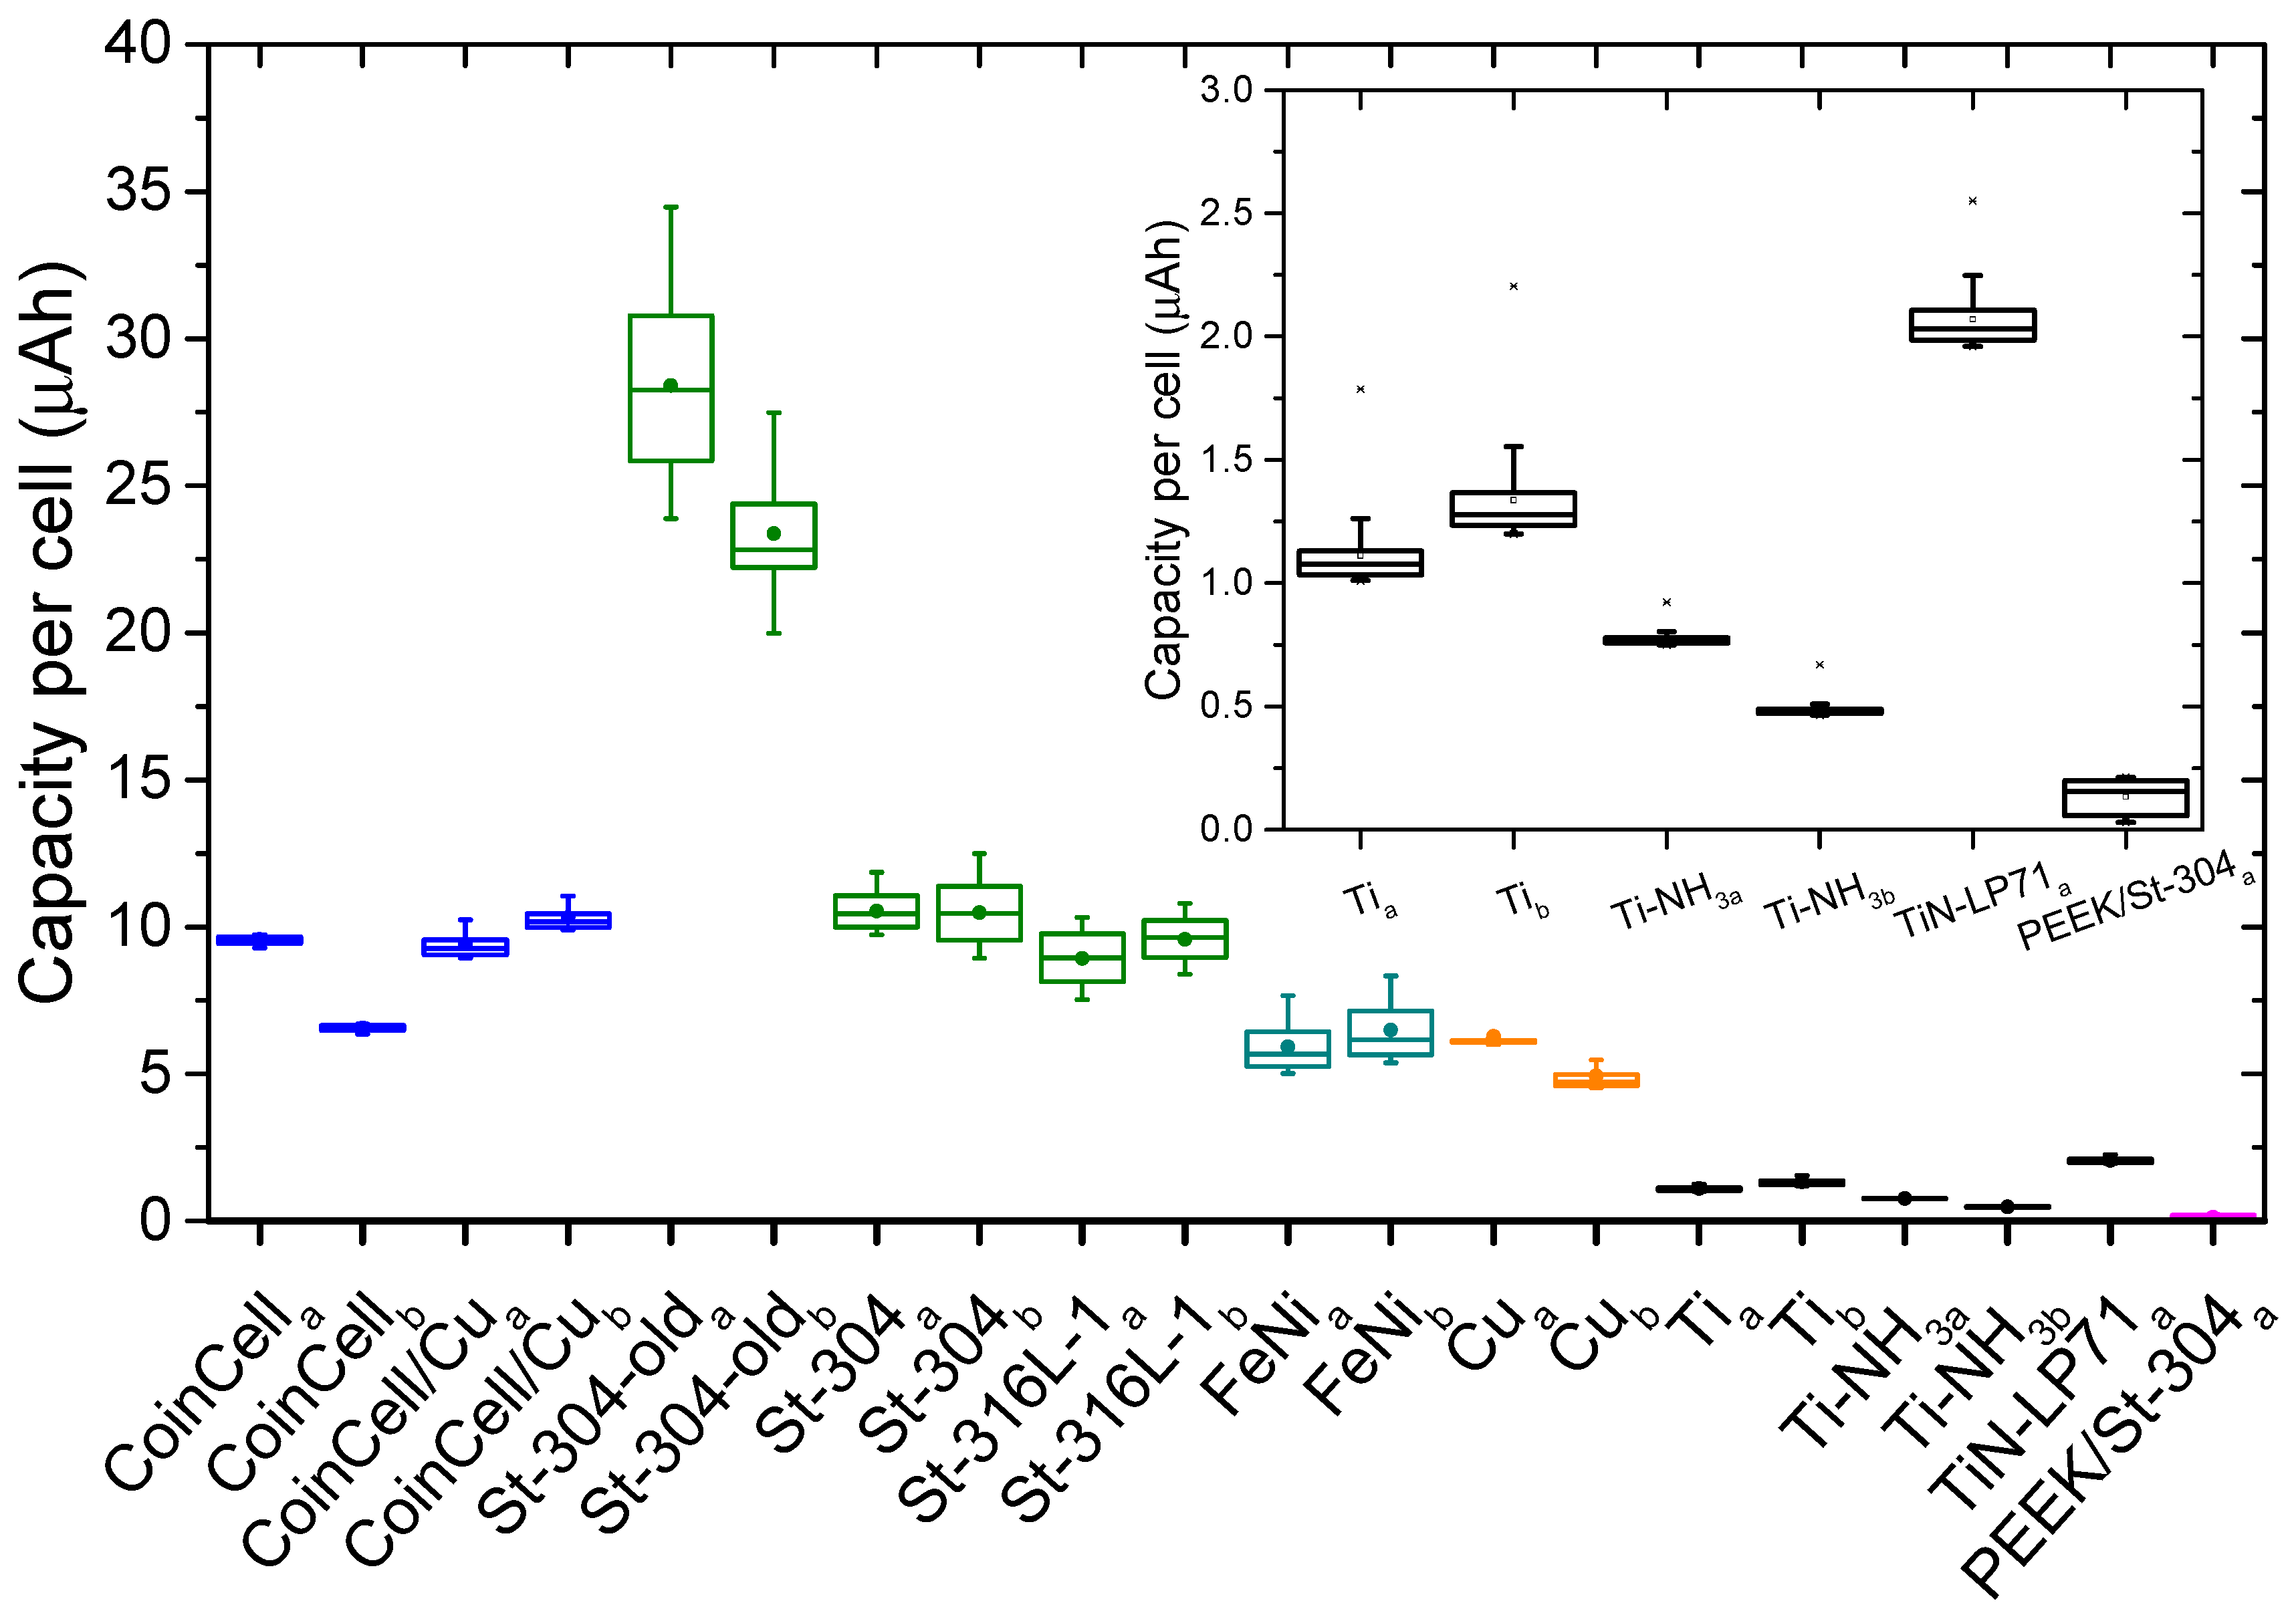
2.4. Determination of Reversible Capacities

Galvanostatic cycling with potential limitation (GCPL) was conducted using an Arbin Instruments BT2000 battery tester to quantify the capacities of the electrode terminals. The cycling protocol included a 6-hour open circuit potential followed by 50 charge/discharge cycles using a constant current of 72 µA (equivalent to 92 µA cm−2), followed by a one-hour constant voltage step within a potential range of 5 mV to 2 V vs. Li/Li+ at RT.

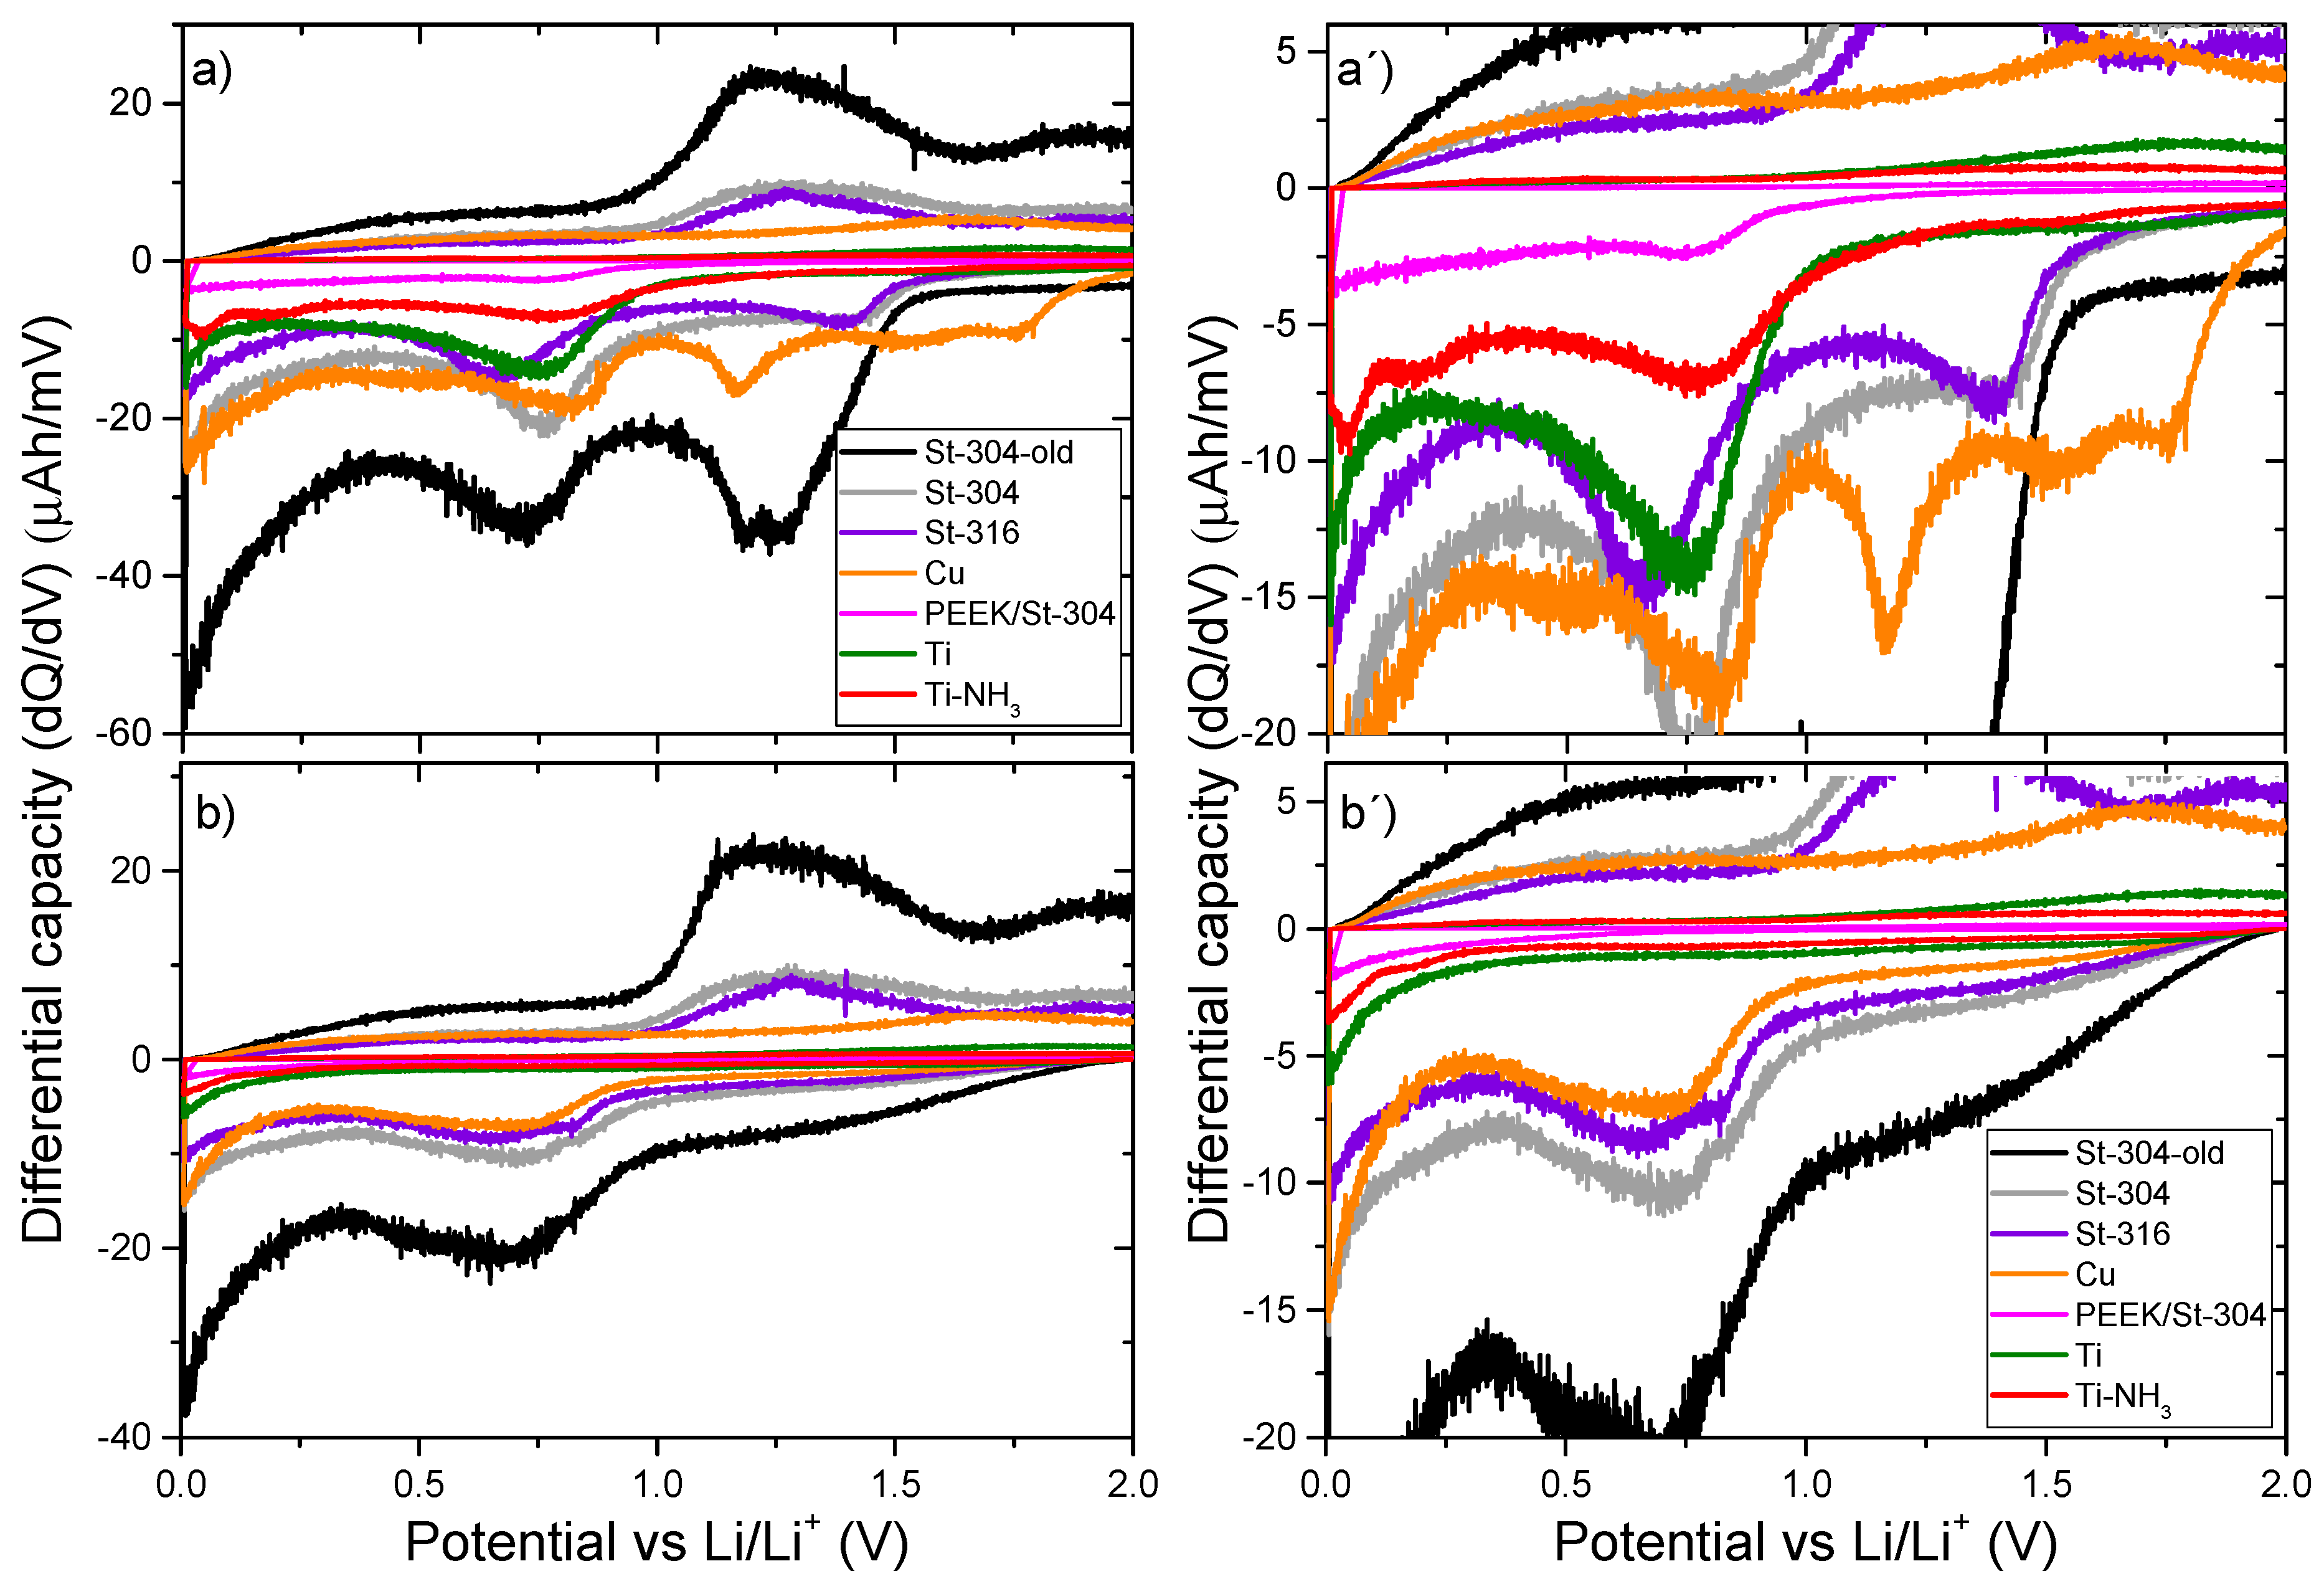
2.5. Differential Capacity Characterization (dQ/dV)

The differential capacity of the cells was acquired using the galvanostatic cycling mode of a Biologic MPG-2 battery cycler at a constant current of 92 µA cm−2. The EC-lab software (V10.44, Bio-Logic) was used to export the differential capacity representation (dQ/dV).

3. Results and Discussions

Figure 2 reports the reversible capacities over 50 galvanostatic cycles performed between 2 V and 5 mV vs. Li/Li+, where the anode electrical terminals were machined using several frequently used materials, namely, stainless steel type 304, 316L, Cu, and Ti. Table S1 in SI provides the detailed compositions of the materials, and Figure S1 reports the charge/discharge capacity and Coulombic efficiency over cycle numbers. For a better comparison, the electrical terminals were machined using identical machining parameters, and the capacities reported corresponded to the time-integrated current without areal normalization to provide a fair comparison between the cells. To strengthen the data robustness, two electrical terminals were produced and electrochemically evaluated using different sets of Swagelok-tube fitting and components, e.g., spring, steel plate, and cathode electrical terminal (c.f. Figure 1a). These duplicates are reported in Figure 2 using open markers and are provided in Tables S2 and S3.
Swagelok-type cells composed of stainless steel (St-304 and St-316L) electrical terminals had similar initial discharge capacities of 12.17 ± 0.45 and 10.56 ± 0.33 µAh, respectively. This decreased to 9.34 ± 0.54 and 7.96 ± 0.61 µAh after 50 cycles, corresponding to a relative decrease of about 23% (2.83/12.17) and 25% (2.6/10.56) for the electrode terminals made of St-304 and St-316L, respectively. Whilst discrepancies were observable, the duplicates were sufficiently comparable with each other. The electrochemical cells comprised of Cu electrical terminals had an initial discharge capacity of about 8.14 ± 0.94 µAh, which was lower than stainless steel, for about 4 µAh. The discharge capacity of Cu showed a notable decrease in capacity within the first ten cycles, which was not observed with stainless steel electrical terminals. The Cu then exhibited a very stable discharge capacity over the remaining 40 cycles. The capacity decrease over 50 cycles was similar in absolute value to the results obtained using stainless steel terminals, and it corresponded to a relative decrease of ca. 35% (2.86/8.14). A lower discharge capacity was observed when Ti was used as the electrical terminal. The initial discharge capacity was equal to 1.99 ± 0.30 µAh, which decreased steadily over five cycles and reached 1.10 ± 0.30 µAh after 50 cycles. The absolute decrease in capacity over 50 cycles was significantly smaller than the previously obtained value of ca. 0.89 µAh. However, as the absolute values were close to unity, the increase of the relative contribution was significant at ca. 81% (0.89/1.10).
In comparison, the discharge capacity of the commercially available 2032 type coin cell (St-304) reached 11.51 ± 0.48 and 9.43 ± 0.67 µAh, respectively. These values were comparable to the results obtained with the stainless steel terminals of Swaglok cells. Assuming an areal factor of four (1/0.52) between a 10 mm Swaglok cell and a 20 mm coin cell, the normalized capacity of the coin cell was below that of the stainless steel and Cu electrical terminals, but above the Ti.
To put things into perspective, the values on the right-hand Y-axis of Figure 2 provide the equivalent Si thin film thicknesses, normalized per area, assuming a Si density of 2.33 g mL−1 and a theoretical specific capacity of 3579 mAh g−1 of Si, i.e., 0.833 µAh nm−1 cm−2. The electrical terminals made of stainless steels, Cu, and Ti provided an equivalent capacity at a Si thin film thickness of ca. 14.6 ± 0.54 (St-304), 12.68 ± 0.39 (St-316L), 9.77 ± 1.13 (Cu), and 2.39 ± 0.36 (Ti) nm per geometric cm−2. These absolute values obtained from empty cells could be better understood when compared to the capacity of the Si thin films under investigation. As an example, a 3% contribution of the empty cell capacity to the active material capacity can be found as experimentally acceptable. Based on this, the equivalent thickness of a Si thin film using stainless steel (St-304 and St-316L), Cu, and Ti electrode terminals should exceed 486 (1460/3), 422 (1268/3), 325 (977/3), and 80 (239/3) nm, respectively. These values represent the minimum Si thin film thickness in order to remain below the arbitrarily defined 3% threshold. Note that these values should be considered as extrema values in a Swaglok cell configuration, as the electrode terminal in contact with the electrolyte is the maximum.
Based on the work by Nulman et al. [46], Ti electrical terminals were thermally annealed, with the aim of improving the surface characteristic in a nitrogen-rich atmosphere at 700 °C to form, on the surface, numerous titanium nitride (TiNx) species. Ammonia (NH3) was used as a nitrogen precursor as it enables nitriding at lower temperatures than N2 and it favors nitrogen insertion through the native titanium oxide layer [47]. This surface treatment was reported to act as a very efficient blocking layer against element diffusion [48]. The formation of a nitrogen-rich surface, suggesting the presence of titanium nitride species, was visually confirmed by the notable gold color of the post-treated Ti material, denoted Ti-NH3. The obtained discharge capacity of the nitrided Ti electrical terminals was further reduced to 0.79 ± 0.19 and 0.60 ± 0.20 µAh, for the initial and the last (50th) cycle, respectively. These values corresponded to an absolute decrease in the discharge capacity of 0.43 µAh, at a relative decrease of 54% (0.43/0.79). The decrease in the discharge capacity was small and constant with a value of 8.6 nAh per cycle. These values were significantly lower than that of the stainless steel (St-304 and St-316L), Cu, and Ti terminals by a factor of 15.4 (12.17/0.79), 13.4 (10.56/0.79), 10.3 (8.14/0.79), and 2.5 (1.99/0.79), respectively. The equivalent Si thickness reached 0.95 ± 0.22 nm cm−2, enabling the evaluation of Si thin film thicknesses as low as 31 nm, based on a relative error of 3%.
Figure 3 reports as a standard box plot representation, the discharge capacities of all the measured electrode terminals, see SI for the individual cycling’s. The box plot statistics include all cycles, i.e., 50 data points and the duplicates are labeled with a subscript “b”. The upper and lower boundary of the box represents the 25th and 75th percentiles of the data. The horizontal line and the dot are the median and data mean, respectively. The interquartile range is given by the whiskers, represented as the lines extending above and below the boxes. Data outliers were denoted with a cross marker and were defined as 1.5 times the interquartile range.
The coin cell dataset (blue boxes) was comprised of two cells with, and two without, a Cu foil inserted between the anode terminal and the separator. The discharge capacities were sufficiently comparable between the four cells, indicating that the Cu foil did not contribute to cell capacity.
For the Swagelok-cell configuration, the discharge capacities of the cells made of stainless steel St-304 and St-316L (green boxes) were equivalent at ca. 10 µAh. However, this capacity had doubled, reaching about 25 µAh, when the electrode terminals that had been used for one year (St-304-old) were evaluated. These results indicated that during use the surface of the material became more prone to an increase of the background capacity. The roughness’s of the selected electrode terminals are provided in Table 1. The pristine materials had an average surface roughness (Ra) of about 0.21 μm, a peak to peak average roughness (Rz) of 1.44 μm, and a root mean square profile (Rq) of 0.26 μm. These values were consistent with the used standard machining method (DIN EN ISO 1302). The electrode terminal used over a one year period showed a significant increase in roughness with values of 1.36, 6.83, and 1.69 μm for the Ra, Rq, and Rz, respectively. These results explained well the increase in cell capacity previously reported, suggesting regular control of the electrode terminal.
The discharge capacities obtained from the electrode terminals made of FeNi-alloy and Cu were very similar, with a capacity of ca. 6 µAh. The results obtained using Ti-based cells, see Figure 3 inset for a magnification, reveal a notable improvement when compared to the previous samples with reversible capacity values obtained at about 1 µAh per cell. The nitrided Ti terminal shows a further improvement, reaching a discharge capacity as low as ca. 0.5 µAh. Moreover, the box size of Ti-NH3 was narrow indicating that the dispersion of the cell capacity was low, which is the desired behavior for an electrochemical cell. In order to evaluate the effect of an electrolyte, one electrode comprised of an electrical terminal made of nitridated Ti and using a LP 71 electrolyte revealed a capacity of about 2.0 µAh. Such results indicated that the cell capacity was dependent on several parameters and should be evaluated prior to data acquisition.
To further minimize the capacity, a hybrid terminal was designed. The terminal represented in Figure 1d is composed of a mantle made of PEEK, an electrochemically inert polymer, with a 3 mm stainless steel (St-304) core. The mechanical roughness of the stainless steel disc was very low with Ra, Rz, and Rq values equal to 0.13, 0.93, and 0.18 μm, c.f., Table 1, respectively. The capacity of the PEEK/St-304 terminal decreased to an initial value of 0.17 µAh and 0.03 µAh after 50 cycles, corresponding to a reduction factor of ca. 72 (12.17/0.17), 62 (10.56/0.17), 48 (8.14/0.17), 12 (1.99/0.17), 4.6 (0.79/0.17), for stainless steel (St-304, St-316L), Cu, Ti, and nitridated Ti, respectively. Such a significant decrease cannot be solely caused by the reduction of the geometrical area, suggesting that the surface roughness of the material was a factor contributing significantly to the cell’s background capacity. Based on this, a disposal cell casing would be beneficial for overall data quality.
As a complement to the cell capacity metrics, we reported the differential capacity plots (dQ/dV) of these materials (see detailed traces of the differential capacity plots of the cells in Table S4). Figure 4 shows the first (Figure 4a) and second (Figure 4b) dQ/dV plots of the selected electrical terminals. Owing to the electrolyte degradation, the dQ/dV plot of the first cycle (Figure 4a) was significantly richer in features in comparison to the second cycle (Figure 4b) [49]. The observed results were consistent with the electrochemical investigation of carbonate electrolyte decomposition [36,37,50]. As the main results, the St-304-old terminal revealed the strongest signal amongst the entire data set with several features. These features were reduced in the electrode terminals made of St-304 and St-316. For the Ti-based samples, a significantly smaller signal was observed without prominent features, which depicted a capacitive behavior, suggesting a negligible reactivity of TiN with Li in the working potential range. The results reported here for nitridated Ti were similar to the literature data using sputtered TiN [41]. This very low current and the featureless differential capacity plots are desirable for practical applications. Detailed dQ/dV plots are given in Figure S2.

4. Conclusions

In the present work, several materials were used to machine electrode terminals of Swaglock-type cells with the aim of quantifying their reversible and differential capacity metrics. The results showed significant discrepancies between the materials. The stainless steel terminals were revealed to have a significant reversible capacity, as well as several prominent features in the dQ/dV plots. The Ti-based materials revealed significantly lower reversible capacities and less featured dQ/dV plots when compared to stainless steel and Cu. The surface nitridation of Ti electrical terminals was revealed to be well suited for the batch treatment of samples with complex geometries, and it was also experimentally simple. The nitridated Ti terminals exhibited a further decrease in the electrochemical profile, when compared to blank Ti, as well as a featureless differential capacity plot.
The results demonstrated a superior electrochemical performance of nitridated Ti over alternative materials, and the applicability of the nitridating process in improving customized electrochemical cells. This is promising for the surface treatment of porous current collectors.

Supplementary Materials

The following are available online at https://www.mdpi.com/2313-0105/5/1/17/s1, Table S1: Detailed composition of the raw materials used to machine the electrode terminals, Table S2: Detailed list of electrochemical cells and materials, Table S3: Initial and final specific discharge capacity of selected electrode terminals, Figure S1: Detailed traces of the electrochemical cycling of cells given in Table S2 with their charge, discharge capacity, and Coulombic efficiency. The cell reference number is given in brackets and relates to the uploaded raw data files. Table S4: Detailed list of electrochemical cells used to evaluate the differential capacity of several materials and provides the raw data filename. Swagelok cell composition: Li foil, LP40 electrolyte, cycling between 5 mV to 2 V vs. Li/Li+ using a constant current of 92 µA cm−2 for ten cycles. Figure S2: Detailed traces of the differential capacity plots of the cells given in Table S4.

Author Contributions

Data curation, D.K.; Funding acquisition, R.S.; Project administration, S.C.; Writing—original draft, D.K.; Writing—review & editing, Y.X. and S.C.

Funding

This research received no external funding.

Acknowledgments

We thank Martin Pradel for the preparative and data analysis work, as well as Petrik Bishoff´s team for the mechanical work and roughness analysis. Our industrial partner which financially supported part of the present work is also acknowledged.

Conflicts of Interest

The authors declare no conflict of interest.

References

  1. Tarascon, J.M.; Armand, M. Issues and challenges facing rechargeable lithium batteries. Nature 2001, 414, 359–367. [Google Scholar] [CrossRef] [PubMed]
  2. Nitta, N.; Wu, F.; Lee, J.T.; Yushin, G. Li-ion battery materials: Present and future. Mater. Today 2015, 18, 252–264. [Google Scholar] [CrossRef]
  3. Lin, D.; Liu, Y.; Cui, Y. Reviving the lithium metal anode for high-energy batteries. Nat. Nanotechnol. 2017, 12, 194–206. [Google Scholar] [CrossRef]
  4. Xu, W.; Wang, J.; Ding, F.; Chen, X.; Nasybulin, E.; Zhang, Y.; Zhang, J.-G. Lithium metal anodes for rechargeable batteries. Energy Environ. Sci. 2014, 7, 513–537. [Google Scholar] [CrossRef]
  5. Erickson, E.M.; Markevich, E.; Salitra, G.; Sharon, D.; Hirshberg, D.; de la Llave, E.; Shterenberg, I.; Rozenman, A.; Frimer, A.; Aurbach, D. Review—Development of advanced rechargeable batteries: a continuous challenge in the choice of suitable electrolyte solutions. J. Electrochem. Soc. 2015, 162, A2424–A2438. [Google Scholar] [CrossRef]
  6. Kohanoff, J.; Galli, G.; Parrinello, M. Theoretical study of LiC6. J. Phys. IV 1991, 1, C5-351–C5-356. [Google Scholar] [CrossRef]
  7. Tozawa, T.N.K. Lithium ion rechargeable battery. Prog. Batter. Solar. Cells 1990, 9, 209. [Google Scholar]
  8. Su, D.S.; Schlögl, R. Nanostructured carbon and carbon nanocomposites for electrochemical energy storage applications. ChemSusChem 2010, 3, 136–168. [Google Scholar] [CrossRef] [PubMed]
  9. Su, X.; Dogan, F.; Ilavsky, J.; Maroni, V.A.; Gosztola, D.J.; Lu, W. Mechanisms for lithium nucleation and dendrite growth in selected carbon allotropes. Chem. Mater. 2017, 29, 6205–6213. [Google Scholar] [CrossRef]
  10. Lu, W.; López, C.M.; Liu, N.; Vaughey, J.T.; Jansen, A.; Dees, D.W. Overcharge effect on morphology and structure of carbon electrodes for lithium-ion batteries. J. Electrochem. Soc. 2012, 159, A566. [Google Scholar] [CrossRef]
  11. Kasavajjula, U.; Wang, C.; Appleby, A.J. Nano- and bulk-silicon-based insertion anodes for lithium-ion secondary cells. J. Power Sources 2007, 163, 1003–1039. [Google Scholar] [CrossRef]
  12. Zuo, X.; Zhu, J.; Müller-Buschbaum, P.; Cheng, Y.-J. Silicon based lithium-ion battery anodes: A chronicle perspective review. Nano Energy 2017, 31, 113–143. [Google Scholar] [CrossRef] [Green Version]
  13. Aravindan, V.; Lee, Y.S.; Madhavi, S. Research progress on negative electrodes for practical Li-ion batteries: beyond carbonaceous anodes. Adv. Energy Mater. 2015, 5. [Google Scholar] [CrossRef]
  14. Obrovac, M.N.; Chevrier, V.L. Alloy negative electrodes for li-ion batteries. Chem. Rev. 2014, 114, 11444–11502. [Google Scholar] [CrossRef] [PubMed]
  15. Yin, Y.X.; Wan, L.J.; Guo, Y.G. Silicon-based nanomaterials for lithium-ion batteries. Chin. Sci. Bull. 2012, 57, 4104–4110. [Google Scholar] [CrossRef] [Green Version]
  16. Hatchard, T.D.; Dahn, J.R. In situ XRD and electrochemical study of the reaction of lithium with amorphous silicon. J. Electrochem. Soc. 2004, 151, A838–A842. [Google Scholar] [CrossRef]
  17. Obrovac, M.N.; Christensen, L. Structural changes in silicon anodes during lithium insertion/extraction. Electrochem. Solid-State Lett. 2004, 7, A93. [Google Scholar] [CrossRef]
  18. Obrovac, M.N.; Christensen, L.; Le, D.B.; Dahn, J.R. Alloy design for lithium-ion battery anodes. J. Electrochem. Soc. 2007, 154, A849. [Google Scholar] [CrossRef]
  19. Ma, D.; Cao, Z.; Hu, A. Si-based anode materials for li-ion batteries: A. mini review. Nano-Micro Lett. 2014, 6, 347–358. [Google Scholar] [CrossRef]
  20. Hu, Y.S.; Demir-Cakan, R.; Titirici, M.M.; Müller, J.O.; Schlögl, R.; Antonietti, M.; Maier, J. Superior storage performance of a Si@SiOx/C nanocomposite as anode material for lithium-ion batteries. Angew. Chemie. 2008, 47, 1645–1649. [Google Scholar] [CrossRef]
  21. Abraham, K.M. Prospects and limits of energy storage in batteries. J. Phys. Chem. Lett. 2015, 6, 830–844. [Google Scholar] [CrossRef] [PubMed]
  22. Zhang, Y.; Fu, Z.W.; Qin, Q.Z. Microstructure and Li alloy formation of nano-structured amorphous Si and Si/TiN composite thin film electrodes. Electrochem. Commun. 2004, 6, 484–491. [Google Scholar] [CrossRef]
  23. Bourderau, S.; Brousse, T.; Schleich, D. Amorphous silicon as a possible anode material for Li-ion batteries. J. Power Sources 1999, 81–82, 233–236. [Google Scholar] [CrossRef]
  24. Demirkan, M.T.; Trahey, L.; Karabacak, T. Low-density silicon thin films for lithium-ion battery anodes. Thin Solid Films 2016, 600, 126–130. [Google Scholar] [CrossRef]
  25. Ohara, S.; Suzuki, J.; Sekine, K.; Takamura, T. A thin film silicon anode for Li-ion batteries having a very large specific capacity and long cycle life. J. Power Sources 2004, 136, 303–306. [Google Scholar] [CrossRef]
  26. Mukanova, A.; Jetybayeva, A.; Myung, S.T.; Kim, S.S.; Bakenov, Z. A mini-review on the development of Si-based thin film anodes for Li-ion batteries. Mater. Today Energy 2018, 9, 49–66. [Google Scholar] [CrossRef]
  27. Notten, P.H.L.; Roozeboom, F.; Niessen, R.A.H.; Baggetto, L. 3-D integrated all-solid-state rechargeable batteries. Adv. Mater. 2007, 19, 4564–4567. [Google Scholar] [CrossRef]
  28. Baggetto, L.; Niessen, R.A.H.; Roozehoom, F.; Notten, P.H.L. High energy density all-solid-state batteries: A challenging concept towards 3D integration. Adv. Funct. Mater. 2008, 18, 1057–1066. [Google Scholar] [CrossRef]
  29. Reyes Jiménez, A.; Klöpsch, R.; Wagner, R.; Rodehorst, U.C.; Kolek, M.; Nölle, R.; Winter, M.; Placke, T. A Step toward high-energy silicon-based thin film lithium ion batteries. ACS Nano 2017, 11, 4731–4744. [Google Scholar] [CrossRef]
  30. Kermani, G.; Sahraei, E. Review: Characterization and modeling of the mechanical properties of lithium-ion batteries. Energies 2017, 10, 1730. [Google Scholar] [CrossRef]
  31. Behrou, R.; Maute, K. Numerical modeling of damage evolution phenomenon in solid-state lithium-ion batteries. J. Electrochem. Soc. 2017, 164, A2573–A2589. [Google Scholar] [CrossRef]
  32. Behrou, R.; Maute, K. Multiscale modeling of non-local damage evolution in lithium-ion batteries. ECS Trans. 2017, 77, 1163–1177. [Google Scholar] [CrossRef]
  33. Franco, A. A multiscale modelling and numerical simulation of rechargeable lithium ion batteries: concepts, methods and challenges. Rsc Adv. 2013, 3, 13027–13058. [Google Scholar] [CrossRef]
  34. Zhang, Q.; Cui, Y.; Wang, E. First-principles approaches to simulate lithiation in silicon electrodes. Model. Simul. Mater. Sci. Eng. 2013, 21, 074001. [Google Scholar] [CrossRef] [Green Version]
  35. Myung, S.T.; Sasaki, Y.; Saito, T.; Sun, Y.K.; Yashiro, H. Passivation behavior of Type 304 stainless steel in a non-aqueous alkyl carbonate solution containing LiPF6 salt. Electrochim. Acta 2009, 54, 5804–5812. [Google Scholar] [CrossRef] [Green Version]
  36. Myung, S.T.; Sasaki, Y.; Sakurada, S.; Sun, Y.K.; Yashiro, H. Electrochemical behavior of current collectors for lithium batteries in non-aqueous alkyl carbonate solution and surface analysis by ToF-SIMS. Electrochim. Acta 2009, 55, 288–297. [Google Scholar] [CrossRef]
  37. Myung, S.-T.; Hitoshi, Y.; Sun, Y.-K. Electrochemical behavior and passivation of current collectors in lithium-ion batteries. J. Mater. Chem. 2011, 21, 9891. [Google Scholar] [CrossRef]
  38. Janski, R.; Forster, M.F.M.; Dunst, M.S.A. Lithium barrier materials for on-chip Si-based microbatteries. J. Mater. Sci. 2017, 28, 14605–14614. [Google Scholar] [CrossRef] [Green Version]
  39. Grigorov, K.G.; Grigorov, G.I.; Stoyanova, M.; Vignes, J.L.; Langeron, J.P.; Denjean, P.; Perriere, J. Diffusion of silicon in titanium nitride films. Efficiency of TiN barrier layers. Appl. Phys. A Solids Surfaces 1992, 55, 502–504. [Google Scholar] [CrossRef]
  40. Knoops, H.C.M.; Baggetto, L.; Langereis, E.; van de Sanden, M.C.M.; Klootwijk, J.H.; Roozeboom, F.; Niessen, R.A.H.; Notten, P.H.L.; Kessels, W.M.M. Deposition of TiN and TaN by remote plasma ALD for Cu and Li diffusion barrier applications. J. Electrochem. Soc. 2008, 155, G287. [Google Scholar] [CrossRef]
  41. Freixas, J.; Eustache, E.; Roussel, P.; Brillard, C.; Deresmes, D.; Nuns, N.; Rolland, N.; Brousse, T.; Lethien, C. Sputtered titanium nitride: A bifunctional material for li-Ion microbatteries. J. Electrochem. Soc. 2015, 162. [Google Scholar] [CrossRef]
  42. Pohrelyuk, I.; Fedirko, V. Chemico-thermal treatment of titanium alloys—Nitriding. In Titanium Alloys—Towards Achieving Enhanced Properties For Diversified Applications; IntechOpen: London, UK, 2012; pp. 141–174. [Google Scholar]
  43. Ajikumar, P.K.; Kamruddin, M.; Nithya, R.; Shankar, P.; Dash, S.; Tyagi, A.K.; Raj, B. Surface nitridation of Ti and Cr in ammonia atmosphere. Scr. Mater. 2004, 51, 361–366. [Google Scholar] [CrossRef]
  44. Ajikumar, P.K.; Kamruddin, M.; Shankar, P.; Gouda, R.; Balamurugan, A.K.; Nithya, R.; Tyagi, A.K.; Jayaram, V.; Biswas, S.K.; Raj, B. Internal nitride formation during gas-phase thermal nitridation of titanium. Scr. Mater. 2009, 61, 403–406. [Google Scholar] [CrossRef]
  45. Velasco-Velez, J.J.; Davaasuren, B.; Scherzer, M.; Cap, S.; Willinger, M.; Guo, J.H.; Schlögl, R.; Knop-Gericke, A. Exploring the incorporation of nitrogen in titanium and its influence on the electrochemical corrosion resistance in acidic media. Surf. Sci. 2016, 650, 272–278. [Google Scholar] [CrossRef] [Green Version]
  46. Nulman, J.; Alto, P.; Materials, A.; Clara, S. Gas in an Integrated Processing. U.S. Patent 5,236,868, 17 August 1993. [Google Scholar]
  47. Kurtz, S.R.; Gordon, R.G. Chemical vapor deposition of titanium nitride at low temperatures. Thin Solid Films 1986, 140, 277–290. [Google Scholar] [CrossRef]
  48. Rebenne, H.E.; Bhat, D.G. Review of CVD TiN coatings for wear-resistant applications: deposition processes, properties and performance. Surf. Coatings Technol. 1994, 63, 1–13. [Google Scholar] [CrossRef]
  49. Xu, K. Electrolytes and interphases in Li-ion batteries and beyond. Chem. Rev. 2014, 114, 11503–11618. [Google Scholar] [CrossRef]
  50. Zhang, X.; Kostecki, R.; Richardson, T.J.; Pugh, J.K.; Ross, P.N. Electrochemical and infrared studies of the reduction of organic carbonates. J. Electrochem. Soc. 2001, 148, A1341. [Google Scholar] [CrossRef]
Figure 1. (a) Schematic design and (b) picture of a 10 mm diameter bore-through Swagelok-type electrochemical cell and the associated electrical terminals made of (c) stainless steel (St-304), (d) PEEK-St304, and (e) Ti. (PEEK: Polyether ether ketone).
Batteries 05 00017 g001
Figure 2. Discharge capacities of the selected electrode terminals and commercially available coin cells (St-304). Duplicates are indicated by open circles (same color code). Cycling parameters: GCPL from 2 V to 5 mV vs. Li/Li+ in LP40 electrolyte for the Swagelok-cells and LP71 electrolyte for the coin cells, respectively. (Ti-NH3 denotes the nitridated titanium using NH3).
Batteries 05 00017 g002
Figure 3. Box plot presentation of the discharge capacities of several electrochemical cells. The inset is a magnification of the low capacity cells. The subscripts “a” and “b” denote the measurement duplicates.
Batteries 05 00017 g003
Figure 4. Differential capacity plots of the selected electrochemical Swagelok cells during the (a) first and (b) second cycle. Expanded scales of the low capacity region are given in a′ and b′.
Batteries 05 00017 g004
Table 1. Roughness of the selected electrical terminals, measured over a distance of about 5 mm.
Electrical TerminalRa (μm)Rz (μm)Rq (μm)
Pristine Cu0.20 ± 0.0441.37 ± 0.0440.26 ± 0.050
Pristine St-3040.26 ± 0.0881.77 ± 0.790.30 ± 0.11
Pristine TiN0.18 ± 0.0251.35 ± 0.260.24 ± 0.035
Pristine St-316L0.19 ± 0.0171.25 ± 0.100.24 ± 0.021
Pristine PEEK0.13 ± 0.040.93 ± 0.140.18 ± 0.052
St-304-old1.36 ± 0.746.83 ± 2.971.69 ± 0.83

