
Cell Performance Comparison between C14- and C15-Predomiated AB2 Metal Hydride Alloys

 ,
, 

Abstract
:1. Introduction
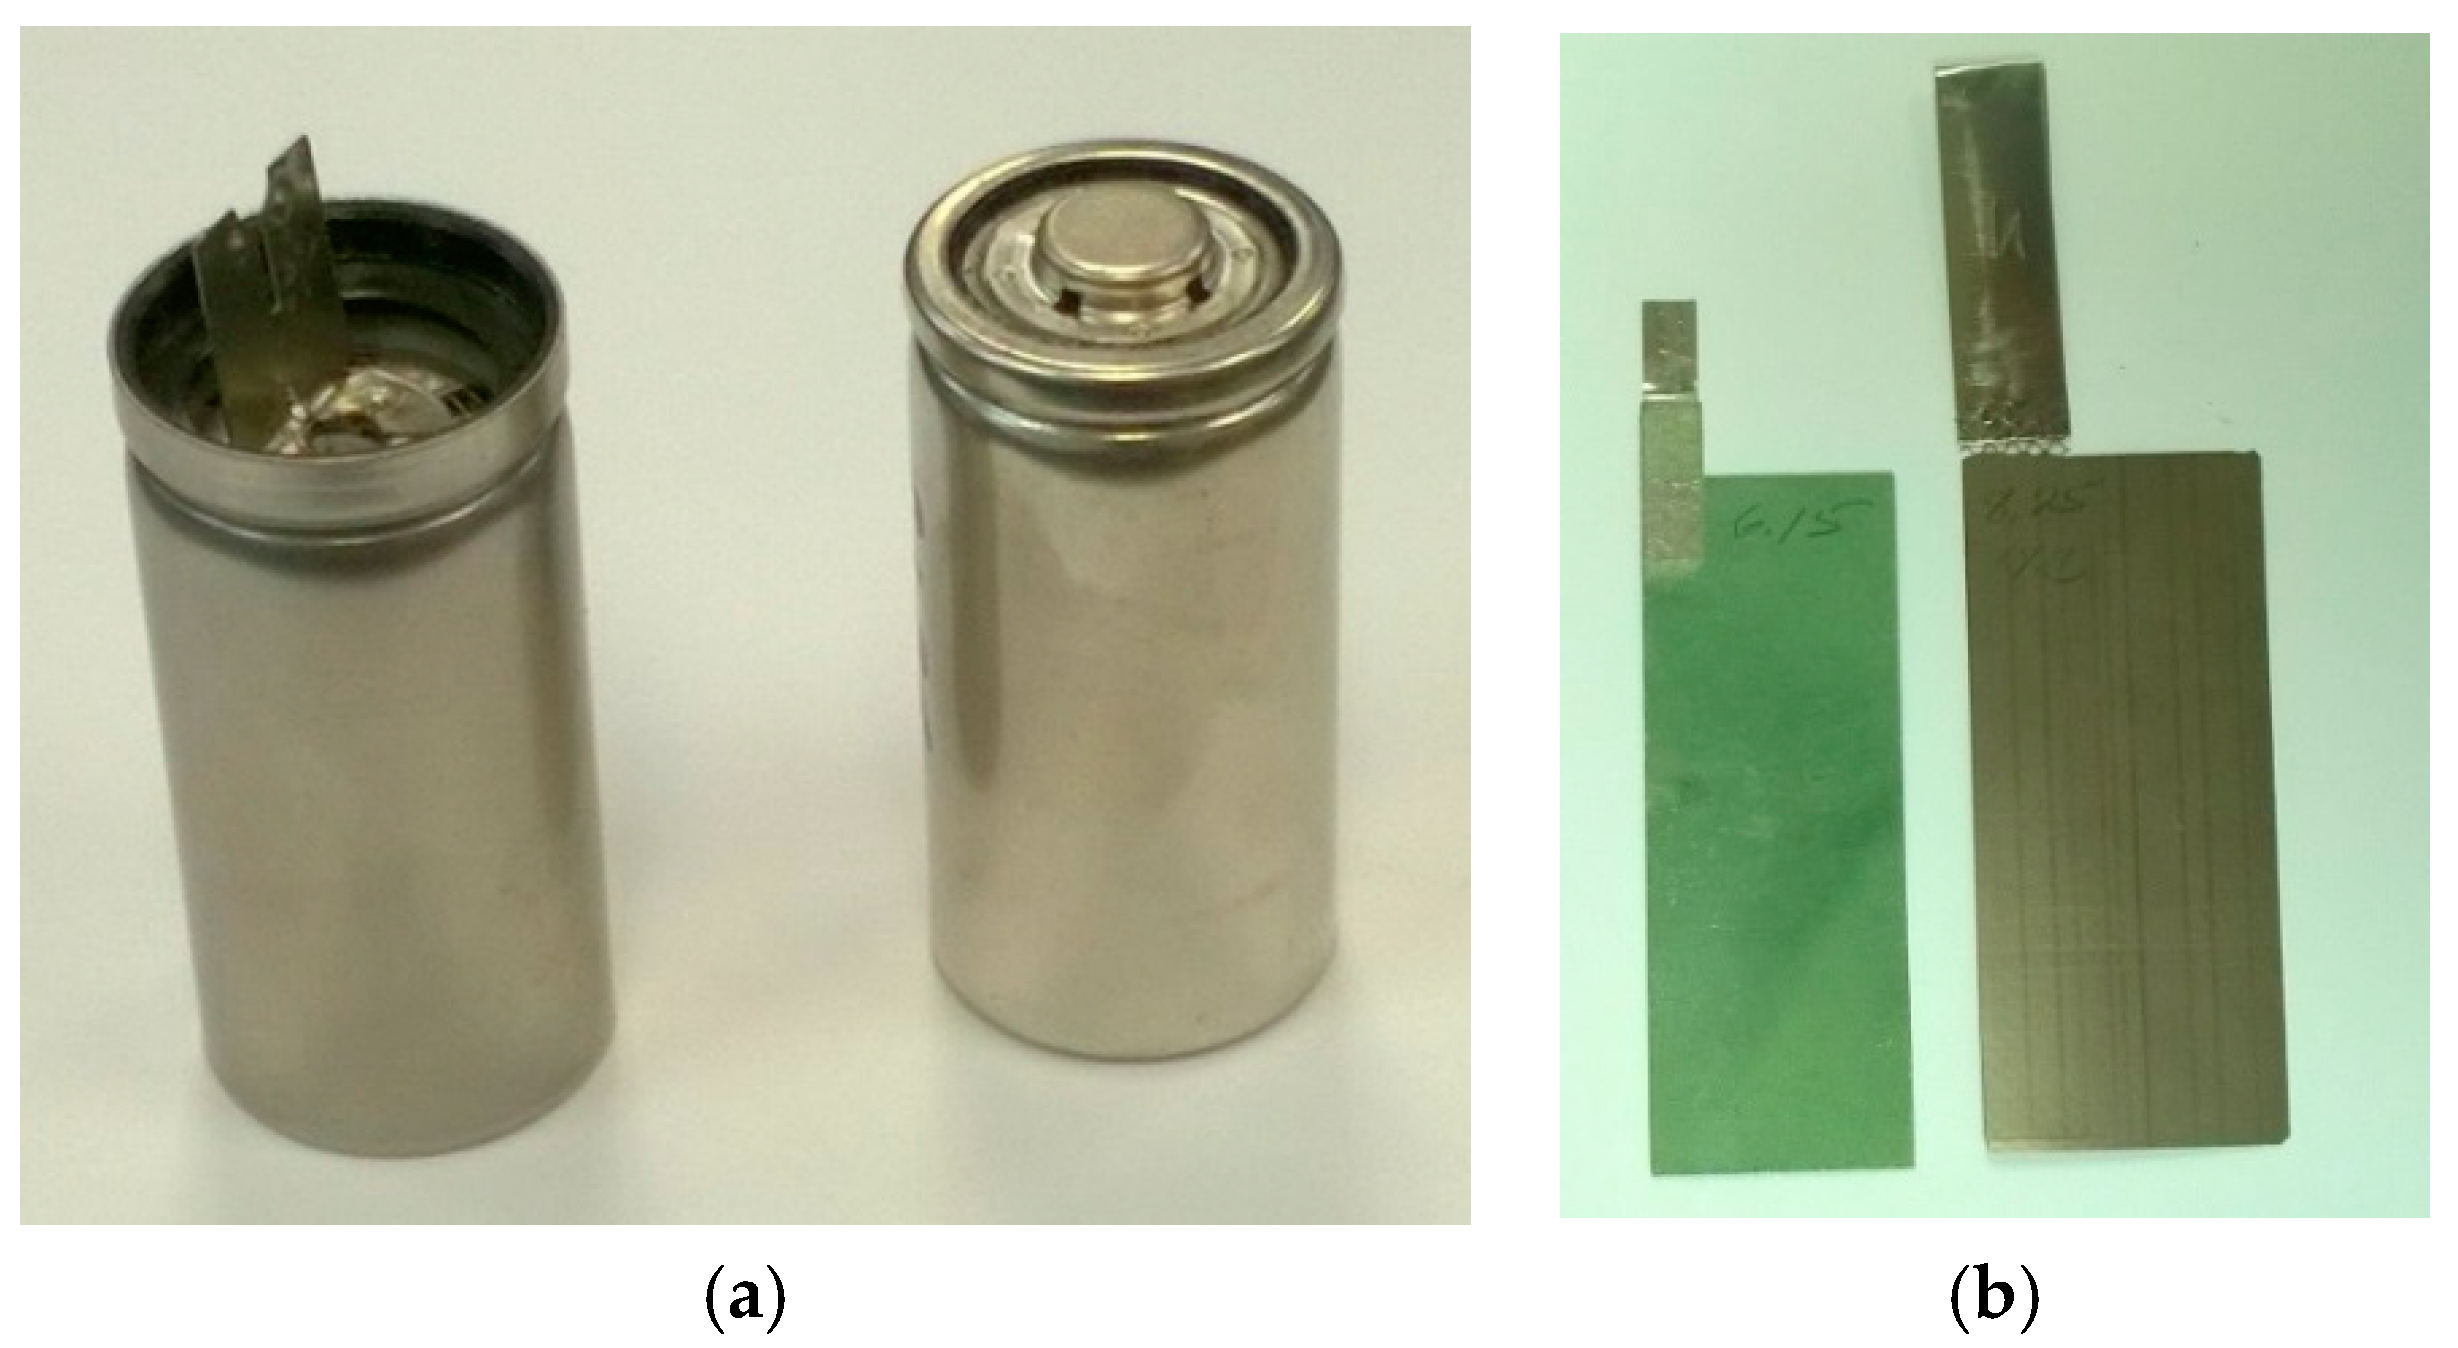
2. Experimental Setup
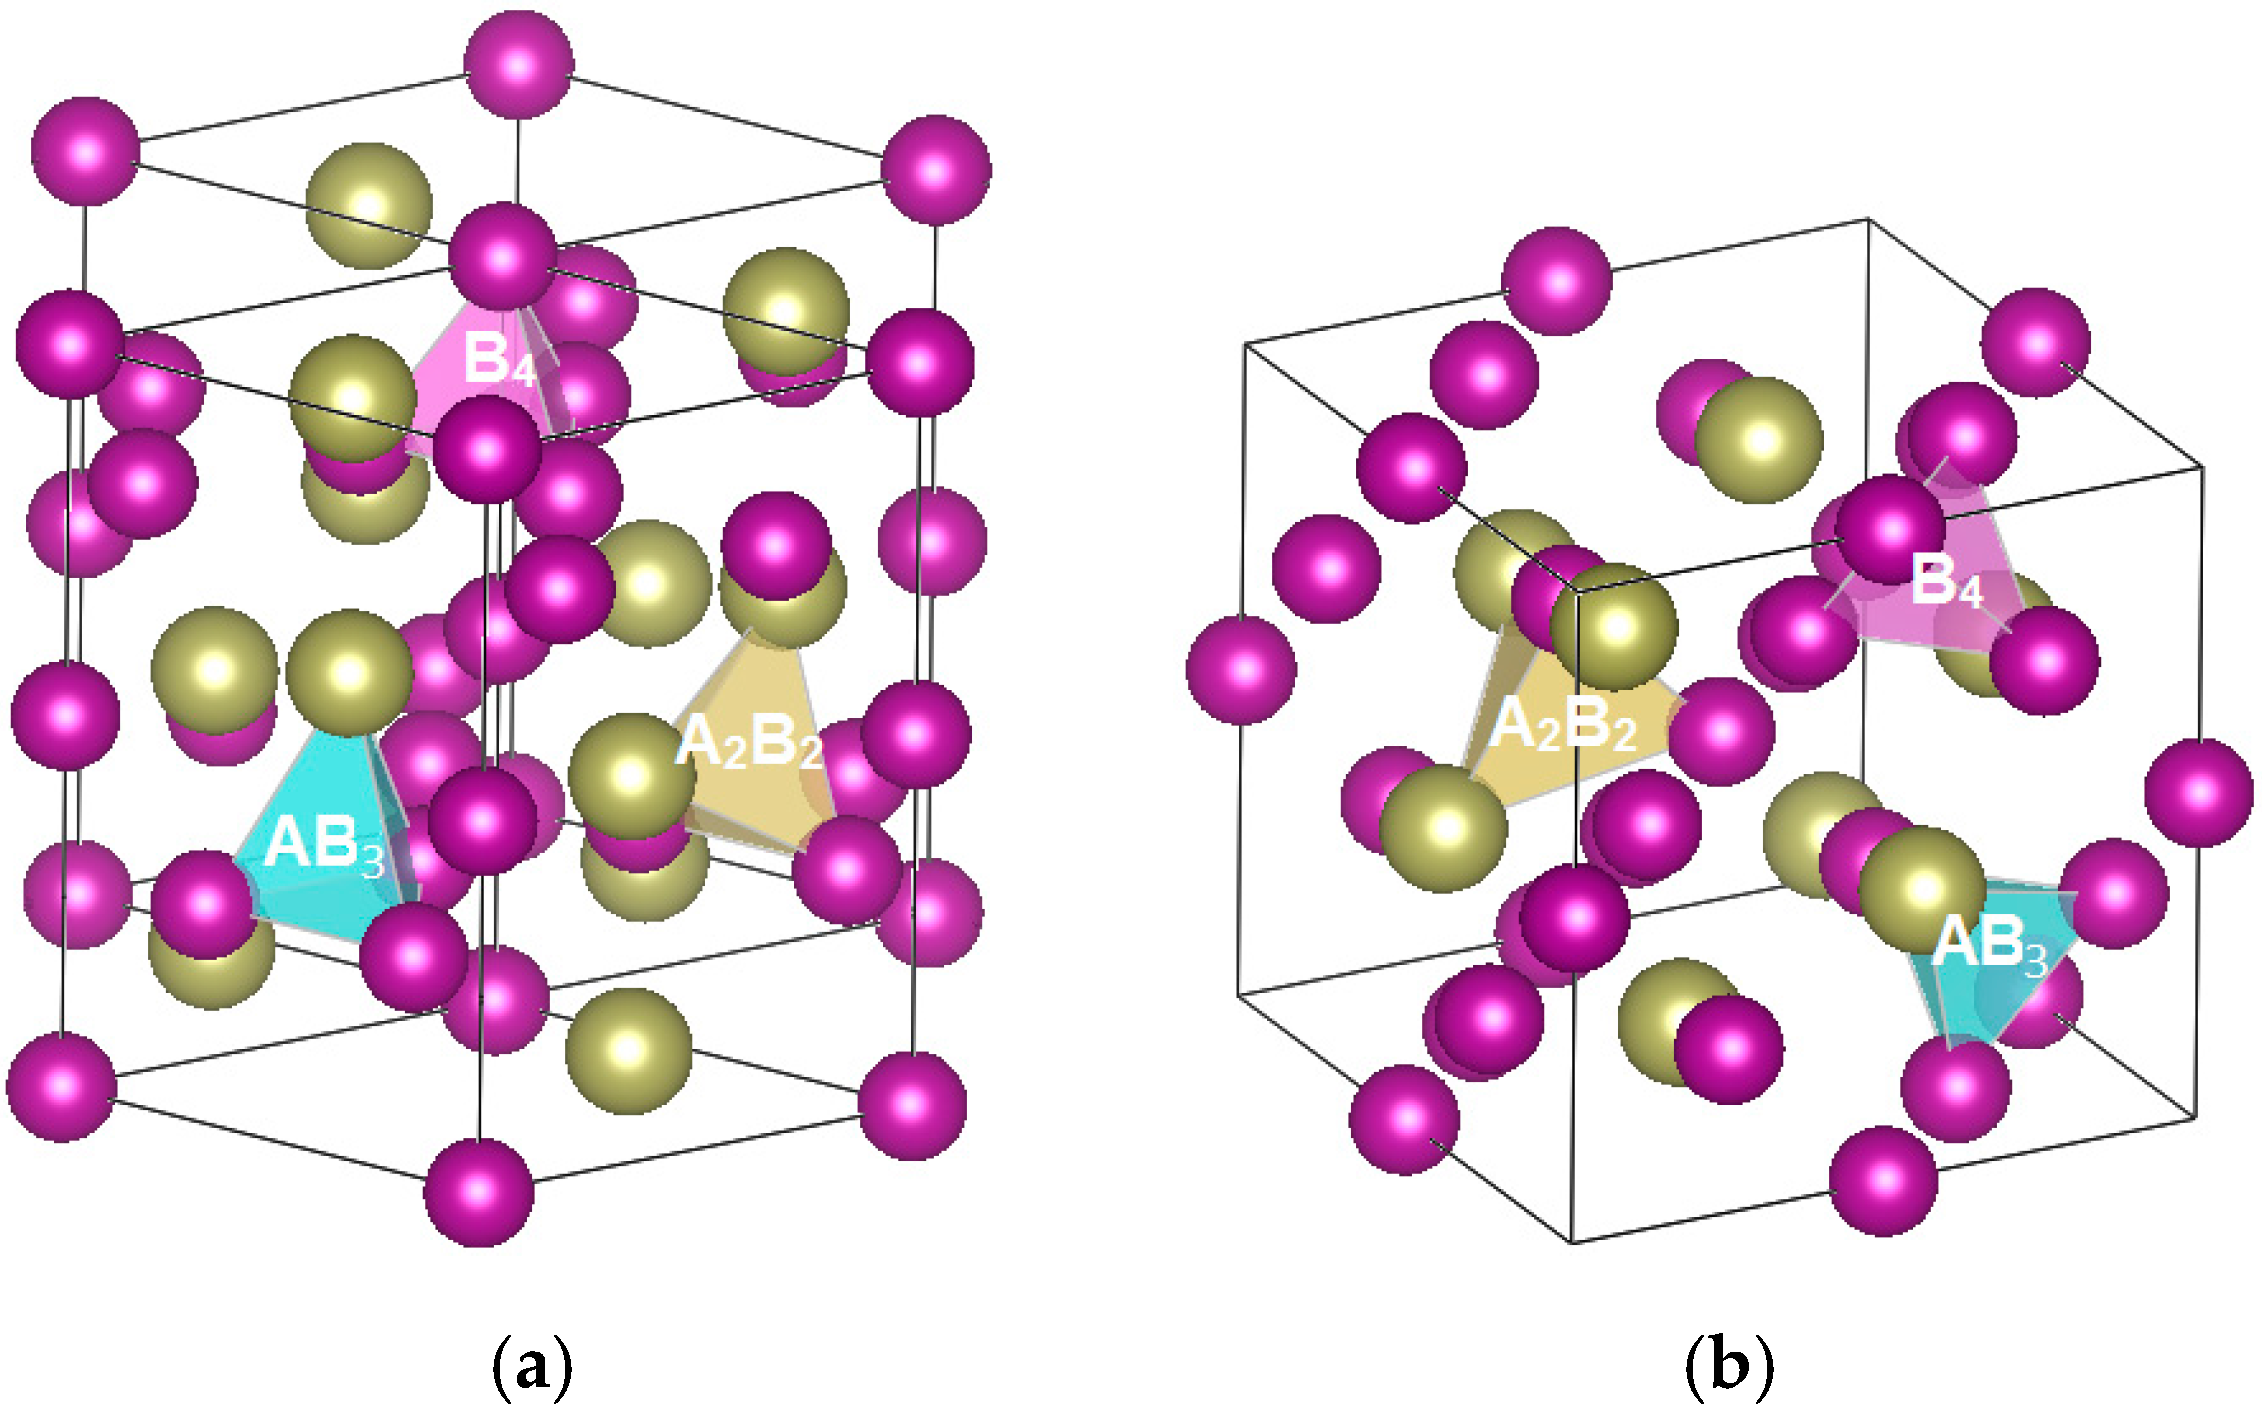
3. Results and Discussion
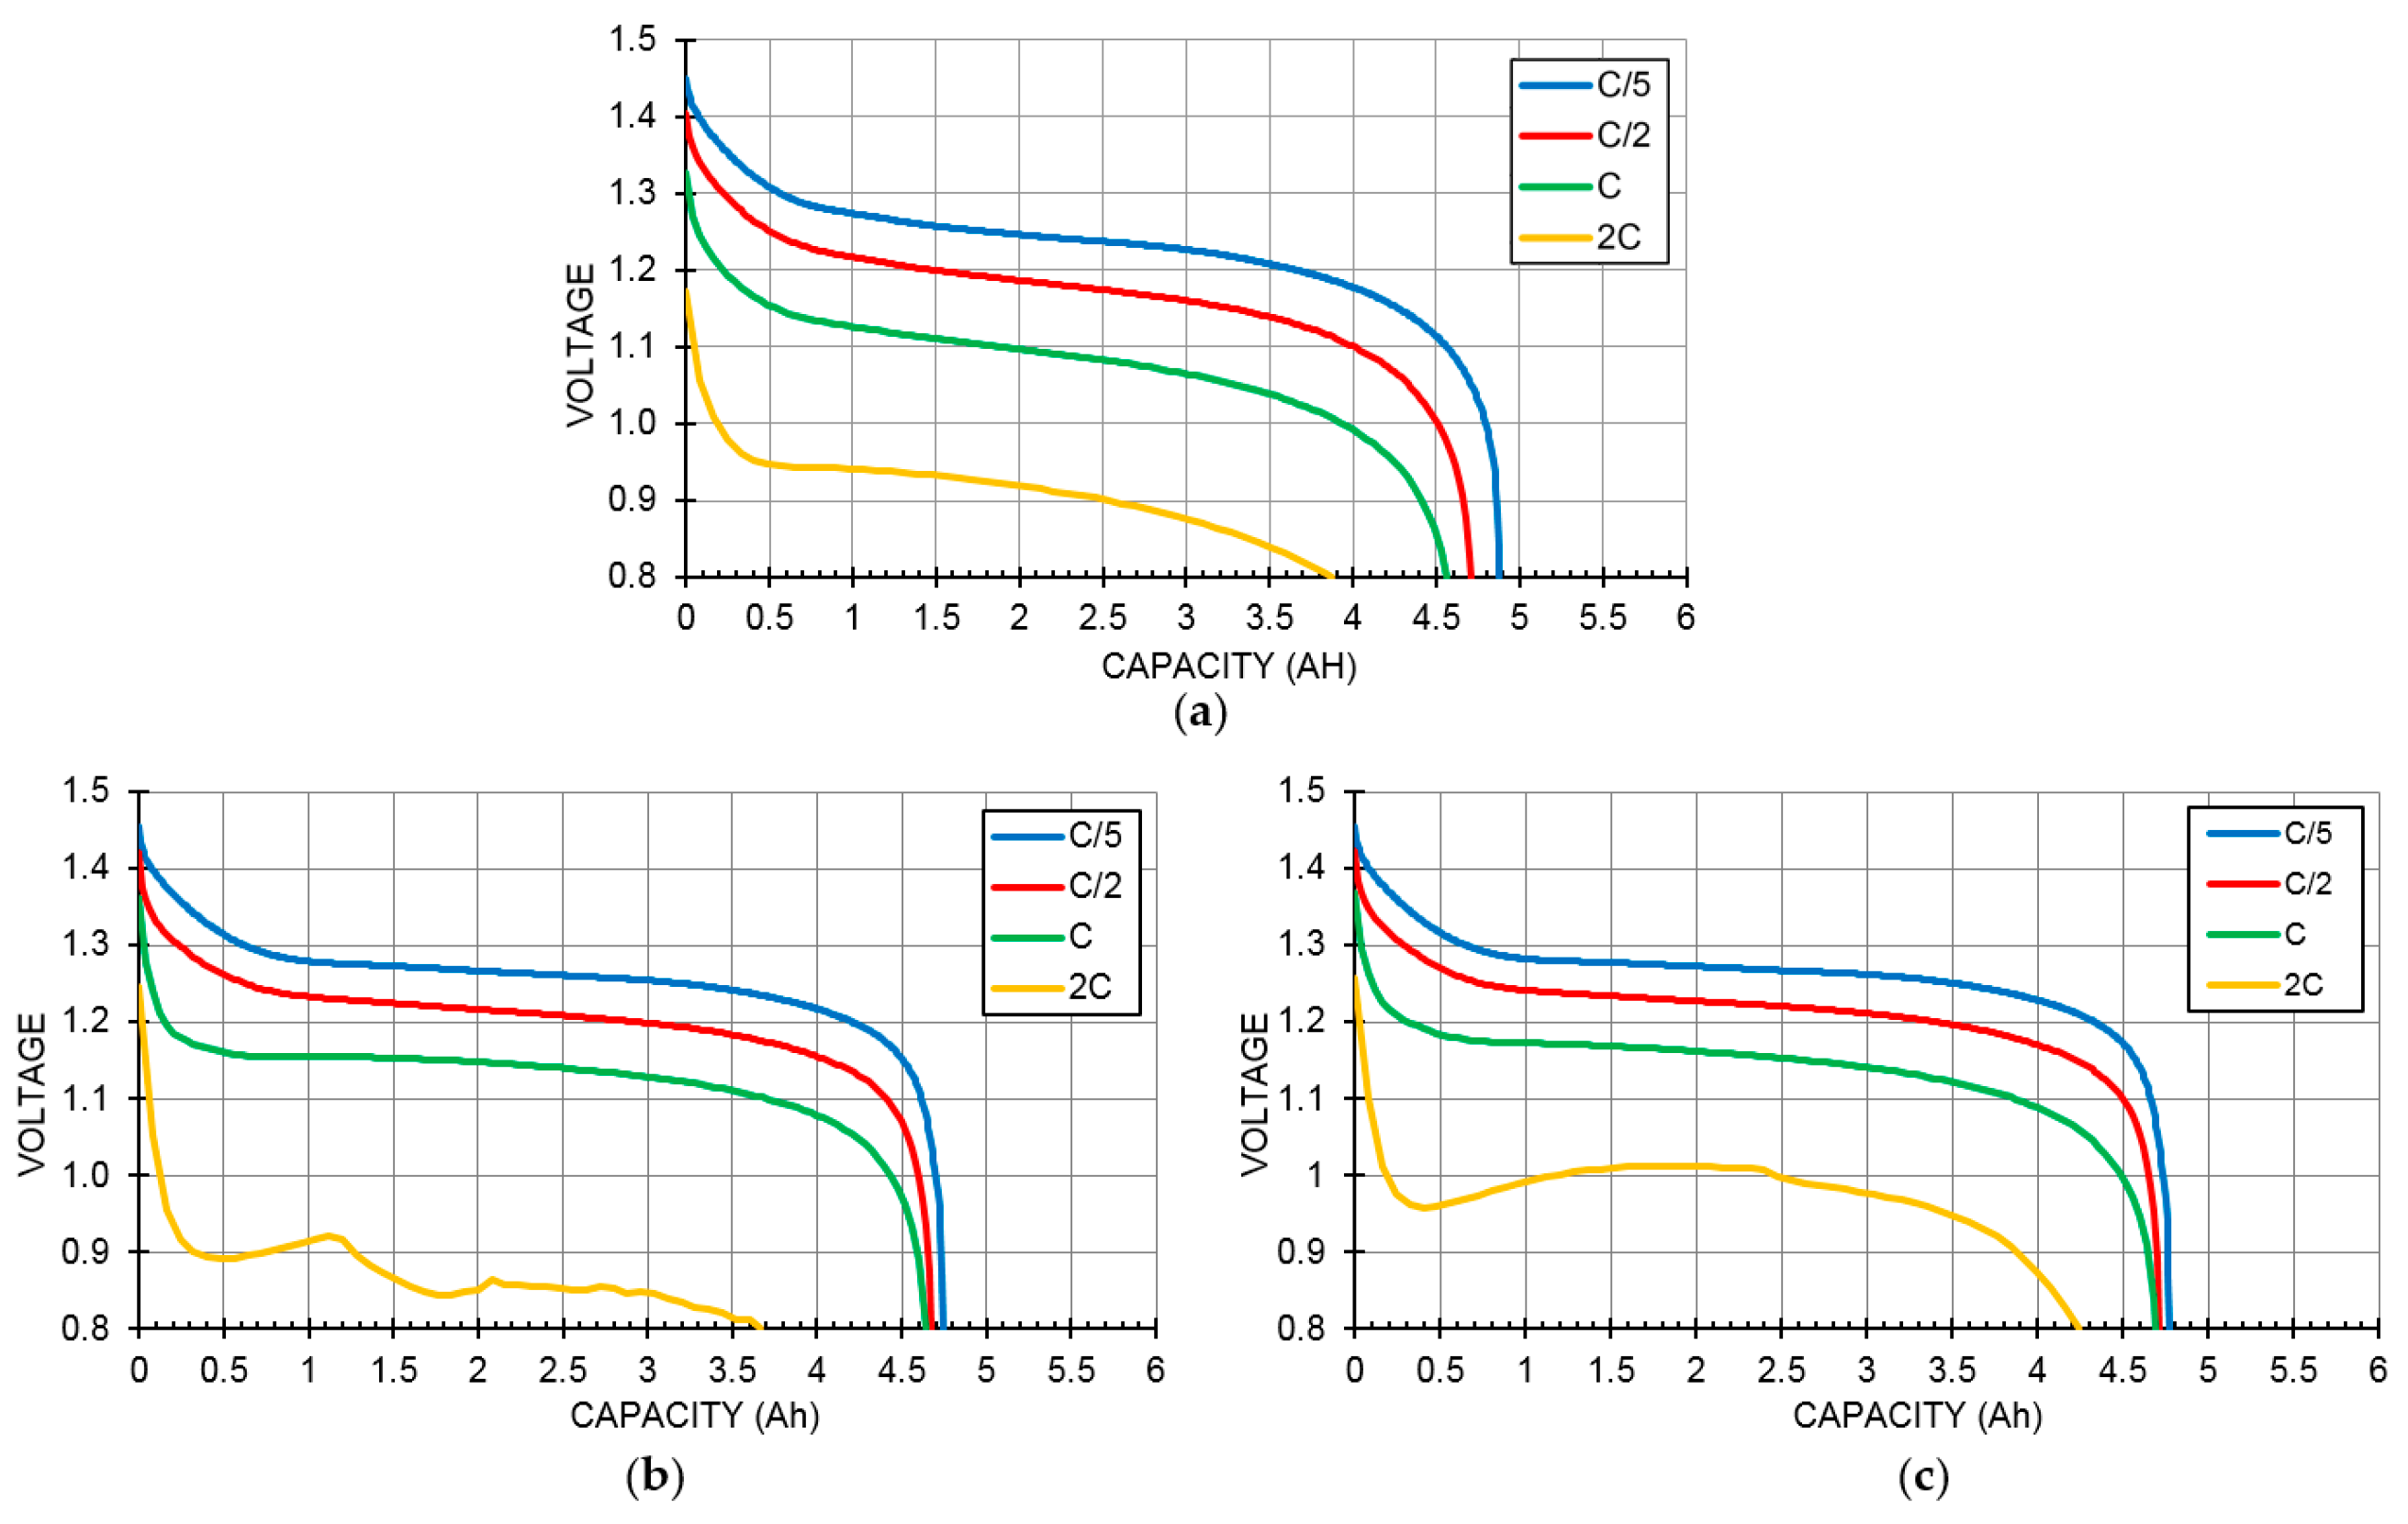
3.1. Room-Tempearture Capacities with Various Discharge Rates
3.2. Low-Temperature (−10 °C) Test
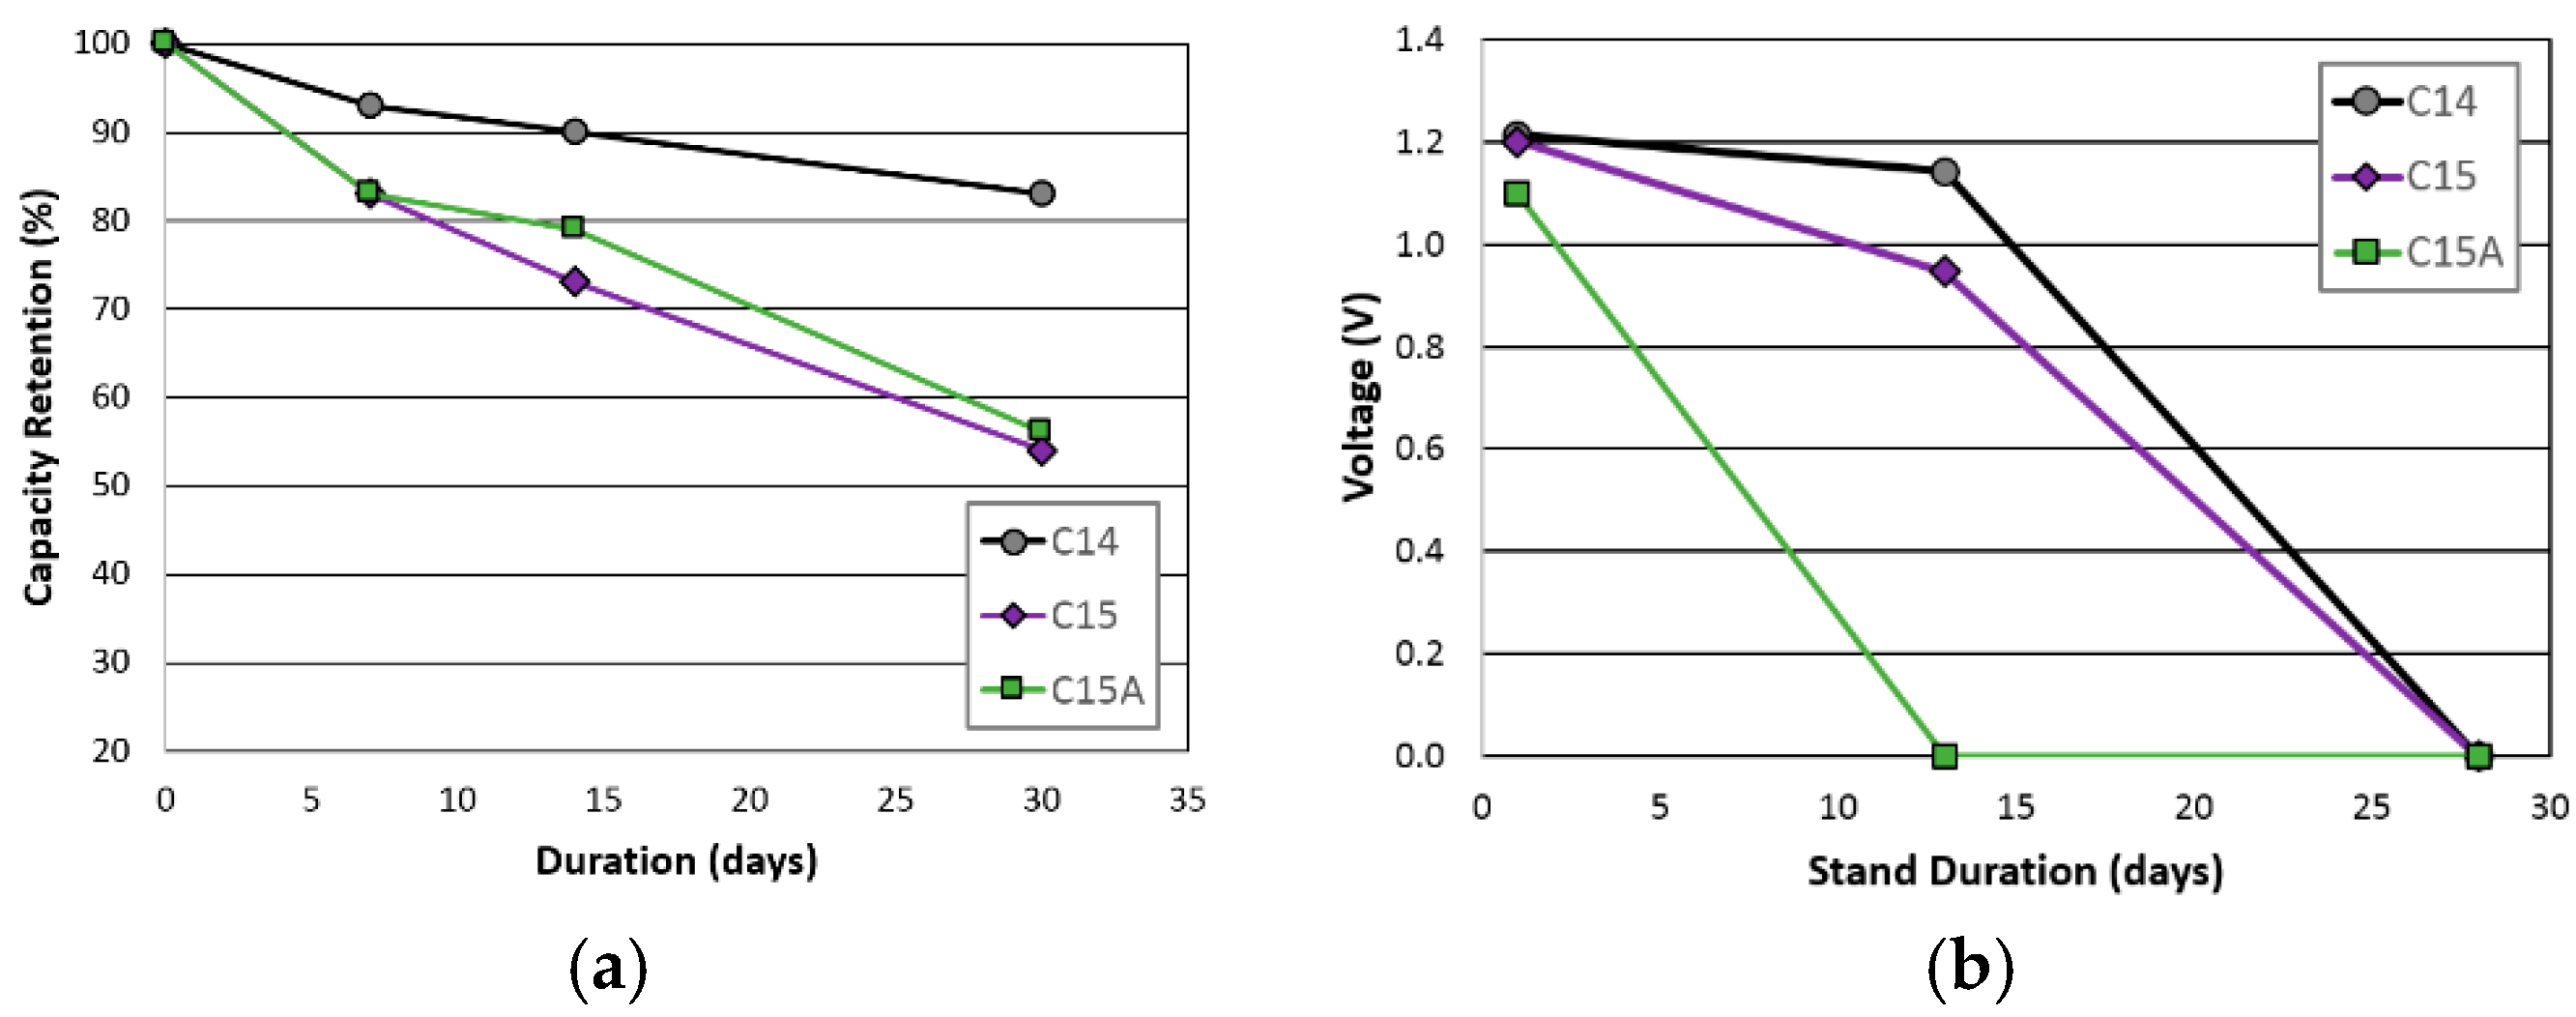
3.3. Charge Retention
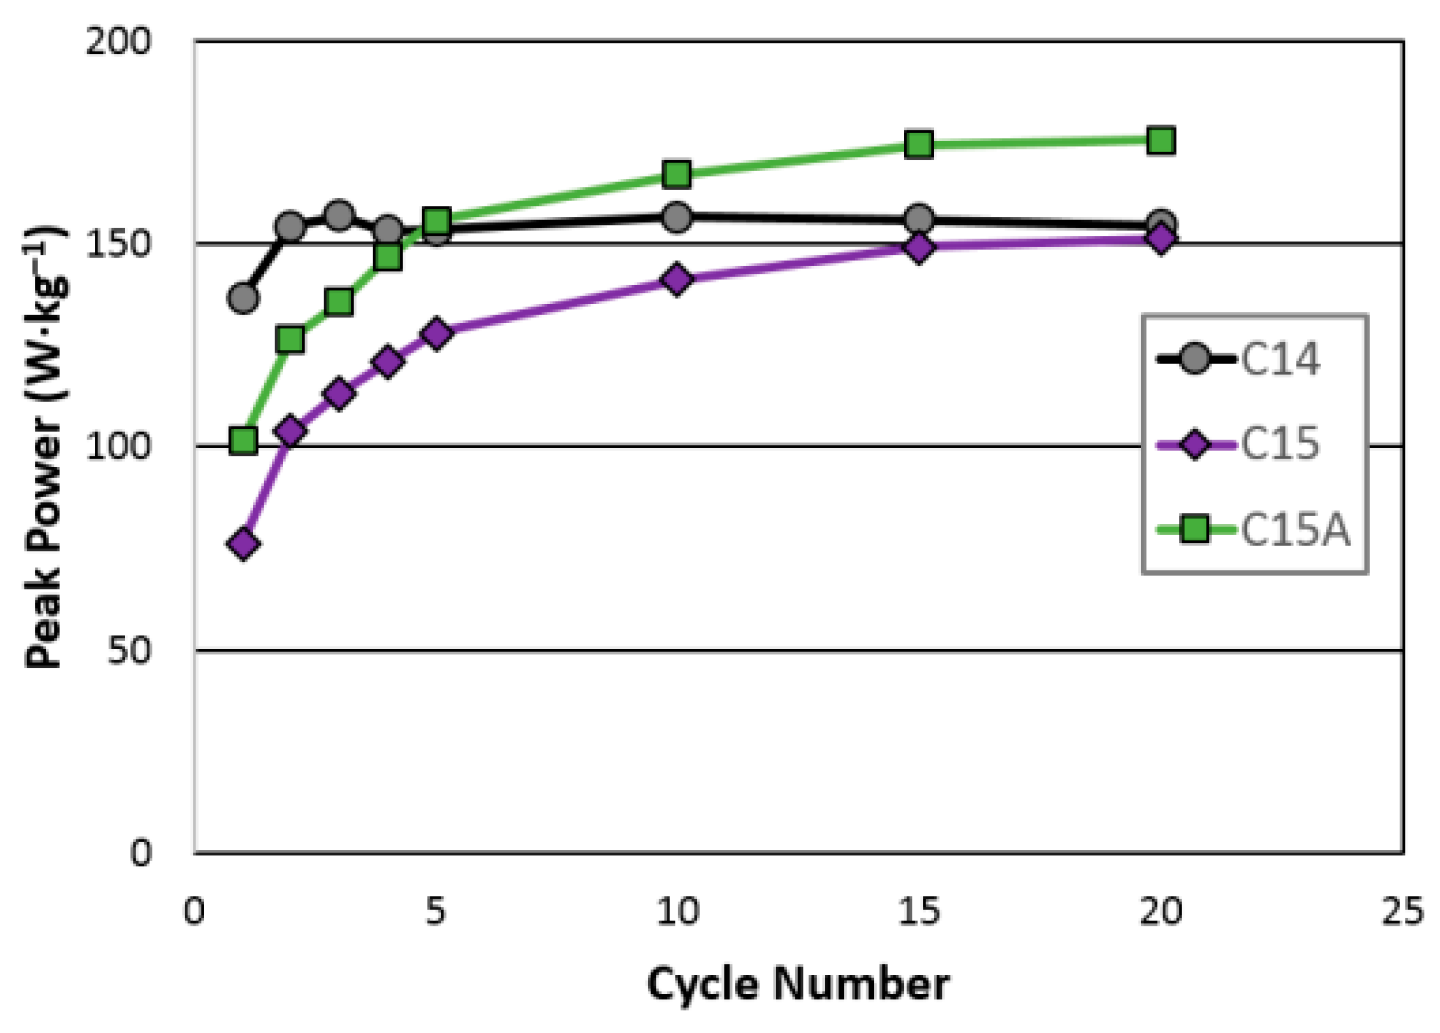
3.4. Peak Power
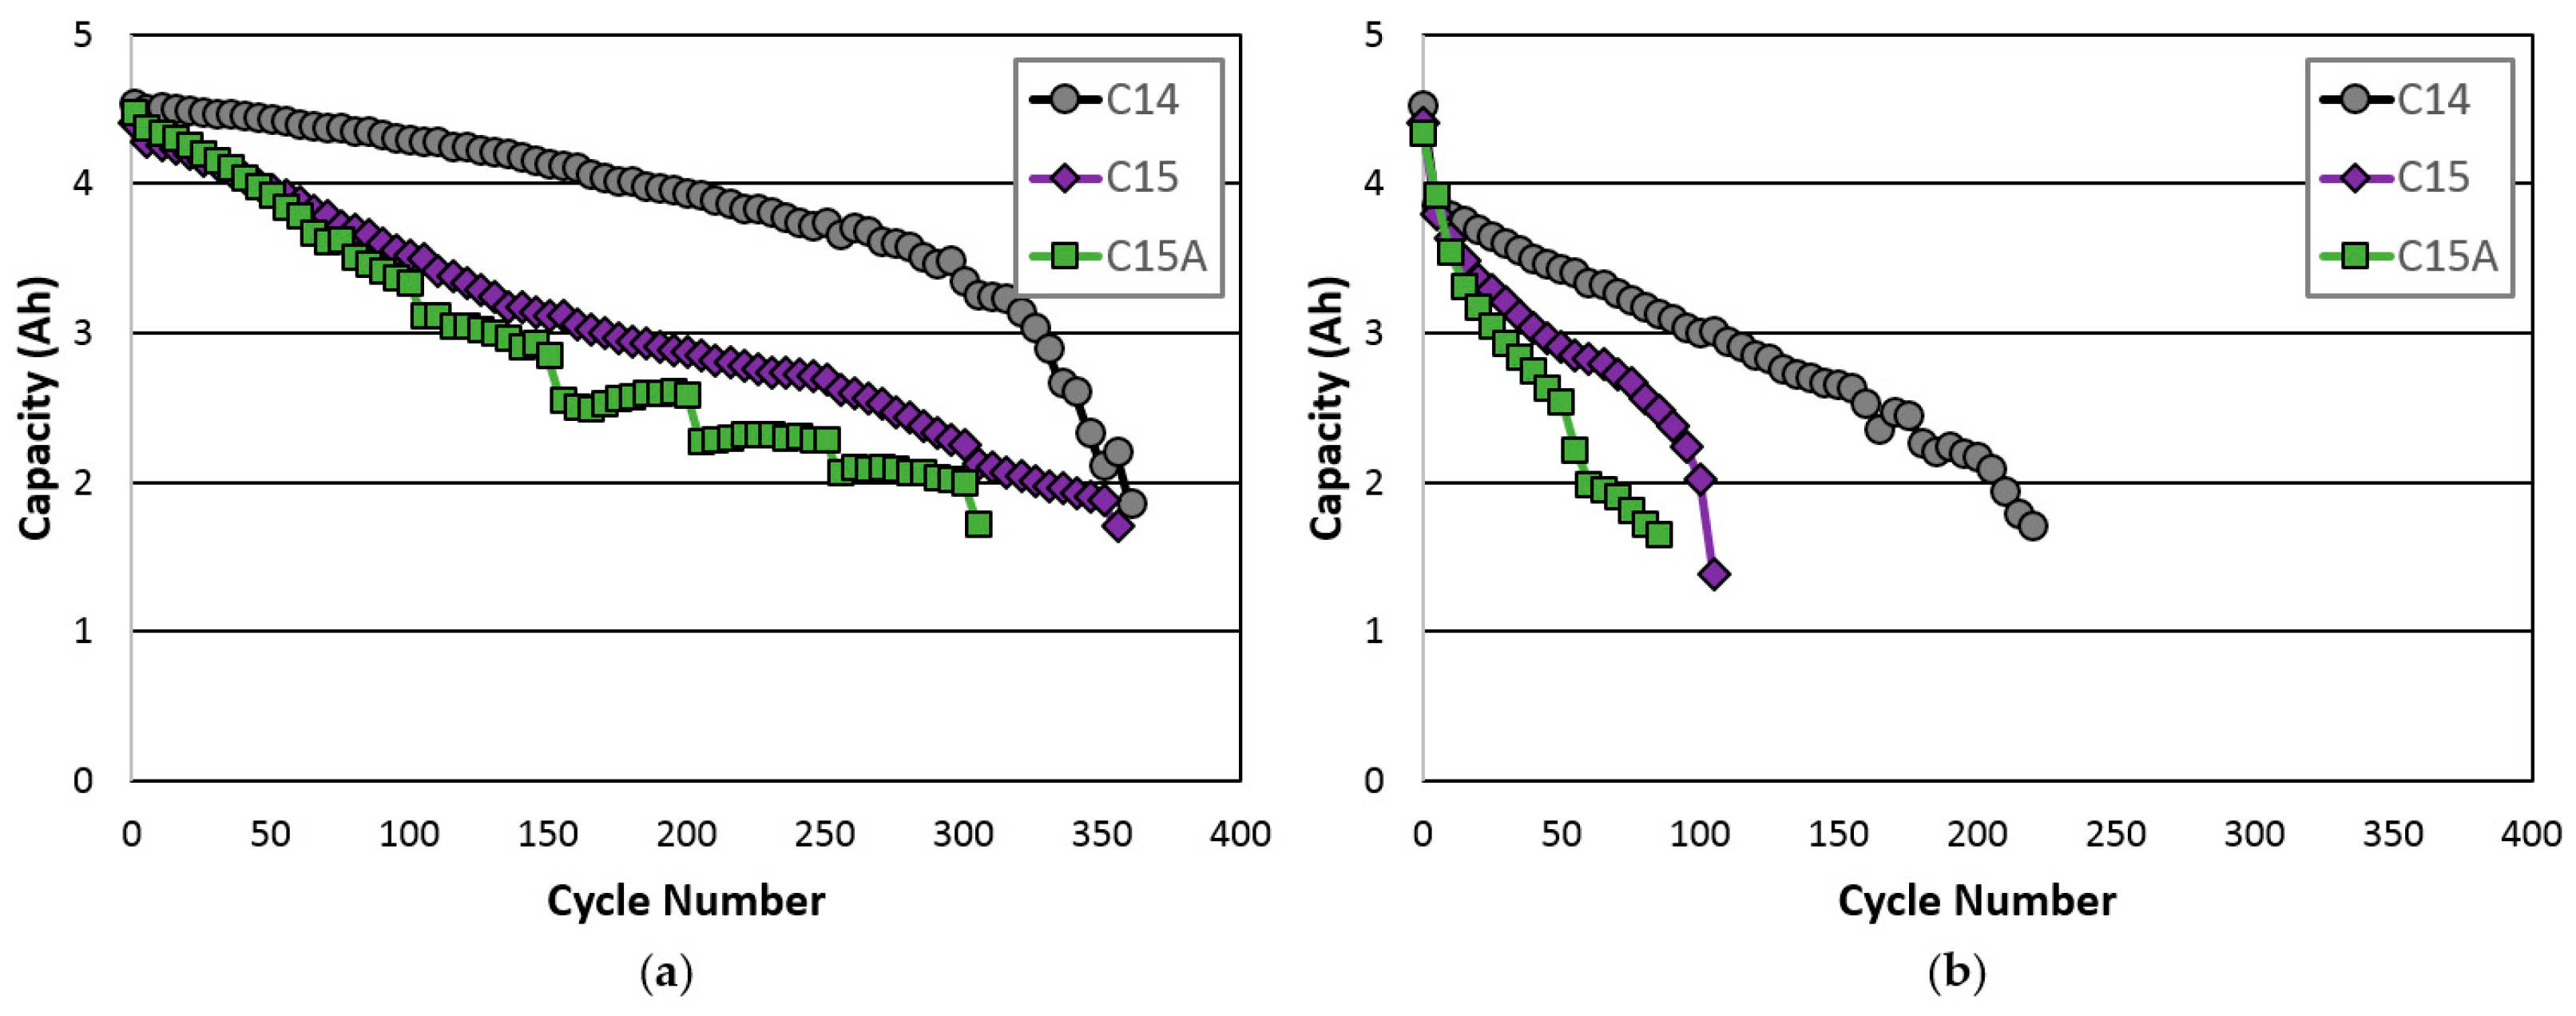
3.5. Cycle Life
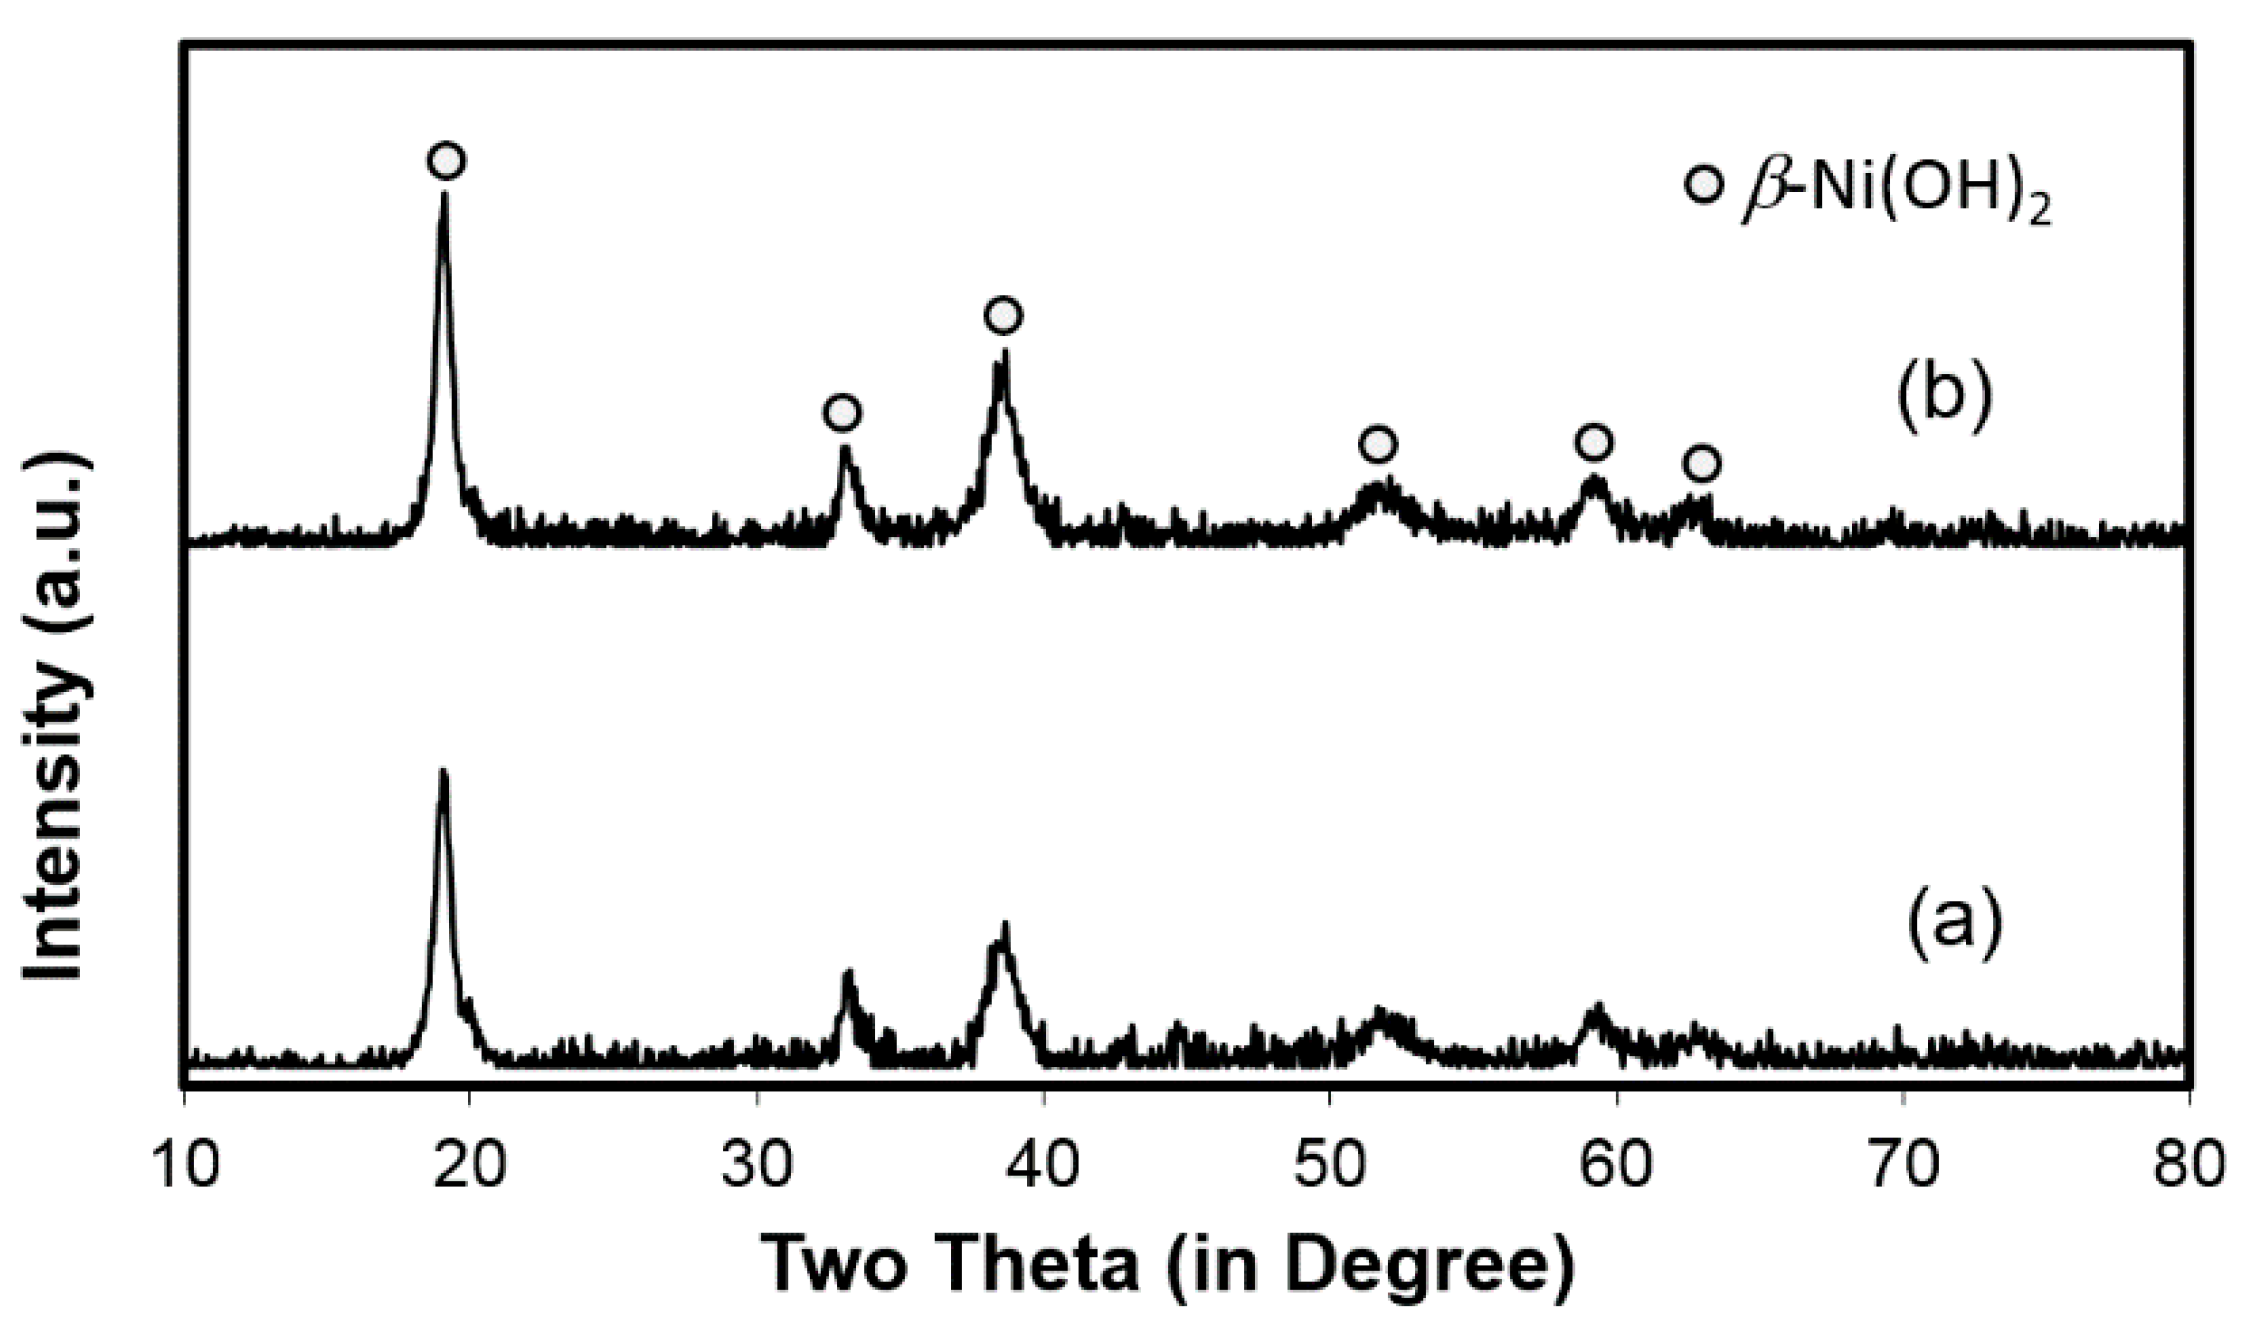
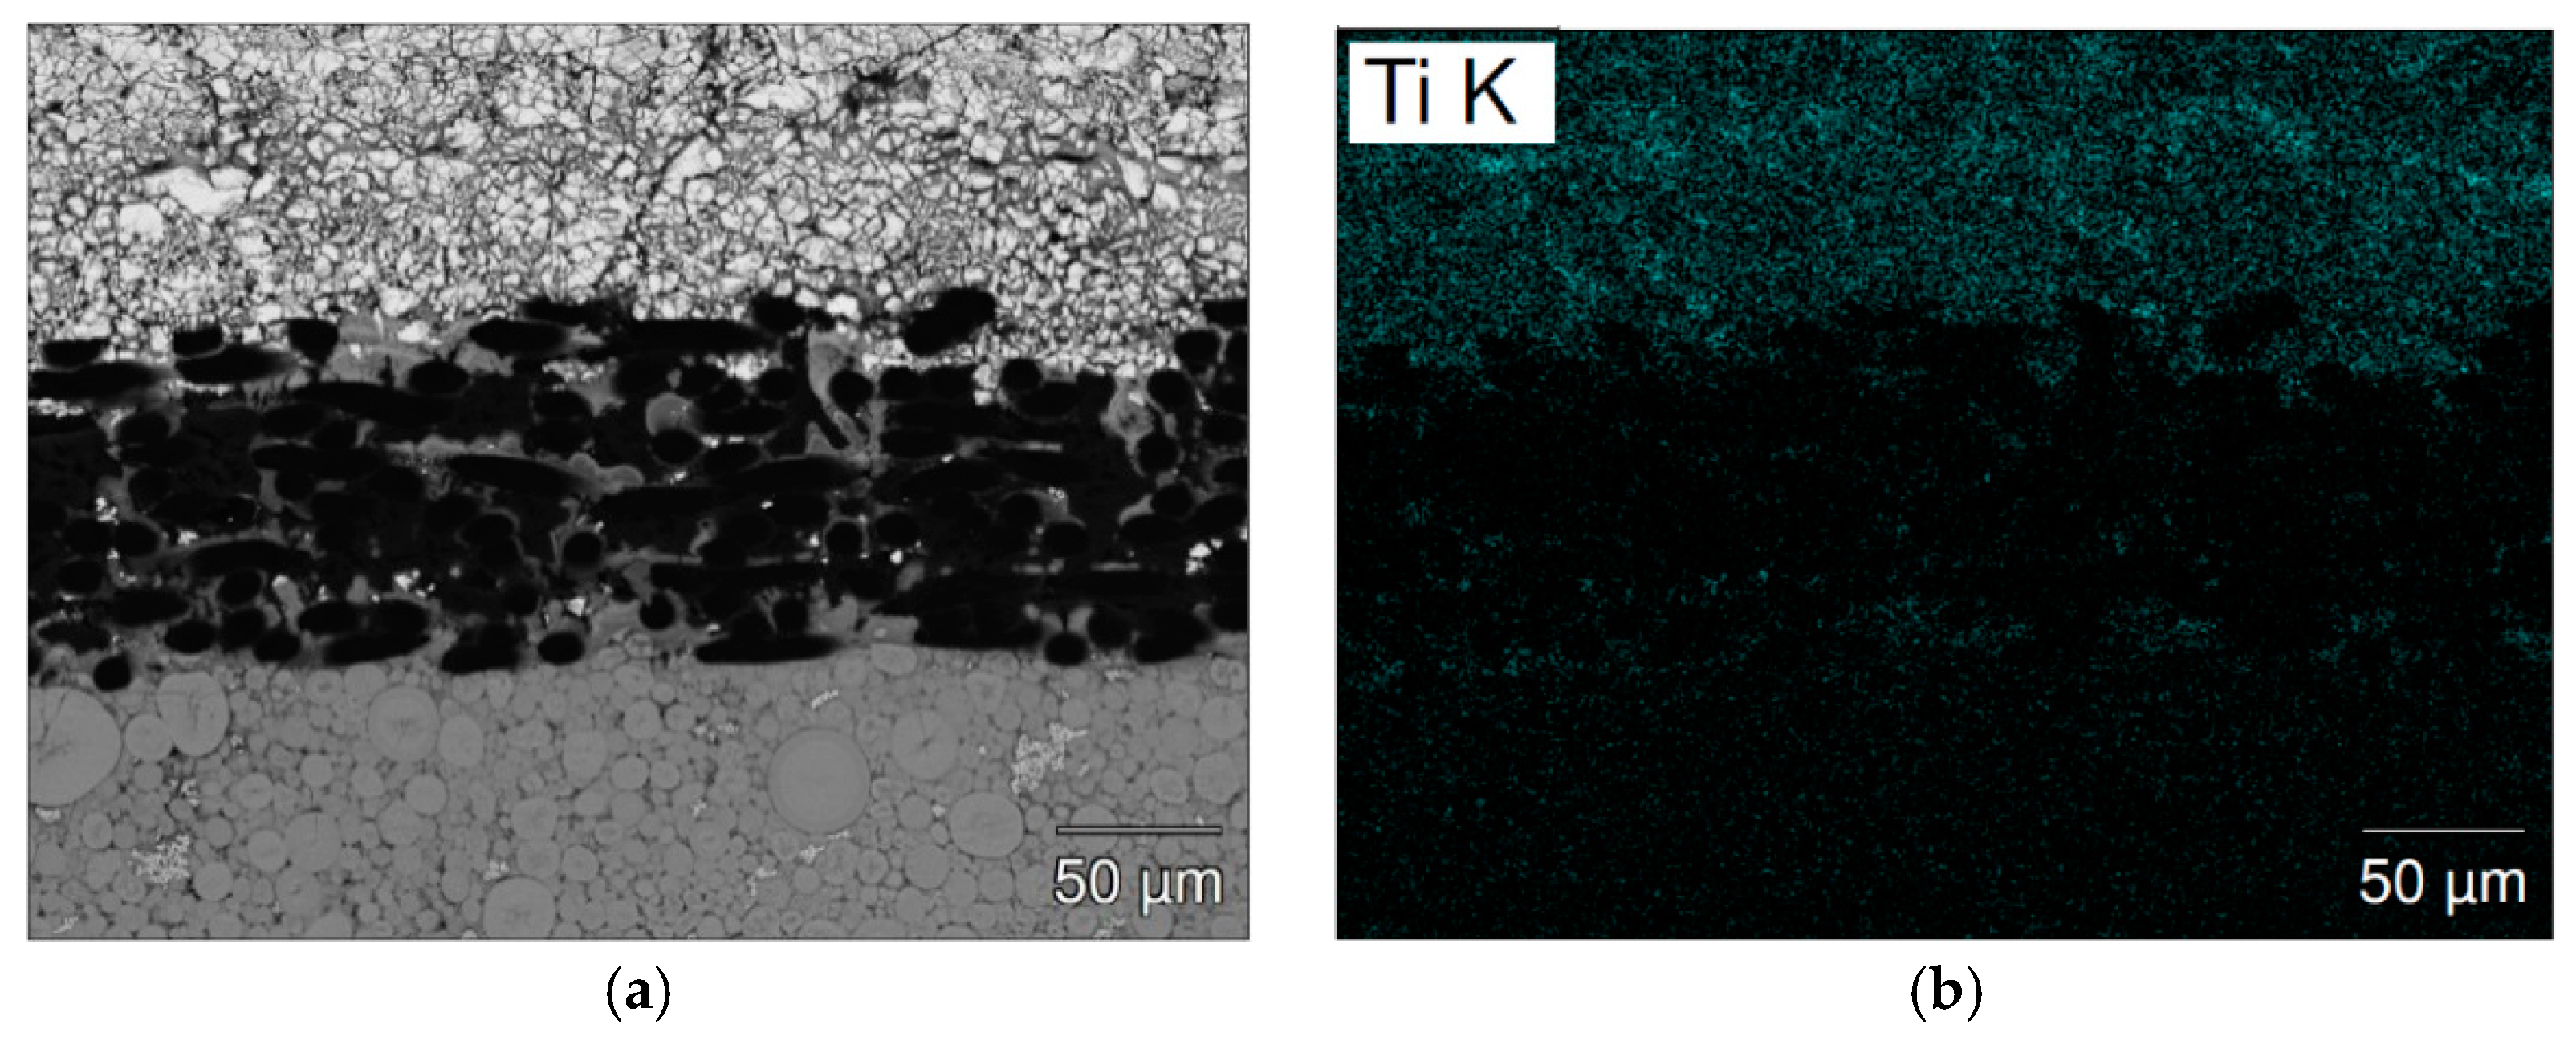
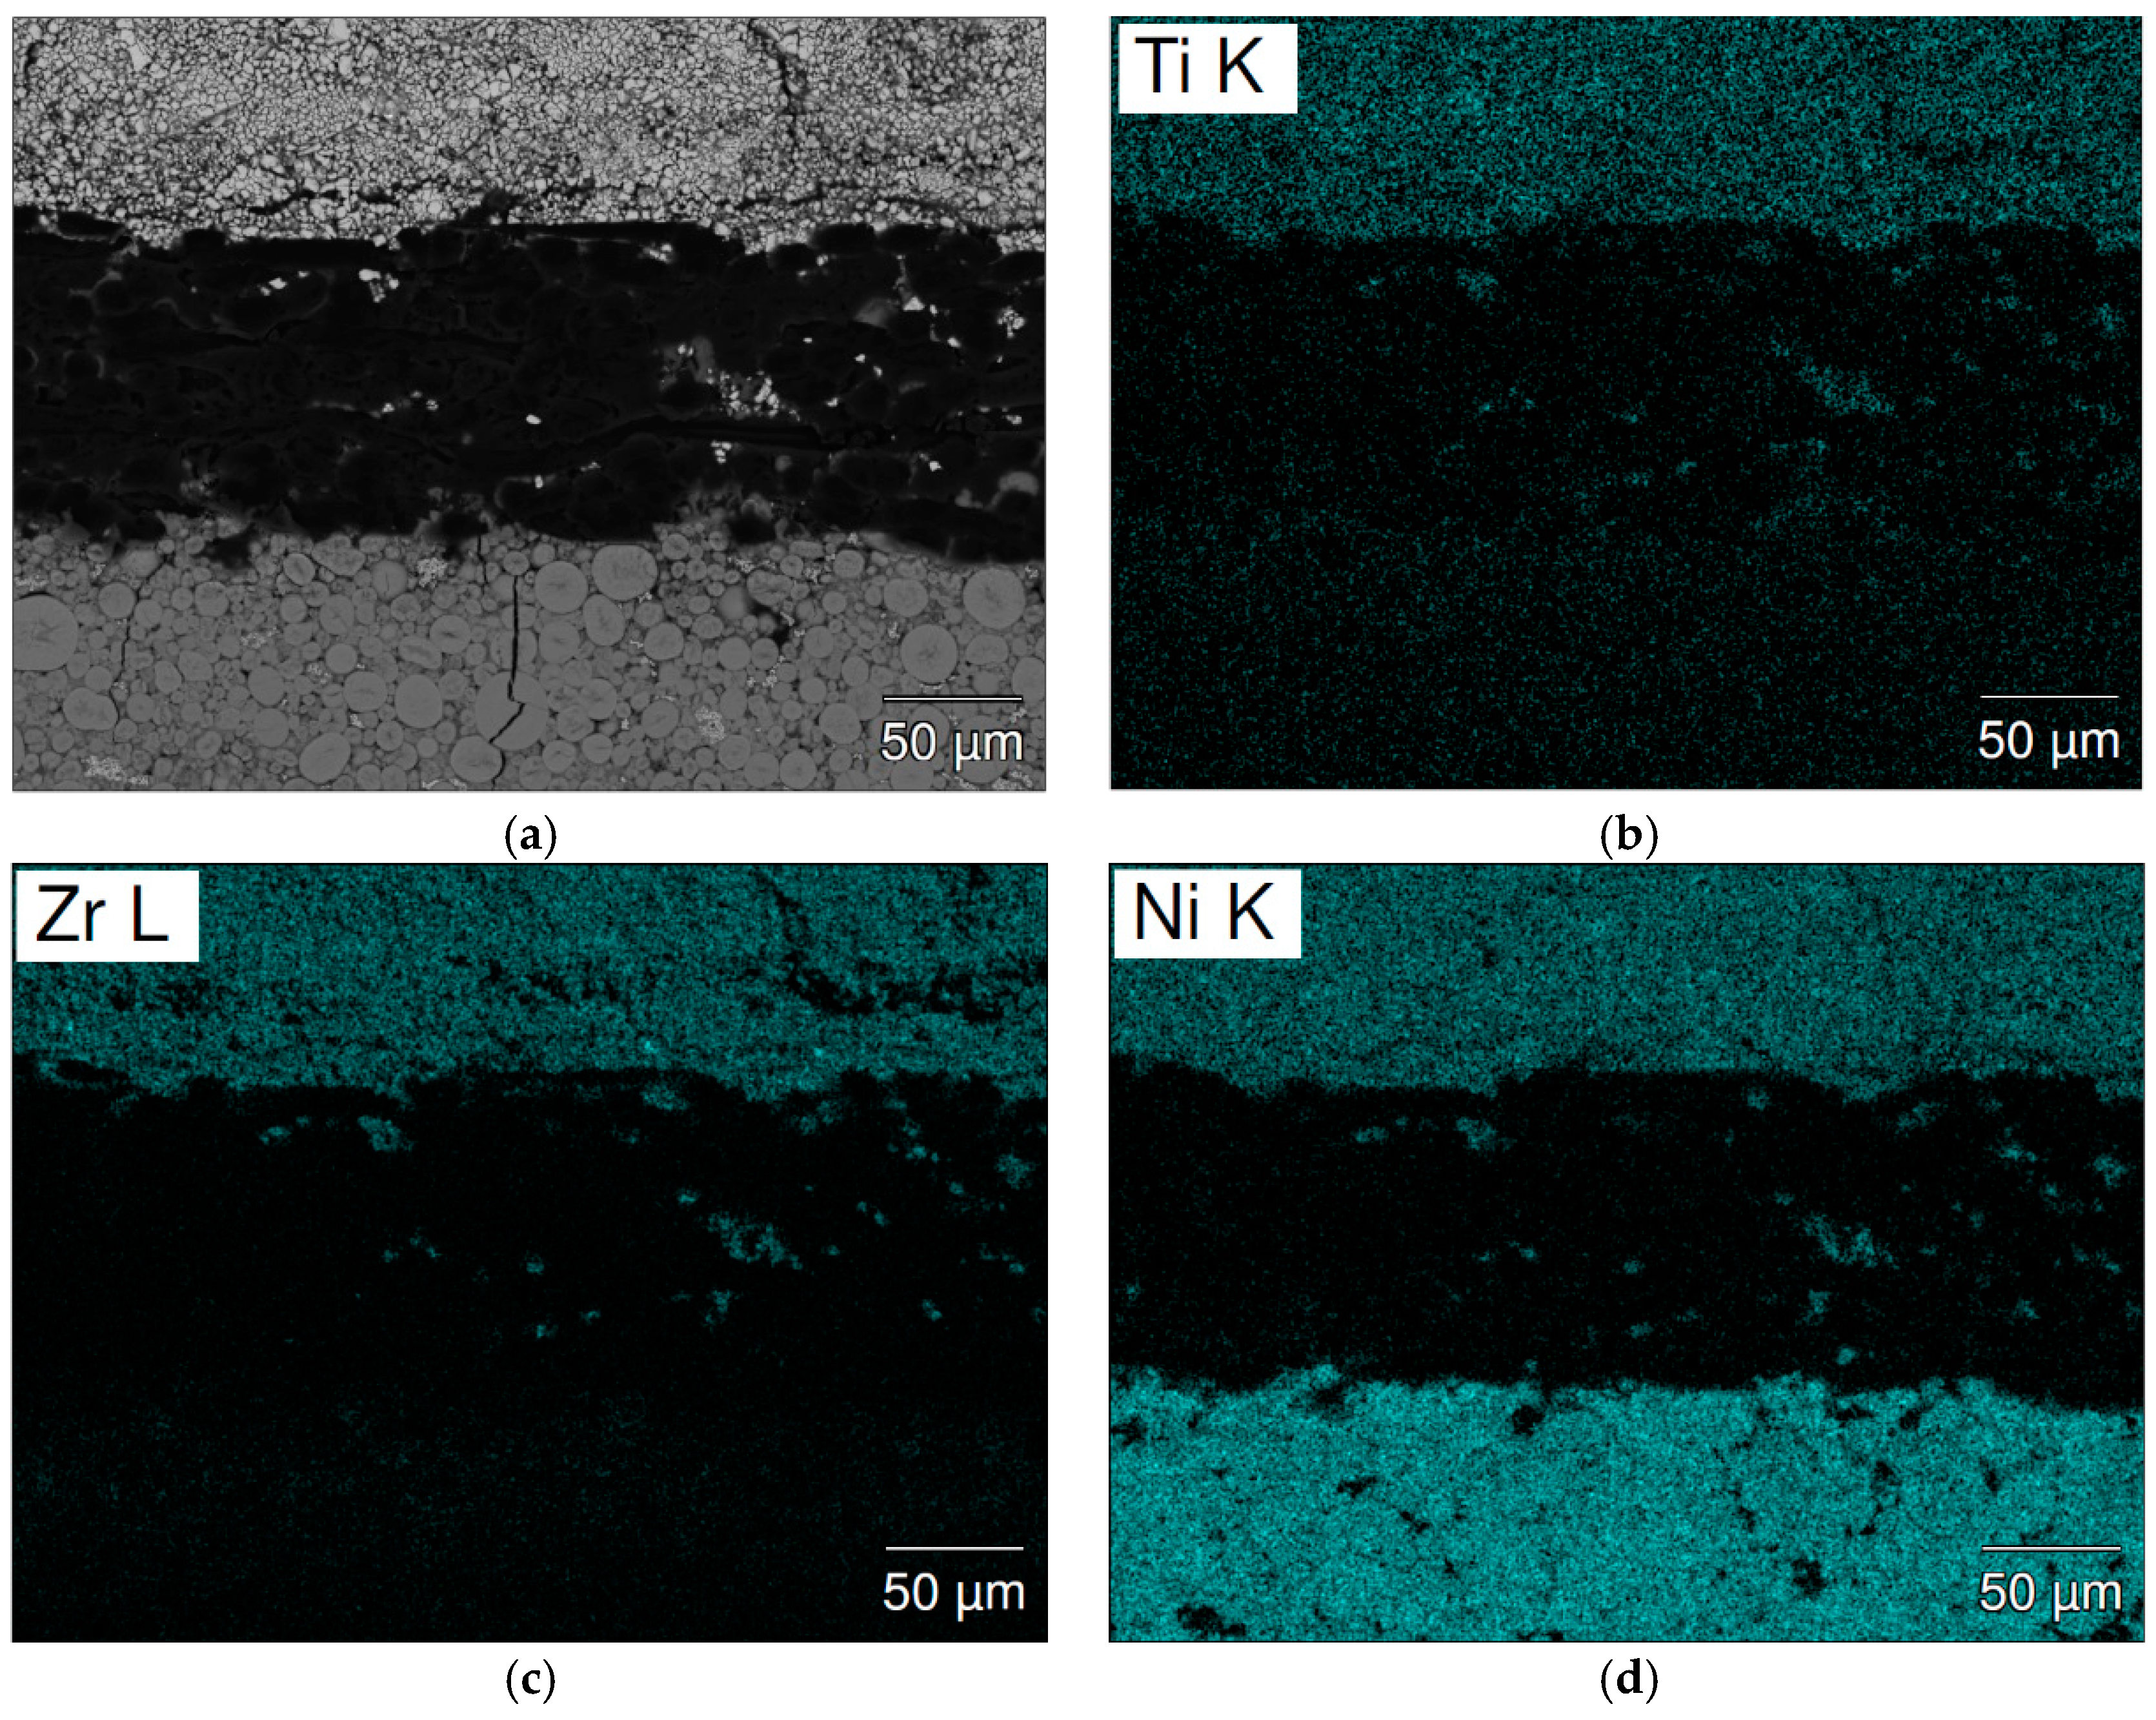
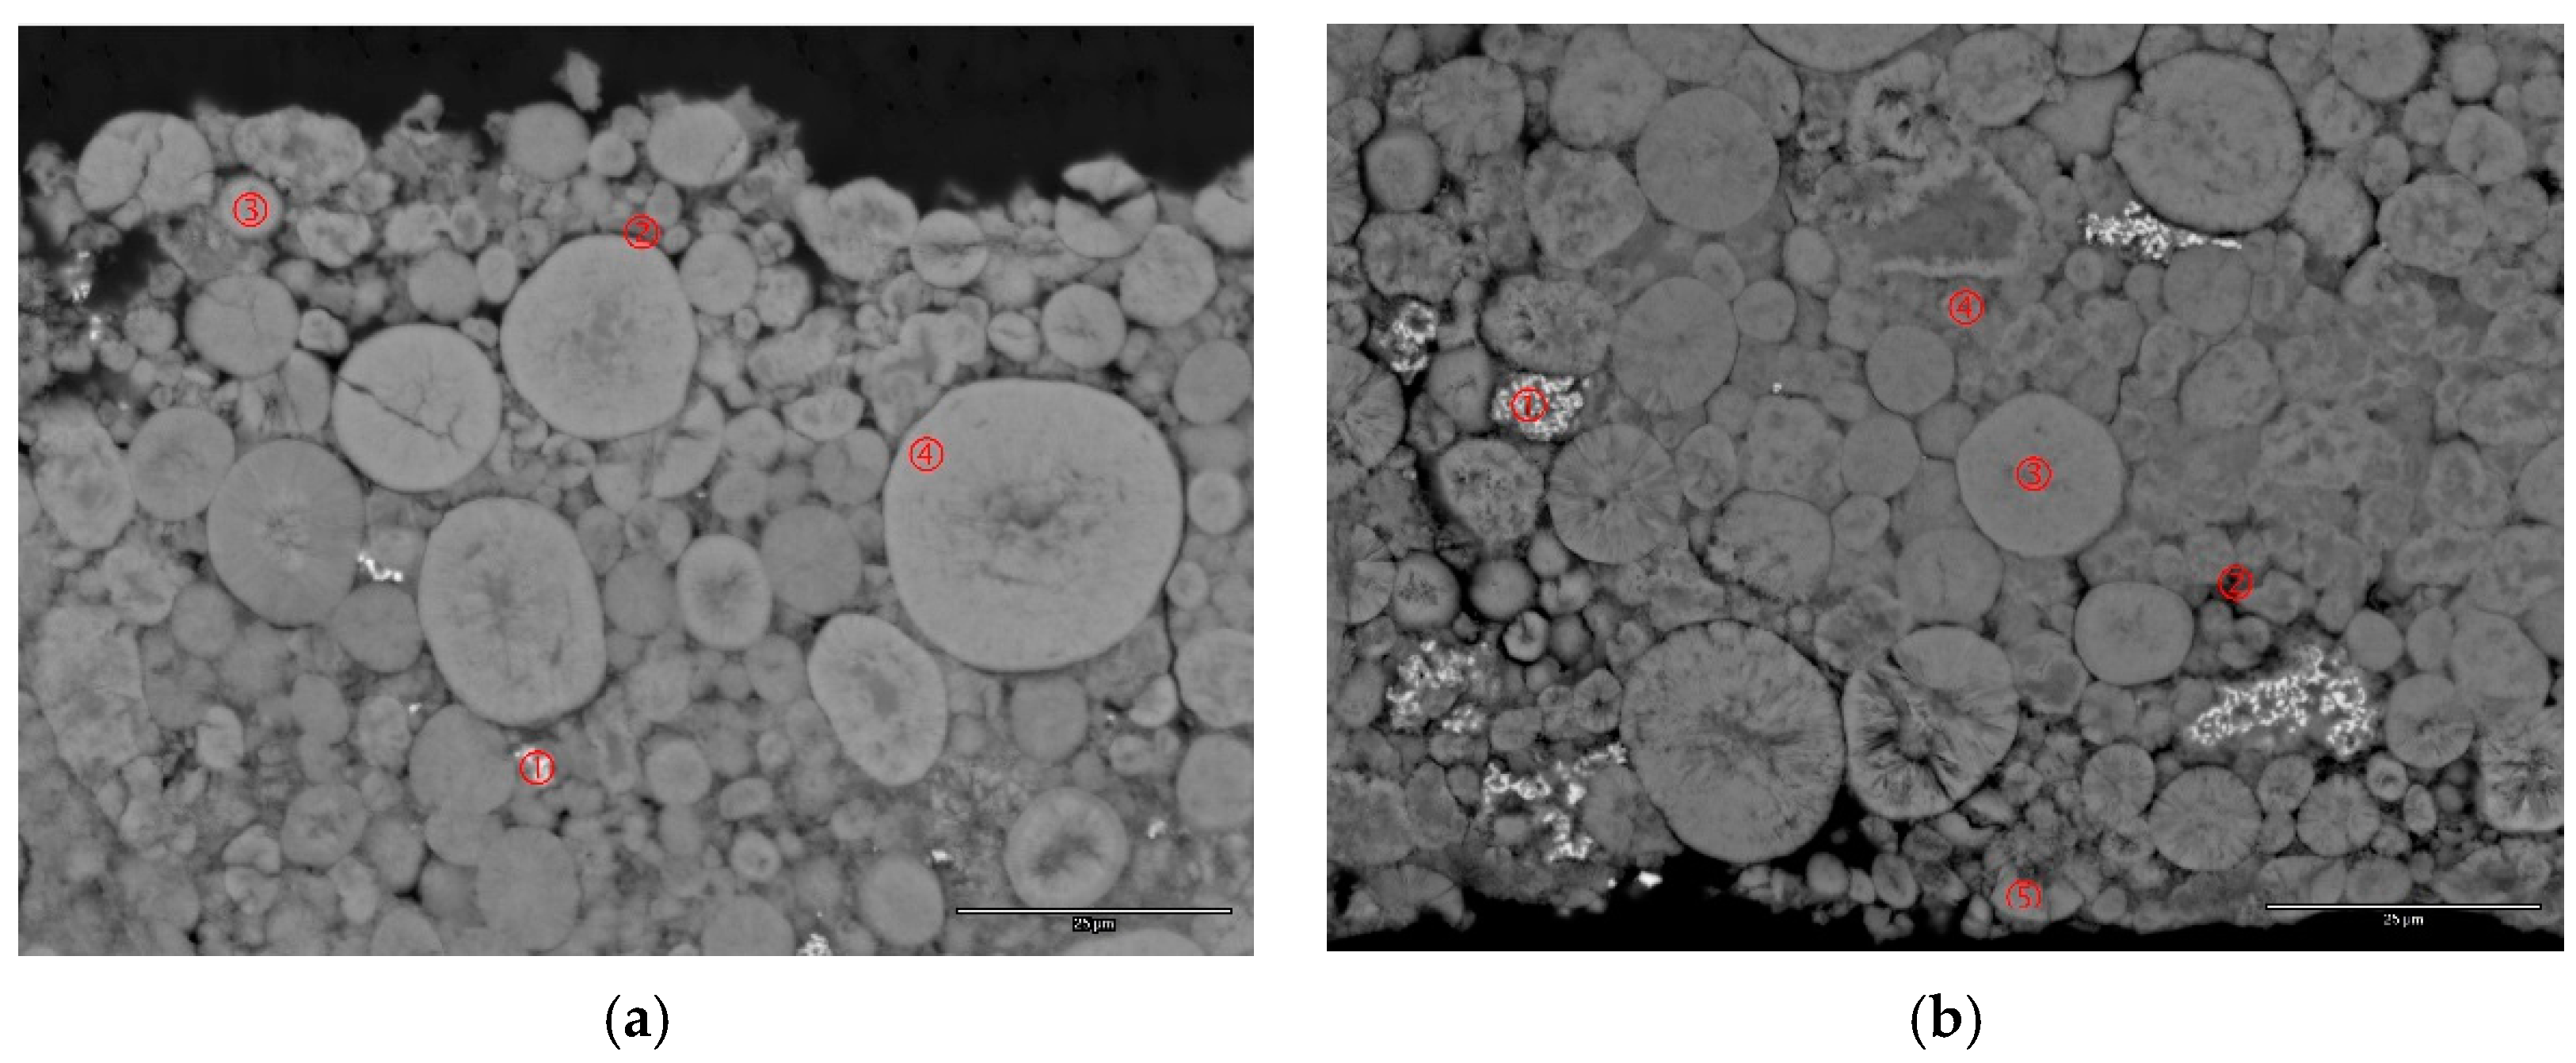
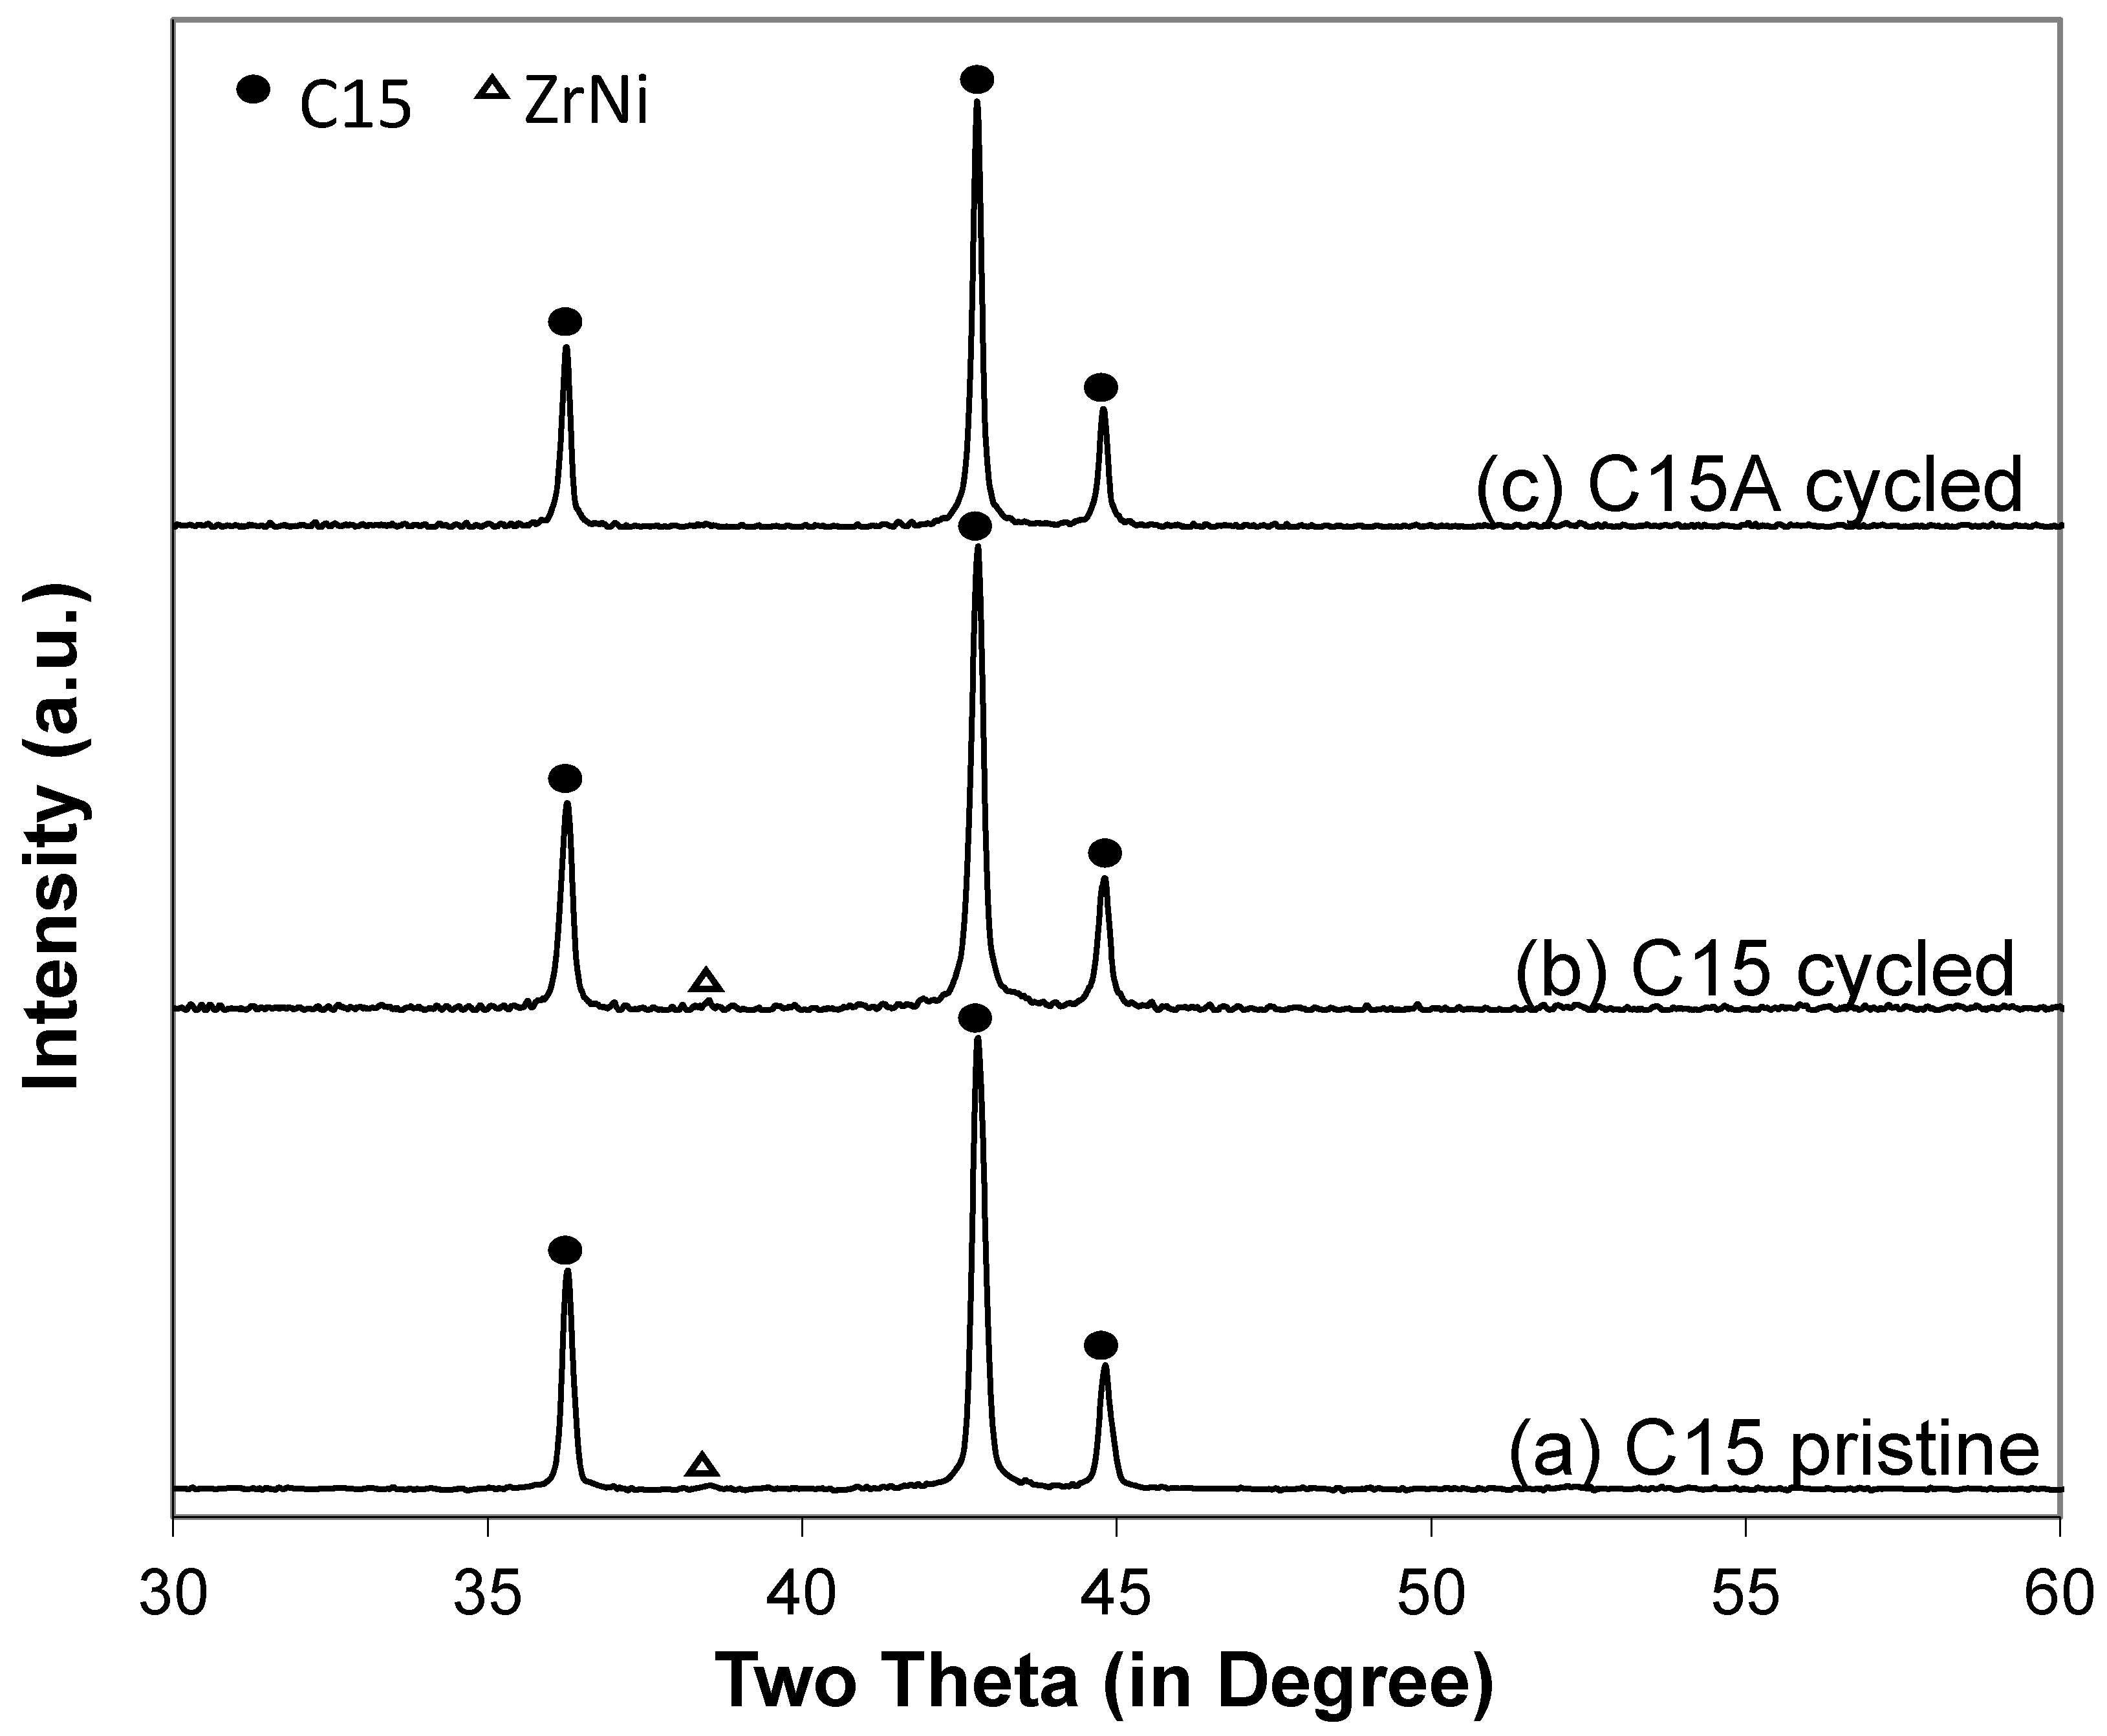
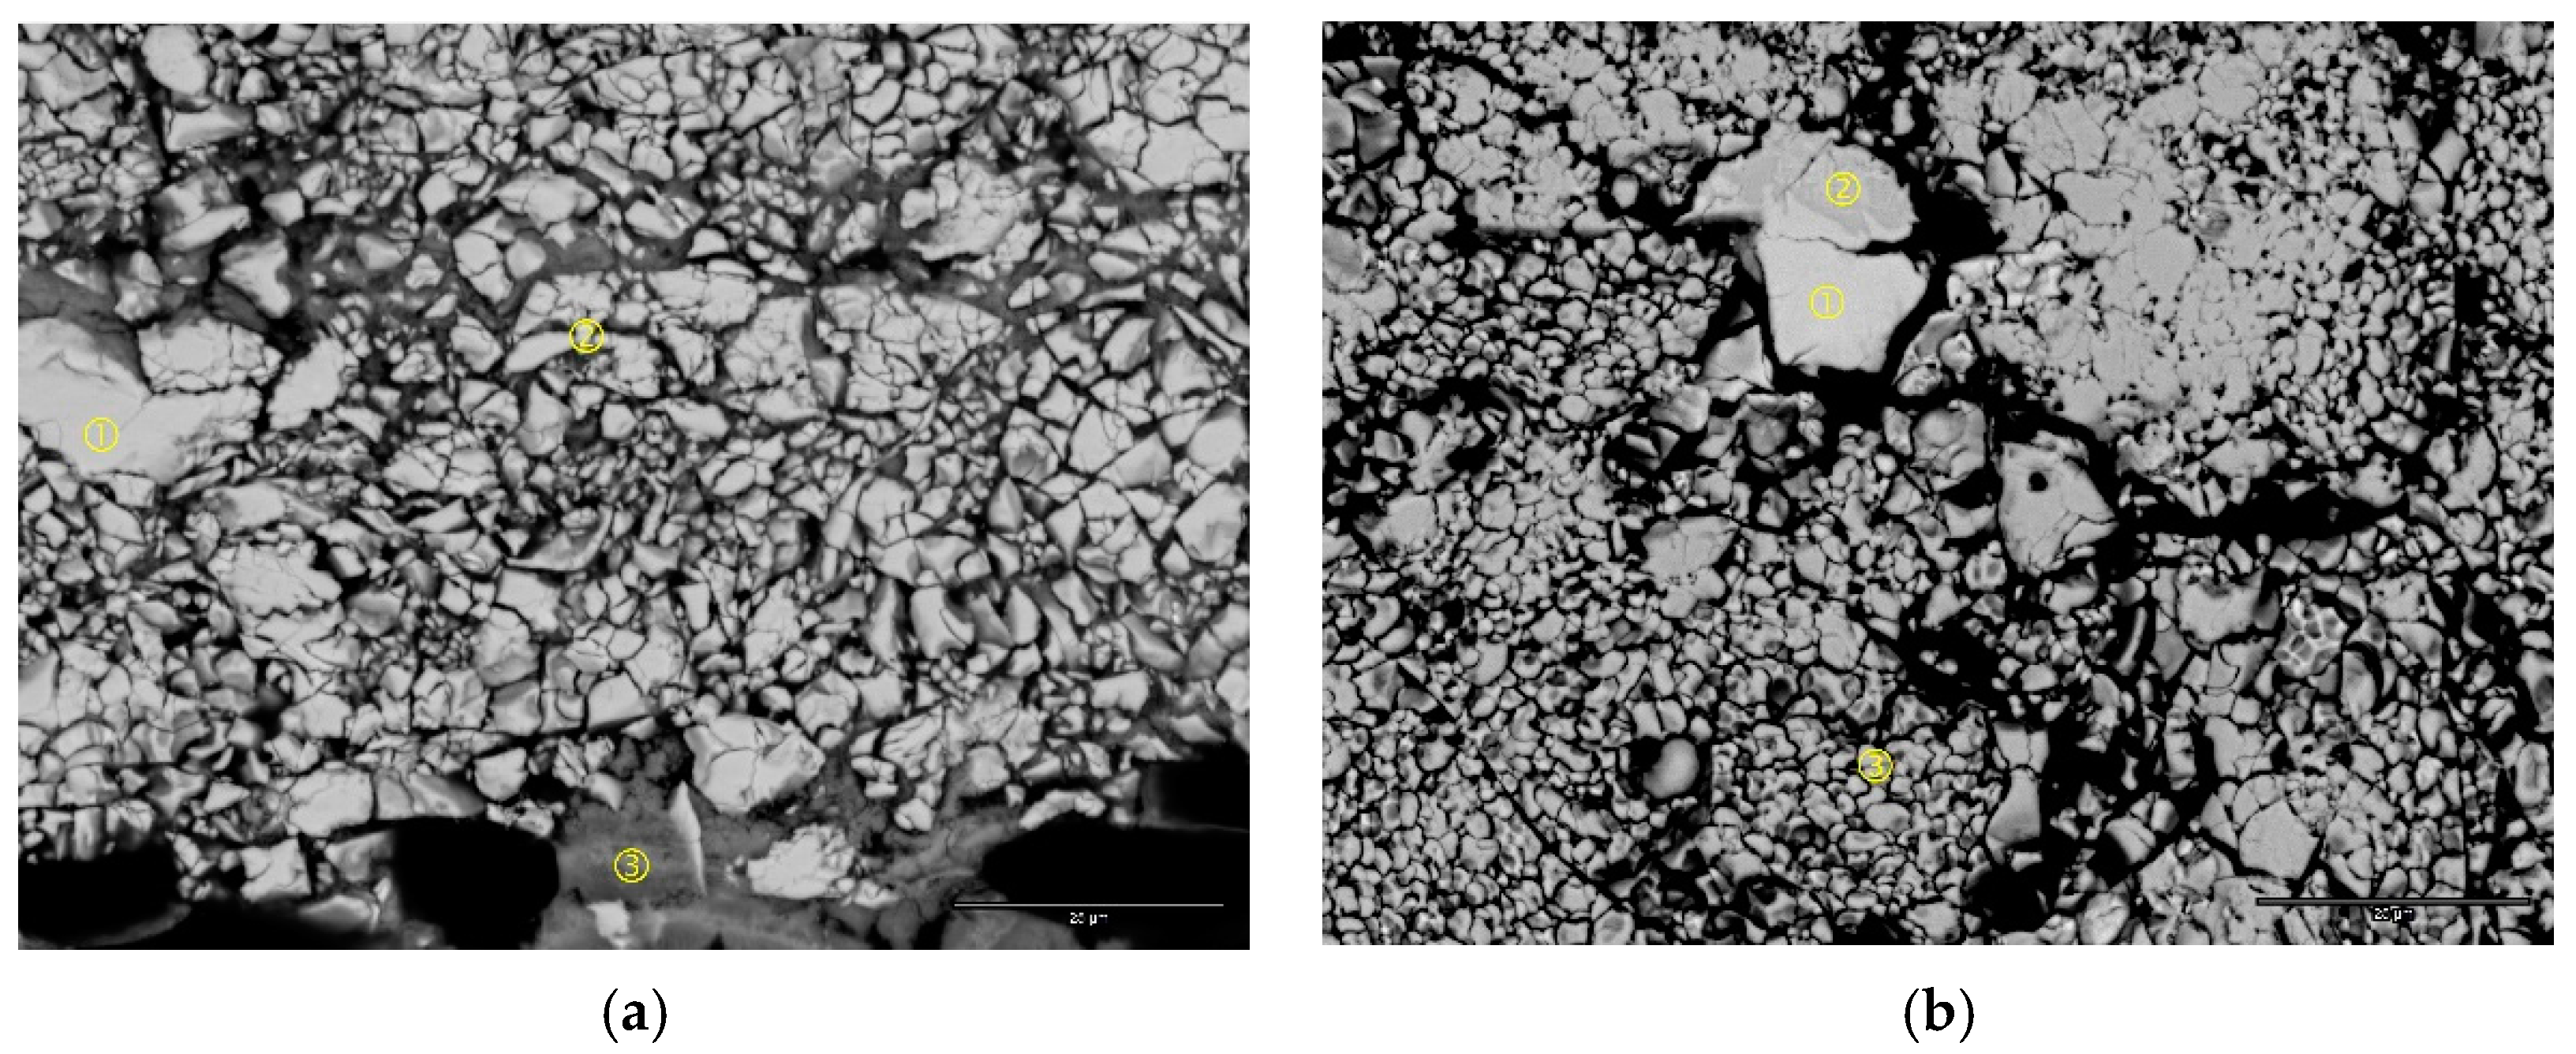
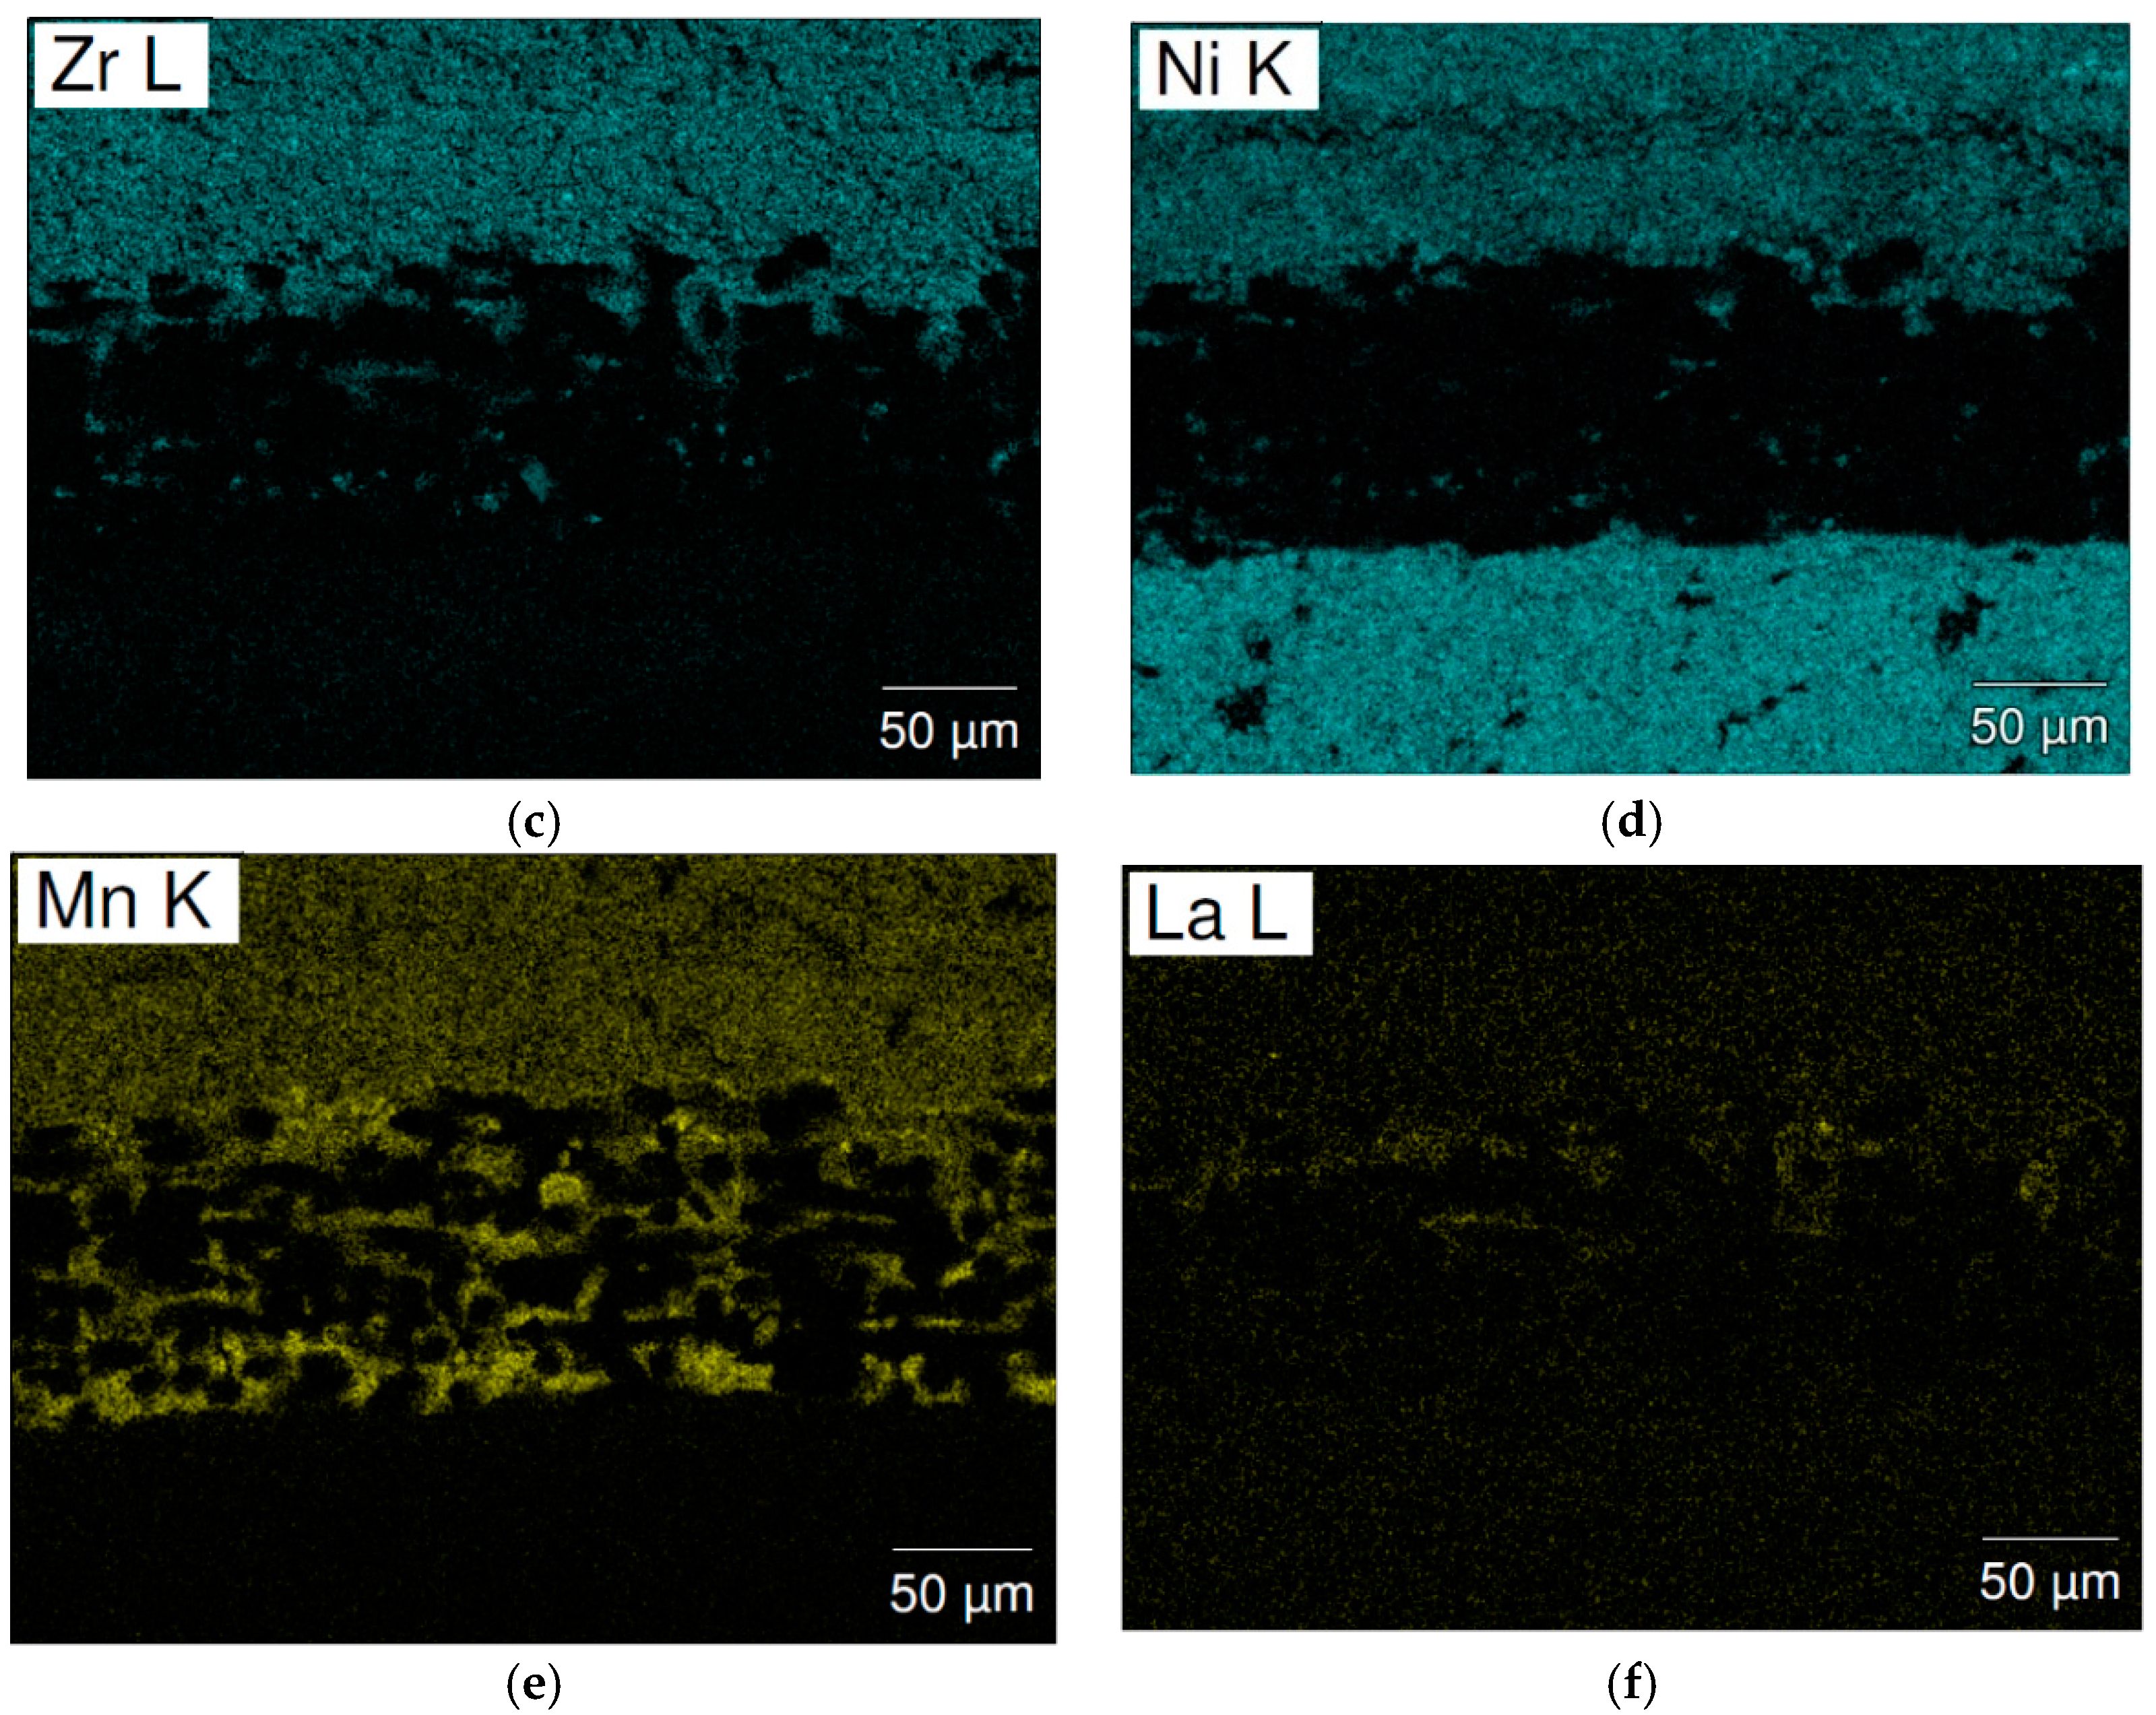
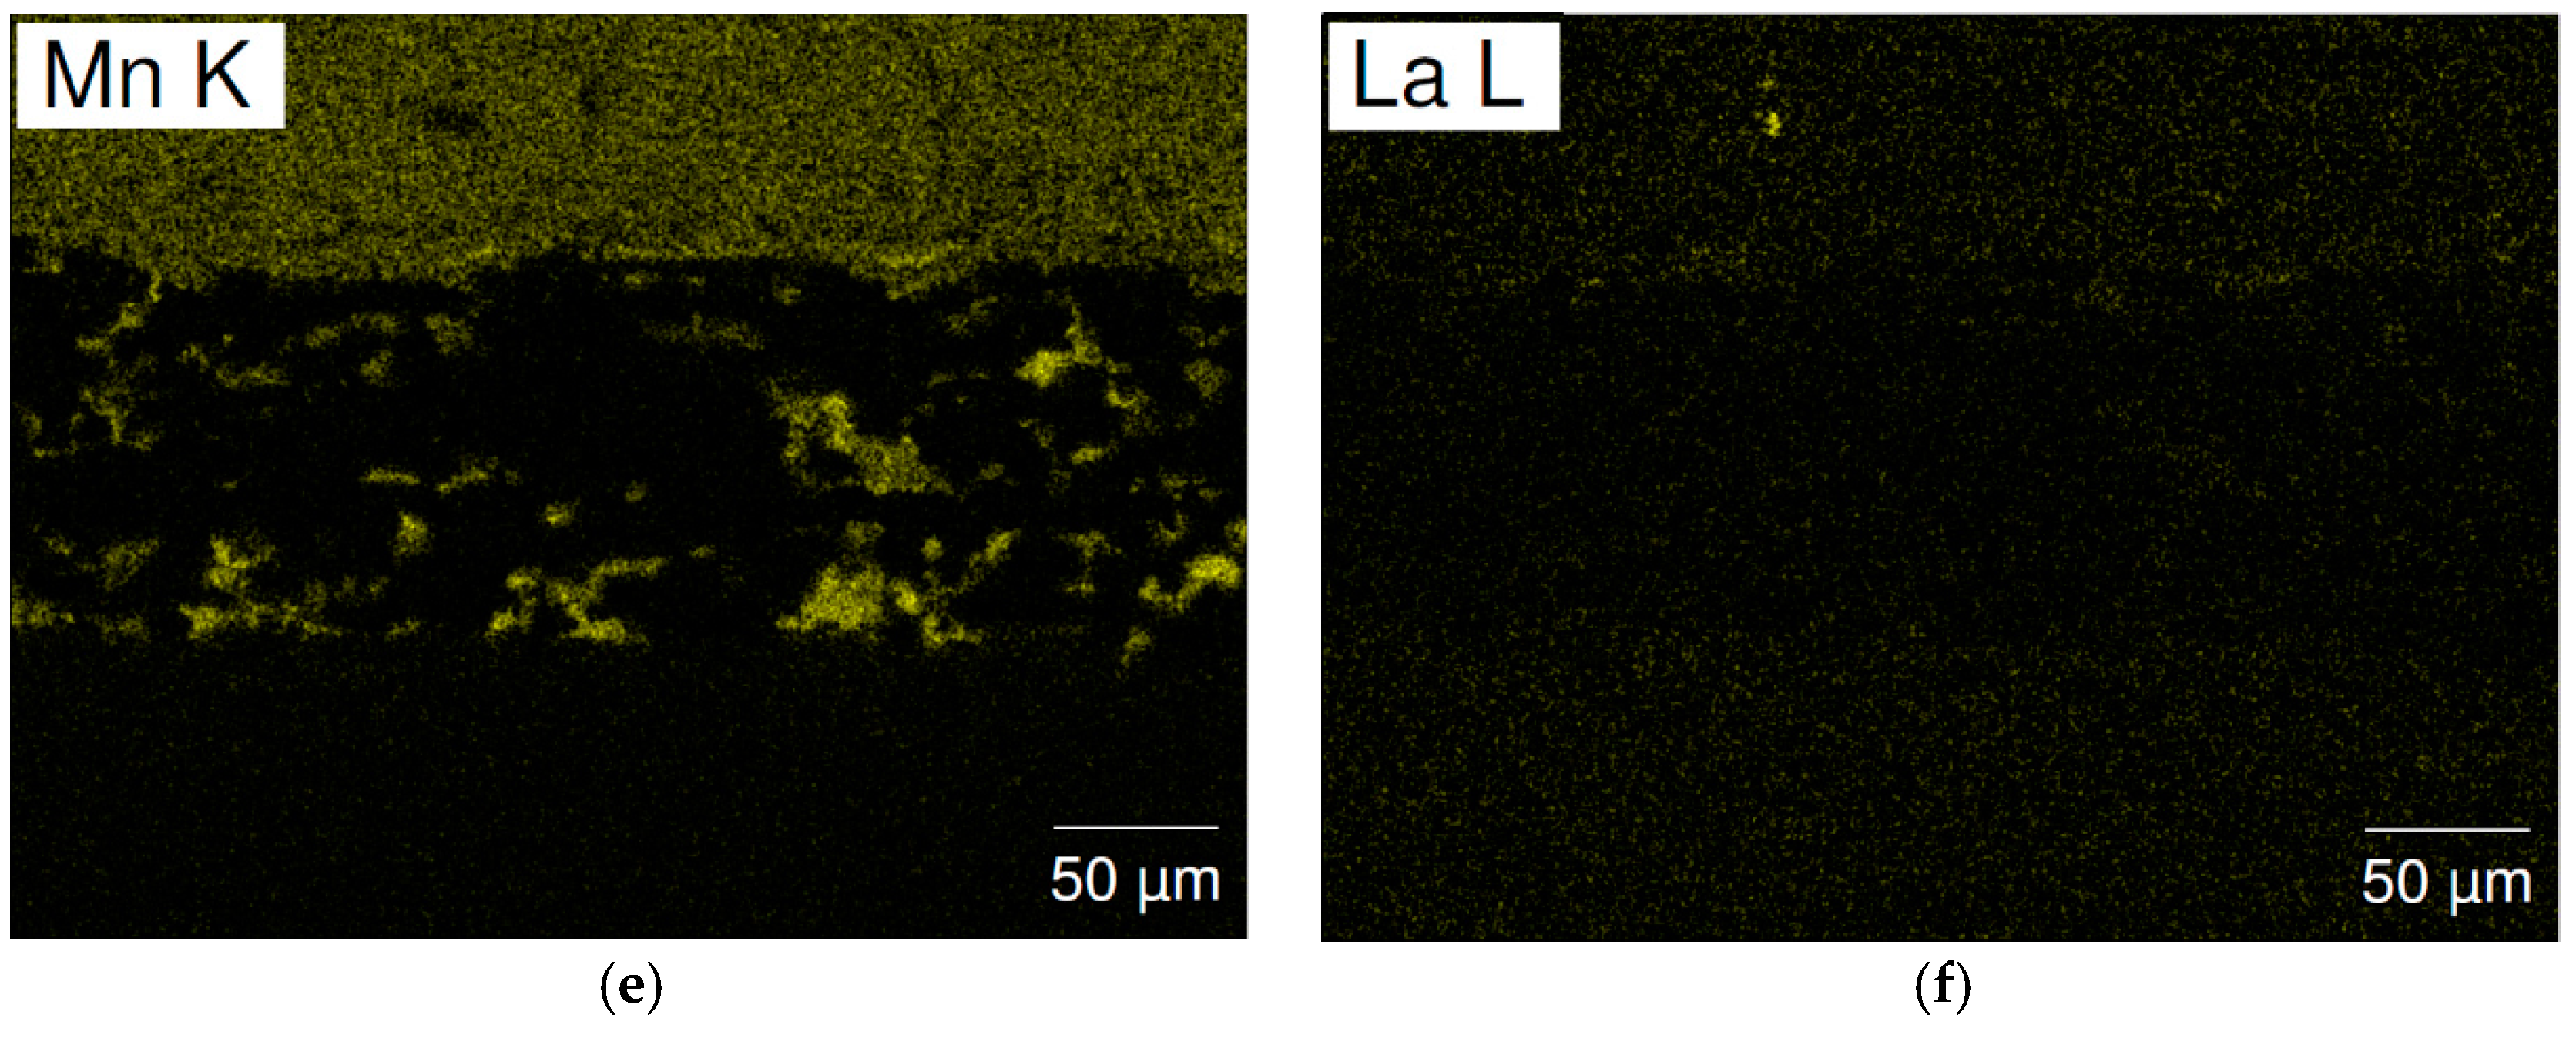
3.6. Failure Analysis of C15 and C15A
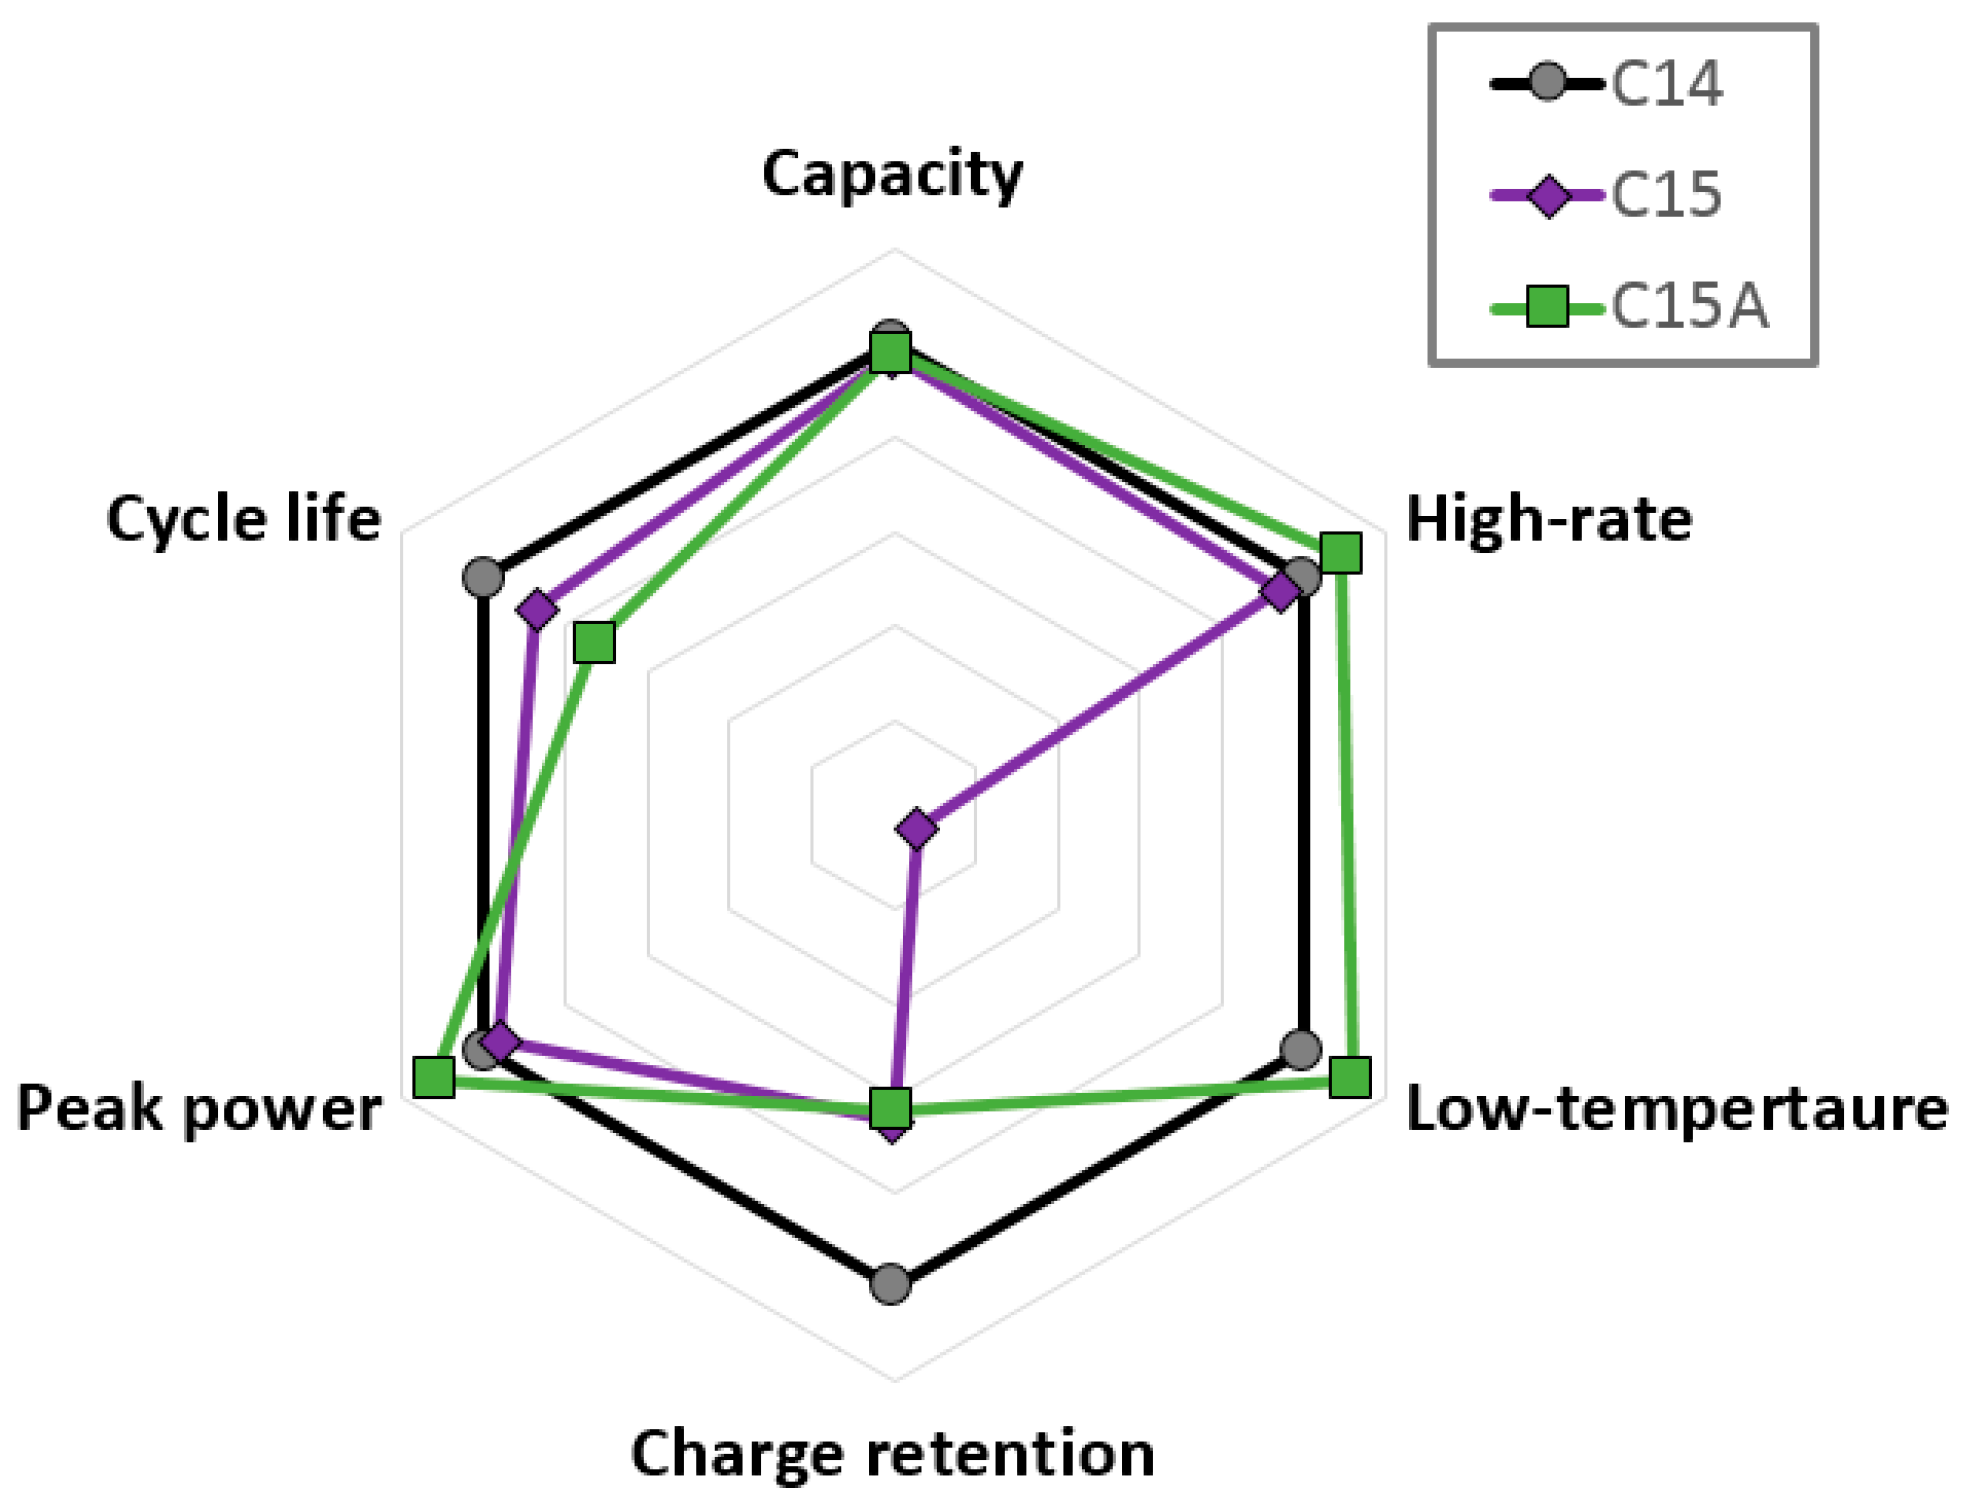
3.7. Performance Comparison
4. Conclusions
Acknowledgments
Author Contributions
Conflicts of Interest
Abbreviations
| Ni/MH | Nickel/metal hydride |
| MH | Metal hydride |
| H-storage | Hydrogen-storage |
| GP | Gaseous phase |
| EC | Electrochemical |
| HR | High rate |
| HT | High temperature |
| LT | Low temperature |
| PCT | Pressure-composition-temperature |
| HRD | High-rate dischargeability |
| Io | Surface exchange current |
| D | Diffusion constant |
| MS | Saturated magnetic susceptibility |
| XRD | X-ray diffraction |
| N/P | Negative electrode to positive electrode |
| DOD | Depth of discharge |
| Voc | Open-circuit voltage |
| R | Internal resistance |
| RT | Room temperature |
| SOC | State-of-charge |
| SEM | Scanning electron microscope |
| EDS | Energy dispersive spectroscopy |
| V | Cell voltage |
| i | Discharge current |
| BEI | Backscattered electron image |
References
- Young, K.; Ng, K.Y.S.; Bendersky, L.A. A technical report of the Robust Affordable Next Generation Energy Storage System-BASF program. Batteries 2016, 2, 2. [Google Scholar] [CrossRef]
- Zelinsky, M.; Koch, J. Batteries and Heat—A Recipe for Success? Available online: www.battcon.com/PapersFinal2013/16-Mike%20Zelinsky%20-%20Batteries%20and%20Heat.pdf (accessed on 17 May 2017).
- Fetcenko, M.A.; Ovshinsky, S.A.; Young, K.; Reichman, B.; Fierro, C.; Koch, J.; Martin, F.; Mays, W.; Ouchi, T.; Sommers, B.; et al. High catalytic activity disordered VTiZrNiCrCoMnAlSn hydrogen storage alloys for nickel–metal hydride batteries. J. Alloy. Compd. 2002, 330, 752–759. [Google Scholar] [CrossRef]
- Young, K.; Nei, J.; Wan, C.; Denys, R.V.; Yartys, V.A. Comparison of C14- and C15-predominated AB2 metal hydride alloys for electrochemical applications. Batteries 2017, 3, 22. [Google Scholar] [CrossRef]
- Young, K.; Nei, J.; Ouchi, T.; Fetcenko, M.A. Phase abundances in AB2 metal hydride alloys and their correlations to various properties. J. Alloy. Compd. 2011, 509, 2277–2284. [Google Scholar] [CrossRef]
- Young, K.; Ouchi, T.; Meng, T.; Wong, D.F. Studies on the synergetic effects in multi-phase metal hydride alloys. Batteries 2016, 2, 15. [Google Scholar] [CrossRef]
- Young, K.; Ouchi, T.; Fetcenko, M.A. Pressure-composition-temperature hysteresis in C14 Laves phase alloys: Part 1. Simple ternary alloys. J. Alloy. Compd. 2009, 480, 428–433. [Google Scholar] [CrossRef]
- Young, K.; Huang, B.; Regmi, R.K.; Lawes, G.; Liu, Y. Comparisons of metallic clusters imbedded in the surface of AB2, AB5, and A2B7 alloys. J. Alloy. Compd. 2010, 506, 831–840. [Google Scholar] [CrossRef]
- Young, K.; Wang, L.; Yan, S.; Liao, X.; Meng, T.; Shen, H.; Mays, W.C. Fabrications of high-capacity alpha-Ni(OH)2. Batteries 2017, 3, 6. [Google Scholar] [CrossRef]
- Young, K.; Wu, A.; Qiu, Z.; Tan, J.; Mays, W. Effects of H2O2 addition to the cell balance and self-discharge of Ni/MH batteries with AB5 and A2B7 alloys. Int. J. Hydrogen Energy 2012, 37, 9882–9891. [Google Scholar] [CrossRef]
- Kleperis, J.; Wójcik, G.; Czerwinski, A.; Showronski, J.; Kopczyk, M.; Beĺtowska-Brzezinska, M. Electrochemical behavior of metal hydride. J. Solid State Electrochem. 2001, 5, 229–249. [Google Scholar] [CrossRef]
- Young, K.; Ouchi, T.; Fetcenko, M.A. Roles of Ni, Cr, Mn, Sn, Co, and Al in C14 Laves phase alloys for NiMH battery application. J. Alloy. Compd. 2009, 476, 774–781. [Google Scholar] [CrossRef]
- Young, K.; Ouchi, T.; Koch, J.; Fetcenko, M.A. Compositional optimization of vanadium-free hypo-stoichiometric AB2 metal hydride alloy for Ni/MH battery application. J. Alloy. Compd. 2012, 510, 97–106. [Google Scholar] [CrossRef]
- Young, K.; Wong, D.F.; Yasuoka, S.; Ishida, J.; Nei, J.; Koch, J. Different failure modes for V-containing and V-free AB2 metal hydride alloys. J. Power Sources 2014, 251, 170–177. [Google Scholar] [CrossRef]
- Zhou, X.; Young, K.; West, J.; Regalado, J.; Cherisol, K. Degradation mechanisms of high-energy bipolar nickel metal hydride battery with AB5 and A2B7 alloys. J. Alloy. Compd. 2013, 580, S373–S377. [Google Scholar] [CrossRef]
- Wang, L.; Young, K.; Meng, T.; English, N.; Yasuoka, S. Partial substitution of cobalt for nickel in mixed rare earth metal based superlattice hydrogen absorbing alloy—Part 2 battery performance and failure mechanism. J. Alloy. Compd. 2016, 664, 417–427. [Google Scholar] [CrossRef]
- Kong, L.; Chen, B.; Young, K.; Koch, J.; Chan, A.; Li, W. Effects of Al- and Mn-contents in the negative MH alloy on the self-discharge and long-term storage properties of Ni/MH battery. J. Power Sources 2012, 213, 128–139. [Google Scholar] [CrossRef]
- Young, K.; Wong, D.F.; Ouchi, T.; Huang, B.; Reichman, B. Effects of La-addition to the structure, hydrogen storage, and electrochemical properties of C14 metal hydride alloys. Electrochim. Acta 2015, 174, 815–825. [Google Scholar] [CrossRef]
- Young, K.; Chang, S.; Lin, X. C14 Laves phase metal hydride alloys for Ni/MH batteries application. Batteries 2017. submitted to publication. [Google Scholar] [CrossRef]
- Shinyama, K.; Magari, Y.; Kumagae, K.; Nakamura, H.; Nohma, T.; Takee, M.; Ishiwa, K. Deterioration mechanism of nickel metal-hydride batteries for hybrid electric vehicles. J. Power Sources 2005, 141, 193–197. [Google Scholar] [CrossRef]
- Zhu, W.H.; Zhu, Y.; Tatarchuk, B.J. Self-discharge characteristics and performance degradation of Ni-MH batteries for storage applications. Int. J. Hydrogen Energy 2014, 39, 19789–19798. [Google Scholar] [CrossRef]
- Nakano, H.; Wakao, S. Substitution effect of elements in Zr-based alloys with Laves phase of nickel-hydride battery. J. Alloy. Compd. 1995, 231, 587–593. [Google Scholar] [CrossRef]
- Nakano, H.; Wakao, S.; Shimizu, T. Correlation between crystal structure and electrochemical properties of C14 Laves-phase alloys. J. Alloy. Compd. 1997, 253–254, 609–612. [Google Scholar] [CrossRef]
- Young, K.; Ouchi, T.; Huang, B.; Chao, B.; Fetcenko, M.A.; Bendersky, L.A.; Wang, K.; Chiu, C. The correlation of C14/C15 phase abundance and electrochemical properties in the AB2 alloys. J. Alloy. Compd. 2010, 506, 841–848. [Google Scholar] [CrossRef]
- Song, X.; Zhang, X.; Leo, Y.; Wang, Q. Effect of microstructure on the properties of Zr-Mn-V-Ni AB2 type hydride electrode alloys. Int. J. Hydrogen Energy 1999, 24, 455–459. [Google Scholar] [CrossRef]
- Young, K.; Ouchi, T.; Lin, X.; Reichman, B. Effects of Zn-addition to C14 metal hydride alloys and comparisons to Si, Fe, Cu, Y, and Mo-additives. J. Alloy. Compd. 2016, 655, 50–59. [Google Scholar] [CrossRef]
- Young, K.; Fetcenko, M.A.; Li, F.; Ouchi, T. Structural, thermodynamic, and electrochemical properties of TixZr1–x(VNiCeMnCiAl)2 C14 Laves phase alloys. J. Alloy. Compd. 2008, 464, 238–247. [Google Scholar] [CrossRef]
- Jacob, I.; Stern, A.; Moran, A.; Shaltiel, D.; Davidov, D. Hydrogen absorption in (ZrxTi1‒x)B2 (B ≡ Cr, Mn) and the phenomenological model for the absorption capacity in pseudo-binary Laves-phase compound. J. Less-Common Met. 1980, 73, 369–376. [Google Scholar] [CrossRef]
- Huot, J.; Akiba, E.; Ogura, T.; Ishido, Y. Crystal structure, phase abundance and electrode performance of Laves phase compounds (Zr, A)V0.5Ni1.1Mn0.2Fe0.2 (A ≡ Ti, Nb or Hf). J. Alloy. Compd. 1995, 218, 101–109. [Google Scholar] [CrossRef]
- Young, K.; Ouchi, T.; Fetcenko, M.A. Pressure-composition-temperature hysteresis in C14 Laves phase alloys: Part 3. Empirical formula. J. Alloy. Compd. 2009, 480, 440–448. [Google Scholar] [CrossRef]
- Trapanese, M.; Franzitta, V.; Viola, A. Description of hysteresis of nickel metal hydride battery. In Proceedings of the 38th Annual Conference on IEEE Industrial Electronics Society, Montreal, QC, Canada, 25–28 October 2012; pp. 967–970. [Google Scholar]
- Trapanese, M.; Franzitta, V.; Viola, A. Description of hysteresis in lithium battery by classical Preisach model. Adv. Mater. Res. 2013, 622, 1099–1103. [Google Scholar]
- Trapanese, M.; Franzitta, V.; Viola, A. The Jiles Atherton model for description on hysteresis in lithium battery. In Proceedings of the Twenty-Eighth Annual IEEE Applied Power Electronics Conference and Exposition (APEC), Long Beach, CA, USA, 17–21 March 2013; pp. 2772–2775. [Google Scholar]


| Properties | Alloy C14 | Alloy C15 | Alloy C15A |
|---|---|---|---|
| Composition | Zr21.5Ti12.0V10.0Cr7.5Mn8.1Co8.0Ni32.2Sn0.3Al0.4 | Zr25.0Ti6.5V3.9Mn22.2Fe3.8Ni38.0Sn0.3La0.3 | Same as C15 |
| Preparation | Vacuum induction melting | Vacuum induction melting | Vacuum induction melting |
| Annealing | No | No | 960 °C for 6 h |
| Minor phases | C15 (5.2%) + TiNi (1.2%) | ZrNi (0.7%) | Not detectable by XRD |
| GP full capacity | 1.45% | 1.46% | 0.95% |
| GP reversible capacity | 1.32% | 1.44% | 0.94% |
| GP desorption pressure (MPa) | 0.078 | 0.87 | 0.90 |
| GP hysteresis | 0.04 | 0.13 | 0.31 |
| EC capacity (mAh·g−1) | 354 | 311 | 277 |
| EC HRD | 0.90 | 0.99 | 0.98 |
| D (10−10·cm2s−1) | 2.5 | 2.4 | 1.6 |
| Io (mA·g−1) | 22.5 | 46.8 | 39.4 |
| MS (memu·g−1) | 37 | 42 | 17 |
| Properties | Cell C14 | Cell C15 | Cell C15A |
|---|---|---|---|
| Negative electrode thickness (mm) | 0.328 | 0.322 | 0.318 |
| Weight (g) | 22.8 | 26.8 | 25.3 |
| Positive electrode thickness (mm) | 0.840 | 0.775 | 0.778 |
| Weight (g) | 27.0 | 26.7 | 26.8 |
| Electrolyte amount (cc) | 6.82 | 7.98 | 6.86 |
| N/P | 1.3 | 1.4 | 1.4 |
| RT-capacity @C/5 (Ah) | 4.88 | 4.74 | 4.77 |
| RT-capacity @C/2 (Ah) | 4.71 | 4.67 | 4.71 |
| RT-capacity @C (Ah) | 4.57 | 4.64 | 4.69 |
| RT-capacity @2C (Ah) | 3.87 | 3.66 | 4.24 |
| LT-capacity @C/2 (Ah) | 3.29 | 0.19 | 3.69 |
| Energy density (Wh·kg−1) | 73 | 73 | 75 |
| Energy density (Wh·l−1) | 241 | 236 | 239 |
| Change retention @ 30 days | 35% | 54% | 56% |
| Maximum peak power (W·kg−1) | 157 | 151 | 176 |
| Cycle life- C/2 | 350 | 305 | 255 |
| Cycle life- C | 180 | 100 | 60 |
| Location | Ni | Co | Zn | Ti | Zr | Mn | Comment |
|---|---|---|---|---|---|---|---|
| Figure 8a-1 | 3.8 | 95.9 | - | - | 0.3 | - | Co |
| Figure 8a-2 | 33.5 | 60.2 | 0.8 | 0.4 | 5.1 | - | CoO |
| Figure 8a-3 | 86.4 | 9.2 | 2.1 | 0.4 | 1.8 | Ni(OH)2 | |
| Figure 8a-4 | 85.8 | 5.8 | 3.2 | 0.1 | 4.8 | 0.3 | Ni(OH)2 |
| Figure 8b-1 | 2.9 | 96.9 | 0.2 | - | - | - | Co |
| Figure 8b-2 | 43.6 | 52.6 | 1.1 | - | 2.6 | - | CoO |
| Figure 8b-3 | 87.7 | 5.8 | 2.9 | - | 3.5 | - | Ni(OH)2 |
| Figure 8b-4 | 84.2 | 2.4 | 2.5 | - | 10.8 | - | Ni(OH)2 |
| Figure 8b-5 | 87.1 | 5.5 | 2.9 | - | 1.0 | 3.5 | Ni(OH)2 |
| Location | Ti | Zr | V | Mn | Fe | Ni | La | B/A |
|---|---|---|---|---|---|---|---|---|
| Figure 10a-1 | 6.9 | 24.5 | 3.5 | 21.3 | 3.6 | 40.2 | - | 2.18 |
| Figure 10a-2 | 5.5 | 24.2 | 4.4 | 24.7 | 5.0 | 36.2 | - | 2.36 |
| Figure 10a-3 | 4.3 | 17.3 | 11.0 | 61.8 | 9.7 | 3.4 | 2.4 | 3.51 |
| Figure 10b-1 | 7.5 | 25.1 | 4.3 | 17.5 | 4.8 | 40.7 | 0.1 | 2.06 |
| Figure 10b-2 | 8.1 | 33.4 | 0.4 | 1.5 | 0.4 | 56.1 | - | 1.40 |
| Figure 10b-3 | 6.3 | 25.4 | 3.7 | 22.4 | 4.1 | 38.1 | - | 2.16 |
© 2017 by the authors. Licensee MDPI, Basel, Switzerland. This article is an open access article distributed under the terms and conditions of the Creative Commons Attribution (CC BY) license (http://creativecommons.org/licenses/by/4.0/).
Share and Cite
Young, K.-H.; Koch, J.M.; Wan, C.; Denys, R.V.; Yartys, V.A. Cell Performance Comparison between C14- and C15-Predomiated AB2 Metal Hydride Alloys. Batteries 2017, 3, 29. https://doi.org/10.3390/batteries3040029
Young K-H, Koch JM, Wan C, Denys RV, Yartys VA. Cell Performance Comparison between C14- and C15-Predomiated AB2 Metal Hydride Alloys. Batteries. 2017; 3(4):29. https://doi.org/10.3390/batteries3040029
Chicago/Turabian StyleYoung, Kwo-Hsiung, John M. Koch, Chubin Wan, Roman V. Denys, and Volodymyr A. Yartys. 2017. "Cell Performance Comparison between C14- and C15-Predomiated AB2 Metal Hydride Alloys" Batteries 3, no. 4: 29. https://doi.org/10.3390/batteries3040029
APA StyleYoung, K.-H., Koch, J. M., Wan, C., Denys, R. V., & Yartys, V. A. (2017). Cell Performance Comparison between C14- and C15-Predomiated AB2 Metal Hydride Alloys. Batteries, 3(4), 29. https://doi.org/10.3390/batteries3040029