Abstract
The performance of cylindrical cells made from negative electrode active materials of two selected AB2 metal hydride chemistries with different dominating Laves phases (C14 vs. C15) were compared. Cells made from Alloy C15 showed a higher high-rate performance and peak power with a corresponding sacrifice in capacity, low-temperature performance, charge retention, and cycle life when compared with the C14 counterpart (Alloy C14). Annealing of the Alloy C15 eliminated the ZrNi secondary phase and further improved the high-rate and peak power performance. This treatment on Alloy C15 showed the best low-temperature performance, but also contributed to a less-desirable high-temperature voltage stand and an inferior cycle stability. While the main failure mode for Alloy C14 in the sealed cell is the formation of a thick oxide layer that prevents gas recombination during overcharge and consequent venting of the cell, the failure mode for Alloy C15 is dominated by continuous pulverization related to the volumetric changes during hydride formation and hysteresis in the pressure-composition-temperature isotherm. The leached-out Mn from Alloy C15 formed a high density of oxide deposits in the separator, leading to a deterioration in charge retention performance. Large amounts of Zr were found in the positive electrode of the cycled cell containing Alloy C15, but did not appear to harm cell performance. Suggestions for further composition and process optimization for Alloy C15 are also provided.
1. Introduction
Nickel/metal hydride (Ni/MH) battery technology is important for future transportation [1] and stationary energy storage applications [2]. Using Laves phase-based AB2 metal hydrides (MHs) as the active material in the negative electrode can increase the gravimetric energy of a Ni/MH battery [3]. Two different Laves phases MH alloys are available for the electrochemical applications, specifically a C14 with a hexagonal crystal structure and a C15 with a face-centered-cubic crystal structure. Both structures have the same number of tetrahedral hydrogen occupation sites per AB2 formula, which are indicted by yellow (A2B2), blue (AB3), and pink (B4) tetrahedrons in Figure 1. Comparisons in crystal structure, hydrogen-storage (H-storage) characteristics in the gaseous phase (GP), and electrochemical (EC) properties of these two state-of-art representatives were reported in a separate paper [4]. It was suggested that the C14-predominated MH alloy was more suitable for high-capacity and long-life applications, while the C15-predominated MH alloy can be used in areas requiring improved high-rate (HR) and low-temperature (LT) performances [5]. In order to verify the prediction from the previous half-cell study, complete sealed cells (C-size) were made from a C14- and a C15-predominated MH alloys and their electrochemical performances were evaluated and compared in this study.
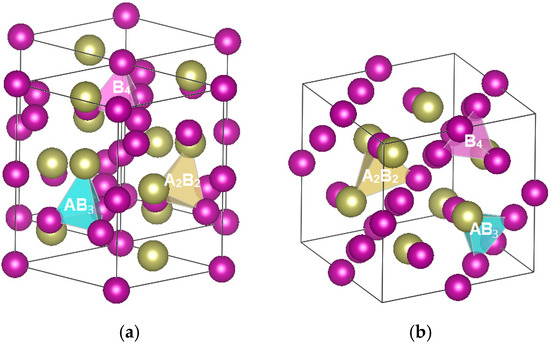
Figure 1.
Schematics of (a) a C14 and (b) a C15 crystal structures. Yellow, blue, and pink tetrahedrons are the A2B2, AB3, and B4 hydrogen occupation sites, respectively.
Two compositions, Zr21.5Ti12.0V10.0Cr7.5Mn8.1Co8.0Ni32.2Sn0.3Al0.4 (Alloy C14) and Zr25.0Ti6.5V3.9Mn22.2Fe3.8Ni38.0La0.3 (Alloy C15), were selected for this comparative study. Since the annealing effects on the C14 MH alloys were well studied and previously reported, only part of the ingot from the Alloy C15 was annealed at 960 °C for 3 h (Alloy C15A). The structures, and GP and EC H-storage characteristics of these three alloys (C14, C15, and C15A) have been studied before [4] and the results are summarized in Table 1. The Alloy C14 has a C14 major phase and two secondary phases (C15 and TiNi), while Alloy C15 is predominately C15 with a ZrNi secondary phase, which was eliminated upon annealing and formation of Alloy C15A, and is very close to a single-phase alloy according to X-ray diffractometer (XRD) studies. The GP full capacities of Alloy C14 and Alloy C15 are similar, and that in C15A is much reduced, due to the lack of a beneficial secondary phase to create synergetic effects [6]. The hydrogen equilibrium plateau pressures of Alloy C15 and Alloy C15A are one order of magnitude higher than that of Alloy C14, which may cause an early venting in a sealed cell. The hysteresis in the pressure-composition-temperature (PCT) isotherms of Alloy C14 is much smaller than those in Alloy C15 and Alloy C15A, which contributes to a better mechanical integrity during pulverization [7]. The EC capacities of Alloy C15 and Alloy C15A are considerably lower than that of Alloy C14, due to the open-air configuration in the half-cell measuring apparatus, where the MH alloy cannot be charged much higher than 0.1 MPa (one atmosphere). The high-rate dischargeability (HRD) of Alloy C15 is higher than that of Alloy C14, due to a higher surface exchange current (Io). Annealing of C15A reduced both the diffusion coefficient (D) and Io, compared to Alloy C15. The relatively low Io of Alloy C15A is the result of the reduced amount of catalytic Ni-inclusions [8] on the surface, due to annealing, as judged by the relatively low saturated magnetic susceptibility (MS).

Table 1.
Summary of properties of alloys used in this study [4]. GP and EC denote gaseous phase and electrochemistry, respectively. HRD, D, Io, and MS represent high-rate dischargeability, diffusion constant, surface exchange current, and saturated magnetic susceptibility. XRD: X-ray diffraction.
2. Experimental Setup
Cylindrical Ni/MH batteries (C-size) were assembled for electrochemical testing. A photograph of cells before and after closing is shown in Figure 2a. MH alloy powder was attained from an induction melting-prepared ingot (2 kg batch size) with hydrogenation and mechanical grinding to a −200 mesh size. The MH alloy powder was dry-compacted onto a nickel mesh substrate by a compaction mill and formed into negative electrodes, while the counter positive electrode was pasted with a mixture of 89% standard AP50 [9] Ni0.91Co0.045Zn0.045(OH)2 (BASF-Ovonic, Rochester Hills, MI, USA), 5 wt% Co, and 6% CoO powders into a nickel foam substrate. Photographic examples of both electrodes are shown in Figure 2b. Scimat 700/79 acrylic acid grafted polypropylene/polyethylene separators were used (Freudenberg Group, Weinheim, Germany). The negative-to-positive capacity ratio (N/P) was set at 1.3 to 1.4 to maintain a good balance between the over-charge and over-discharge reservoirs [10]. A 30% KOH solution with LiOH (1.5 wt%) additive was used as the electrolyte. After the electrodes/separator were coiled into a jelly roll bundle, the bundle was inserted into the empty can, and the cell assembly was filled with electrolyte to the top then allowed to rest for 30 min before the un-absorbed electrolyte was sucked out through a plastic pipette. The amount of electrolyte absorbed was calculated from the weight difference between the before and after electrolyte filling steps. Twenty cells were built with each alloy for use in benchmark performance testing. An electrochemical formation process was performed using a Maccor Battery Cycler (Maccor, Tulsa, OK, USA) after the batteries were sealed, and was composed of six cycles of charging at a 0.1C rate to 50%, 100%, 120%, 150%, 150%, and 150% of the calculated capacity and a 0.2 C discharge rate (except the sixth cycle using a 0.5 C discharge rate) to a cutoff voltage of 0.9 V.
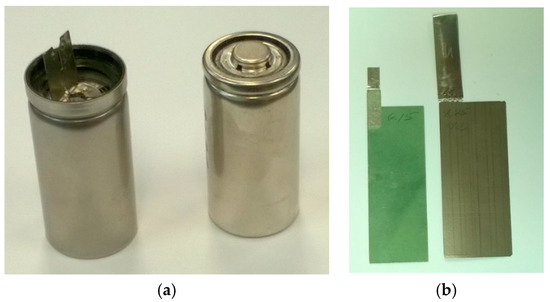
Figure 2.
Photographs of (a) C-sized cells before (left) and after (right) closing; and (b) a pasted positive electrode (left) and a compacted negative electrode (right).
Cells from each alloy were cycled for 20 cycles and the peak power of the cells was measured for each cycle at a 50% depth of discharge (DOD) using a pulse-discharge method. In each measurement, the cell was discharged first at a rate of C/3 to 50% DOD, followed by a 2/3C pulse for a period of 30 s. The resistivity was calculated by dividing the difference in voltages with the different in currents. Peak power was obtained by the formula:
where the Voc and R represent open-circuit voltage (electromotive force) and internal resistance, respectively. Charge retention was measured at the end of the 7th, 14th, and 30th days at room temperature (RT) after full charging at a 0.1 C rate in the beginning of the test. The remaining capacity after each testing period was discharged at a rate of 0.2 C and was normalized to a 0.2 C discharge capacity before the charge retention experiment. The shelf life in each cell was measured by placing a 100% state-of-charge (SOC) battery (charged at 0.2 C) in an oven at 45 °C and recording the Voc decay every 15 days until the Voc dropped to 0 V. The cells were cooled to RT to test the capacity loss after three cycles of charge to 150% SOC at 0.1 C, followed by discharge to 0.9 V at 0.2 C. The capacity at cycle 3 was compared with the original formation capacity to determine the charge retention.
Peak power = ¼ Voc2/R
The cycle life of each cell was tested under a 0.5 C rate charge/discharge cycling at RT with a discharge cutoff voltage of 0.9 V. The charging process was terminated using a −ΔV method, specifically a 3 mV (or 5 mV) voltage drop from the maximum cell voltage. The voltage drop indicated the end of the charging process, when oxygen began to evolve at the positive electrode. The recombination of oxygen from the positive electrode with hydrogen from the negative electrode released heat and caused the voltage to drop, in accordance with the Nernst equation. End of life was reached when the measured capacity dropped below 50% of the initial capacity immediately after activation.
For the failure mechanism analysis, a JEOL-JSM6320F scanning electron microscope (SEM, JEOL, Tokyo, Japan) with energy dispersive spectroscopy (EDS) capability was used to study the morphology and composition of the electrodes after cycling. A Philips X'Pert Pro X-ray diffractometer (XRD, Philips, Amsterdam, The Netherlands) was used to study the crystal structure of the negative electrode after cycling. A JEOL JSM7100 field-emission SEM with EDS capability was used to map metal oxides that migrated into the separator.
3. Results and Discussion
Cylindrical cells (C-size) were made with Alloys C14, C15, and C15A. The thickness and weight of both electrodes of the cells used for the capacity measurement are listed in Table 2. The weight of the negative electrode in the cell with Alloy C14 (cell C14) is smaller due to consideration for its relatively higher EC capacity (Table 1) and match in N/P ratio. The amount of electrolyte in the cell containing Alloy C15 (cell C15) is approximately 1 cc larger than the other two cells, due to the consumption of electrolyte from the oxidation of alloy surface in the electrolyte-filling process. In the following sections, a few key battery performances (HR, LT, charge retention, peak power, and cycle life) of cells C14, C15, and C15A are compared.

Table 2.
Summary of cell builds and performance results. LT-Cap was obtained at −10 °C with a C/2 rate to a cutoff voltage of 0.9 V.
3.1. Room-Tempearture Capacities with Various Discharge Rates
The discharge voltage profiles measured at RT and under four different discharge rates (C/5, C/2, C, and 2C) from cells C14, C15, and C15A are shown in Figure 3a–c, respectively. In the middle of the polarization curve (ohmic region) the cell voltage (V) is related to the discharge current (i) and Voc by the formula:
where R is the internal resistance. V decreases with increasing i, which explains the lower voltage profile with higher rate seen for each of the plots in Figure 3. Voc in cells containing Alloy C14 is expected to be lower than those in cells containing either the C15 or C15A alloy, due to the relatively low plateau pressure of Alloy C14 and the connection through Nernst equation [11]:
where EMH, eq is the equilibrium potential of H-storage electrode vs. the Hg/HgO reference electrode, and P(H2) is the equilibrium hydrogen gas pressure. An order of magnitude lower P(H2) for C14 results in a 29 mV voltage decrease. The voltage suppression with the increasing discharge current in cell C14 is worse than those from cells C15 and C15A, which correlated well with the low HRD in Alloy C14 found in the half-cell measurement [4]. The unstable voltage profile in the 2 C discharge curve of cell C15 shown in Figure 3b was from the competition between better active material utilization and lower voltage due to the increase in the cell temperature from the high-rate discharge. Capacities obtained with a cutoff voltage of 0.8 V for cells with all three alloys are listed in Table 2. Cell C14 showed the highest capacity measured at a C/5 rate, due to its relatively high loading in the positive electrode and its higher capacity. Cell C15A showed the highest capacity measured at the 2 C rate. The gravimetric and volumetric energy densities of these three cells were calculated by their capacity, weight, and volume, and these are listed in Table 2. Cell C15A has the highest gravimetric energy density due to its higher voltage and cell C14 has the highest volumetric energy density due to the largest loading in the positive electrode.
V = Voc − iR
EMH, eq (vs. Hg/HgO, in V) = −0.934 − 0.029 log P(H2) (in bar)
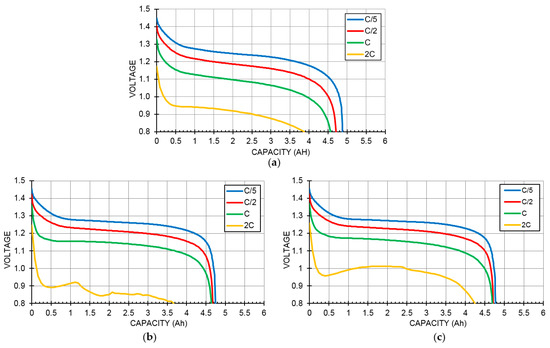
Figure 3.
Room-temperature discharge voltage curves with different rates (C/5, C/2, C, and 2C) for cells (a) C14; (b) C15; and (c) C15A.
3.2. Low-Temperature (−10 °C) Test
The low-temperature (LT) performances were evaluated at −10 °C using a C/2 rate discharge with a cut voltage of 0.9 V and results are listed in Table 2. Cell C15A shows the highest capacity in this run, due to its relatively high voltage, and cell C15 is the worst. Both cells C15 and C15A have higher Voc. However, the R in cell C15 is higher and, thus, contributed to worse HR and LT results. The comparison results in LT are the same as for HR, which is very common in Ni/MH battery studies [12]. The improvement in LT performance of Alloy C15A is not consistent with the decreased amount of embedded Ni on the activated surface and the lower surface reaction current, as previously highlighted [4]. This deviation in performance corresponds to the higher pulverization rate of Alloy C15A and the subsequent rapid increase in surface area, which contributes to the excellent HR and LT performances.
3.3. Charge Retention
Charge retention performances were compared in both RT storage and high temperature (HT, 45 °C) voltage stand measurements and the results are plotted in Figure 4. Although Alloy C14 has a relatively higher V-content (10% vs. 3.9% in Alloy C15), which is a major source of self-discharge [13], cell C14 showed the best RT charge retention result, with cell C15A showing a marginally better change retention than cell C15 did. Results from the high-temperature voltage stand are slightly different. While cell C14 showed the best HT voltage stand, which is consistent with the charge retention result, cell C15A exhibited a much worse HT voltage stand, compared to that from cell C15. The cause of this performance variation will be discussed in the failure analysis session.
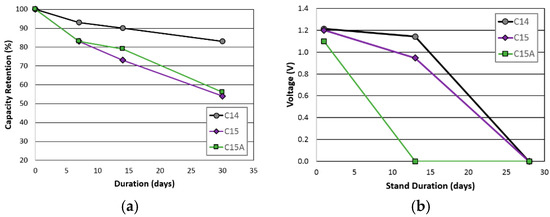
Figure 4.
(a) Room temperature charge retentions; and (b) 45 °C voltage stand for cells C14, C15, and C15A.
3.4. Peak Power
Peak powers at RT for the first 20 cycles were measured and results are plotted in Figure 5. In this test, the cells did not first go through the normal six-cycle activation process. In the peak power comparison, cell C14 quickly reached a maximum while cells C15 and C15A were comparatively slower. However, at the 20th cycle, cell C15A demonstrates the highest peak power, which correlates well with its high HR performance.
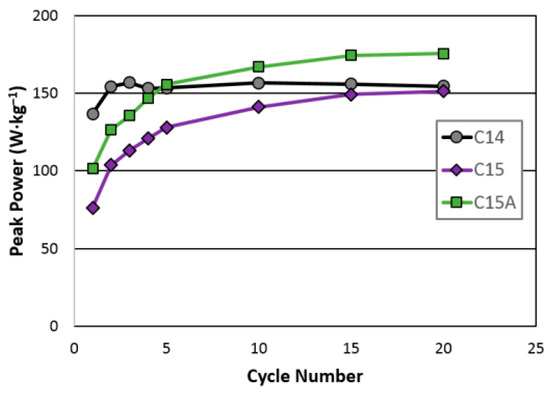
Figure 5.
Room-temperature peak powers for cells C14, C15, and C15A.
3.5. Cycle Life
Cycle life performances were compared with two testing schemes: a regular one consisting of C/2 charge/C/2 discharge with a narrower −ΔV cutoff set at 0.3 mV and a fast one with C charge/C discharge with a slightly wider −ΔV at 0.5 mV. These are shown in Figure 6a,b, respectively. Both tests were conducted at RT. Cell C14 showed the best cycle stability due to the balanced designed in composition. Cell C15A showed the least cycle stability due to a lack of both a Cr and TiNi phase. The sudden drop in capacity from cell C15A originated from the venting of the cell, causing electrolyte dry-out and an increase in R. Alloy C15A has the highest hydrogen equilibrium pressure in the PCT measurement, which causes the pressure to reach the venting pressure of the safety valve (2.8 MPa).
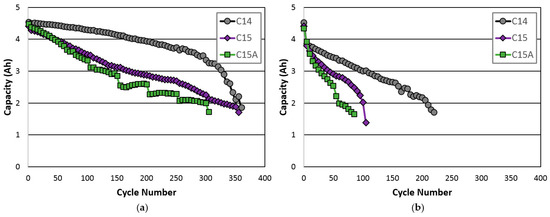
Figure 6.
Room-temperature cycle life from cells C14, C15, and C15A with (a) a C/2 charge, a C/2 discharge, a −ΔV cutoff voltage of 3 mV and (b) a C charge, a C discharge, and a −ΔV cutoff voltage of 5 mV.
3.6. Failure Analysis of C15 and C15A
The failure mechanism of the V-containing C14 MH alloy in Ni/MH batteries was earlier studied in detail, and the conclusions can be summarized as follows: a relatively thick oxide impeded the O2 gas-recombination during over-charge, causing venting and an increase in internal resistance [14]. Only failure analyses from Alloy C15 and Alloy C15A are discussed in this paper and compared to those results previously discovered for Alloy C14. Cells reaching the end of the C/2-C/2 cycling test (Figure 6a) were torn apart and the positive and negative electrodes, together with the separator, were studied. XRD patterns of the cycled positive electrodes show only a β-Ni(OH)2 phase (Figure 7). Two SEM backscattering electron images (BEI) of the cycled positive electrodes are shown in Figure 8. No fractures or evidence of pulverization can be seen, which is in agreement with the XRD analysis. Severe pulverization due to lattice expansion coming from the β–α transition in the MH alloy containing Al, an α-Ni(OH)2 promoter [9], was not observed here [15]. EDS analysis was taken in a few locations in each SEM micrograph and the results are summarized in Table 3. In both cases, incompletely dissolved Co (Spot 1) and CoO (Spot 2) added particles can be seen and larger amounts of Zr (leached from negative electrode) are found penetrating the spherical particles. Zr does not seem to promote the α-Ni(OH)2 formation and the Co-conductive network remains intact in both cases. From the evidence collected so far, we reach the conclusion that the positive electrode is not the main course of the capacity degradation in cells with C15 and C15A MH alloys.
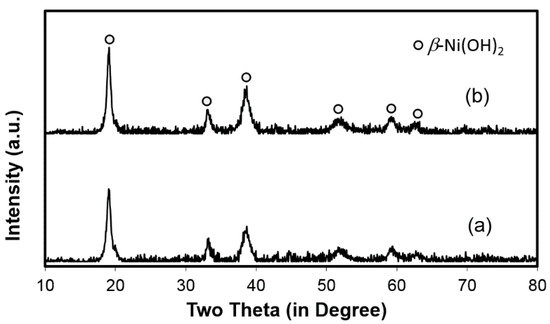
Figure 7.
XRD patterns of cycled positive electrodes from (a) cell C15 and (b) cell C15A.
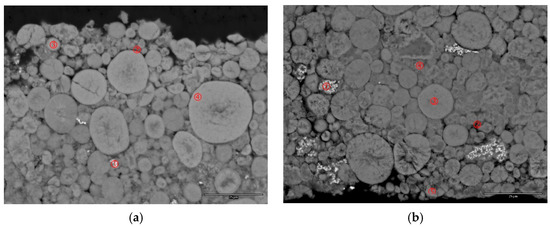
Figure 8.
SEM-BEI micrographs of cycled positive electrodes from (a) cell C15 and (b) cell C15A. The scale bar at the right lower corner represents 25 microns.

Table 3.
EDS results of selected areas in the cycled positive electrodes in Figure 9. Values are in at%.
XRD patterns of the cycled negative electrodes from both cells (C15 and C15A) (Figure 9) show no evidence of oxide nor microcrystalline metallic nickel (common products of oxidizing MH alloy [16]). SEM-BEI micrographs of the cycled negative electrodes from cells C15 and C15A are shown in Figure 10. Both pictures show high degrees of pulverization. The particles in the cycled negative electrode of cell C15A are finer than those from cell C15. In addition, more electrolyte was absorbed into the negative electrode of cell C15A due to the higher surface area, which is possibly related to the pre-dry out of the separator and frequent cell venting (sudden drops in the capacity in Figure 6). The amount of oxides on the newly-formed Alloy C15 and Alloy C15A surfaces are very small compared to Alloy C14 [14]. From the comparison of the two compositions (Alloy C14 and Alloy C15), formula C15 has a high Mn content (high solubility in KOH [17]) and 0.3% La (beneficial for activation and increased surface area [18]), but no Cr (highly corrosion resistant [12,19]) and, consequently, a higher leaching rate. The chemical compositions of three locations in each SEI micrograph were analyzed by EDS and results are listed in Table 4. In the negative electrode from a cycled cell C15 (Figure 10a), the chemical composition of the large piece (Spot 1) does not vary significantly from the broken pieces (Spot 2) and a new oxide phase with very high Mn-content (Spot 3) is formed on the edge (near the separator). In the negative electrode from cycled cell C15A (Figure 10b), the chemical compositions are similar between large pieces (Spot 1) and broken ones (Spot 3). An area with a composition close to Zr7Ni10 (Spot 2) retained the same shape after the cycling (no pulverization).
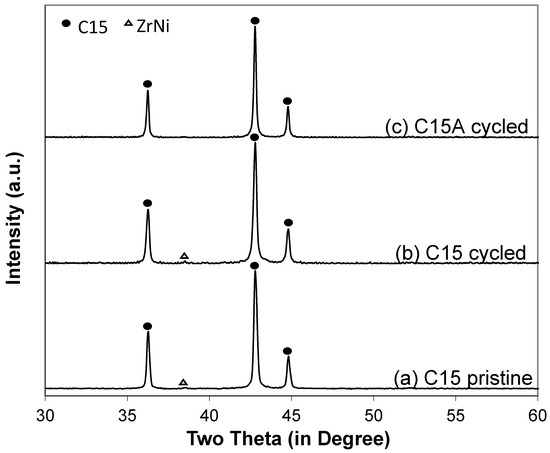
Figure 9.
XRD patterns of (a) pristine C15 and cycled negative electrodes from (b) cell C15 and (c) cell C15A.
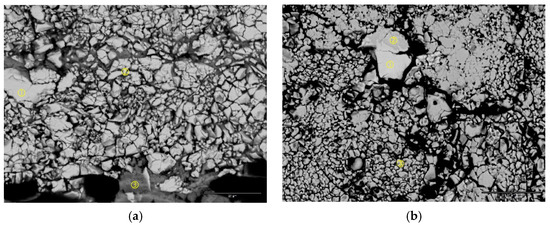
Figure 10.
SEM-BEI micrographs of cycled negative electrodes of (a) cell C15 and (b) cell C15A. The scale bar at the right lower corner represents 25 microns.

Table 4.
EDS results of selected areas in the cycled negative electrodes shown in Figure 11. Values are in at%.
The separator areas in the cycled cells were studied by SEM-EDS mapping and the results are present in Figure 11 (cell C15) and Figure 12 (cell C15A). A significant number of high Mn-content deposits are found in both cells. These Mn-rich deposits are the source of micro-shortening, due to their semiconductor nature [20,21], and cause a relatively inferior charge retention performance when compared to that of cell C14. The density of these Mn-rich oxides in the cycled C15 cell is higher than that in cell C15A and may explain the worse charge retention result of cell C15, when compared to cell C15A. The inferior HT voltage stand of cell C15A is more related to the higher pulverization of Alloy C15A, which expedites the degree of MH alloy oxidation in HT when compared to that of cell C15.
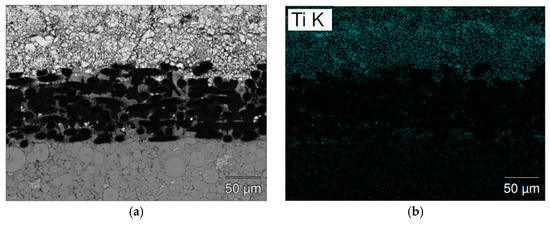
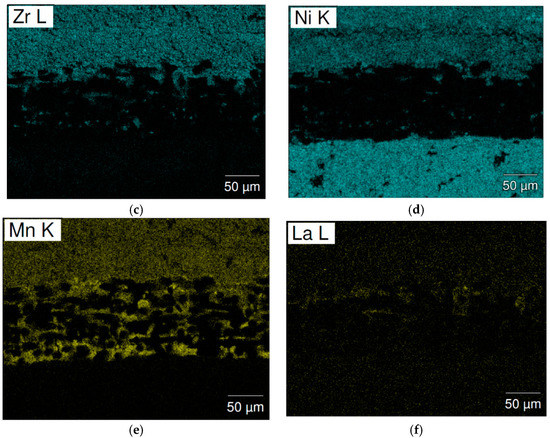
Figure 11.
SEM (a) BEI image and EDS mappings of (b) Ti; (c) Zr; (d) Ni; (e) Mn; and (f) La for the separator from cycled cell C15. The upper side and lower sides are the negative and positive electrodes, respectively.
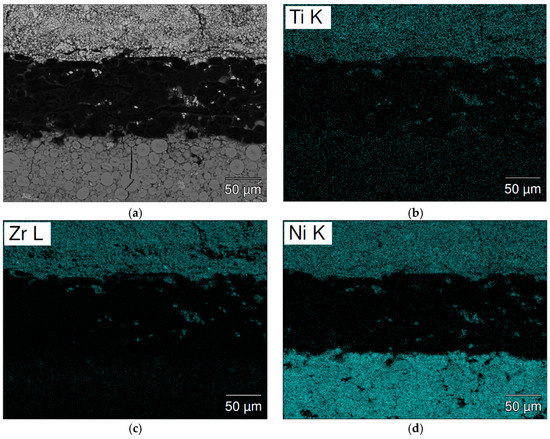
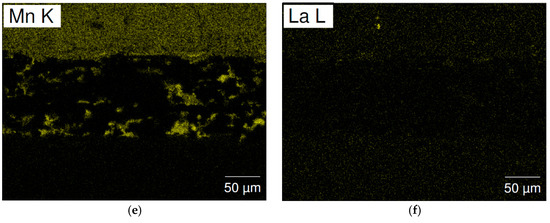
Figure 12.
SEM (a) BEI image and EDS mappings of (b) Ti; (c) Zr; (d) Ni; (e) Mn; and (f) La for the separator from cycled cell C15A. The upper side and lower sides are the negative and positive electrodes, respectively.
3.7. Performance Comparison
The differences in performance of the cells made from three alloys are best represented by the radar plot shown in Figure 13. In agreement with the half-cell results presented previously [4], cell C14 showed the best cycle life and charge retention performances, while cell C15A gave the best HR and LT results. The superiority in HR performance of C15, relative to C14, has been reported many times [5,22,23,24,25,26]. However, the HR performance improvement in the Alloy C15 was reported here for the first time. The poor charge retention and cycle life of cell C15A could be improved by increasing the Cr and Ni-content [19], reducing the annealing condition to preserve some of the ZrxNiy phases, increasing the Zr/Ti ratio to lower the plateau pressure and to prevent early venting [27,28,29], and slowing down pulverization by reducing the PCT hysteresis through composition and annealing condition adjustments [7,19,30,31,32,33].
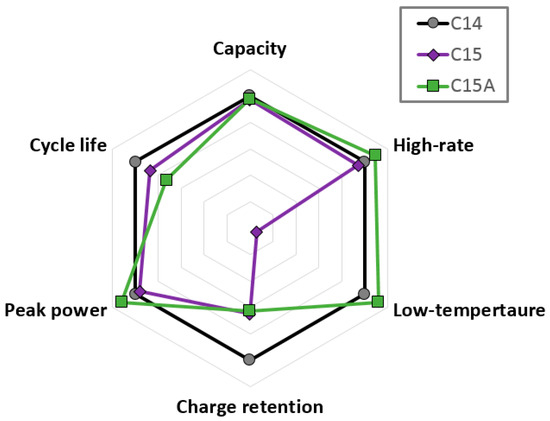
Figure 13.
Key battery performance comparisons among cells C14, C15, and C15A.
4. Conclusions
The electrochemical performances of Ni/MH batteries using as-cast C14, as-cast C15, and annealed C15 AB2 metal hydride alloys were compared. Alloys C14 and C15 with different chemical compositions were composed of mainly C14 and C15 phases, respectively. The pulverization rates with cycling exhibited the trend of Alloy C15A (annealed) > Alloy C15 (as-cast) > Alloy C14 (as-cast), which made cells with Alloy C15A render the best high-rate and low-temperature performance in the early stage of service life. However, the high pulverization rate also resulted in a steady capacity degradation, inferior cycle life, and high-temperature voltage stand. Large amounts of high-Mn oxide deposits were found in the separator of cells with Alloy C15 and Alloy C15A, and can be assumed to deteriorate the charge retention capabilities of these cells. In addition, the high plateau pressure of Alloy C15A caused ventings during the cycle life testing, which should be preventable through composition and/or process adjustments.
Acknowledgments
The authors would like to thank the following individuals from BASF-Ovonic for their assistance: Taihei Ouchi, Jean Nei, Suiling Chen, Cheryl Setterington, Nathan English, David Pawlik, Allen Chan, and Ryan J. Blankenship. The work is related to the collaboration between IFE and BASF on the project MoZEES, funded by the Norwegian Research Council.
Author Contributions
Kwo-Hsiung Young designed the experiments. John M. Koch performed the experiments. Chubin Wan, Roman V. Denys, and Volodymyr A. Yartys analyzed the results and prepared the manuscript.
Conflicts of Interest
The authors declare no conflict of interest.
Abbreviations
The following abbreviations are used in this manuscript:
| Ni/MH | Nickel/metal hydride |
| MH | Metal hydride |
| H-storage | Hydrogen-storage |
| GP | Gaseous phase |
| EC | Electrochemical |
| HR | High rate |
| HT | High temperature |
| LT | Low temperature |
| PCT | Pressure-composition-temperature |
| HRD | High-rate dischargeability |
| Io | Surface exchange current |
| D | Diffusion constant |
| MS | Saturated magnetic susceptibility |
| XRD | X-ray diffraction |
| N/P | Negative electrode to positive electrode |
| DOD | Depth of discharge |
| Voc | Open-circuit voltage |
| R | Internal resistance |
| RT | Room temperature |
| SOC | State-of-charge |
| SEM | Scanning electron microscope |
| EDS | Energy dispersive spectroscopy |
| V | Cell voltage |
| i | Discharge current |
| BEI | Backscattered electron image |
References
- Young, K.; Ng, K.Y.S.; Bendersky, L.A. A technical report of the Robust Affordable Next Generation Energy Storage System-BASF program. Batteries 2016, 2, 2. [Google Scholar] [CrossRef]
- Zelinsky, M.; Koch, J. Batteries and Heat—A Recipe for Success? Available online: www.battcon.com/PapersFinal2013/16-Mike%20Zelinsky%20-%20Batteries%20and%20Heat.pdf (accessed on 17 May 2017).
- Fetcenko, M.A.; Ovshinsky, S.A.; Young, K.; Reichman, B.; Fierro, C.; Koch, J.; Martin, F.; Mays, W.; Ouchi, T.; Sommers, B.; et al. High catalytic activity disordered VTiZrNiCrCoMnAlSn hydrogen storage alloys for nickel–metal hydride batteries. J. Alloy. Compd. 2002, 330, 752–759. [Google Scholar] [CrossRef]
- Young, K.; Nei, J.; Wan, C.; Denys, R.V.; Yartys, V.A. Comparison of C14- and C15-predominated AB2 metal hydride alloys for electrochemical applications. Batteries 2017, 3, 22. [Google Scholar] [CrossRef]
- Young, K.; Nei, J.; Ouchi, T.; Fetcenko, M.A. Phase abundances in AB2 metal hydride alloys and their correlations to various properties. J. Alloy. Compd. 2011, 509, 2277–2284. [Google Scholar] [CrossRef]
- Young, K.; Ouchi, T.; Meng, T.; Wong, D.F. Studies on the synergetic effects in multi-phase metal hydride alloys. Batteries 2016, 2, 15. [Google Scholar] [CrossRef]
- Young, K.; Ouchi, T.; Fetcenko, M.A. Pressure-composition-temperature hysteresis in C14 Laves phase alloys: Part 1. Simple ternary alloys. J. Alloy. Compd. 2009, 480, 428–433. [Google Scholar] [CrossRef]
- Young, K.; Huang, B.; Regmi, R.K.; Lawes, G.; Liu, Y. Comparisons of metallic clusters imbedded in the surface of AB2, AB5, and A2B7 alloys. J. Alloy. Compd. 2010, 506, 831–840. [Google Scholar] [CrossRef]
- Young, K.; Wang, L.; Yan, S.; Liao, X.; Meng, T.; Shen, H.; Mays, W.C. Fabrications of high-capacity alpha-Ni(OH)2. Batteries 2017, 3, 6. [Google Scholar] [CrossRef]
- Young, K.; Wu, A.; Qiu, Z.; Tan, J.; Mays, W. Effects of H2O2 addition to the cell balance and self-discharge of Ni/MH batteries with AB5 and A2B7 alloys. Int. J. Hydrogen Energy 2012, 37, 9882–9891. [Google Scholar] [CrossRef]
- Kleperis, J.; Wójcik, G.; Czerwinski, A.; Showronski, J.; Kopczyk, M.; Beĺtowska-Brzezinska, M. Electrochemical behavior of metal hydride. J. Solid State Electrochem. 2001, 5, 229–249. [Google Scholar] [CrossRef]
- Young, K.; Ouchi, T.; Fetcenko, M.A. Roles of Ni, Cr, Mn, Sn, Co, and Al in C14 Laves phase alloys for NiMH battery application. J. Alloy. Compd. 2009, 476, 774–781. [Google Scholar] [CrossRef]
- Young, K.; Ouchi, T.; Koch, J.; Fetcenko, M.A. Compositional optimization of vanadium-free hypo-stoichiometric AB2 metal hydride alloy for Ni/MH battery application. J. Alloy. Compd. 2012, 510, 97–106. [Google Scholar] [CrossRef]
- Young, K.; Wong, D.F.; Yasuoka, S.; Ishida, J.; Nei, J.; Koch, J. Different failure modes for V-containing and V-free AB2 metal hydride alloys. J. Power Sources 2014, 251, 170–177. [Google Scholar] [CrossRef]
- Zhou, X.; Young, K.; West, J.; Regalado, J.; Cherisol, K. Degradation mechanisms of high-energy bipolar nickel metal hydride battery with AB5 and A2B7 alloys. J. Alloy. Compd. 2013, 580, S373–S377. [Google Scholar] [CrossRef]
- Wang, L.; Young, K.; Meng, T.; English, N.; Yasuoka, S. Partial substitution of cobalt for nickel in mixed rare earth metal based superlattice hydrogen absorbing alloy—Part 2 battery performance and failure mechanism. J. Alloy. Compd. 2016, 664, 417–427. [Google Scholar] [CrossRef]
- Kong, L.; Chen, B.; Young, K.; Koch, J.; Chan, A.; Li, W. Effects of Al- and Mn-contents in the negative MH alloy on the self-discharge and long-term storage properties of Ni/MH battery. J. Power Sources 2012, 213, 128–139. [Google Scholar] [CrossRef]
- Young, K.; Wong, D.F.; Ouchi, T.; Huang, B.; Reichman, B. Effects of La-addition to the structure, hydrogen storage, and electrochemical properties of C14 metal hydride alloys. Electrochim. Acta 2015, 174, 815–825. [Google Scholar] [CrossRef]
- Young, K.; Chang, S.; Lin, X. C14 Laves phase metal hydride alloys for Ni/MH batteries application. Batteries 2017. submitted to publication. [Google Scholar] [CrossRef]
- Shinyama, K.; Magari, Y.; Kumagae, K.; Nakamura, H.; Nohma, T.; Takee, M.; Ishiwa, K. Deterioration mechanism of nickel metal-hydride batteries for hybrid electric vehicles. J. Power Sources 2005, 141, 193–197. [Google Scholar] [CrossRef]
- Zhu, W.H.; Zhu, Y.; Tatarchuk, B.J. Self-discharge characteristics and performance degradation of Ni-MH batteries for storage applications. Int. J. Hydrogen Energy 2014, 39, 19789–19798. [Google Scholar] [CrossRef]
- Nakano, H.; Wakao, S. Substitution effect of elements in Zr-based alloys with Laves phase of nickel-hydride battery. J. Alloy. Compd. 1995, 231, 587–593. [Google Scholar] [CrossRef]
- Nakano, H.; Wakao, S.; Shimizu, T. Correlation between crystal structure and electrochemical properties of C14 Laves-phase alloys. J. Alloy. Compd. 1997, 253–254, 609–612. [Google Scholar] [CrossRef]
- Young, K.; Ouchi, T.; Huang, B.; Chao, B.; Fetcenko, M.A.; Bendersky, L.A.; Wang, K.; Chiu, C. The correlation of C14/C15 phase abundance and electrochemical properties in the AB2 alloys. J. Alloy. Compd. 2010, 506, 841–848. [Google Scholar] [CrossRef]
- Song, X.; Zhang, X.; Leo, Y.; Wang, Q. Effect of microstructure on the properties of Zr-Mn-V-Ni AB2 type hydride electrode alloys. Int. J. Hydrogen Energy 1999, 24, 455–459. [Google Scholar] [CrossRef]
- Young, K.; Ouchi, T.; Lin, X.; Reichman, B. Effects of Zn-addition to C14 metal hydride alloys and comparisons to Si, Fe, Cu, Y, and Mo-additives. J. Alloy. Compd. 2016, 655, 50–59. [Google Scholar] [CrossRef]
- Young, K.; Fetcenko, M.A.; Li, F.; Ouchi, T. Structural, thermodynamic, and electrochemical properties of TixZr1–x(VNiCeMnCiAl)2 C14 Laves phase alloys. J. Alloy. Compd. 2008, 464, 238–247. [Google Scholar] [CrossRef]
- Jacob, I.; Stern, A.; Moran, A.; Shaltiel, D.; Davidov, D. Hydrogen absorption in (ZrxTi1‒x)B2 (B ≡ Cr, Mn) and the phenomenological model for the absorption capacity in pseudo-binary Laves-phase compound. J. Less-Common Met. 1980, 73, 369–376. [Google Scholar] [CrossRef]
- Huot, J.; Akiba, E.; Ogura, T.; Ishido, Y. Crystal structure, phase abundance and electrode performance of Laves phase compounds (Zr, A)V0.5Ni1.1Mn0.2Fe0.2 (A ≡ Ti, Nb or Hf). J. Alloy. Compd. 1995, 218, 101–109. [Google Scholar] [CrossRef]
- Young, K.; Ouchi, T.; Fetcenko, M.A. Pressure-composition-temperature hysteresis in C14 Laves phase alloys: Part 3. Empirical formula. J. Alloy. Compd. 2009, 480, 440–448. [Google Scholar] [CrossRef]
- Trapanese, M.; Franzitta, V.; Viola, A. Description of hysteresis of nickel metal hydride battery. In Proceedings of the 38th Annual Conference on IEEE Industrial Electronics Society, Montreal, QC, Canada, 25–28 October 2012; pp. 967–970. [Google Scholar]
- Trapanese, M.; Franzitta, V.; Viola, A. Description of hysteresis in lithium battery by classical Preisach model. Adv. Mater. Res. 2013, 622, 1099–1103. [Google Scholar]
- Trapanese, M.; Franzitta, V.; Viola, A. The Jiles Atherton model for description on hysteresis in lithium battery. In Proceedings of the Twenty-Eighth Annual IEEE Applied Power Electronics Conference and Exposition (APEC), Long Beach, CA, USA, 17–21 March 2013; pp. 2772–2775. [Google Scholar]
© 2017 by the authors. Licensee MDPI, Basel, Switzerland. This article is an open access article distributed under the terms and conditions of the Creative Commons Attribution (CC BY) license (http://creativecommons.org/licenses/by/4.0/).