1. Introduction
Nickel/metal hydride (Ni/MH) rechargeable batteries are widely used in today’s consumer electronics, stationary power storage, and transportation applications. One of the major factors limiting the performance of Ni/MH batteries is a relatively low gravimetric energy density, compared to the rival lithium-ion battery technology [
1]. For the active materials in the negative electrode of Ni/MH battery, Laves phase-based AB
2 metal hydride (MH) alloy containing 1.85 wt % H with a potential capacity of 434 mAh·g
−1 [
2] has commonly been a high-energy alternative to the conventional rare earth-based AB
5 alloys, which have a capacity of approximately 330 mAh·g
‒1. Other performance comparisons between these two MH alloy families are available in an earlier review article [
3]. Different from the single CaCu
5 crystal structure in the AB
5 MH alloys, the main phase in the AB
2 MH alloys can be C14, C15, or a mixture of two, which provides additional freedom in composition design to address various requirements, such as ultra-low temperature performance, high-temperature storage, and overcharge performance [
4]. C14 and C15 are two Laves structures and form the largest intermetallic compound group [
5].
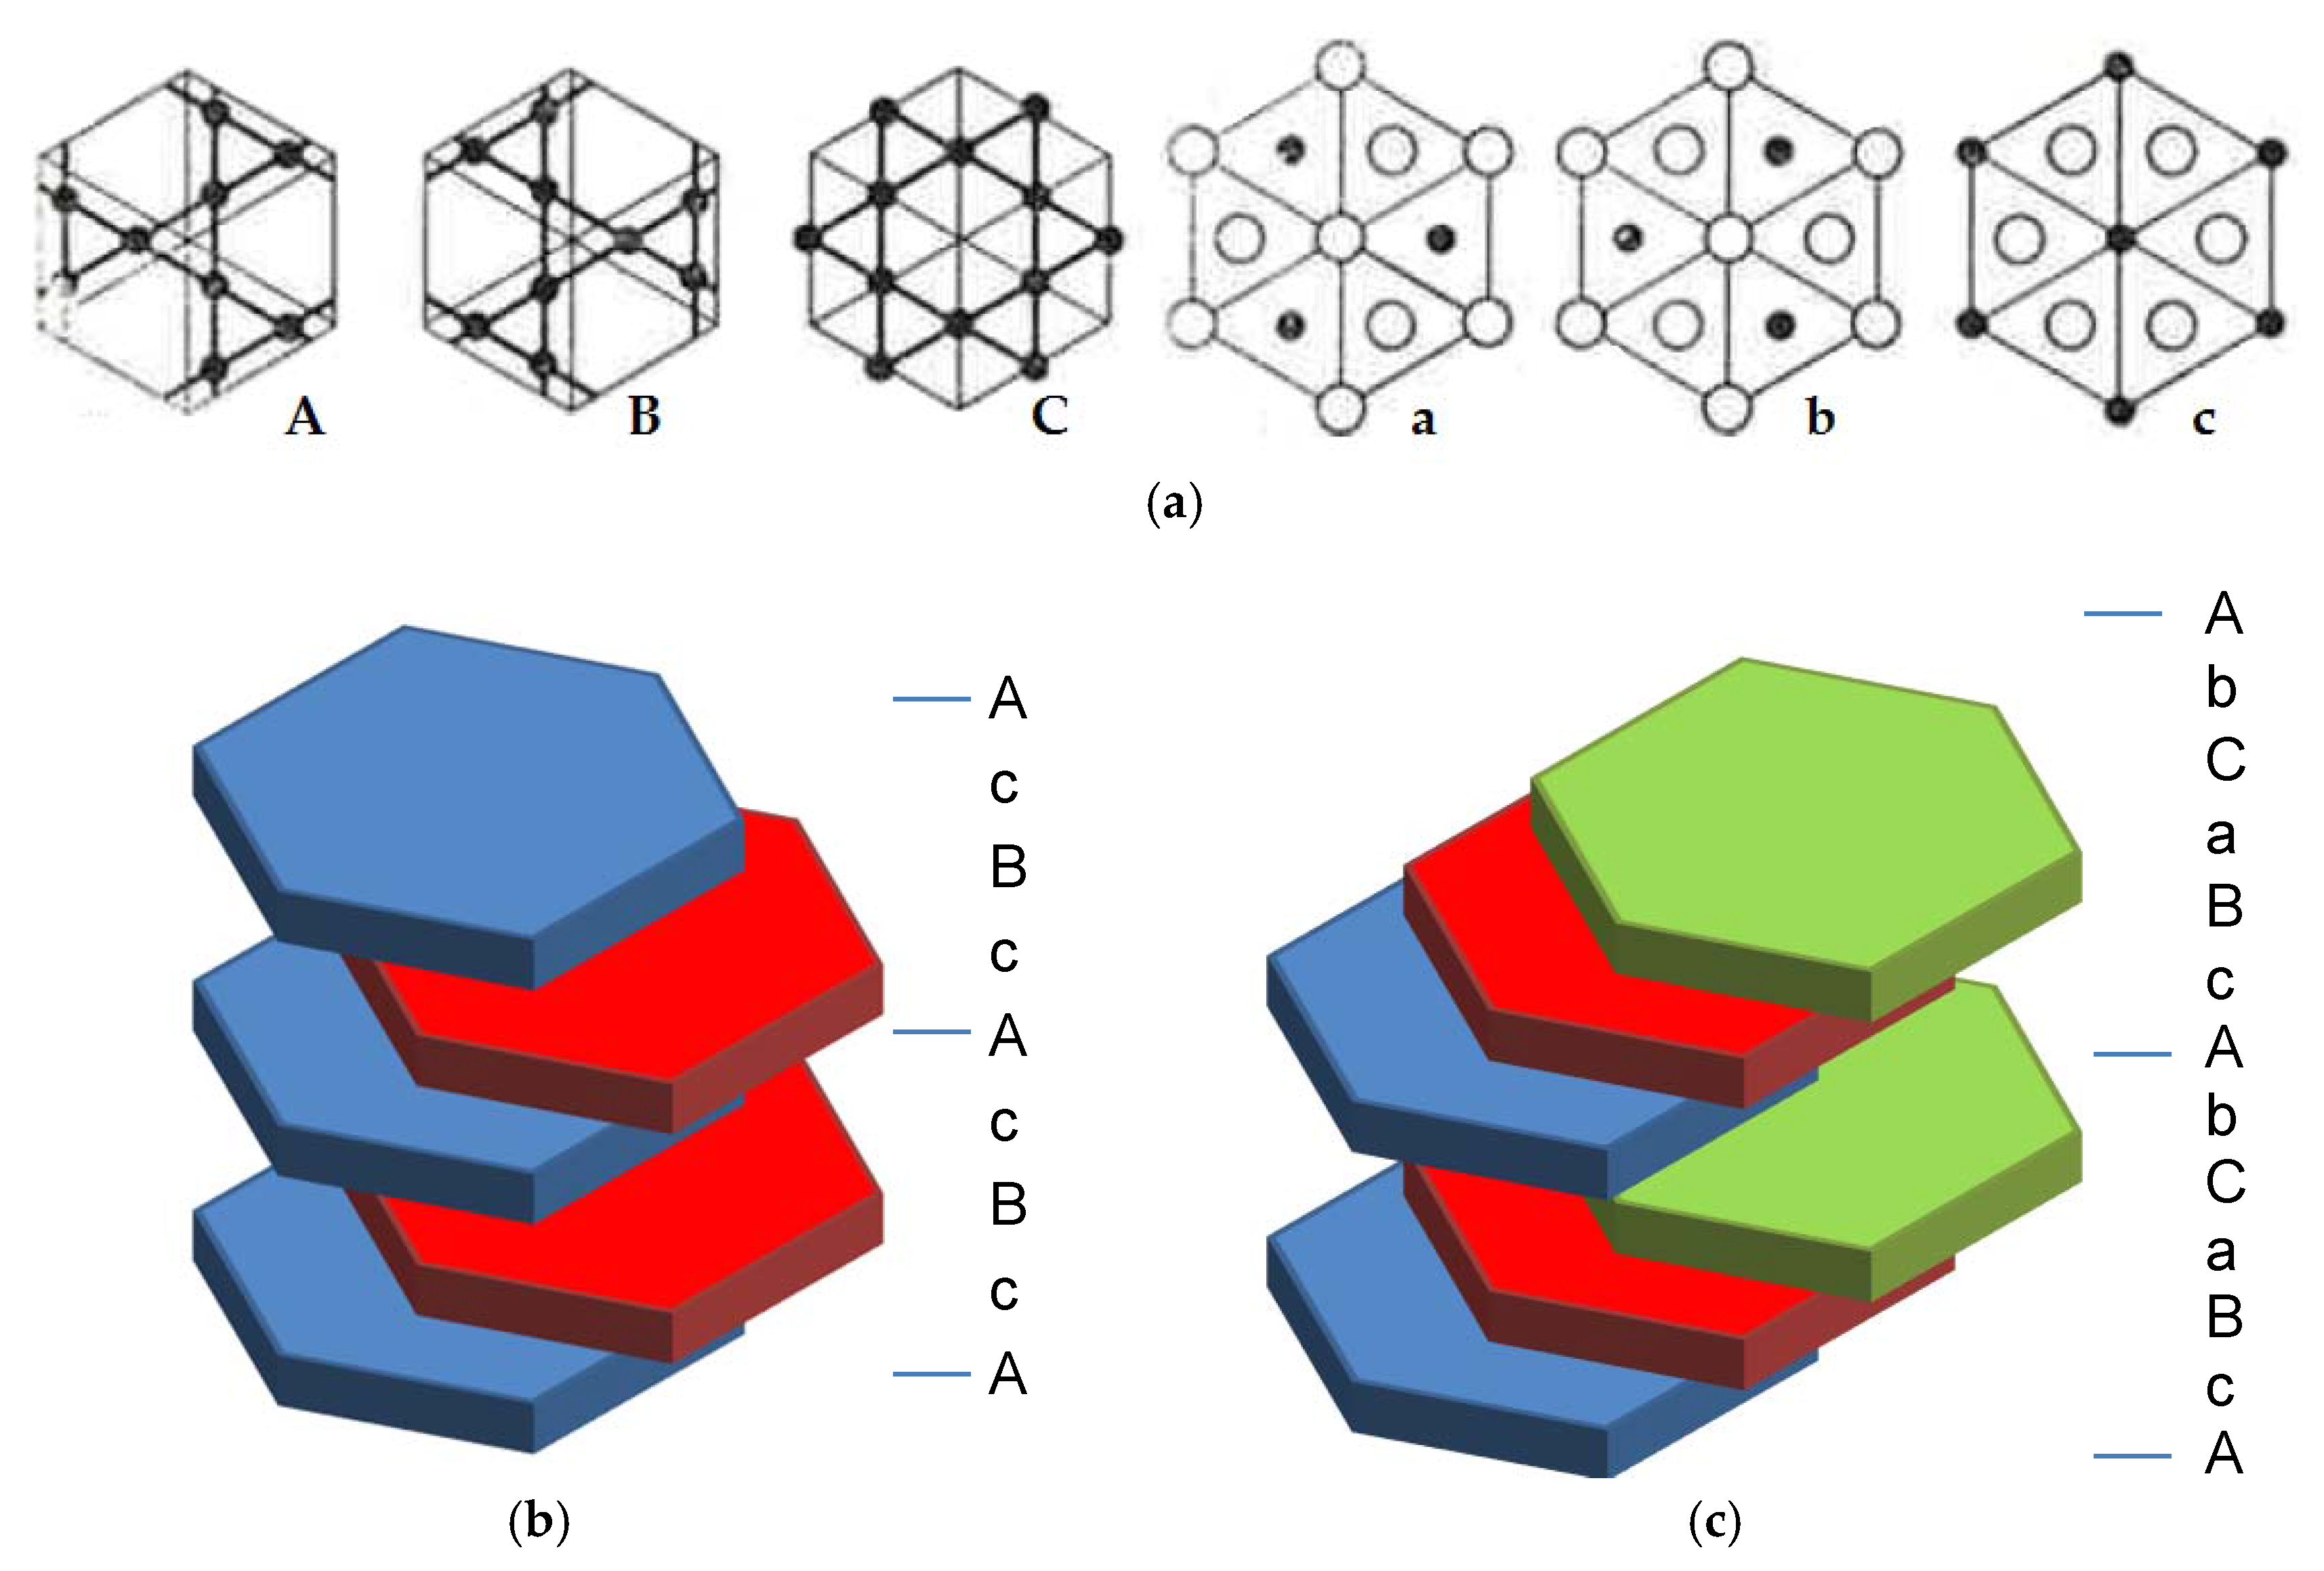
The difference between these two structures originates from the different types of packings in two types of metal nets, Kagome 6363 nets formed by B atoms and containing hexagons and triangles, and A
2B buckled nets formed by both A and B atoms [
6]. There are 6 types of these nets, depending of their orientation along the [001] direction of the hexagonal/trigonal unit cells, as shown in
Figure 1; A, B, and C nets for the Kagome 6363 nets and a, b, and c nets for the A
2B buckled nets. The packing of these nets creates AcBc 2-layer stacking, resulting in a hexagonal C14 type Laves type structure, or 3-layer stacking (AcBaCb), resulting in a face-centered cubic (fcc) C15 Laves type structure, both with AB
2 stoichiometry. As shown in
Figure 1, atoms in the A layer form a triangular net and there are two possible arrangements for the next layer—atoms in the B or C position. If the stacking of the triangular nets follows the sequence A-B-A-B, as shown in
Figure 1b, a hexagonal crystal structure is formed. In the case of another stacking sequence, A-B-C-A-B-C, the structure is fcc with the same packing density as for the hexagonal one (
Figure 1c). For the Laves phases, the triangular net is replaced by an A
4B
8 slab with an A
2B-B
3-A
2B-B
3 structure, and C14 and C15 are formed following the A-B-A-B and A-B-C-A-B-C stacking sequences, respectively. Another member of the Laves phases, hexagonal C36, has the same building slabs, but they are stacked in a different sequence, AbCaBaCb. However, the C36 type of structure is much less abundant than C14 and C15 [
7], and we will not discuss it further in this work.
Figure 2 shows the crystal structures of C14 and C15 type alloys, and
Table 1 summarizes the crystallographic data for both structures. Ideally, the lattice parameters are closely related in each structure and between structures. However, in the actual C14-predominated MH alloys, the
c/
a ratio is slightly lower than the theoretical value (
) [
8,
9]. Three types of positions are available for hydrogen occupation tetrahedral sites (A
2B
2, AB
3, and B
4) in both C14 and C15 structures, as shown in
Figure 2. In the Laves phases, octahedral sites are not present at all, therefore the following discussion will only concentrate on tetrahedral sites.
Hydrogen occupation occurs first at the A
2B
2 site, next at the AB
3 site, and finally at the B
4 site [
14,
15,
16,
17]. Furthermore, the ratio between the tetrahedral sites is 12 A
2B
2, 4 AB
3, and 1 B
4 for both C14 and C15 structures. However, not all these sites can be occupied at the same time as the sites with a common triangular face are blocked from simultaneous occupancy. This is because the distance between their centers appears to be well below 0.2 nm, the minimum allowed H-H distance in the structures of metal hydrides [
18].
Storages of up to 5.4 and 4.25 H atoms per AB2 formula unit for the C14 and C15 structures, respectively, have been demonstrated at room temperature and in a reasonable pressure range, although their theoretical hydrogen storage (H-storage) capacities are higher (6.33 and 6 H atoms per AB2 formula unit for C14 and C15, respectively).
The choice of the dominating Laves structure at room temperature in the alloy is not random. While several determining factors, such as atomic size ratio, difference in electronegativity between the A-site and B-site atoms [
19], and stoichiometry [
20] have been discussed in literature, average electron density (
e/
a) was found to be the most crucial parameter and can be directly correlated to the ratio of C14/C15 at room temperature [
21]. An empirical model for predicating the C14/C15 formation was originally supported by a set of tight-binding calculations [
22] and recently confirmed by a density function theory calculation [
23]. In addition, the model for
e/
a at the C14/C15 threshold (C14:C15 = 1:1) was further improved to include the contribution from the A-site atoms by incorporating the average chemical potential of the A-site atoms [
24].
While the initial studies of the AB
2 MH alloys in the gaseous phase [
25] and electrochemical environment [
26] started and were later commercialized with the C14 phase [
3], studies on the C15-predominated AB
2 alloys for Ni/MH application were common from 1991 to 2004. The major accomplishments during this period are summarized in
Table 2. In order to increase the stability of the C15 phase, these alloys are generally designed to have a higher Zr-content (which moves
e/
a at the C14/C15 threshold to a lower value [
27]), lower the V- and Cr-content (which increases
e/
a to a value above the
e/
a of the C14/C15 threshold [
27]), and have a hyperstoichiometry (B/A > 2), compared to the C14-predominated MH alloys used in Ni/MH applications. Although the C15 alloys that exhibit a high capacity and excellent high-rate dischargeability (HRD) have been successfully developed, they are not as popular as the C14 alloys. Through the years, the performance of the C14 and C15 phases in both the gaseous phase and electrochemical environment have been compared over a dozen times either in the alloys with the same composition but different preparation processes, or in a series of alloys with close compositions. Unfortunately, the findings are inconsistent (
Table 3). It is very difficult to determine which phase has better performance with regard to capacity, HRD, and cycle life. In this paper, we provide a different approach to compare these two Laves structures. To this end, two state-of-art C14 and C15-based MH alloys were selected and their gaseous and electrochemical H-storages were compared. We hope this work would illuminate future AB
2 MH alloy research.
2. Experimental Setup
Each ingot sample was prepared by an induction melting process under a 0.08 MPa Ar protection atmosphere and elemental raw materials with a purity of >99.9% (except for Zr, where Sn-containing (1%) zircaloy was used). An MgO crucible, an alumina tundish, and a steel mold were used for melting. Annealing was performed in vacuum (achieved with a diffusion pump) for 6 h at 960 °C with a 3 h temperature ramp-up period. The ingot was then cooled naturally to room temperature. For powder fabrication, the ingot underwent a hydriding/dehydriding process, which introduced initial volume expansion/contraction to create internal stress before it was crushed and ground to a −200 mesh powder. A Varian Liberty 100 inductively coupled plasma optical emission spectrometer (ICP-OES, Agilent Technologies, Santa Clara, CA, USA) was employed to study the chemical composition. A Philips X'Pert Pro XRD (X-ray diffractometer, Philips, Amsterdam, The Netherlands) was used to perform the phase analysis, and a JEOL-JSM6320F scanning electron microscope (SEM, JEOL, Tokyo, Japan) with energy dispersive spectroscopy (EDS) was also used to investigate the phase distribution and composition. A Suzuki Shokan multi-channel pressure-concentration-temperature system (PCT, Suzuki Shokan, Tokyo, Japan) was used to measure the gaseous phase H-storage characteristics. PCT measurements at 30, 60, and 90 °C were performed after activation, which consisted of a 2 h thermal cycle between room temperature and 300 °C under 2.5 MPa H2 pressure. MH alloy electrodes were prepared by directly pressing the MH alloy powder onto an expanded Ni substrate (1 cm × 1 cm) with a 10-ton press without the use of any metallic or organic binder. Electrochemical measurements, including capacities at various rates, bulk diffusion coefficient (D), and surface exchange current (Io) were performed on an Arbin Instruments BT-2143 Battery Test Equipment (Arbin Instruments, College Station, TX, USA). A Solartron 1250 Frequency Response Analyzer (Solartron Analytical, Leicester, UK) with a sine wave amplitude of 10 mV and a frequency range of 0.5 mHz to 10 kHz was used to conduct the alternating current (AC) impedance measurements. A Digital Measurement Systems Model 880 vibrating sample magnetometer (MicroSense, Lowell, MA, USA) was used to measure the magnetic susceptibility of the activated alloy surfaces (etched for 4 h in 30 wt % KOH at 100 °C).
3. Results and Discussion
Two compositions, Zr
21.5Ti
12.0V
10.0Cr
7.5Mn
8.1Co
8.0Ni
32.2Sn
0.3Al
0.4 and Zr
25.0Ti
6.5V
3.9Mn
22.2Fe
3.8Ni
38.0La
0.3, were selected for this comparative study. Their target compositions and ICP results are summarized in
Table 4. The first composition is a stoichiometric C14 composition and was used as the base alloy for a number of comparative studies [
8,
63,
64,
65,
66] due to its overall balanced performance with regard to activation, HRD, and cycle stability. The
e/
a of the first composition is below the C14/C15 threshold (
[
24]), and therefore a C14-predominated structure occurs. The second composition was chosen based on a series of refinements targeting high-rate Ni/MH applications, and further by containing an optimized Ti and Zr ratio with Ni, Mn, V, and Fe, with a minor amount of La additive [
67]. The half-cell capacity for the alloy with the second composition mixed with 80% carbonyl nickel approached 460 mAh·g
−1 at a discharge current density of 10 mA·g
−1 [
68]. Compared to the first composition, the second composition is hyperstoichiometric and has a higher Zr-content, lower V-content, no Cr, and higher Ni-content, which contribute to a higher
e/
a value and result in a C15-predominated alloy. A small amount of La was added in the C15-predominated alloy to facilitate the activation process [
37,
69,
70]. While only the un-annealed C14 alloy was used for this comparative work, two versions of the C15 alloys were assessed: pristine (C15) and annealed alloys (C15A). Since the effects of annealing on the multi-phase C14-predominated AB
2 MH alloys have been well studied (elimination/reduction in secondary phase abundance results in reduction of synergetic effects, leading to deterioration of electrochemical properties) [
55,
61,
71,
72], only the impacts of annealing on the C15 AB
2 MH alloy will be verified in this work. ICP results of the three alloys (C14, C15, and C15A) are in excellent agreement with the corresponding design values.
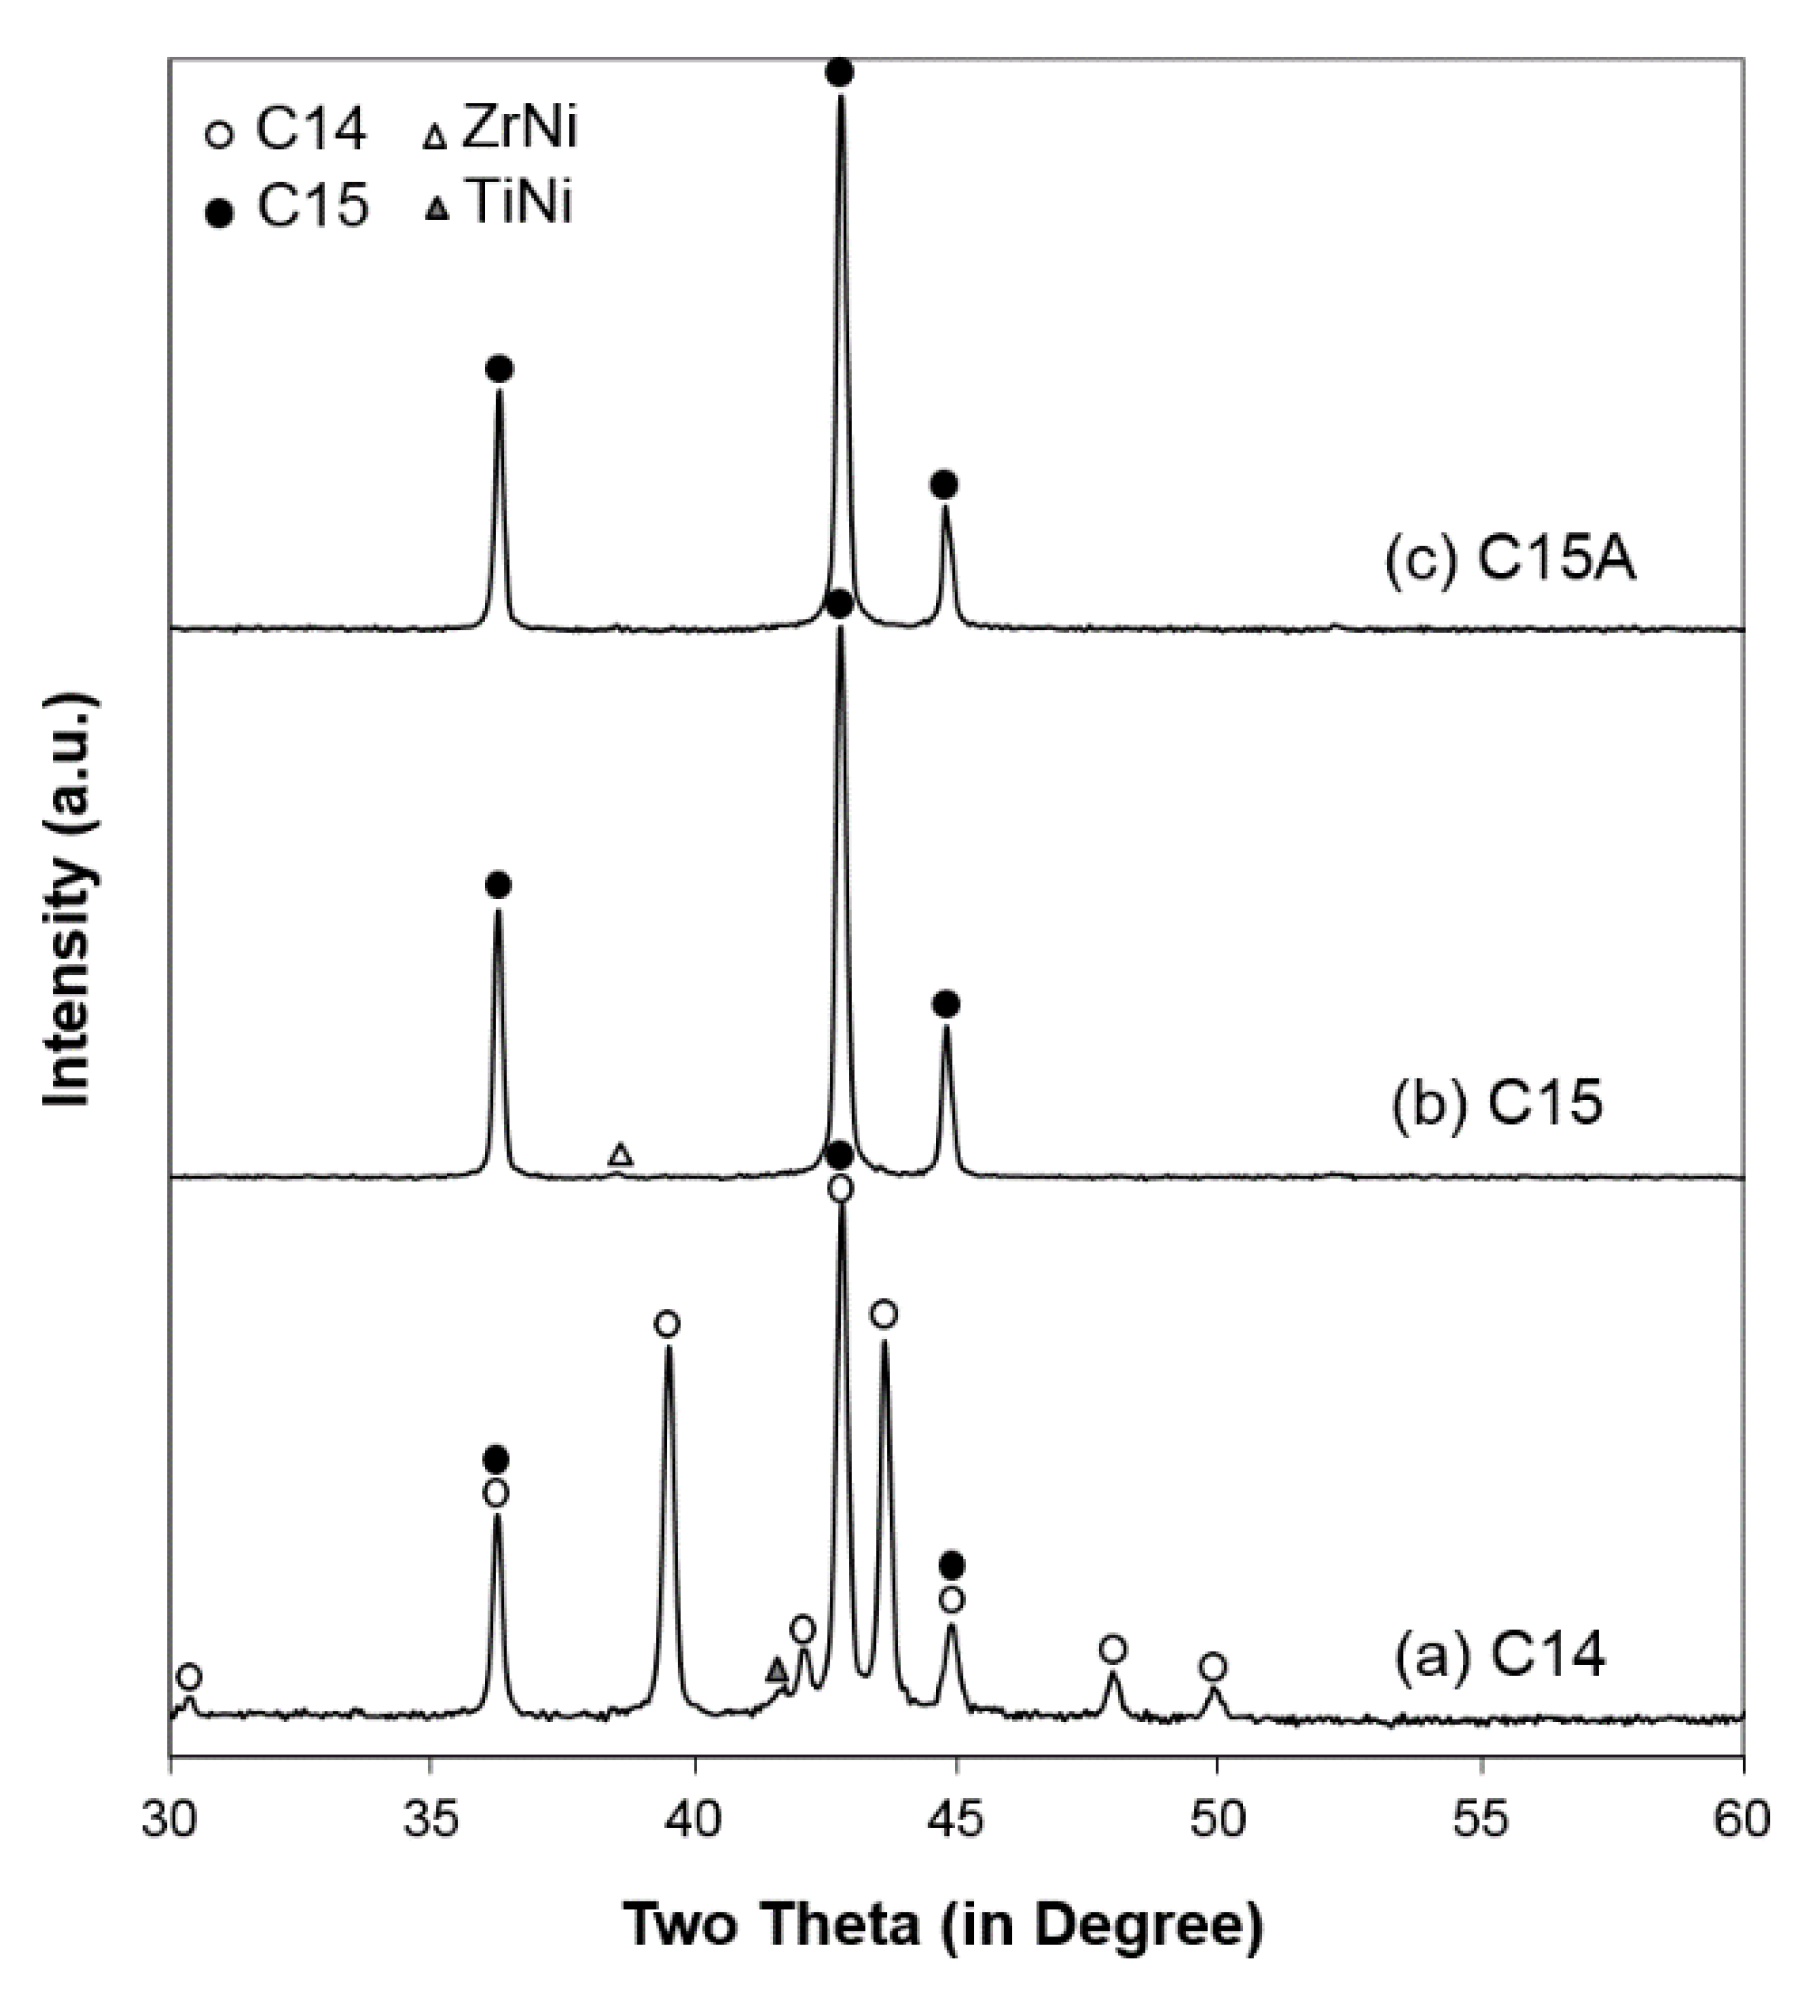
3.1. X-Ray Diffractometer Analysis
XRD analysis was used to study the constituent phases occurring in the alloys. The obtained XRD patterns are shown in
Figure 3. The XRD pattern from the C14 alloy demonstrates a C14-predominated structure with overlapping C15 peaks and a minor TiNi peak. Both XRD patterns from C15 and C15A alloys show a C15 structure with a small ZrNi peak in the pristine alloy. Results from full XRD pattern fitting with Jade 9.0 software (MDI, Livermore, CA, USA) are summarized in
Table 5. The
c/
a ratio obtained for the C14 alloy (1.629) is only slightly lower than the ideal ratio (1.633), and this deviation is commonly seen in C14 alloys for Ni/MH application. The atomic size ratio,
RA/
RB (where
RA and
RB represent the average atomic radii of the A-site and B-site atoms, respectively), in the C14 alloy (1.216) is slightly lower than the ideal ratio of
[
73], which causes a deviation in the c/a ratio from the ideal value. Moreover, the secondary phases found in the C14 and C15 alloys belong to TiNi and ZrNi structures, respectively. After annealing, the ZrNi secondary phase in the C15 alloy becomes undetectable. This reduction/diminishing of the secondary phase after annealing also occurs in the C14 AB
2 MH alloys [
55,
61,
71,
72]. In addition to C14 and TiNi, there is also a 5.2 wt % of C15 found in the C14 alloy since the alloy’s
e/a (6.82) is close to the
e/a at the C14/C15 threshold for Zr/Ti (
1.8 (6.91)) [
24]. The C15 phase is usually located between the C14 main matrix and other Zr
xNi
y secondary phases [
74]. Therefore, due to the mixed nature of the C14 and C15 phases in the C14 alloy, the crystallites in the C14 alloy are smaller than those in the C15 alloy. Furthermore, the annealed C15 (C15A) has even larger crystallites. The increase in crystallite size after annealing is a common observation in Laves phase-based MH alloys [
61,
75].
3.2. Scanning Electron Microscope/Energy Dispersive Spectroscopy Analysis
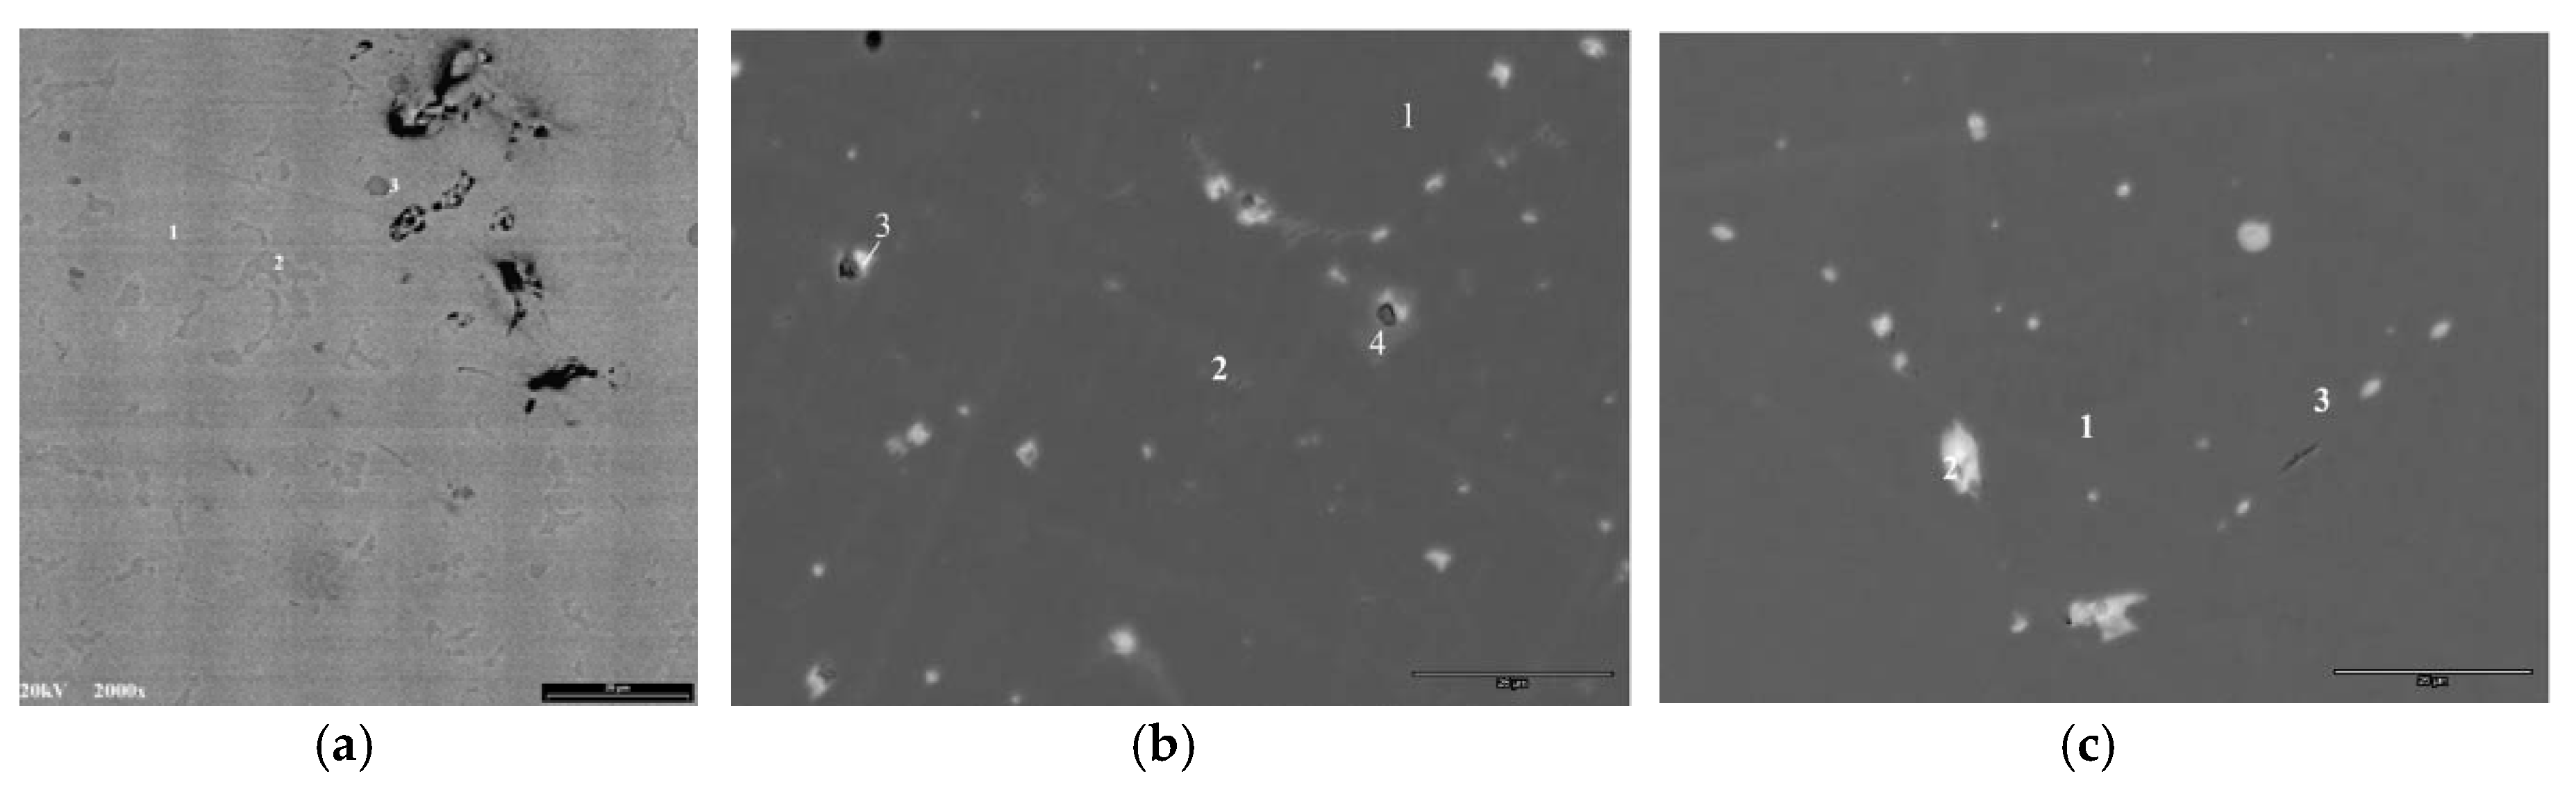
SEM back-scattering electron images (BEI) from the alloys are presented in
Figure 4. The composition of several representative areas (identified by Roman numerals) in the SEM micrographs were studied by EDS, and the results are summarized in
Table 6. SEM micrographs of the C14 alloy shows a very typical multi-phase C14-C15-Zr
xNi
y microstructure, which has been extensively studied with transmission electron microscopy (TEM) [
76,
77] and electron backscattering diffraction (EBSD) [
75]. Occasional ZrO
2 inclusions are also seen in the C14 alloy and act as oxygen scavengers [
78], which may contribute positively to the bulk diffusion of hydrogen and provide surface protection against oxidation by the electrolyte [
79]. In the SEM micrographs of the C15 and C15A alloys, a LaNi or La-rich phase with a high contrast is observed, suggesting segregation of La from the main phase. Since La does not precipitate into the Zr-based Laves phase, it segregates into a LaNi secondary phase, as in the cases of other rare earth element substitutions [
9]. The relatively high solubility of the LaNi phase in the KOH electrolyte results in the facilitation of an initial formation process in alkaline solution [
70]. The La-content and Ni-content of the La-rich secondary phase in the C15 alloy increases and decreases after annealing, respectively. It should be noted that the XRD analysis does not detect any La-containing phase, due to its small overall abundance. In addition, the SEM micrographs shown in
Figure 4 are not typical, but exhibit the most features and therefore reveal all phases of the alloys. Additionally, the measured Sn-content in the LaNi phase before annealing is quite high (15.7 at %) and becomes even higher (21.5 at %) after annealing. In the Laves phase MH alloys, Sn dissolves into the main C14 Laves phase and the ZrNi secondary phase without forming any Sn-rich secondary phase [
8,
78,
80,
81,
82,
83,
84], and more Sn migrates into the ZrNi secondary phase after annealing [
61]. The presence of Sn in the composition of the Zr-containing MH alloy is due to a cost saving consideration—the market price of Sn-containing zircaloy scrap, which is used as one of the raw materials in the current study, at one time was only one tenth of the cost of pure Zr scrap. In general, a small percentage of Sn (approximately 0.2 to 0.4 at %), if dissolved fully into the main phase, facilitates hydride formation but reduces HRD and cycle life [
79]. Moreover, a phase with a slightly brighter contrast (Spot 2 in
Figure 4b) and a composition close to (Zr,Ti)Ni can be found in the C15 alloy. It is eliminated during the annealing process and disappears in the SEM micrograph taken from the C15A alloy (
Figure 4c).
3.3. Pressure-Concentration-Temperature Analysis
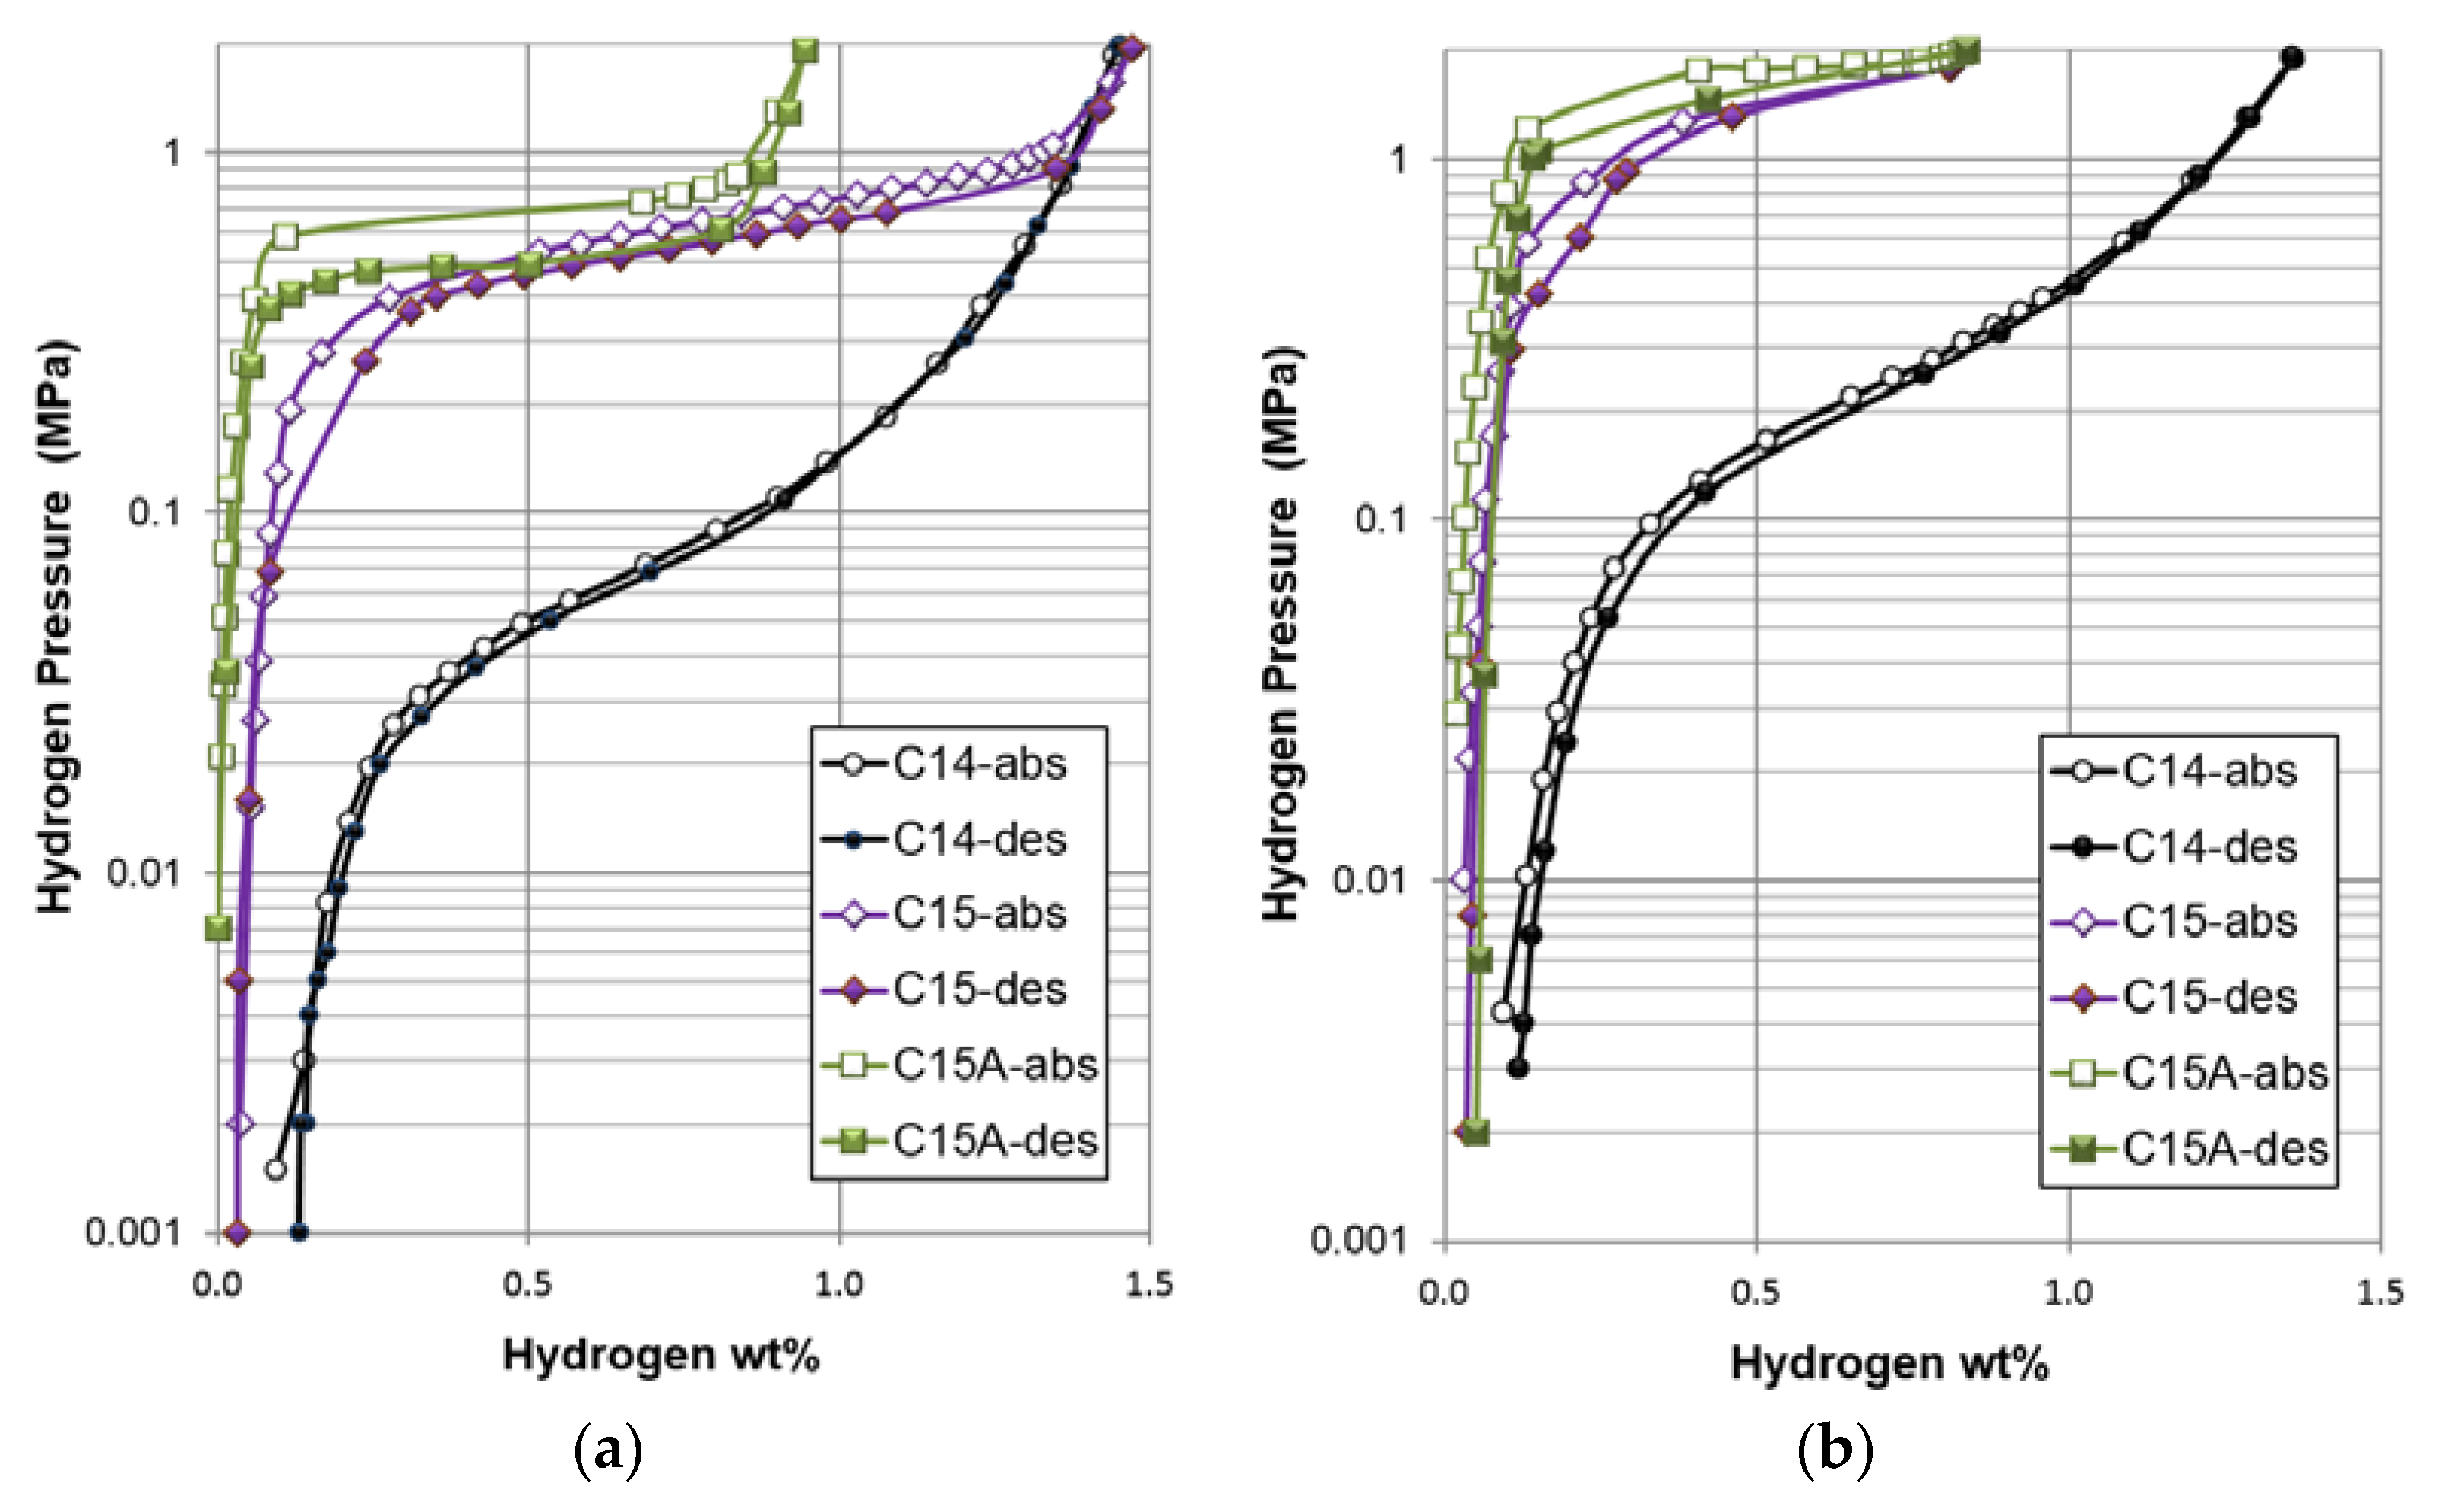
The PCT isotherms were measured at 30, 60, and 90 °C, and the results from the first two temperatures are shown in
Figure 5. PCT isotherms measured at 90 °C are not complete due to an increase in plateau pressure (out of range for the testing apparatus), and therefore are not shown. Gaseous phase H-storage characteristics obtained from the PCT analysis are summarized in
Table 7. Compared to the C14 alloy, the PCT isotherms of both the C15 and C15A alloys show a very steep takeoff from the α (metal)-to-β (metal hydride) region, which is similar to the observations seen in Nd-based AB
5 [
85] and A
2B
7 [
86] MH alloys, and a lower self-discharge is expected. Moreover, the C15 and C15A alloys show very flat plateaus, which are extremely uncommon in multi-phase MH alloys [
8,
87]. In order to quantify the plateau flatness, slope factor (as previously defined in [
8]: the ratio of storage capacity between 0.01 MPa and 0.5 MPa to total capacity in the desorption isotherm) of each alloy was calculated. The increase in slope factor (plateau flatness) from the C14 alloy (0.60) to the C15 and C15A alloys (0.87 and 0.90, respectively) is a direct result of the elimination of multi-phase features and the accompanying synergetic mode [
88]. Annealing of the C15 alloy decreases the storage capacity, slightly decreases the plateau pressure, and increases the absorption/desorption hysteresis (defined as
) in the middle of the pressure plateau due to the improvement in the homogeneity and complete removal of the ZrNi secondary phase, which is very critical for supplying the synergetic effects [
89,
90]. Several speculations have been proposed for the possible origin of PCT hysteresis [
91,
92,
93,
94]. The energy required for elastic lattice deformation in the metal/MH interface area during absorption [
95] is currently the most accepted explanation. The reduction in PCT hysteresis in the multi-phase system has been explained previously and is caused by the remaining hydrogenated phase (from activation or previous hydrogenation) at the grain boundary between phases (Figure 14 in [
89]). Cleanness at the interface (free of amorphous and impurity phase) between phases removes a possible source for dissipation of stresses at a boundary between the major and the secondary phases and is important for the occurrence of such phenomenon. It has been confirmed in similar alloys through the use of TEM and EBSD [
74,
96]. Therefore, the C14 alloy, that has the highest secondary phase abundance (6.4 wt %), also has the smallest PCT hysteresis (0.04); the C15 alloy, that has a lower secondary phase abundance (0.7 wt %), has a larger PCT hysteresis (0.13), while the C15A alloy has no detectable (through XRD analysis) secondary phase and shows the largest PCT hysteresis (0.31). Synergetic effects resulted by the presence of the secondary phase and composition inhomogeneity reduce the hysteresis and make more storage sites accessible, so the plateau region of the PCT isotherm can be extended [
89]. Furthermore, both the Δ
Hh and difference in entropy (Δ
Sh) were estimated using desorption plateau pressures at 30 and 60 °C with the following equation:
where ℜ is the ideal gas constant and
T is the absolute temperature. Although the C15 alloy has a significantly higher plateau pressures compared to the C14 alloy, they exhibit similar Δ
Hh values, which indicates that the current comparative study between C14 and C15 is fair. After annealing, the C15A alloy demonstrates a lower Δ
Hh (more stable hydride) and a Δ
Sh closer to the ideal value between free hydrogen gas and solid (−130.7 J·mol
−1·K
−1) [
97]. The formation of the more ordered hydride from C15A is resulted by the improvement in homogeneity by annealing.
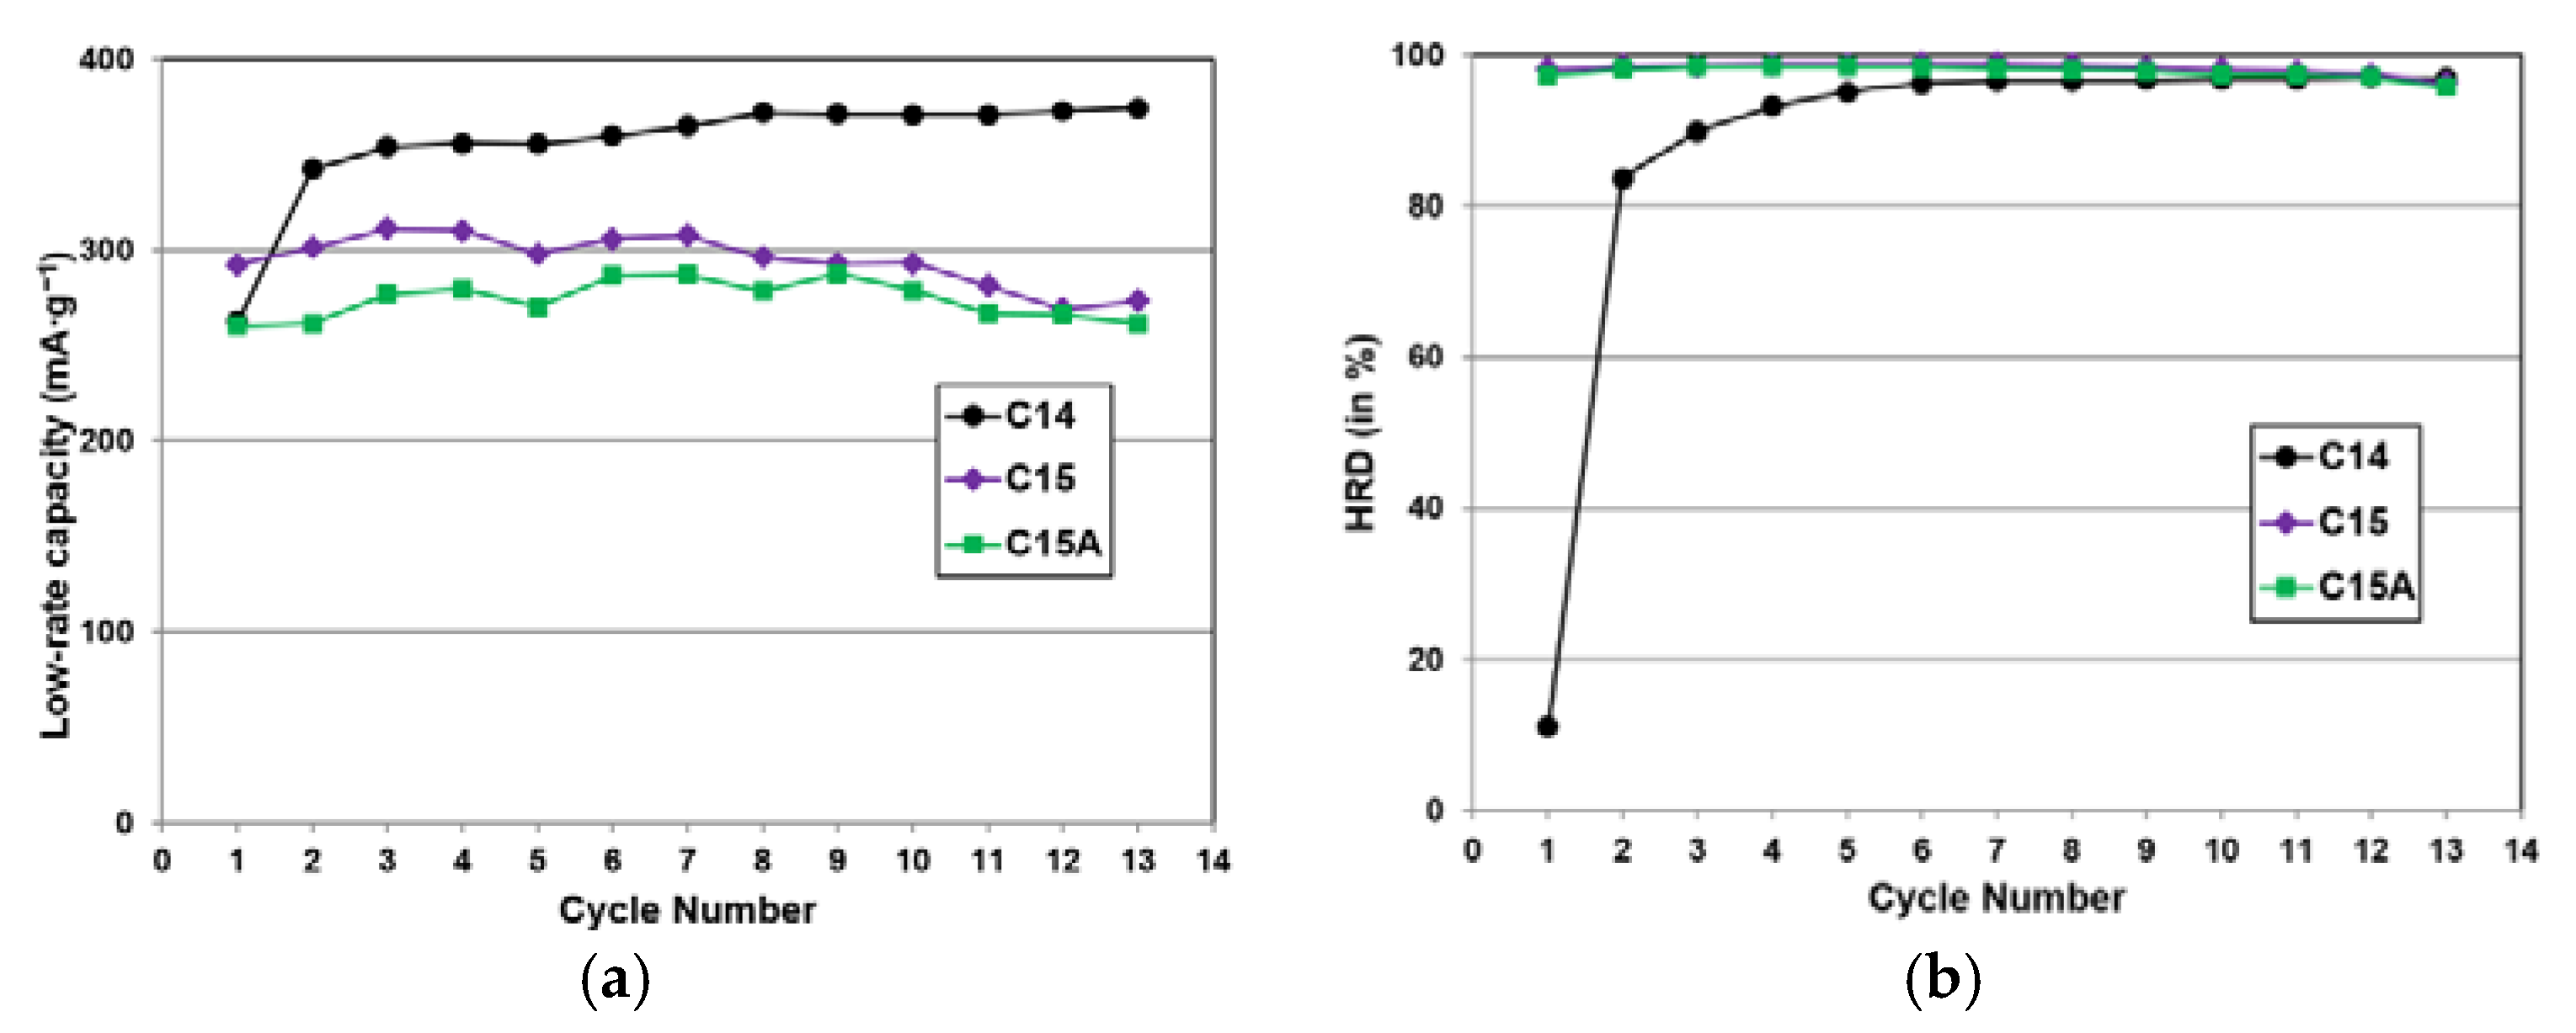
3.4. Electrochemical Analysis
The electrochemical capacity and activation characteristics of the alloys were studied using half-cell measurements in a flooded configuration (for details, see [
98]). Evolution of full capacity (measured at a discharge rate of 4 mA·g
−1) and HRD (the ratio of capacity at a discharge rate of 50 mA·g
−1 to that at a discharge rate of 4 mA·g
−1) for the first 13 cycles are plotted in
Figure 6, and the electrochemical properties are summarized in
Table 8.
Figure 6 shows that the C14 alloy has a higher low-rate capacity, a lower HRD, and is more difficult to activate, compared to the C15 alloys. Since the C15 and C15A alloys’ plateaus pressures are higher than 0.1 MPa (one atmosphere) and therefore cannot be fully charged in the open-to-air half-cell configuration, their discharge capacities are lower than the expected values from the conversion of the gaseous phase H-storage capacities (1 wt % = 268 mAh·g
−1). If the C15 alloy powder samples are entirely embedded in a soft metallic binder (Ni or Cu), their full capacities can be obtained [
68]. However, for our measurements, the MH powder was directly compacted onto a Ni substrate without any binder or metallic fine particles, which results in the easy release of hydrogen gas from the surface and incomplete charge. Moreover, the C15 and C15A alloys show better HRD and activation performances than the C14 alloy, and the HRD of the C15 alloy is slightly higher than that of the C15A alloy, due to the eliminations of the secondary phase and accompanied synergic effect by annealing. We believe that the differences in activation, degradation, and HRD originated from the composition rather than the structure. By comparing the compositions of alloys C14 and C15 (
Table 4), Cr, a very important substitution element in the MH alloy for the enhancement of corrosion resistance by forming the V-Cr-based solid solution secondary phase [
78,
99], is absent in alloy C15. Alloy C15 also has a higher Ni-content, which is known for achieving a better HRD performance [
100,
101]. While the Cr-containing alloy C14 is more difficult to activate but maintains the discharge capacity in the first 13 cycles, the Cr-free alloy C15 shows some capacity degradation. After annealing, the capacity degradation of alloy C15A is improved but still noticeable in cycles 9 to 13 (
Figure 6a).
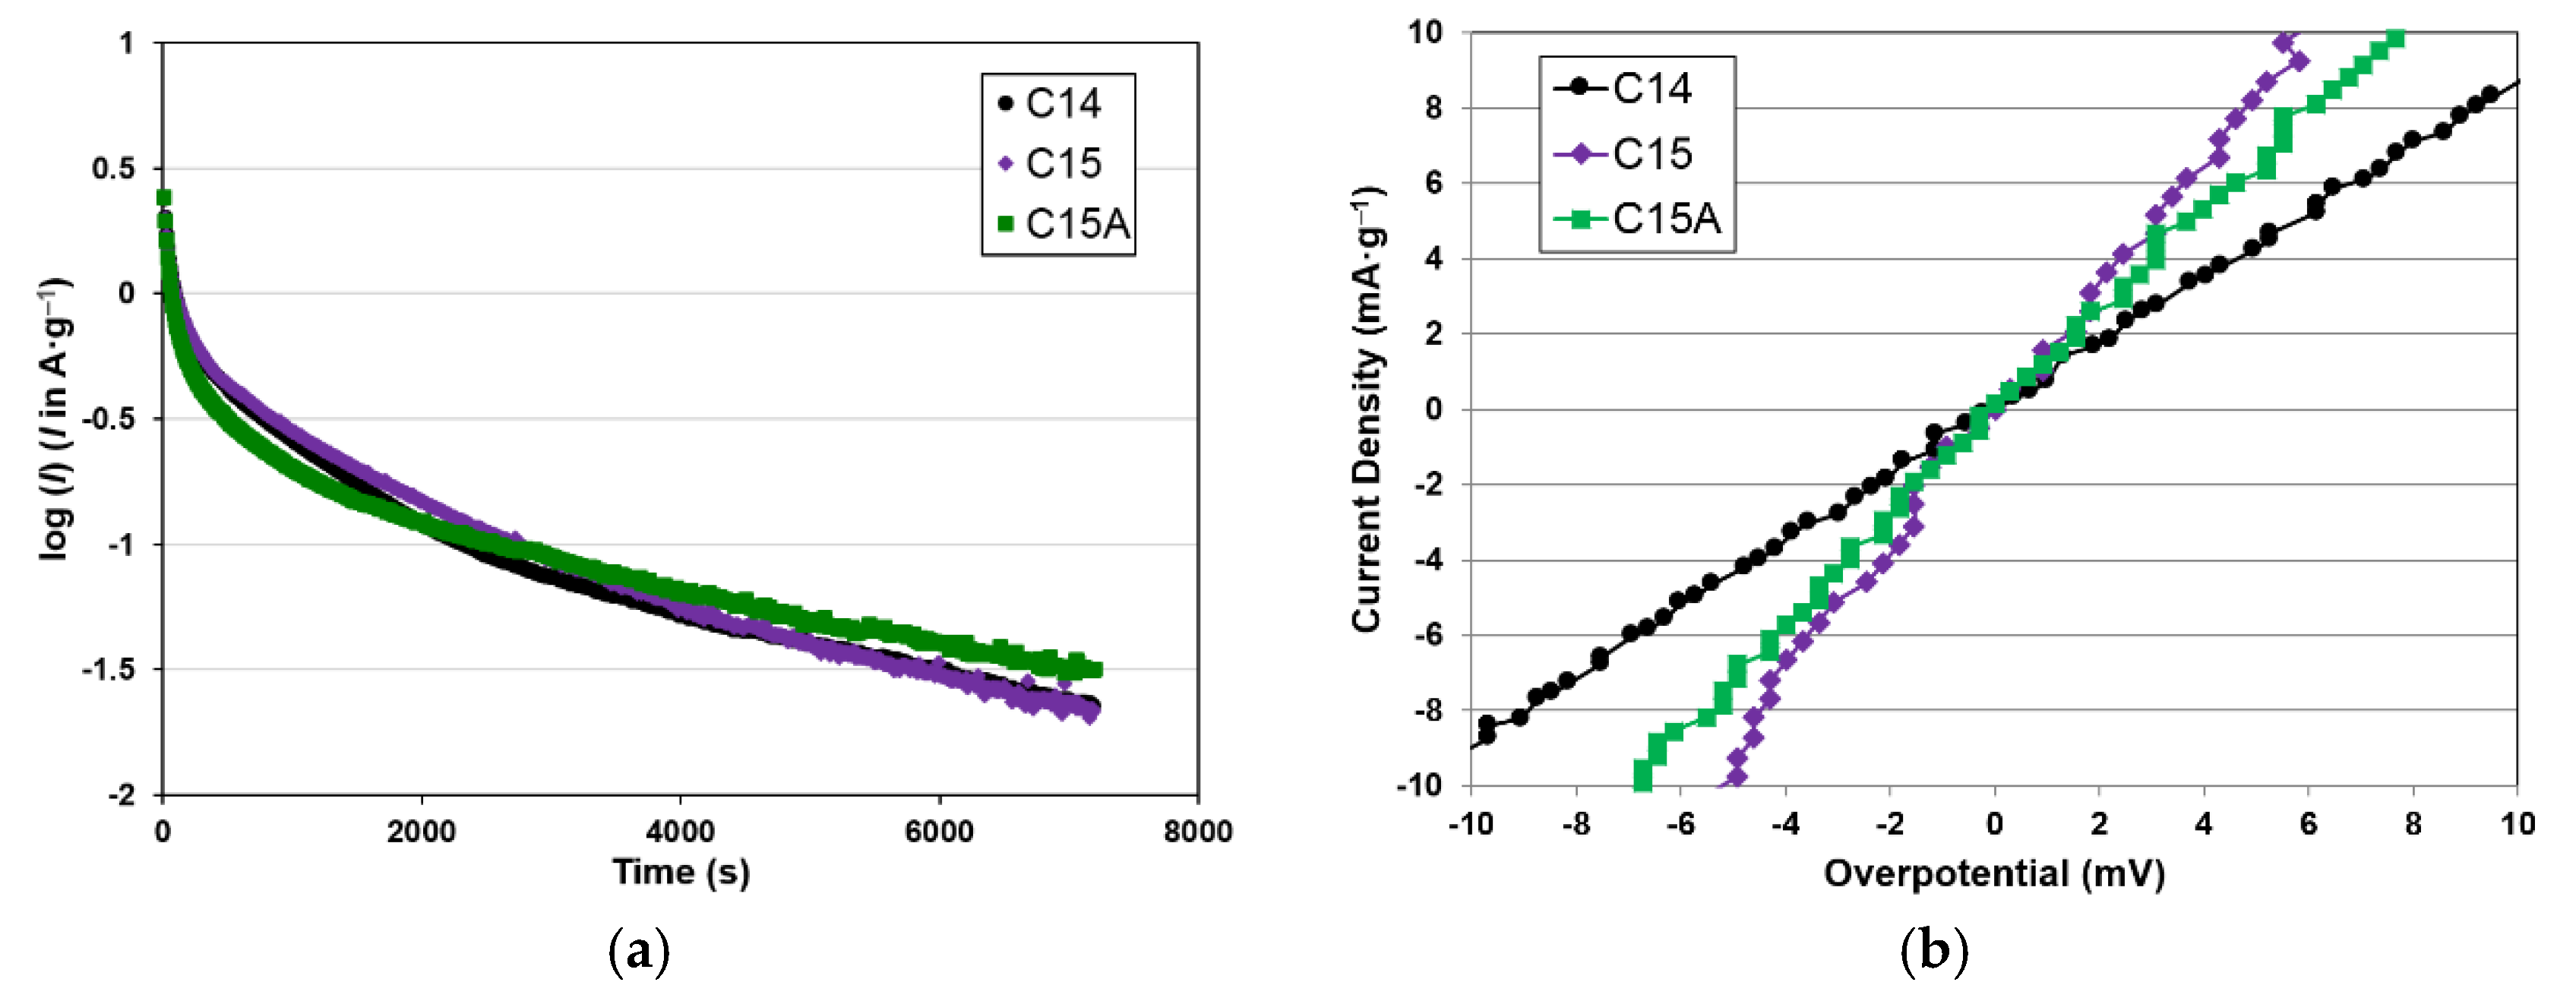
The superiority in HRD of alloys C15 and C15A was further investigated by electrochemically measuring
D and
Io.
D was measured by a potentiostatic discharge process—the electrode was first fully charged and then discharged at a potential of +0.6 V for 7200 s, and the anodic current response is tracked with respect to time during the process.
Figure 7a shows the resulted semi-logarithmic curves of the anodic current response vs. time for the three alloys.
D was estimated using the slope of the linear region of the semi-logarithmic response according to the equation [
102]:
where
i is the specific diffusion current (A·g
−1),
F is the Faraday constant,
Co is the initial hydrogen concentration in the alloy bulk (mol·cm
−3),
Cs is the hydrogen concentration on the surface of the alloy particles (mol·cm
−3),
d is the density of the H-storage alloy (g·cm
−3),
a is the alloy particle radius (cm), and
t is the discharge time (s).
Io was measured by linear polarization, specifically the electrode was first fully charged, then discharged to 50% depth-of-discharge, and then scanned within a small overpotential range of ±10 mV. In this small overpotential range, the current vs. overpotential shows a linear dependence, as seen in
Figure 7b, and
Io can be obtained from the equation [
103]:
where
i is the specific current (A·g
−1),
F is the Faraday constant, and
η is the overpotential. Further details for the
D and
Io calculations have been previously reported [
98], and the
D and
Io values for the current set of alloys are listed in
Table 8. While the
D values of the C14 and C15 alloys are close, it deteriorates after annealing for the C15 alloy, due to the elimination of the secondary phase. The main difference between the C14 and C15 alloys occurs in the surface reaction, where
Io in the C15 alloy is more than double that of the C14 alloy. The
Io value found for the C15 alloy is even higher than that in an AB
5 MH alloy that has a higher Ni-content [
104]. After annealing,
Io decreases, which confirms the positive contribution of the ZrNi secondary phase to the surface reaction. ZrNi is more susceptible to dissolution in KOH solution, and its existence in the AB
2 MH alloys has been shown to improve HRD [
62]. In conclusion, the superior HRD of the C15 alloy comes from the higher
Io value, which indicates a faster surface reaction.
In order to investigate the source of the faster surface reaction (higher
Io) found in the C15 alloy, AC impedance measurements were conducted at both room temperature (RT) and −40 °C. The charge-transfer resistance (
R) and double-layer capacitance (
C) obtained from Cole-Cole plots [
88] are listed in
Table 9. There are two factors dominating the
R values: the amount of reactive surface area and surface reaction catalytic ability. While the former is directly proportional to the capacitance, the latter can be related to the
RC product (a higher
RC corresponds to a worse catalytic surface) [
105]. From the comparisons in
Table 9, the C15 alloy has lower
R values at both RT and −40 °C, mainly due to its higher amount of reactive surface area (higher
C), which is closely related to the addition of La [
70]. In addition, the surface catalytic abilities of the C15 alloy at RT and −40 °C are the same as and slightly worse, respectively, than those of the C14 alloy. Therefore, we conclude that the higher
Io of the C15 alloy originates from the higher amount of reactive surface, which is due to the additional La, an absence of Cr, and a higher Mn-content in the composition. As for the annealing effects for the C15 alloy, the data in
Table 9 show deteriorated
R’s at both RT and −40 °C after annealing, which is due to the reduction in reactive surface area. The unchanged
RC product with annealing requires further investigation and is discussed in the next section.
3.5. Magnetic Susceptibility Analysis
Measuring saturated values of magnetic susceptibility (
Ms) is a convenient way to quantify the amount of catalytic metallic Ni clusters embedded in the surface oxide, which has been shown to strongly influence the surface catalytic ability of MH alloys for electrochemical reactions [
79,
104,
106]. However, recent TEM studies revealed that other fine surface structures in the Si- [
82] and La- [
70] containing AB
2 MH alloys can also affect surface catalytic ability. Furthermore, applied magnetic fields corresponding to half of
Ms (
H1/2) can be used as a parameter to quantify the size of the metallic clusters; more specifically, it is inversely proportional to the size of the magnetic domain of these clusters [
8]. Results of
Ms and
H1/2 from the three alloys in this study are listed in the last two columns in
Table 8. The C15 alloy has a slightly higher
Ms (more catalytic surface) and
H1/2 (smaller metallic clusters) compared to the C14 alloy, which may be related to the larger surface area of the C15 alloy (higher RT
C in
Table 9). After annealing,
Ms is reduced by a large amount, but this change in
Ms is not reflected in the
RC product. Other factors, such as the change in composition of the La-containing phase (increases in La and Sn but reduction in Ni) after annealing, may be the cause of the unchanged catalytic ability, even though
Ms is reduced with annealing.


