Abstract
O3-NaCoO is a promising cathode material for sodium ion secondary batteries (SIBs). NaCoO shows phase separation (PS) into the O3 and O3 phases in the Na concentration range of 0.89 0.99. In order to estimate the domain size (r) in the two-phase region, we performed X-ray microdiffraction (XRMD) of thin films of NaCoO at x = 0.97 and ∼1. We found that r (≈400 nm) of the O3 domain is comparable to the particle size d (=331 ± 87 nm) in the as-grown O3-NaCoO film. This observation suggests that individual particles of NaCoO are single phase to minimize the strain at the O3–O3 phase boundary.
1. Introduction
Sodium ion secondary batteries (SIBs) store electric energy by the intercalation/deintercalation of abundant Na (Clark number = 2.63) [1,2]. In this sense, SIBs are suitable for large-scale batteries for the stable use of solar and wind energies. Recently, Komaba et al. [3] reported that hard carbon shows a good discharge capacity (⩾200 mAh/g) and cyclability as an anode for SIB. This observation has stimulated the development of SIBs for commercial utilization. Among the cathode materials for SIBs, layered oxides (NaMO, where M is a transition metal) with O3-type structure shows promising electrochemical properties [4,5,6]. For example, O3-NaCrO [4] shows a capacity of 120 mAh/g and an average operating voltage of 3.0 V with good cyclability. In addition, O3-NaFeCoO [5] shows a capacity of 160 mAh/g and an average operating voltage of 3.1 V with good cyclability.
Most of the O3-type materials, however, show successive phase transitions and phase separations (PSs). For example, O3-NaCoO shows successive phase transitions with decreases in the Na concentration (x) [7,8]: O3 (0.99 1), O3 + O3 (0.89 0.99), O3 (0.81 0.89), O3 + P3 (0.68 0.81), and P3 (0.59 0.68). The O3 phase belongs to trigonal structure (; Z = 3) with the AB|CA|BC stacking of the oxygen sheets, while the O3 phase belongs to monoclinic structure (; Z = 2) with the same oxygen stacking. On the other hand, the P3 phase belongs to hexagonal structure (; Z = 2) with the modified AB|BC|CA oxygen stacking. These structural changes seriously influence the cyclability and rate properties of the batteries.
In this paper, we investigated domain size (r) of the O3 phase in the O3–O3 phase-separated NaCoO by means of X-ray microdiffraction (XRMD). We concentrated our attention to the O3 + O3 region (0.89 0.99), because the oxygen stacking remains the same.We found that r (≈400 nm) of the O3 domain is comparable to the particle size d (=331 ± 87 nm) in the as-grown O3-NaCoO film. This observation suggests that individual particles of NaCoO are single phase to minimize the strain at the O3–O3 phase boundary.
2. Results
2.1. Discharge Curve of O3-NaCoO Film
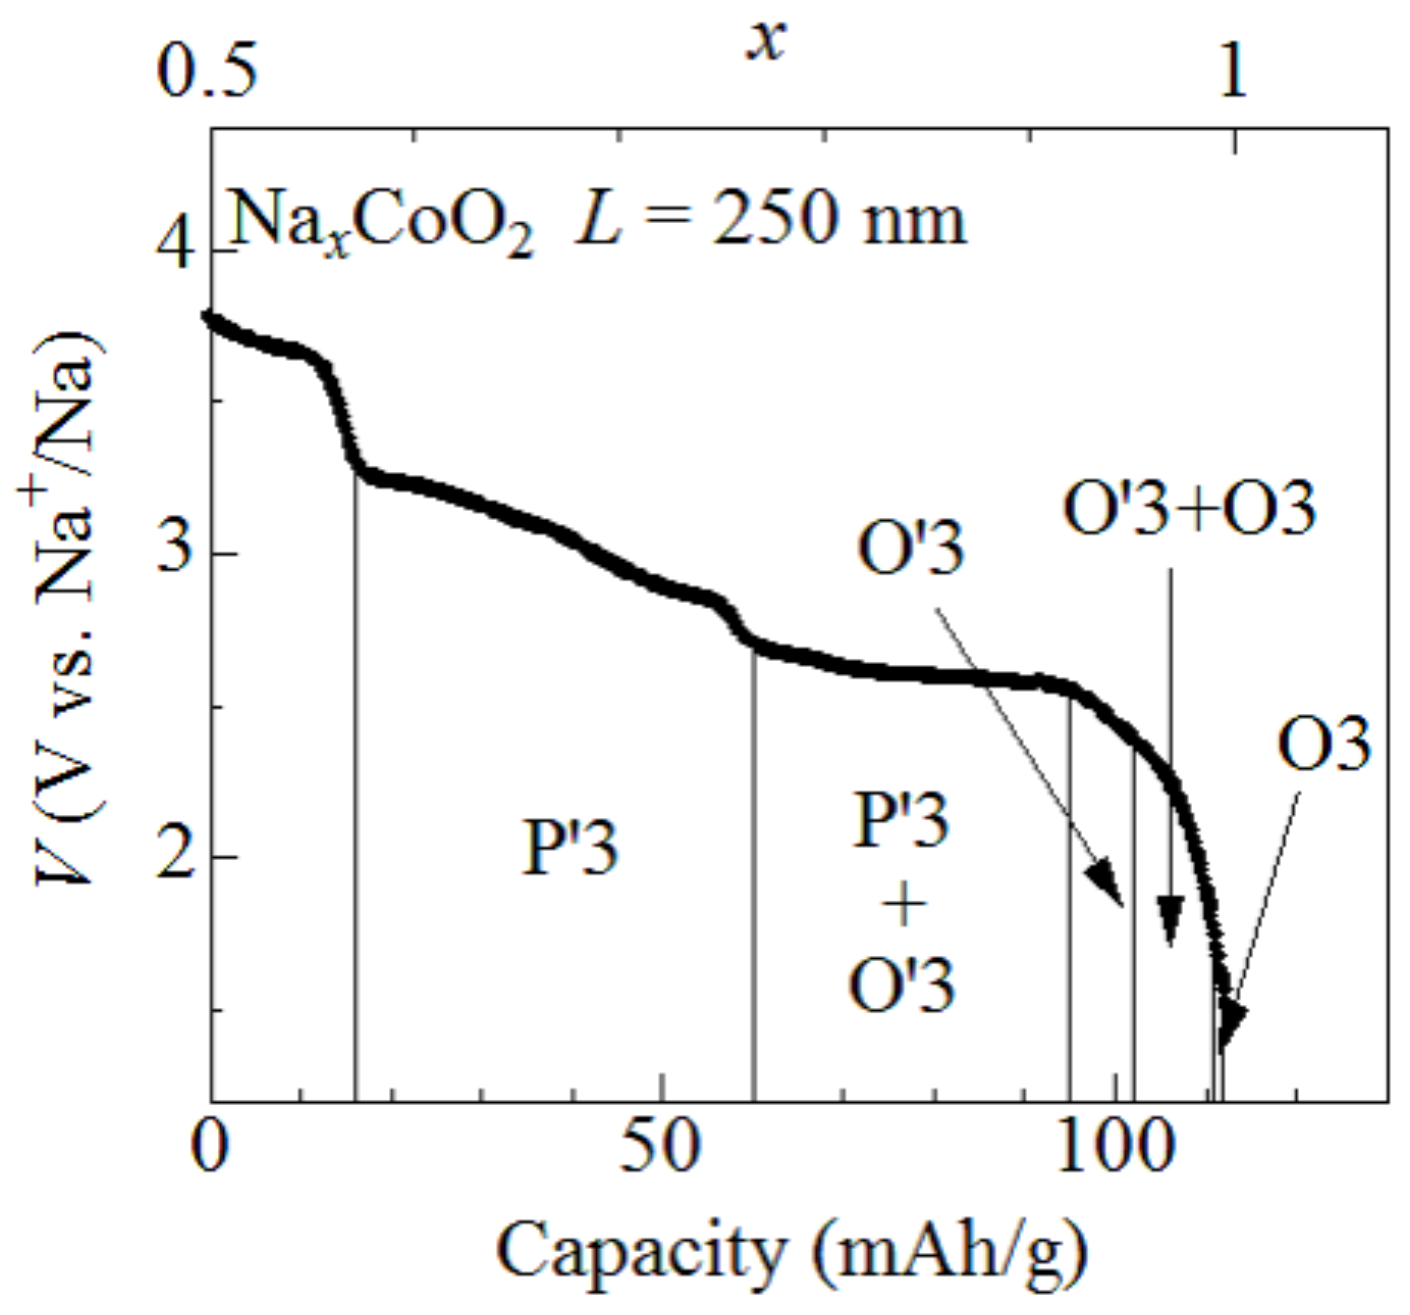
Figure 1 shows discharge curves of the O3-NaCoO film measured at 1.6C. The observed capacity (=112 mAh/g) is close to the ideal value (=113 mAh/g) of NaCoO. With use of the ideal capacity, we converted the discharge capacity into x and plotted the value on the upper axis. The capacity of the O3-NaCoO film slightly decreases with increase in the discharge rate, even at ∼1C [9]: 116 mAh/g at 0.2C, 100 mAh/g at 1.2C, and 82 mAh/g at 12C. Then, the x value may be slightly overestimated. Lei et al. [7] and Delmas et al. [8] investigated successive phase transitions of NaCoO and determined single- and two-phase regions against x. For convenience of the explanation, the single- and two-phase regions are cited from reference [7].
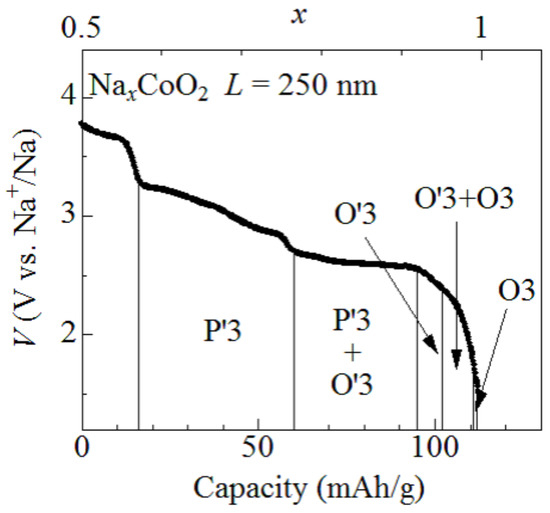
Figure 1.
Discharge curves of the O3-NaCoO film measured at 1.6C. The film thickness (L) is 250 nm. O3, O3, and P3 represented structural phases (cited from reference [7]).
2.2. X-Ray Diffraction and Rocking Curve
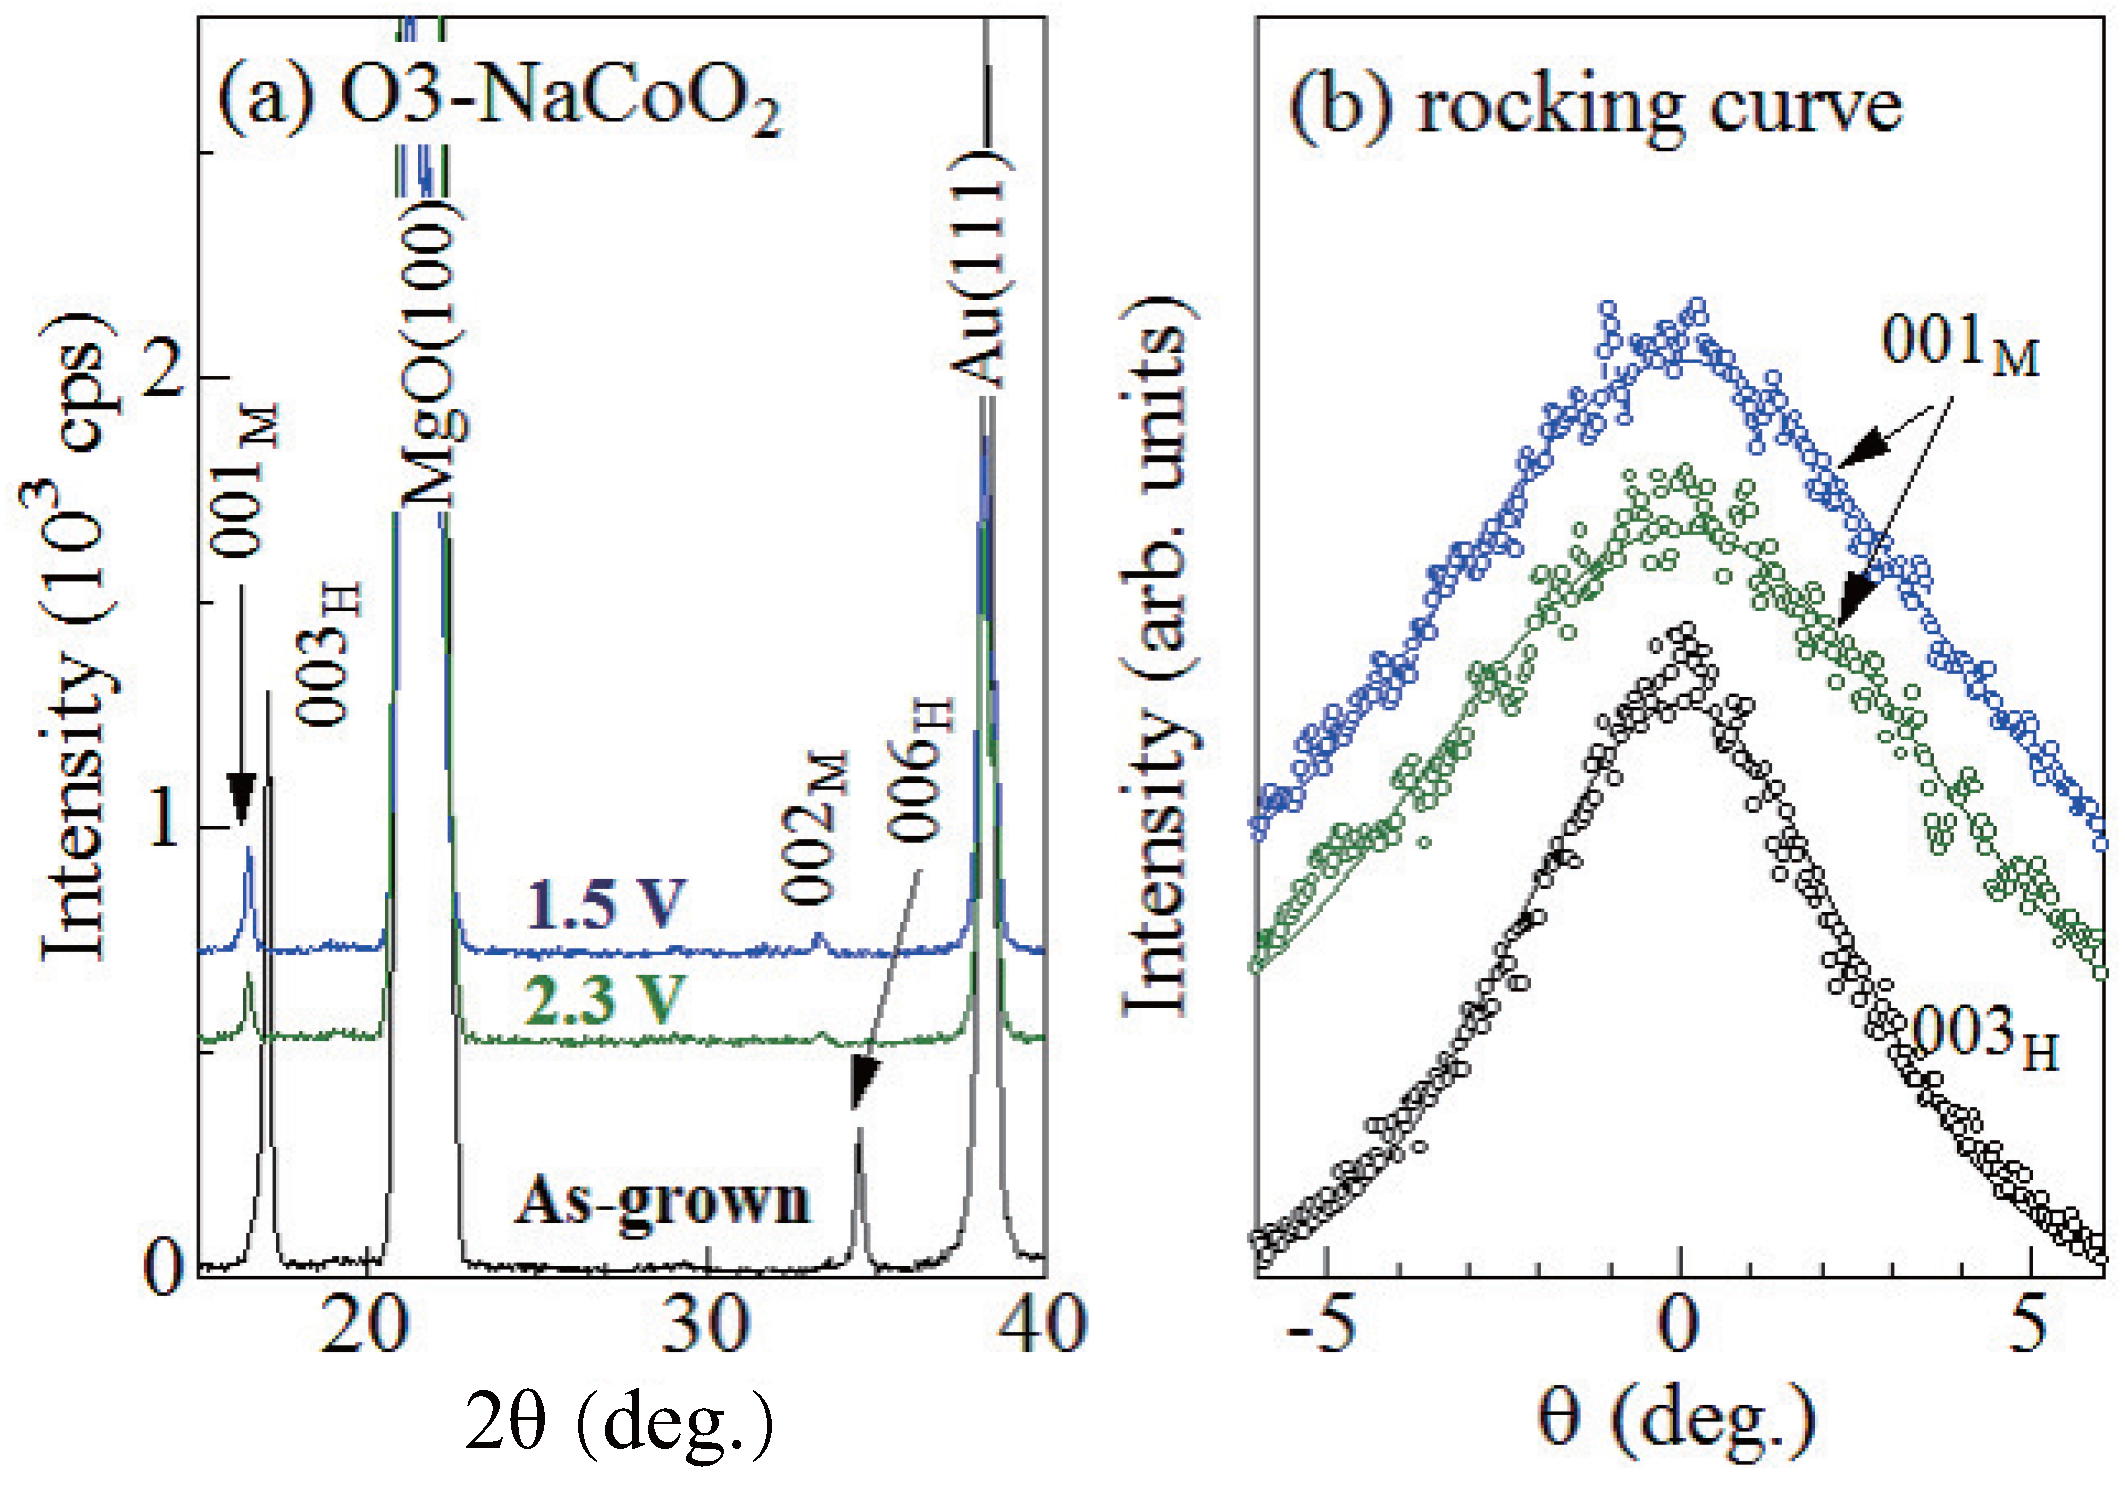
Figure 2a shows X-ray diffraction (XRD) patterns of the as-grown, 2.3 V, and 1.5 V films. The X-ray source was the Cu K line ( = 1.54 Å) operated at 40 kV and 40 mA. The 2.3 V and 1.5 V films locate in the O3 single phase region and O3 + O3 two-phase region: their x values are 0.97 and ∼1, respectively (Figure 1). In the as-grown film, intense 003 and 006 reflections are observed, indicating the 001-orientation of the films. We confirmed that the lattice constant c (=15.6 Å) of the as-grown film is consistent with the value (=15.58698(11) Å [9]) of the O3 phase. In the 2.3 V and 1.5 V films, the corresponding reflections shift to the low-2 side, indicating widening of the interlayer distance. The interlayer distance (≈5.37 Å) is close to the value (≈5.35 Å [7]) of the O3 phase. Therefore, we assigned the ∼16.5 (33.0) reflections to 001 [002] of the O3 phase. We note that no trace of the 003 and 006 reflections are observed in the 2.3 V and 1.5 V films, indicating that the films are dominated by the O3 phase.
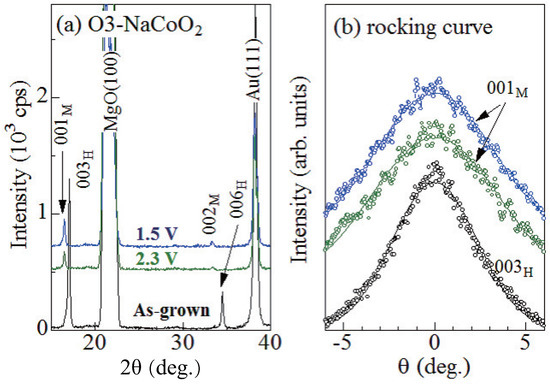
Figure 2.
(a) X-ray diffraction (XRD) pattern of the as-grown, 2.3 V, and 1.5 V films. Values in parentheses represent indexes in the trigonal [hexagonal (H) setting] and monoclinic (M) structures. (b) rocking curve at the 003, 001, and 001 reflections of the as-grown, 2.3 V, and 1.5 V films, respectively. Solid curves are results of the least-squares fittings with Gauss functions.
In order to investigate the out-of-plane distribution of the crystal orientation, we measured the out-of-plane rocking curves. Figure 2b shows the rocking curves at the 003, 001, and 001 reflections of the as-grown, 2.3 V, and 1.5 V films, respectively. Full width of half maxima (FWHM) are 5.5, 8.3, and 7.7 for the as-grown, 2.3 V, and 1.5 V films, respectively. Here, we note that FWHM (=7.9) of the fully-charged NaCoO film is comparable to those of the 2.3 V and 1.5 V films. This indicates that the increase in FWHM should be ascribed to the initial charge process, and not to the subsequent discharge process. This means that the initial charge process enlarges the out-of-plane distribution of the crystal orientation.
2.3. X-Ray Microdiffraction
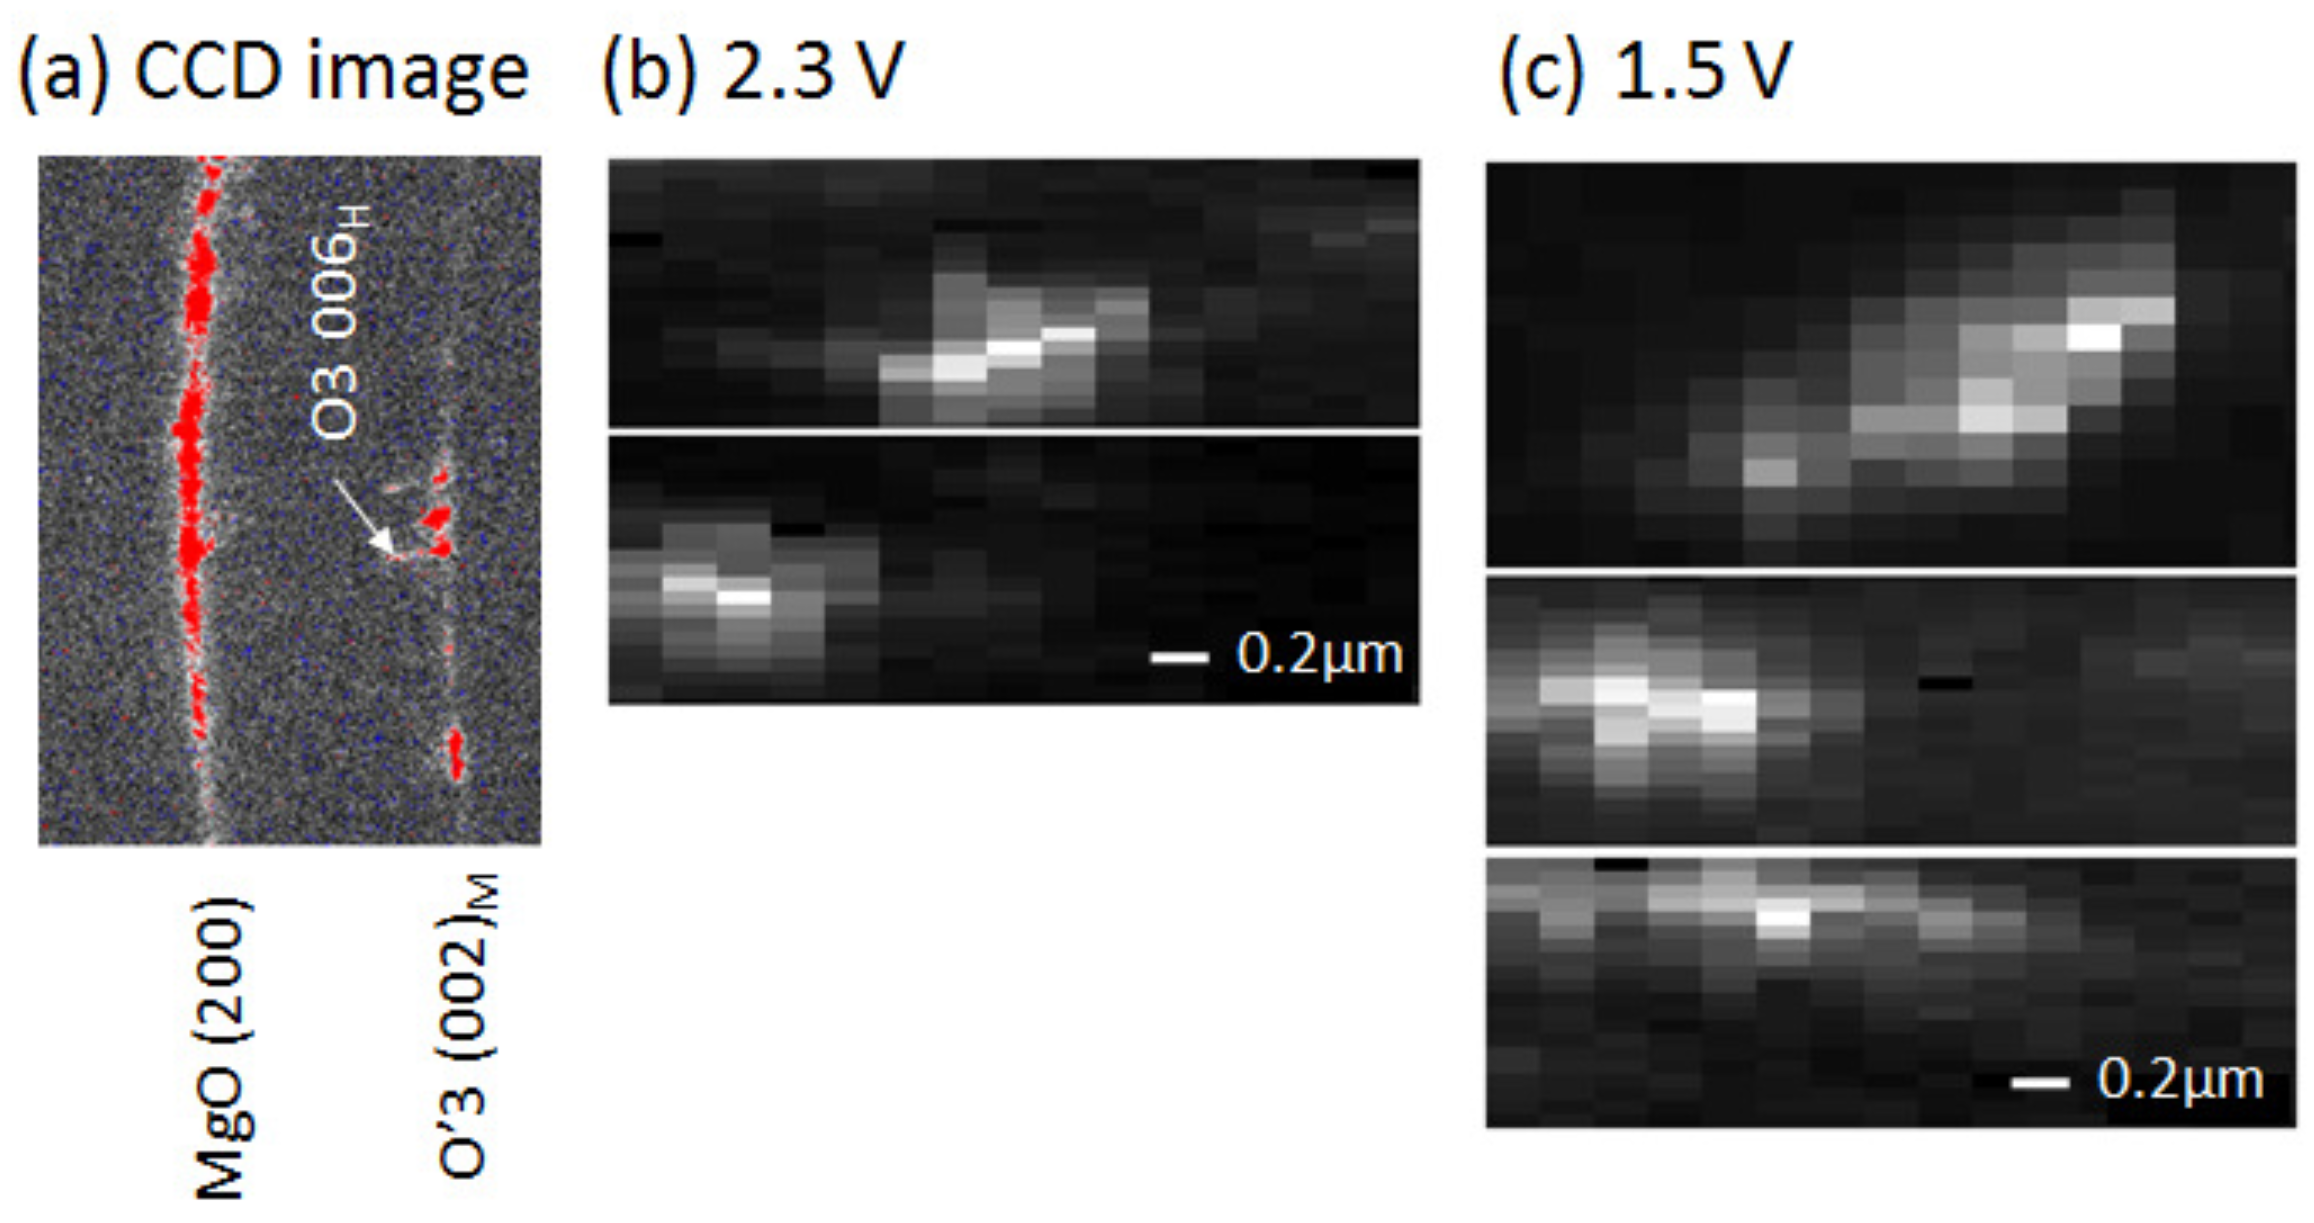
Figure 3a shows an example of the charge coupled device (CCD) image of the 2.3 V film at 2 33. We observed many Bragg reflections, indicating that there exists many crystal domains in the footprint area (1130 nm (H) × 260 nm (V)) of the incident X-ray. We found that most of the spots are ascribed to the O3 phase. This indicates that the 2.3 V film is dominated by the O3 phase, consistent with the XRD pattern of the 2.3 V film (Figure 2a). Thus, we concentrated our attention on the r values of the respective O3 domains. We measured the intensity images (XRMD images) of specific Bragg spots against the sample position (x, y) relative to the incident X-ray.
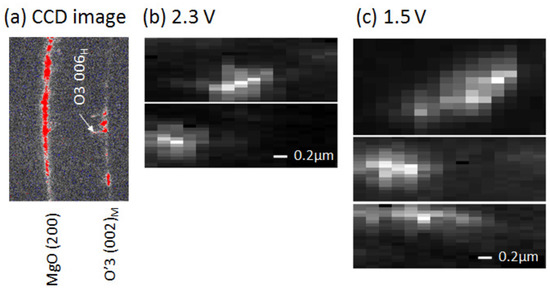
Figure 3.
(a) Example of the charge coupled device (CCD) image of the 2.3 V film at 2∼ 33 . The footprint area of the incident X-ray was 1130 nm (H) × 260 nm (V). (b) X-ray microdiffraction (XRMD) images of O3 domains of the 2.3 V film; and (c) XRMD images of O3 domains of the 1.5 V film.
Figure 3b shows examples of the XRMD images of the O3 domains in the 2.3 V film. The images are x-elongated due to the worse horizontal resolution (=1130 nm). Therefore, we evaluated the domain sizes along the y-direction by means of least-squares fitting with a Gauss function. The r values are 365 nm (upper image in Figure 3b) and 357 nm (lower). We performed similar analyses in the 1.5 V film and evaluated the sizes of the O3 domains (Figure 3c). The r values are 331 nm (upper image in Figure 3c), 431 nm (middle), and 571 nm (lower). Thus-obtained domain size r (≈400 nm) is comparable to the particle size d (=331 ± 87 nm) in the as-grown film. This observation suggests that individual particles of NaCoO are single phase.
3. Discussion
Here, let us discuss the mechanism of the PS in O3-NaCoO. In NaCoO, the high- and low-x regions prefer the O3 and O3 structures, respectively [7]. Then, the Na deintercalation can trigger the PS. For convenience of explanation, we classify the PS into two types: microscopic PS within the particle, and macroscopic PS between the particles. The microscopic PS is initiated by nucleation of the second (O3) phase, whose size is determined by the balance between the free energy gain due to the phase transformation and the strain loss at the O3–O3 phase boundaries. The microscopic PS, however, suffers from the inner stresses at the phase boundaries. On the other hand, the macroscopic PS is energetically advantageous because homogeneity of the particle structure releases the inner stresses. This scenario is analogous to the domino-cascade model proposed in LiFePO [10]. We note that macroscopic phase separation into high- and low-x regions is possible in battery materials, because the local charge neutrality is kept by the oxidation of the transition metal.
Our XRMD investigation suggests that individual particles of NaCoO are single phase. In other words, NaCoO shows macroscopic PS in the O3–O3 two-phase region. Then, the charge process of O3-NaCoO is considered to be as follows. The Na deintercalation causes the formation of a O3 micro-domain within the O3 particle. The O3–O3 phase boundary is energetically unstable, because the cell parameters are significantly different between the O3 and O3 phases: a = 2.8883 Å and c = 15.6019 Å in NaCoO (O3) while a = 4.8912 Å, b = 2.8681 Å, c = 5.7927 Å, and = 111.84 in NaCoO (O3) [7]. In addition, the c axis tilts toward the a axis by 21.84 in the O3’ phase, even though the oxygen stacking is the same as in the O3 phase. Such a tilting is also responsible for the instability of the O3–O3 phase boundary. Then, the O3–O3 phase boundaries behave as active sites for the electrochemical reaction. This is because the Na deintercalation at the phase boundary is much easier than the nucleation of a new O3 micro-domain in another particle. After the competition of the O3–O3 transformation in one particle, formation of another O3 micro-domain takes place in another O3 particle.
4. Materials and Methods
4.1. Film Preparation and Characterization
A thin film of O3-NaCoO was prepared by pulsed laser deposition (PLD) method [9]. The film was grown on Au-deposited MgO (100) substrate at 823 K in an oxygen partial pressure of 0.01 Pa for 20 min. The area of the film was 0.5 cm. The targets of O3-NaCoO were prepared by solid state reaction. First, NaO and CoO were mixed in a 1.25:1.0 atomic ratio and calcined at 823 K for 16 h in O atmosphere. Then, the powder was finely ground, pressed into pellets with 10 mm diameter, and calcined at 823 K for 16 h in O atmosphere. The second harmonics of an yttrium–aluminum–garnet (YAG) pulse laser was used as excitation light source. The pulse energy, repetition frequency, and wavelength were 2.0 J/cm, 10 Hz, and 532 nm, respectively. The distance between the target and the substrate was 35 mm. The XRD pattern indicates the O3 structure, which is stable in a narrow x-range (0.99 1) [7]. Therefore, we regard the chemical composition of the film as NaCoO.
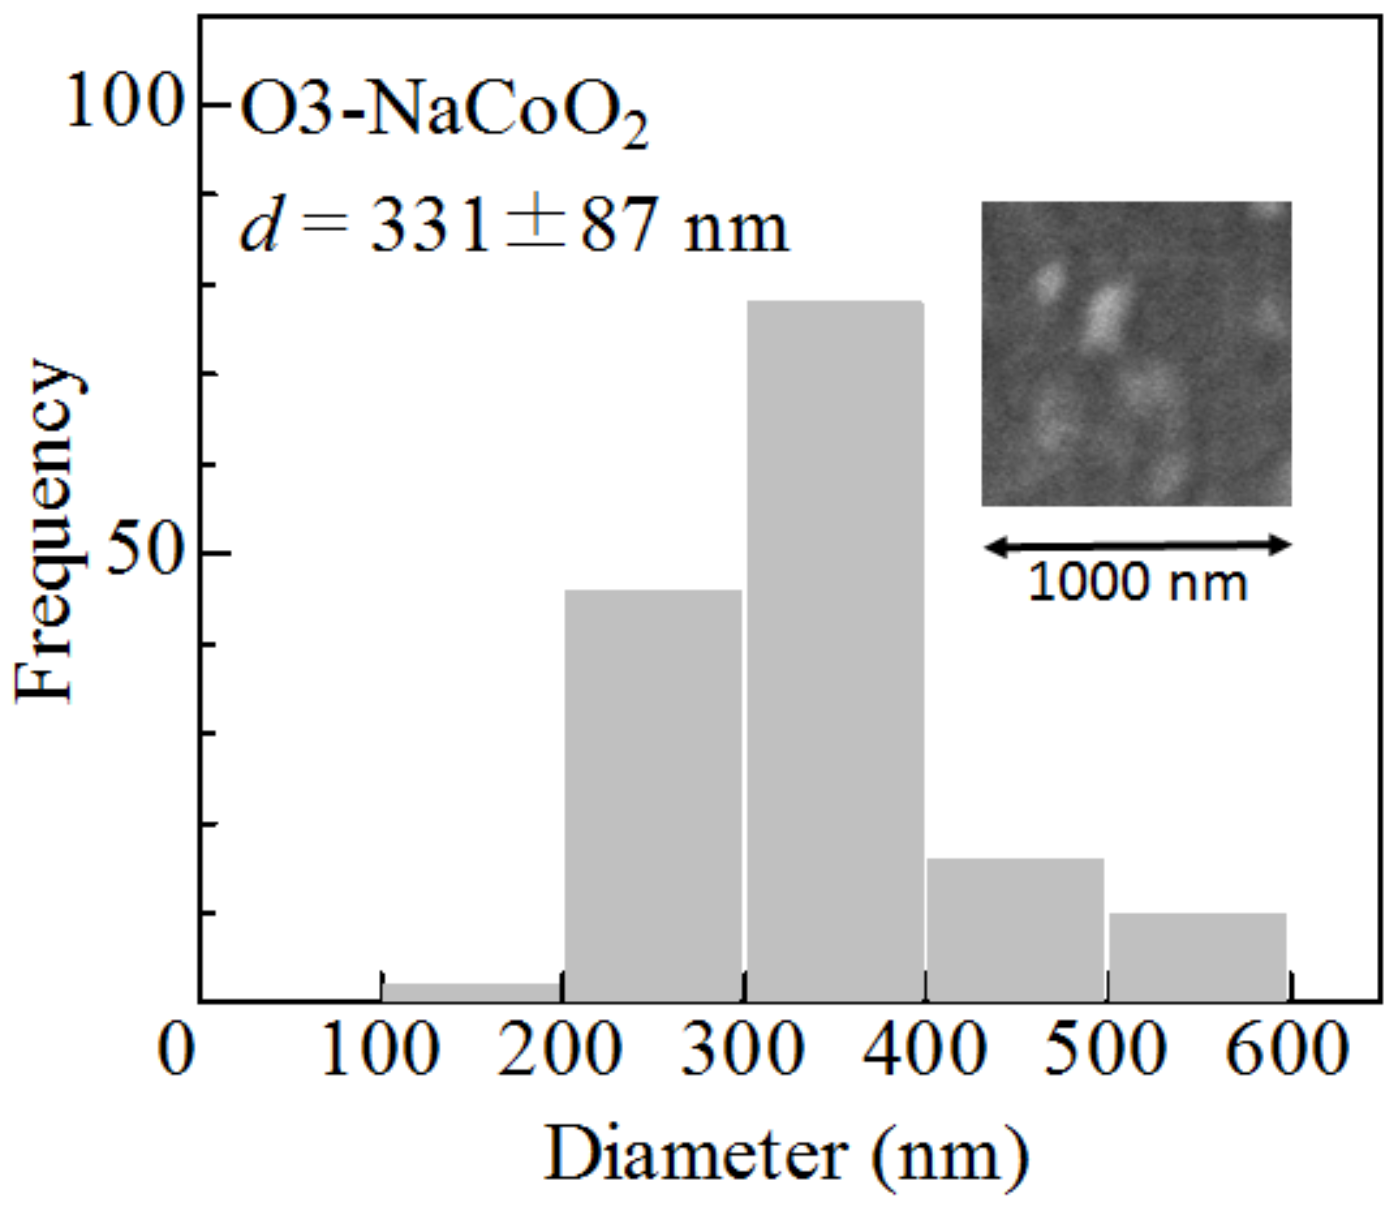
The morphology of the as-grown film was investigated using scanning electron microscopy (SEM) images (Mighty-8, TECHNEX, Tokyo, Japan). The acceleration voltage was 2 keV. The as-grown film of O3-NaCoO consists of crystalline particles. The particle size d (=331 ± 87 nm) was evaluated from 152 particles (Figure 4). The film thickness (L) was 250 nm, which was determined by cross-sectional SEM image. The mass (=0.063 g) of the active material was estimated by L and the ideal density (=5.02 g/cm) of NaCoO.
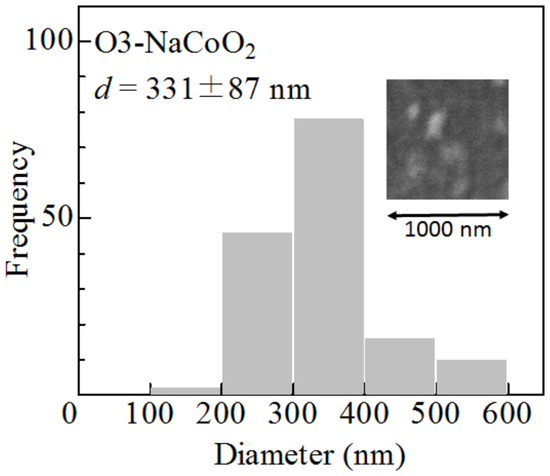
Figure 4.
Histogram of the particle size (d) of the as-grown O3-NaCoO film. Inset shows scanning electron microscopy (SEM) images of the film.
4.2. Control of x
The x values were electrochemically controlled in the discharge process from the fully-charged NaCoO film in a handmade two-pole cell. The cathode and anode were the film and the Na metal, respectively. The electrolyte was propylene carbonate (PC) containing 1 M NaClO. The upper cut-off voltage was 3.8 V. The charge/discharge rate was ∼1 C. The discharge capacity (=112 mAh/g) was close to the ideal value (=113 mAh/g) of O3-NaCoO. We cut the as-grown O3-NaCoO film into four pieces. After the charge process, we performed a discharge run, setting the lower cut-off voltage at 1.5 V (1.5 V film) or 2.3 V (2.3 V film). In the XRD and rocking curve measurements, we used a set of films prepared from the same film. In the scanning X-ray microbeam diffraction, we used another set of films.
4.3. X-Ray Diffraction and Rocking Curve
The XRD patterns were obtained using an X-ray powder diffractometer (MultiFlex, Rigaku, Tokyo, Japan) with the Bragg–Brentano (–2) geometry. The X-ray source was the Cu K line ( = 1.54 Å) operated at 40 kV and 40 mA. A Si monochromator was used to reduce the scattering by the white X-ray. The rocking curve was measured at the 003, 001, and 001 reflections of the as-grown, 2.3 V, and 1.5 V films, respectively. In the measurement, the axis was scanned fixing 2 at the peak position of the reflection.
4.4. X-Ray Microdiffraction
XRMD experiments were performed using a hard X-ray undulator beamline (BL13XU) at SPring-8 [11,12]. The X-ray energy (E) was 8 keV. The energy resolution (/E) was 10 using a Si(111) double-crystal monochromator. The wavelength of the incident X-ray microbeam was 1.55 Å. The size of the incident X-ray microbeam was 330 nm (H) × 260 (V) nm using a zone plate.
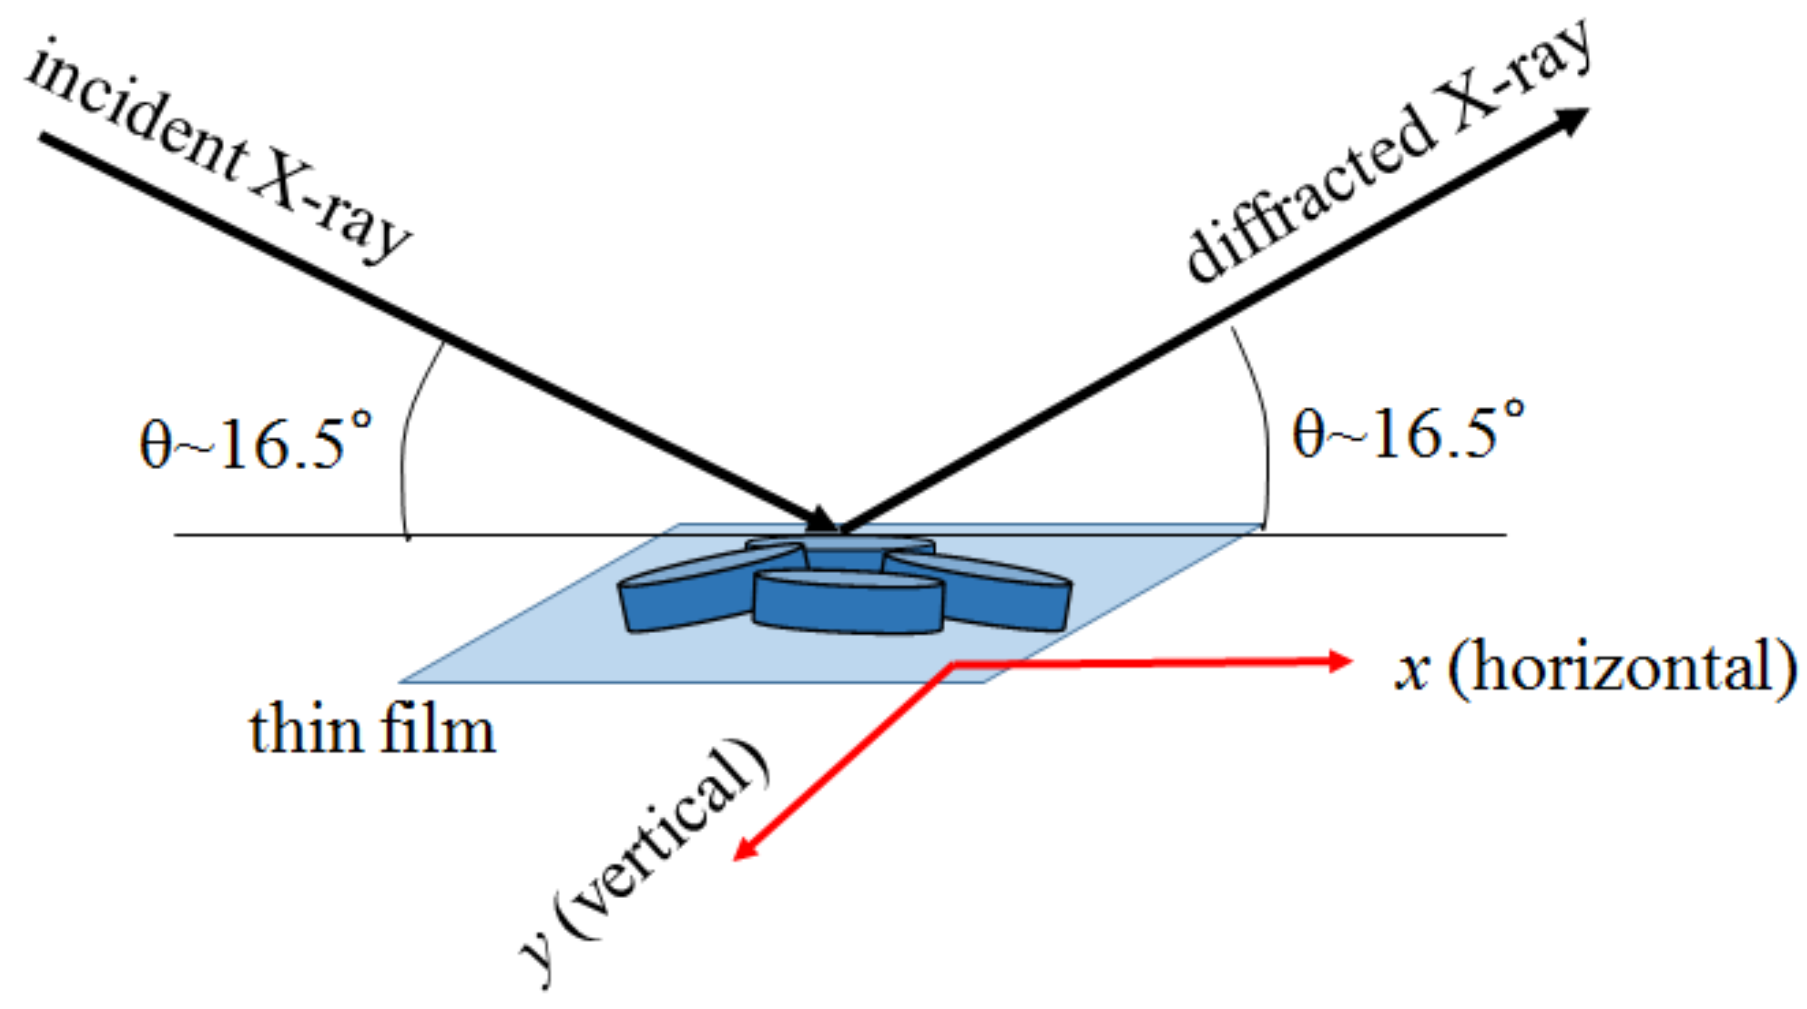
Figure 5 shows a schematic configuration of the XRMD experiment. The X-ray microbeams are incident at an angle of 16.5, which corresponds to the 006 reflection of the O3 phase and 002 reflection of the O3 phase. The penetration depth is 11.3 m at 8 keV. The diffracted X-ray microbeam was acquired with a CCD. We measured the CCD image of the diffraction intensity against the relative position (x, y) of the X-ray microbeam. Focusing on a certain domain, we obtained the real-space mapping (XRMD image) of the diffraction intensity within region of interest (ROI) in the CCD image. In this diffraction geometry, the footprint area of the incident X-ray was 1130 nm (H) × 260 nm (V) on the film surface. Therefore, the x-resolution (=1130 nm) is much worse than the y-resolution (=260 nm). The intervals of x and y were 200 nm and 50 nm, respectively.

Figure 5.
Schematic configuration of XRMD.
5. Conclusions
We performed XRMD investigation on the (001) reflections of a thin film of NaCoO in the O3–O3 two-phase region. We found that r (≈400 nm) of the O3 domain is comparable to the particle size d (=331 ± 87 nm) in the as-grown O3-NaCoO film. This observation suggests that NaCoO shows the macroscopic PS in the O3–O3 two-phase region. We discussed the charge process of O3-NaCoO in terms of the O3–O3 phase boundaries as active sites.
Acknowledgments
This work was supported by the Nippon Sheet Glass Foundation for Materials Science and Engineering and Yazaki Memorial Foundation for Science and Technology. The X-ray microdiffraction measurements were performed at the SPring-8 BL13XU beamline with the approval (2016A1046) of the Japan Synchrotron Radiation Research Institute (JASRI).
Author Contributions
Hideharu Niwa performed all the experiments including the film preparation and characterization, and X-ray microdiffraction measurements. Takayuki Shibata provided advices regarding the film preparation and characterization. Yasuhiko Imai and Shigeru Kimura collaborated in the X-ray microdiffraction measurements as beamline staff. Yutaka Moritomo planned the research and wrote the manuscript.
Conflicts of Interest
The authors declare no conflict of interest.
References
- Kim, S.-W.; Seo, D.-H.; Ma, X.; Ceder, G.; Kang, K. Electrode materials for rechargeable sodium-ion batteries: Potential alternatives to current lithium-ion batteries. Adv. Energy Mater. 2012, 22, 710–721. [Google Scholar] [CrossRef]
- Ong, S.-P.; Chevrier, V.-L.; Hautier, G.; Jain, A.; Moore, C.; Kim, S.; Ma, X.; Ceder, G. Voltage, stability and diffusion barrier differences between sodium-ion and lithium-ion intercalation materials. Energy Environ. Sci. 2011, 4, 3680–3688. [Google Scholar] [CrossRef]
- Komaba, S.; Murata, W.; Ishikawa, T.; Yabuuchi, N.; Ozeki, T.; Nakayama, T.; Ogata, A.; Gotoh, K.; Fujiwara, K. Electrochemical Na insertion and solid electrolyte interphase for hard-carbon electrodes and application to Na-ion batteries. Adv. Energy Mater. 2011, 21, 3859–3867. [Google Scholar] [CrossRef]
- Komaba, S.; Takei, C.; Nakayama, T.; Ogata, A.; Yabuuchi, N. Electrochemical intercalation activity of layered NaCrO2 vs. LiCrO2. Electrochem. Commun. 2010, 12, 355–358. [Google Scholar] [CrossRef]
- Yoshida, H.; Yabuuchi, N.; Komaba, S. NaFe0.5Co0.5O2 as high energy and power positive electrode for Na-ion batteries. Electrochem. Commun. 2013, 34, 60–63. [Google Scholar] [CrossRef]
- Zhao, K.; Zhao, L.; Dimov, N.; Okada, S.; Nishida, T. Electrochemical and thermal properties of α-NaFeO2 cathode for Na-ion batteries. J. Electrochem. Soc. 2013, 160, A3077–A3081. [Google Scholar] [CrossRef]
- Lei, Y.; Li, X.; Liu, L.; Ceder, G. Synthesis and stoichiometry of different layered sodium cobalt oxides. Chem. Mater. 2014, 26, 5288–5296. [Google Scholar] [CrossRef]
- Delmas, C.; Braconnier, J.; Fouassier, C.; Hagenmuller, P. Electrochemical intercalation of sodium in NaxCoO2 bronzes. Solid State Ion. 1981, 3–4, 165–169. [Google Scholar] [CrossRef]
- Shibata, T.; Fukuzumi, Y.; Kaboyashi, W.; Moritomo, Y. Fast discharge process of layered cobalt oxides due to high Na+ diffusion. Sci. Rep. 2015, 5. [Google Scholar] [CrossRef] [PubMed]
- Delmas, C.; Maccario, M.; Croguennec, L.; Le Cras, F.; Weill, F. Lithium deintercalation in LiFePO4 nanoparticles via a domino-cascade model. Nat. Mater. 2008, 7, 665–671. [Google Scholar] [CrossRef] [PubMed]
- Imai, Y.; Kimura, S.; Sakata, O.; Sakai, A. High-angular-resolution microbeam X-ray diffraction with CCD detector. AIP Conf. Proc. 2010, 1221, 30–32. [Google Scholar]
- Takeda, S.; Kimura, S.; Skata, O.; Sakai, A. Development of high-angular-resolution microdiffraction system for reciprocal space map measurement. Jpn. J. Appl. Phys. 2006, 45, L1054–L1056. [Google Scholar] [CrossRef]
© 2017 by the authors. Licensee MDPI, Basel, Switzerland. This article is an open access article distributed under the terms and conditions of the Creative Commons Attribution (CC BY) license ( http://creativecommons.org/licenses/by/4.0/).