1. Introduction
Li-ion batteries are appropriate for use in cell phones, laptop computers, digital cameras, renewable energy storage, and smart grid applications because of their relatively high energy density, low cost, and high rate capabilities. Li-ion batteries used in hybrid-electric vehicle or electric vehicle applications must be charged and discharged rapidly; therefore, the electrodes must perform at a high rate and maintain high discharge capacity and reliable cycle-life stability. Compared with the LiFePO
4 cathode material [
1], the LiMnPO
4 cathode material exhibits a higher working potential at 4.1 V (
versus Li/Li
+) and is compatible with conventional liquid carbonate-based electrolytes. The energy density of the LiMnPO
4 (697 Wh·kg
−1) [
2] is higher than that of the LiFePO
4 (586 Wh·kg
−1); however, the electrical conductivity of the LiMnPO
4 material (less than 10
−10 S·cm
−1) is much lower than that of the LiFePO
4 material (at 1.8 × 10
−8 S·cm
−1). The electrochemical performance can be improved by coating the samples’ surface with carbon, or by doping with Fe atoms or nano-sized cathode materials. Olive phosphate materials combined with mixed transition-metal ions, such as LiFe
1−xMn
xPO
4/C, have recently attracted considerable attention [
3,
4,
5,
6,
7,
8,
9,
10,
11,
12,
13,
14]. Zou
et al. [
15] prepared LiFe
0.2Mn
0.8PO
4/C cathode materials by a solid-state method and sucrose used as the carbon source. The as-prepared cathode materials achieved capacities of 150 mAh g
−1 and 110 mAh g
−1 at 1/20C and 1C, respectively. Liu
et al. [
16] recently synthesized a LiMn
1−xFe
xPO
4/C (
x = 0.1, 0.2, 0.3) cathode material by a ball-milling process with MnPO
4·H
2O precursors, LiOH, NH
4H
2PO
4, and 30 wt% glucose. The as-prepared LiMn
0.7Fe
0.3PO
4/C cathode material had a capacity of 140 mAh·g
−1 and high rate performance. Mi
et al. [
17] prepared mesoporous LiFe
0.6Mn
0.4PO
4/C materials—comprising of different amounts of muti-wall carbon nanotubes (MWCNTs) by using a two-step carbon coating and spray drying process. The LiFe
0.6Mn
0.4PO
4/C materials with 2 wt% MWCNTs showed excellent performance by delivering a discharge capacity of 163.3 mAh·g
−1 at 0.1C and yielding an ultra-high rate capacity of 64.23 mAh·g
−1 at 50C. Hu
et al. [
18] prepared Fe-doped LiMn
1−xFe
xPO
4 (
x = 0.5) nanomaterials by using a solvothermal method. LiMn
0.5Fe
0.5PO
4 notably delivered a 100% capacity retention with a discharge capacity of 147 mAh·g
−1 at 1C rate. Zhong
et al. [
19] most recently synthesized a carbon-coated LiFe
0.5Mn
0.5PO
4/C (LFMP/C) material by a rheological phase reaction method with stearic acid as the carbon source (
i.e., a solid-state method). The LFMP/C material exhibited the highest electrochemical performance compared with the LiMn
0.2Fe
0.8PO
4/C and LiMn
0.8Fe
0.2PO
4/C materials. The LFMP/C material delivered discharge capacities of 138, 99, 80, 72, 67, and 55 mAh·g
−1 at 0.1C, 1C, 5C, 10C, 15C, and 20C rates, respectively. The LFMP/C material achieved long and stable cycling performance with a capacity of 103 mAh·g
−1 at 1C rate during a 100-cycle test.
In this work, nanostructured carbon materials show a variety of fascinating and admirable properties for Li-ion batteries, such as high surface area, low diffusion distance, and high electron and ionic conductivity [
20,
21]. Therefore, nano-sized carbon materials show extremely promising to improve the discharge capacity, the power capability, and the long cycling stability. We studied the carbon conductor effect on performances of LFMP/C composite. Both hollow carbon sphere (HCS) and nanoporous graphene (NP-GNS) were synthesized by a hydrothermal process. The characteristic properties of the LFMP/C composite cathode materials were examined by micro-Raman spectroscopy, X-ray diffraction (XRD), scanning electron microscopy (SEM), elemental analysis (EA), and alternating current (AC) impedance method.
3. Results and Discussion
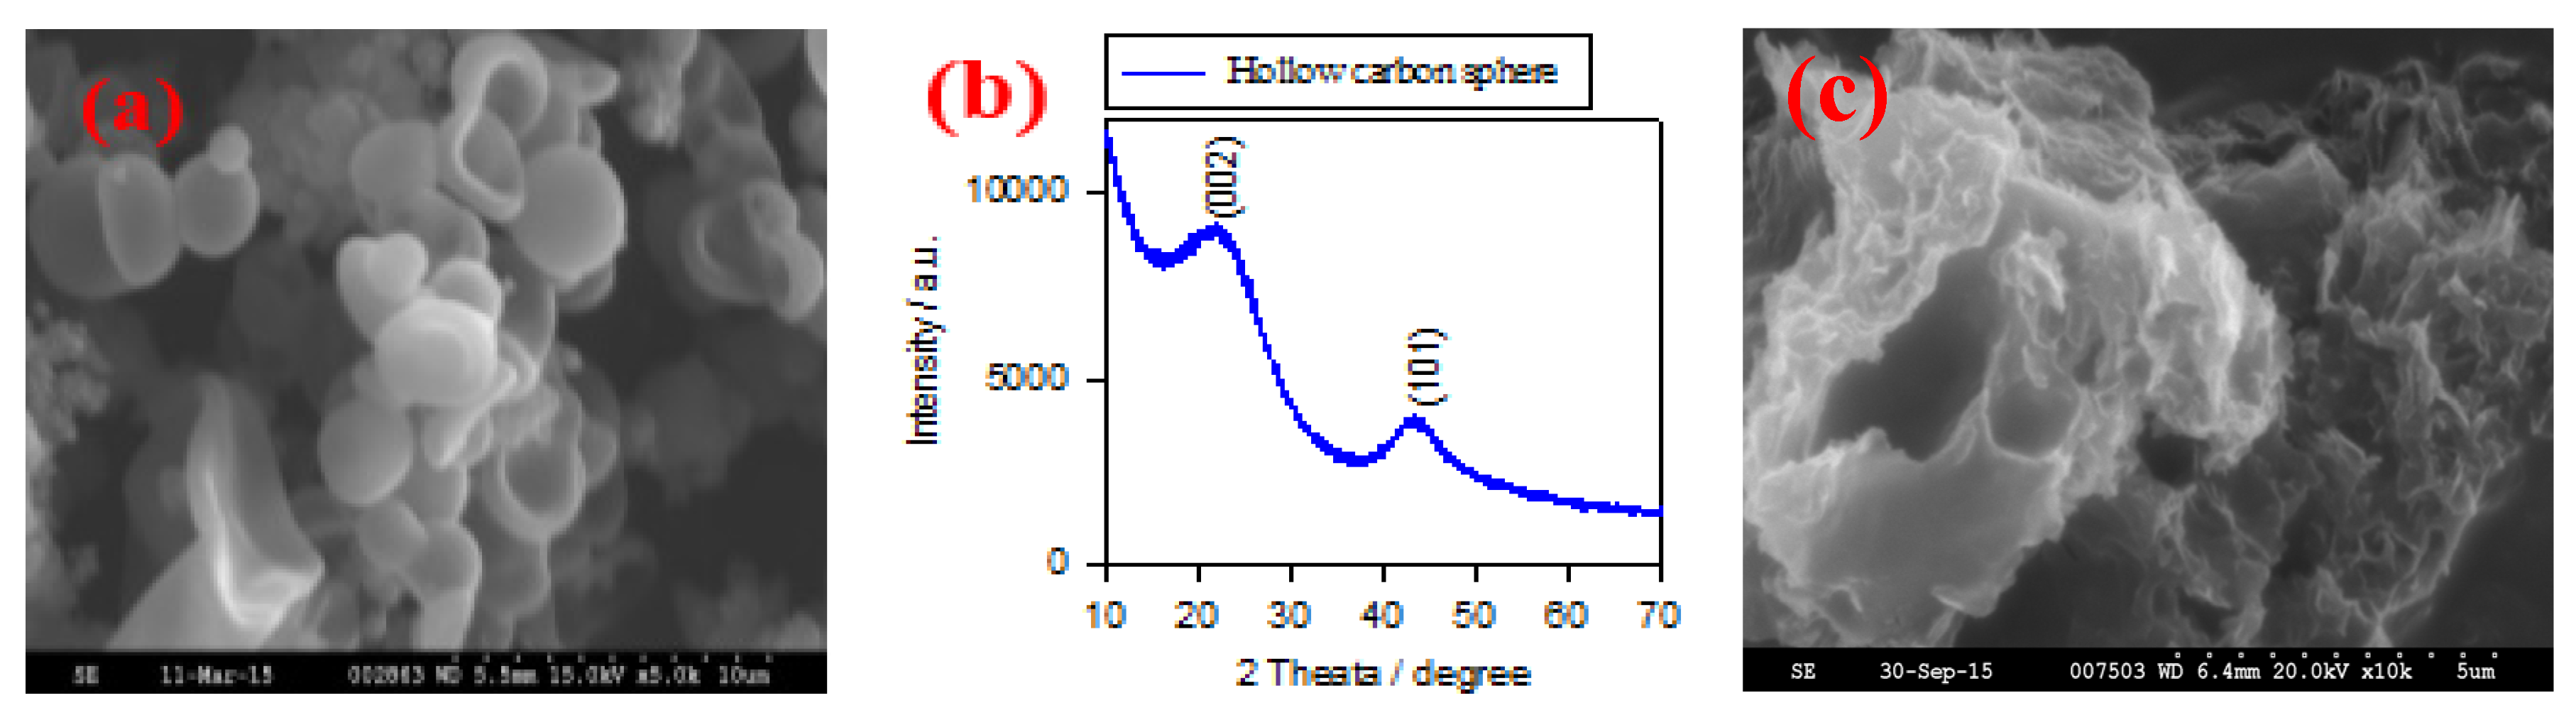
Figure 1a shows the typical SEM image of HCS via a hydrothermal carbonation of glucose. The size of HCS is around 1–2 μm; they have hollow and semi-hollow structure.
Figure 1b shows the XRD pattern of the HCS sample. Two broad peaks are located at 24° and 43° that correspond to the (002) and (101) planes, indicating the graphitic state of HCS sample.
Figure 1c shows the SEM image of NP-GNS sample. They show a highly curved morphology with a nanoporous structure.
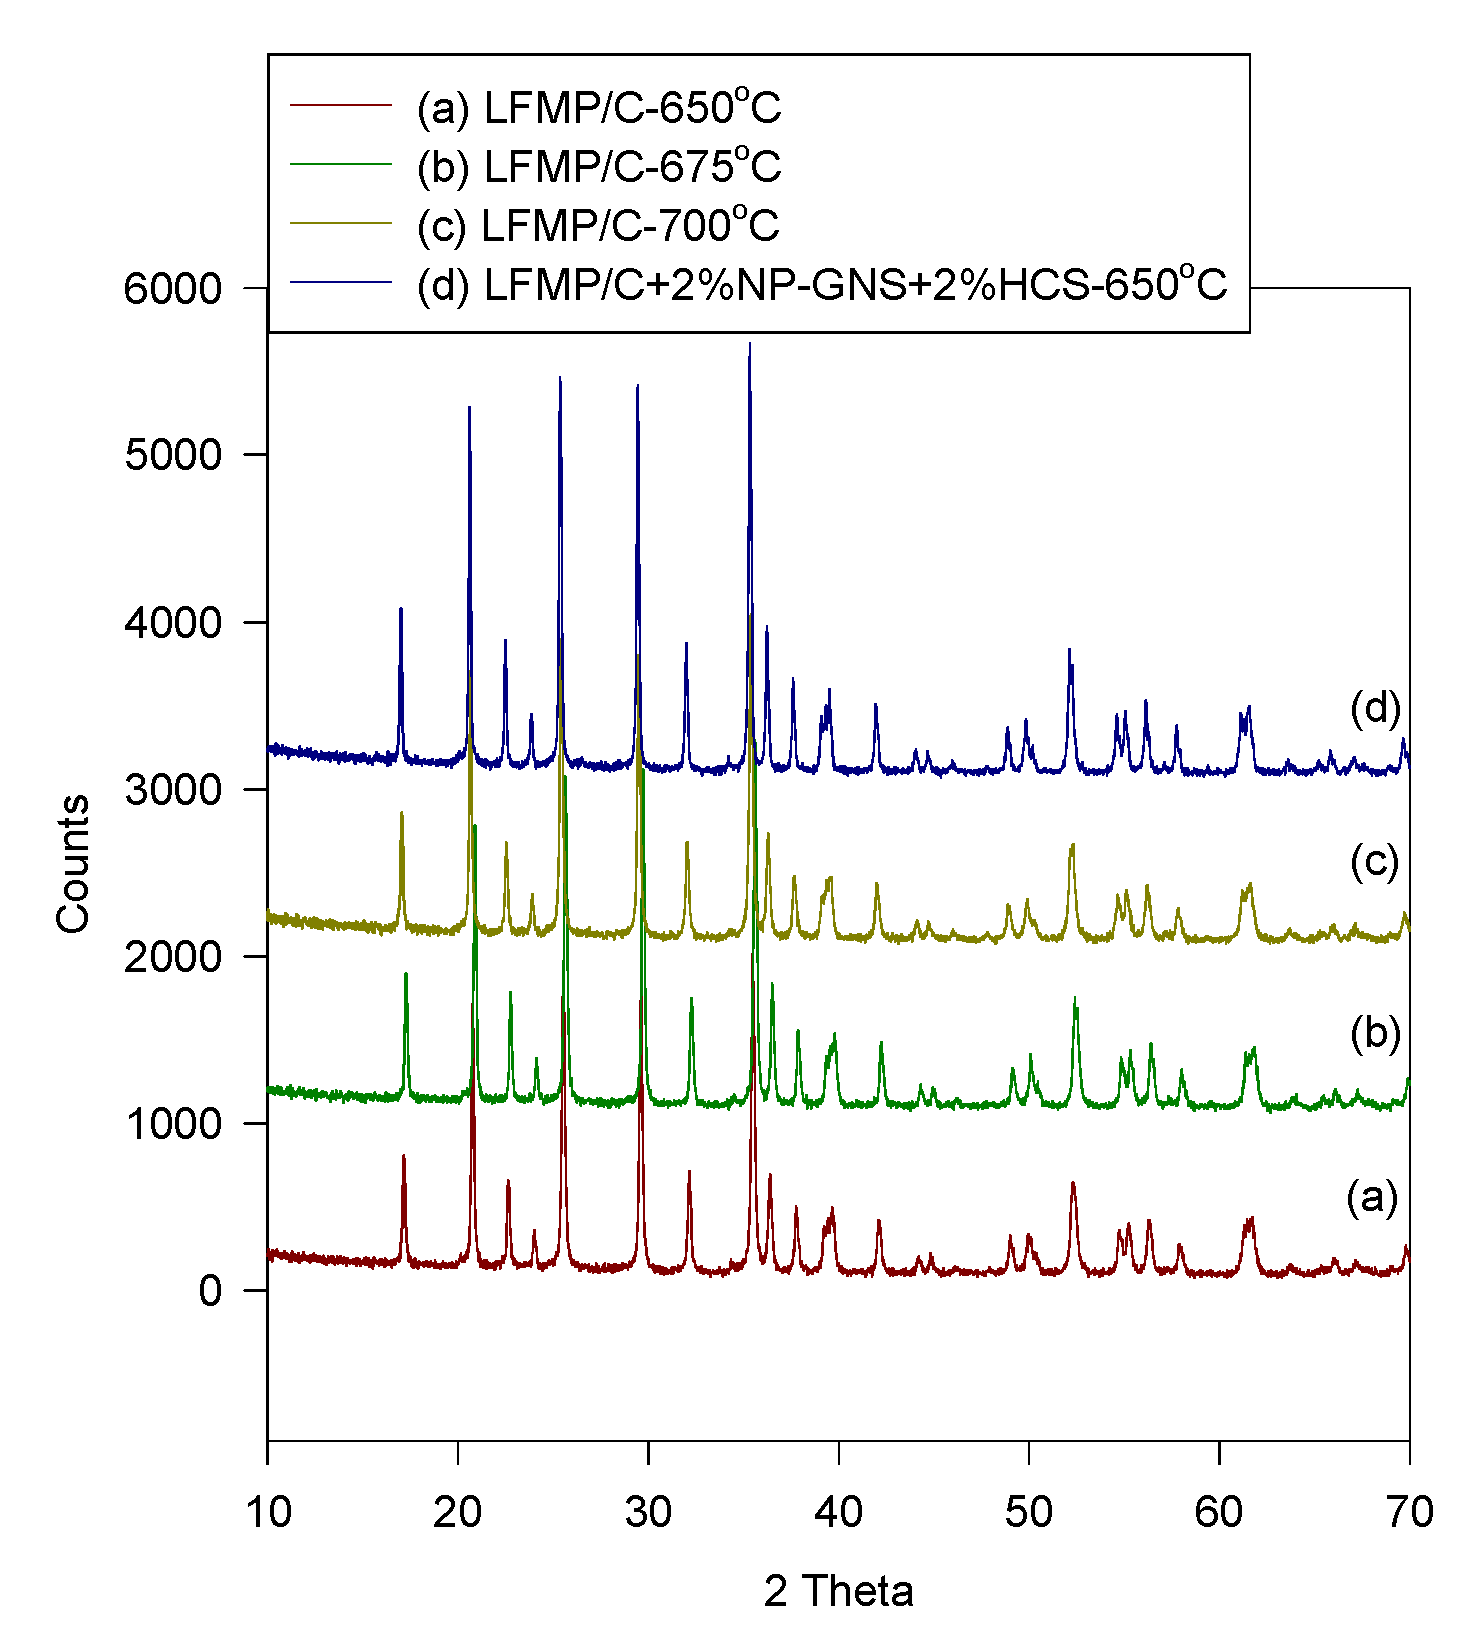
Figure 2 shows the XRD patterns of the LFMP/C and LFMP/C + 2% NP-GNS + 2% HCS samples prepared using the wet ball-milling method at 650–700 °C. All of the Bragg diffraction peaks of the compounds were well-indexed based on a single-phase olivine-type structure indexed with the orthorhombic
Pnma space group. No impurity peaks, such as Li
3PO
4 and Mn
2P
2O
7 phases, were found. By comparison, the lattice parameters of the LFP/C, LFMP/C, and SP-LFMP/C composite samples are listed in
Table 1. The carbon peaks cannot be observed because of the small amount of the residual carbon content (C%
ca. 5%–9%) with amorphous configuration. Fe
2+ and Mn
2+ ions were located at the tetrahedral 4c sites in LiFe
1−yMn
yPO
4 (
y = 0.5). The Mn
2+ ion (with an ionic radius of 0.97 Å) has a larger ionic size than the Fe
2+ ion (with an ionic radius of 0.92 Å). It was found that the LFMP/C composite materials increased as the Mn
2+-doping concentration increased. In addition, the unit cell volume of the LFMP/C composite materials increased linearly with the Mn
2+-substitution. As shown in
Figure 1, the peaks of the LFMP/C sample (
i.e., 301, 121, and 410) shifted to the lower angle direction compared with those of the LFP/C sample [
20]. The primary crystal sizes of the LFMP/C and the LFMP/C + 2% NP-GNS + 2% HCS composite materials estimated using Scherrer’s equation were
ca. 50–65 nm. The content of residual carbon is studied by elemental analysis (EA) in the composites lists in
Table 2. The residual carbon content of the LFMP/C materials with 5 wt% sucrose, 20 wt% citric acid, and 5 wt% BP2000 at different sintering temperatures are around 7.4%–4.8%; in contrast, the residual carbon of the LFMP/C + 2% NP-GNS + 2% HCS composite materials with adding extra 2% NP-GNS + 2 wt% HCS carbon conductor is around 9.31%. Clearly, the residual carbon content decreases when the sintering temperature was increased. It was also found that the electrical conductivity of the LFMP/C + 2% NP-GNS + 2% HCS composite materials can be improved to
ca. 10
−3 S·cm
−1.
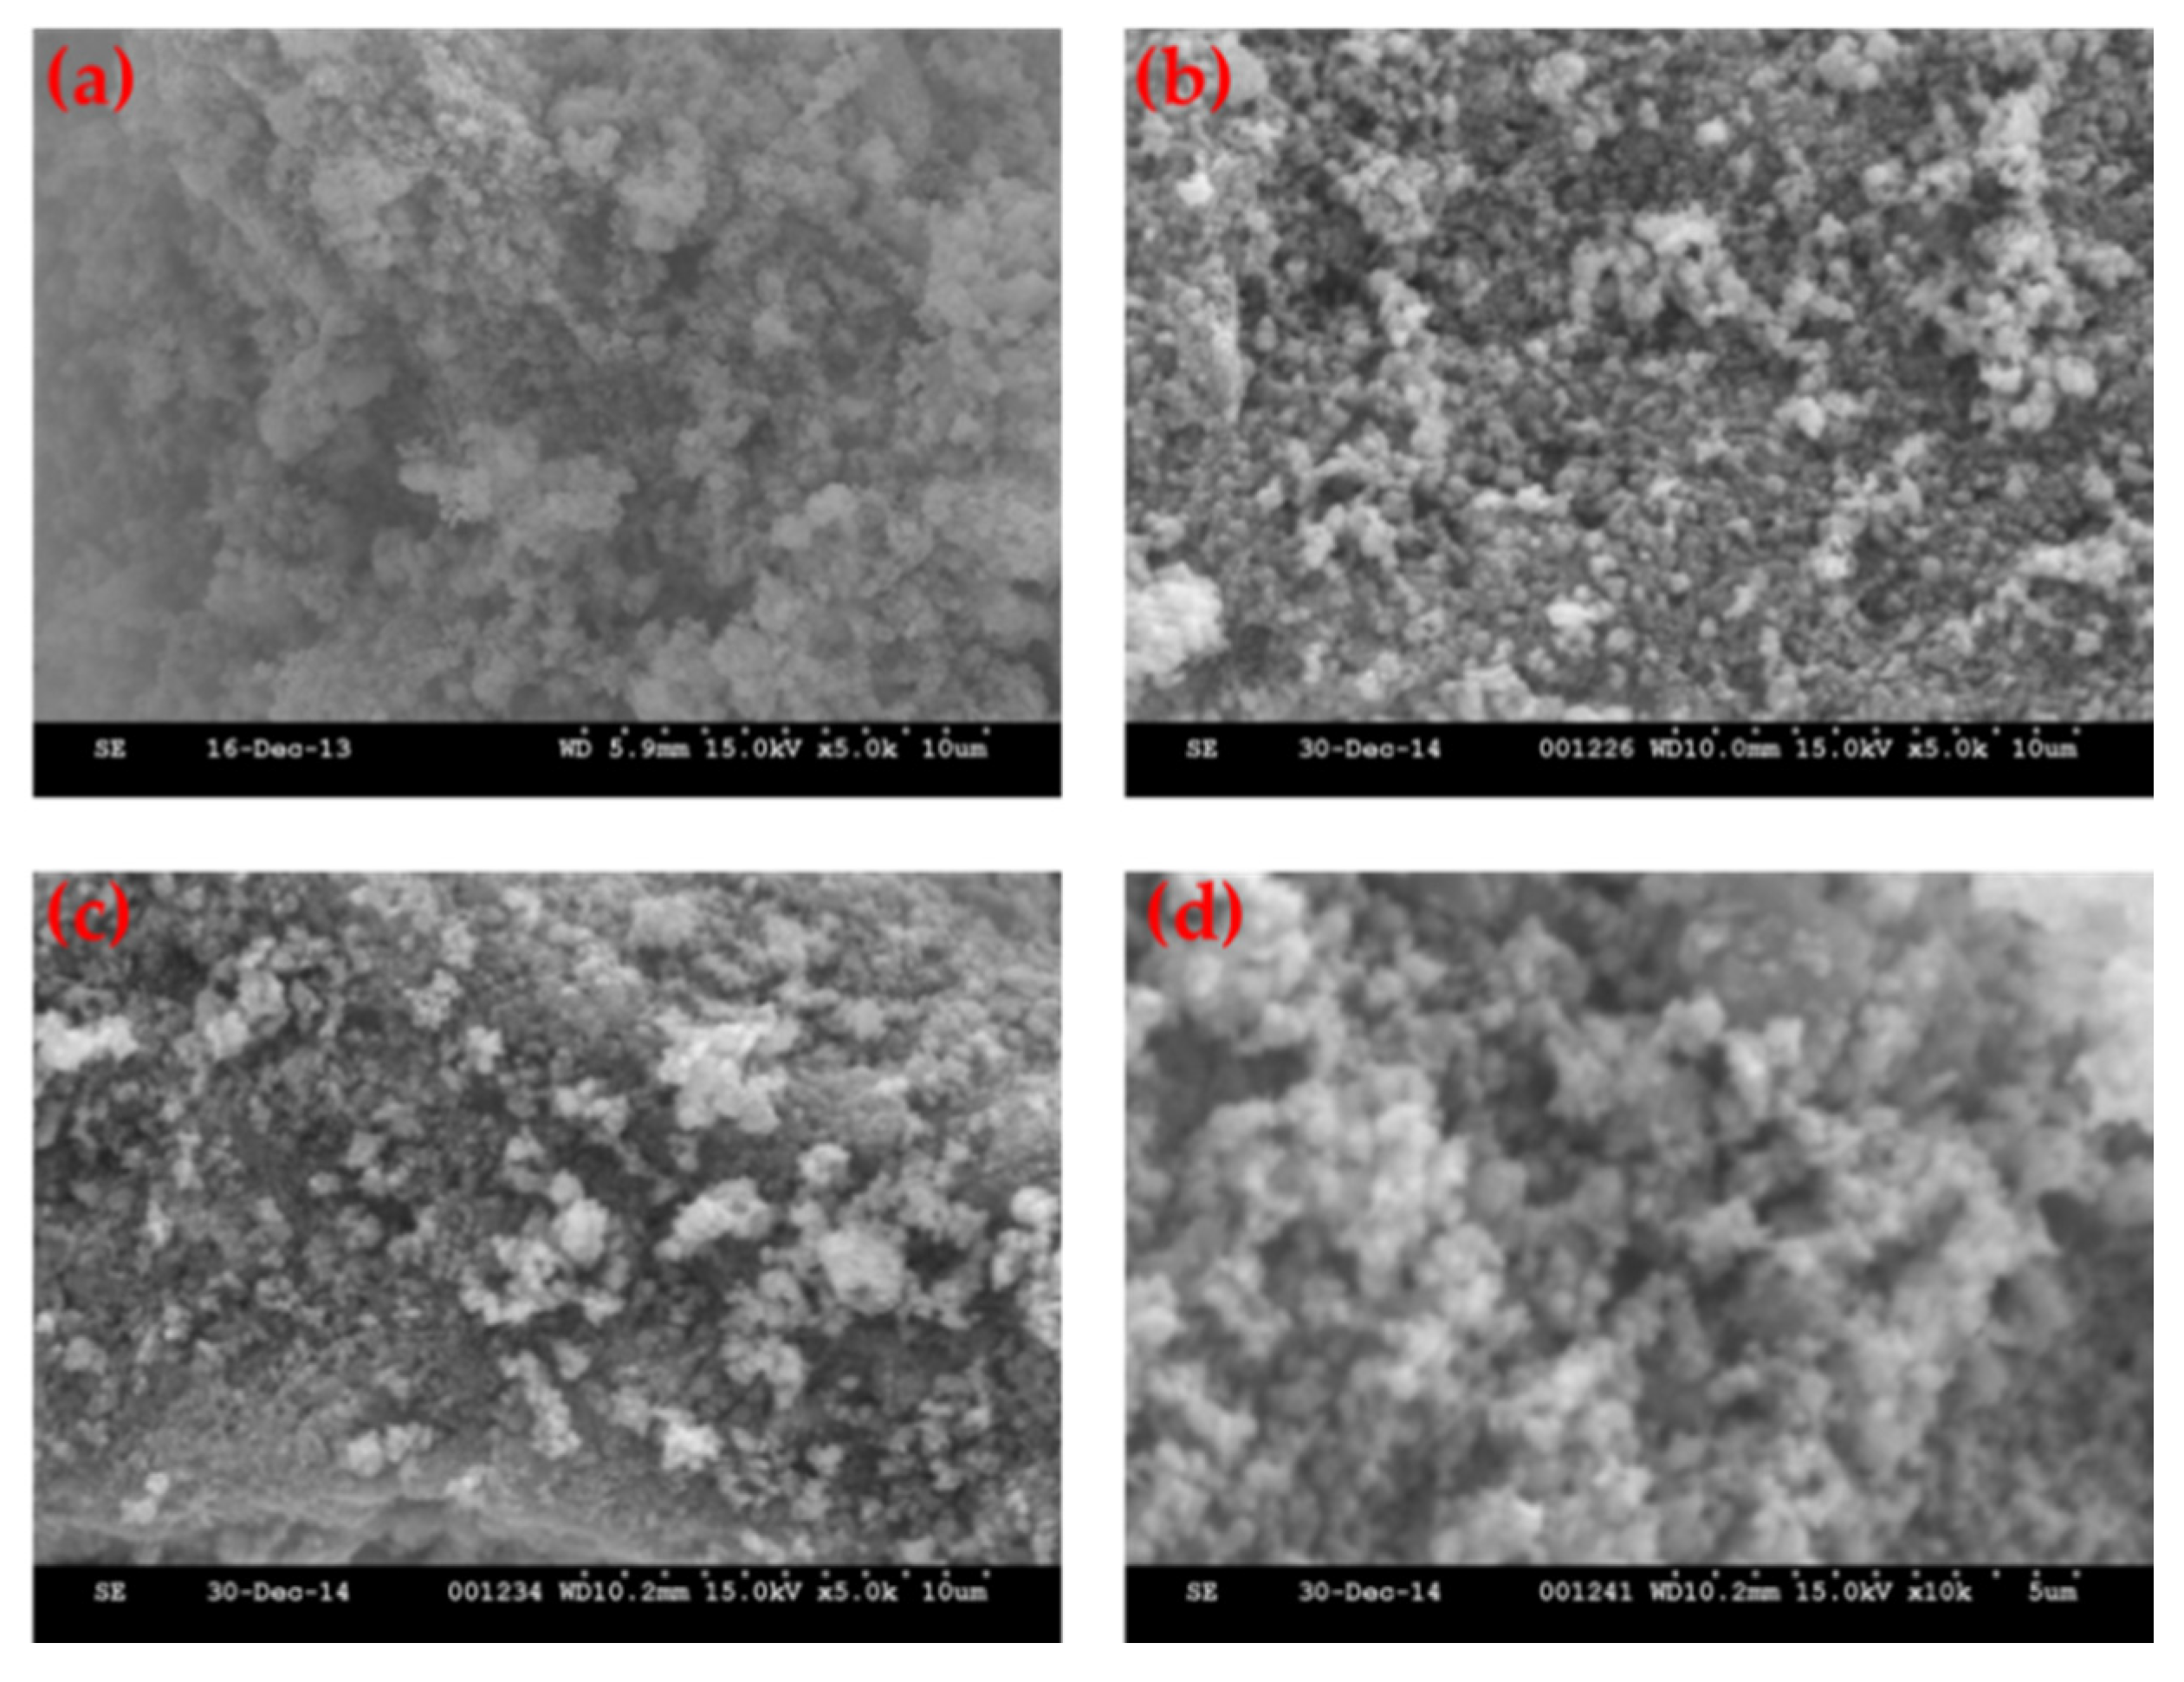
Figure 3 shows the SEM images of the LFMP/C-650, LFMP/C-670, LFMP/C-700, and LFMP/C + 2% NP-GNS + 2% HCS-650 composites prepared via the wet ball-milled method. The secondary particle sizes of the LFMP/C composite ranged from 2 μm to 10 μm with a spherical morphology. The surface is highly porous with a macro/nano three-dimensional (3D) hierarchical structure.
Figure 3d also shows the SEM images of the LFMP/C + 2% NP-GNS + 2% HCS-650 composites. The LFMP/C + 2% NP-GNS + 2% HCS-650 composite with two conductive carbons added shows a good conductive network because of the uniform coverage of the carbon on the surface of LFMP/C material. In other words, the double carbons greatly improved the coating uniformity on the LFMP/C composite material (see later for transmission electron microscopy (TEM) and micro-Raman results). More importantly, the LFMP/C composite showed slightly smaller particles size around 50 nm; it is due to the high content of carbon being added (C% = 9%). It is well accepted that the carbon precursors can inhibit the LFMP crystalline growth [
24]. Therefore, it was well accepted that the smaller particle size of LFPM/C will have much shorter Li
+ ion diffusion length. It will greatly improve the electrochemical performance, in particular at high rate.
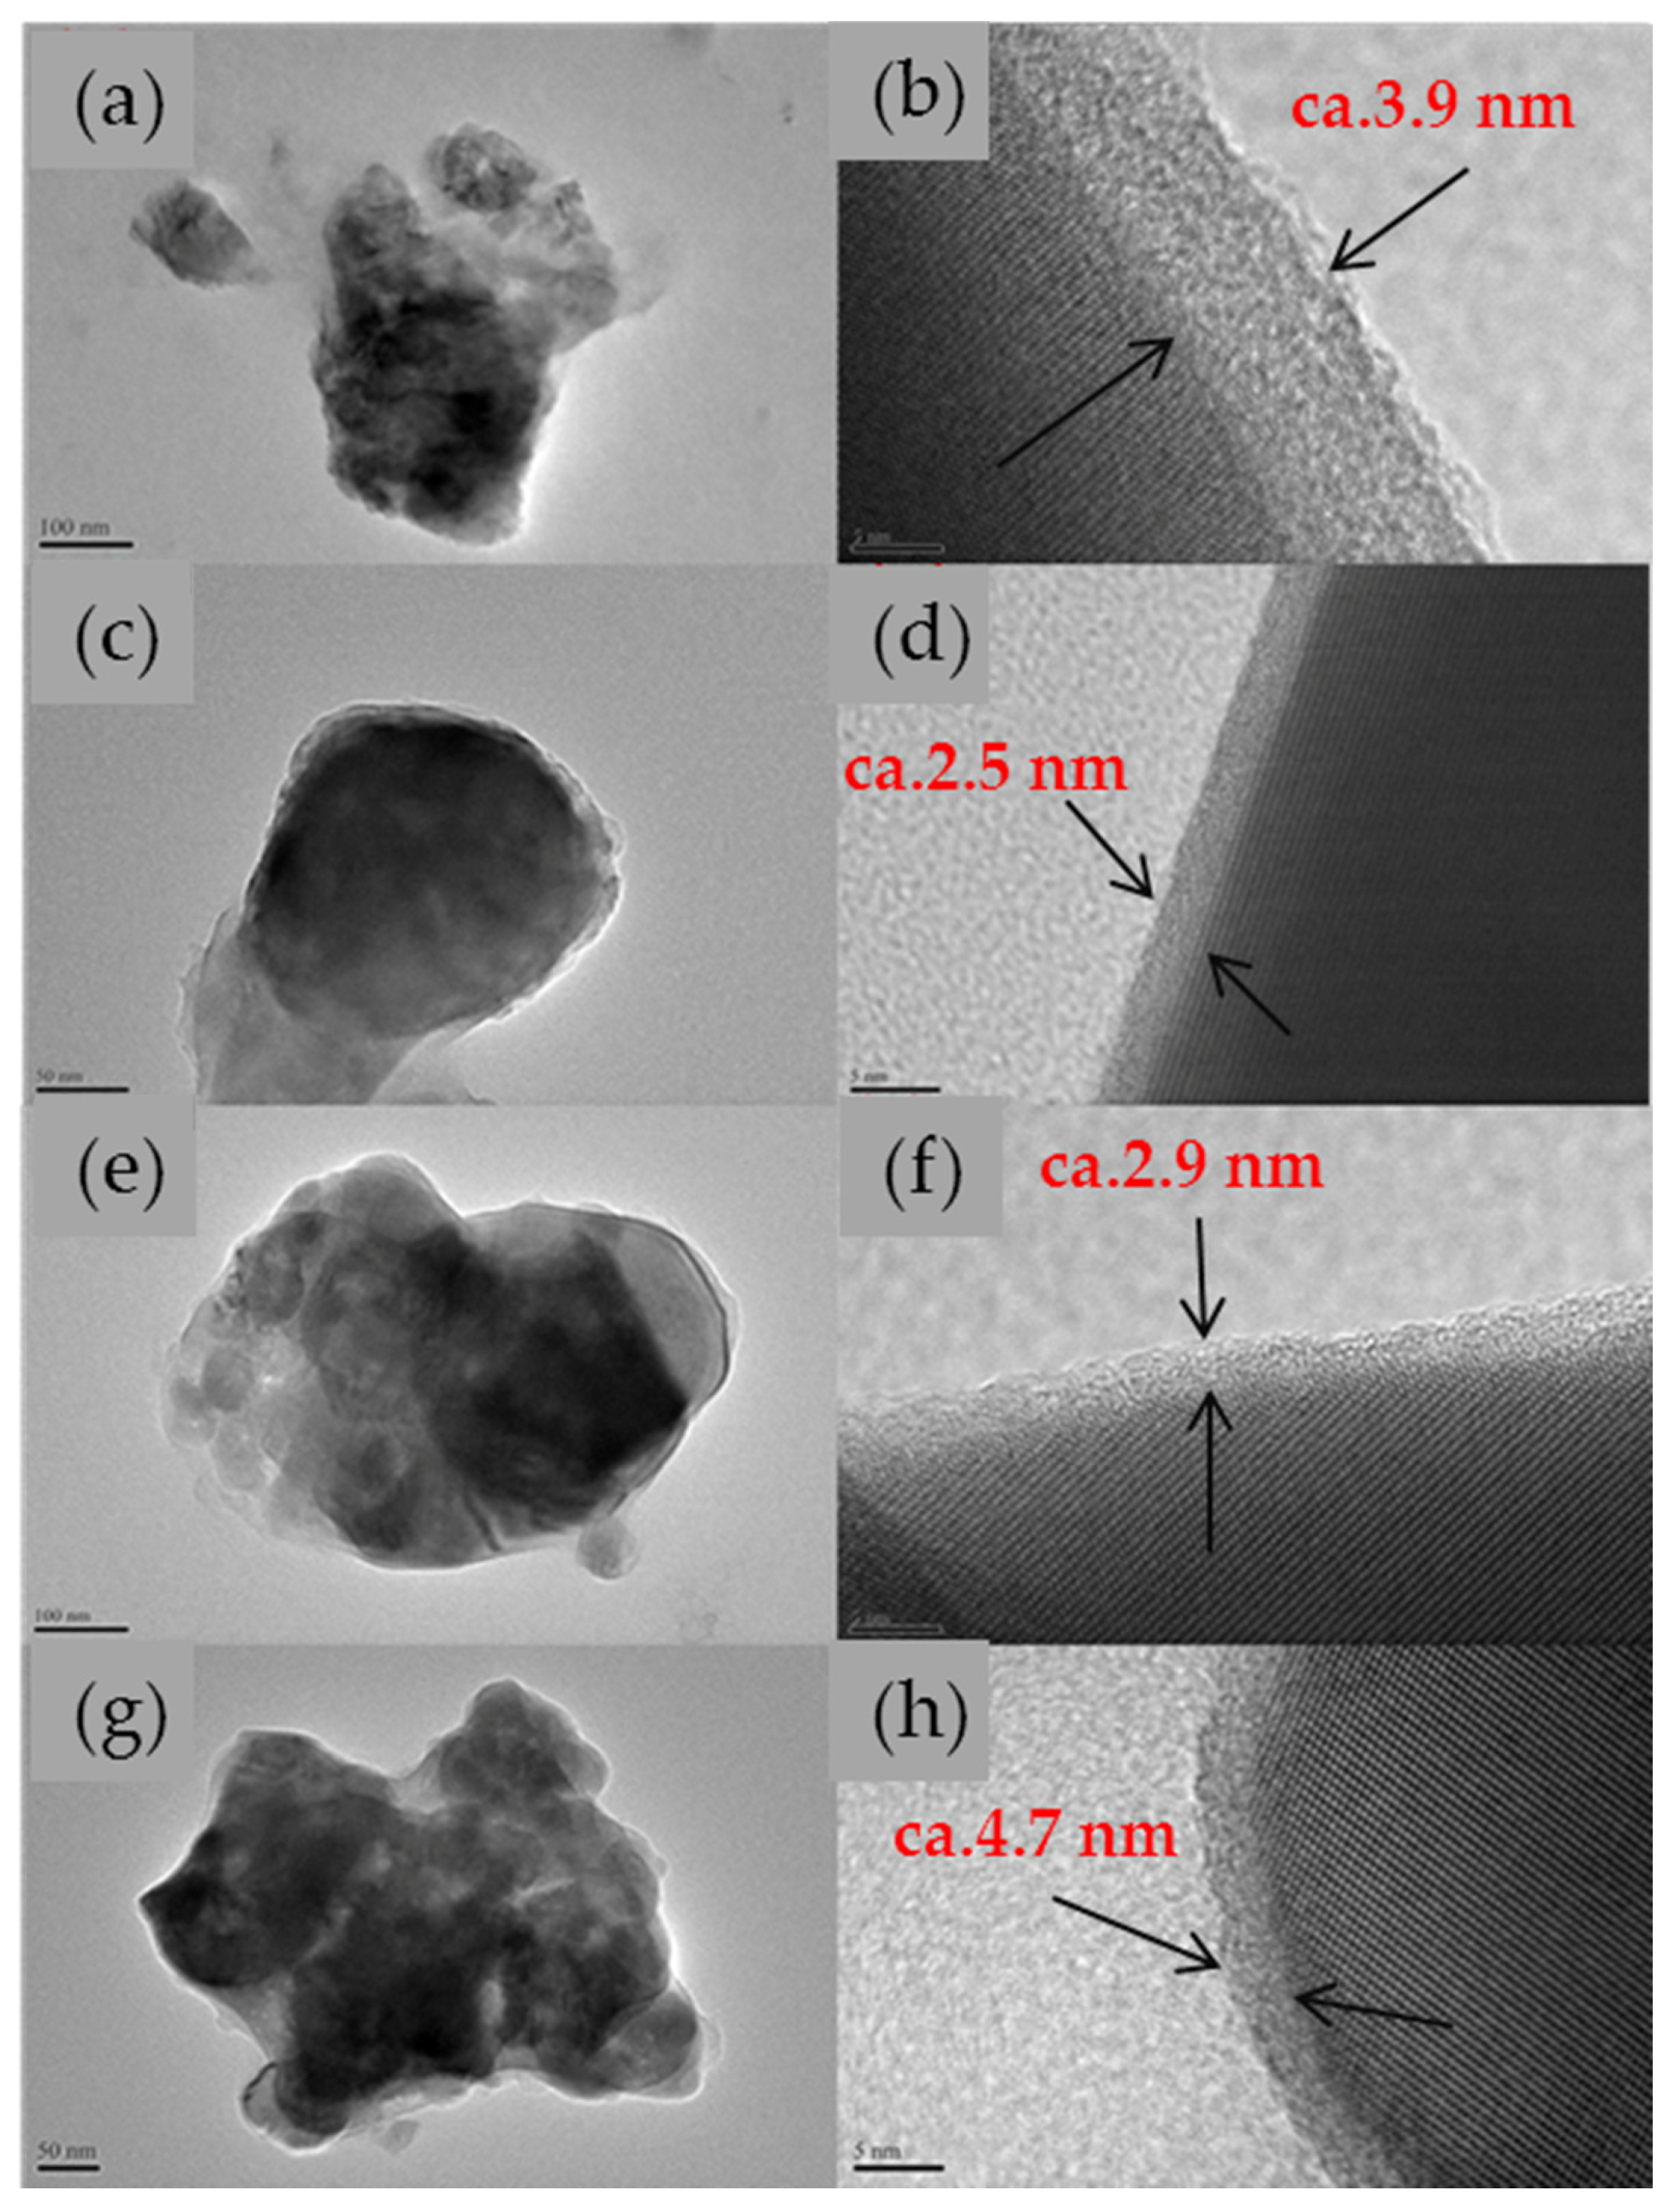
Figure 4 shows the HR-TEM images of the LFMP/C and LFMP/C + 2% NP-GNS + 2% HCS samples sintered at 650–700 °C. It was found that a uniform carbon coating on LFMP/C samples sintered at temperatures of 650, 675, and 700 °C with the thickness of approximately 10, 3, and 2 nm, respectively, was observed. In contrast,
Figure 4h presents the TEM image for the LFMP/C + 2% NP-GNS + 2% HCS composite sintered at 650 °C. It was shown the much thick carbon layer is around 4.7 nm.
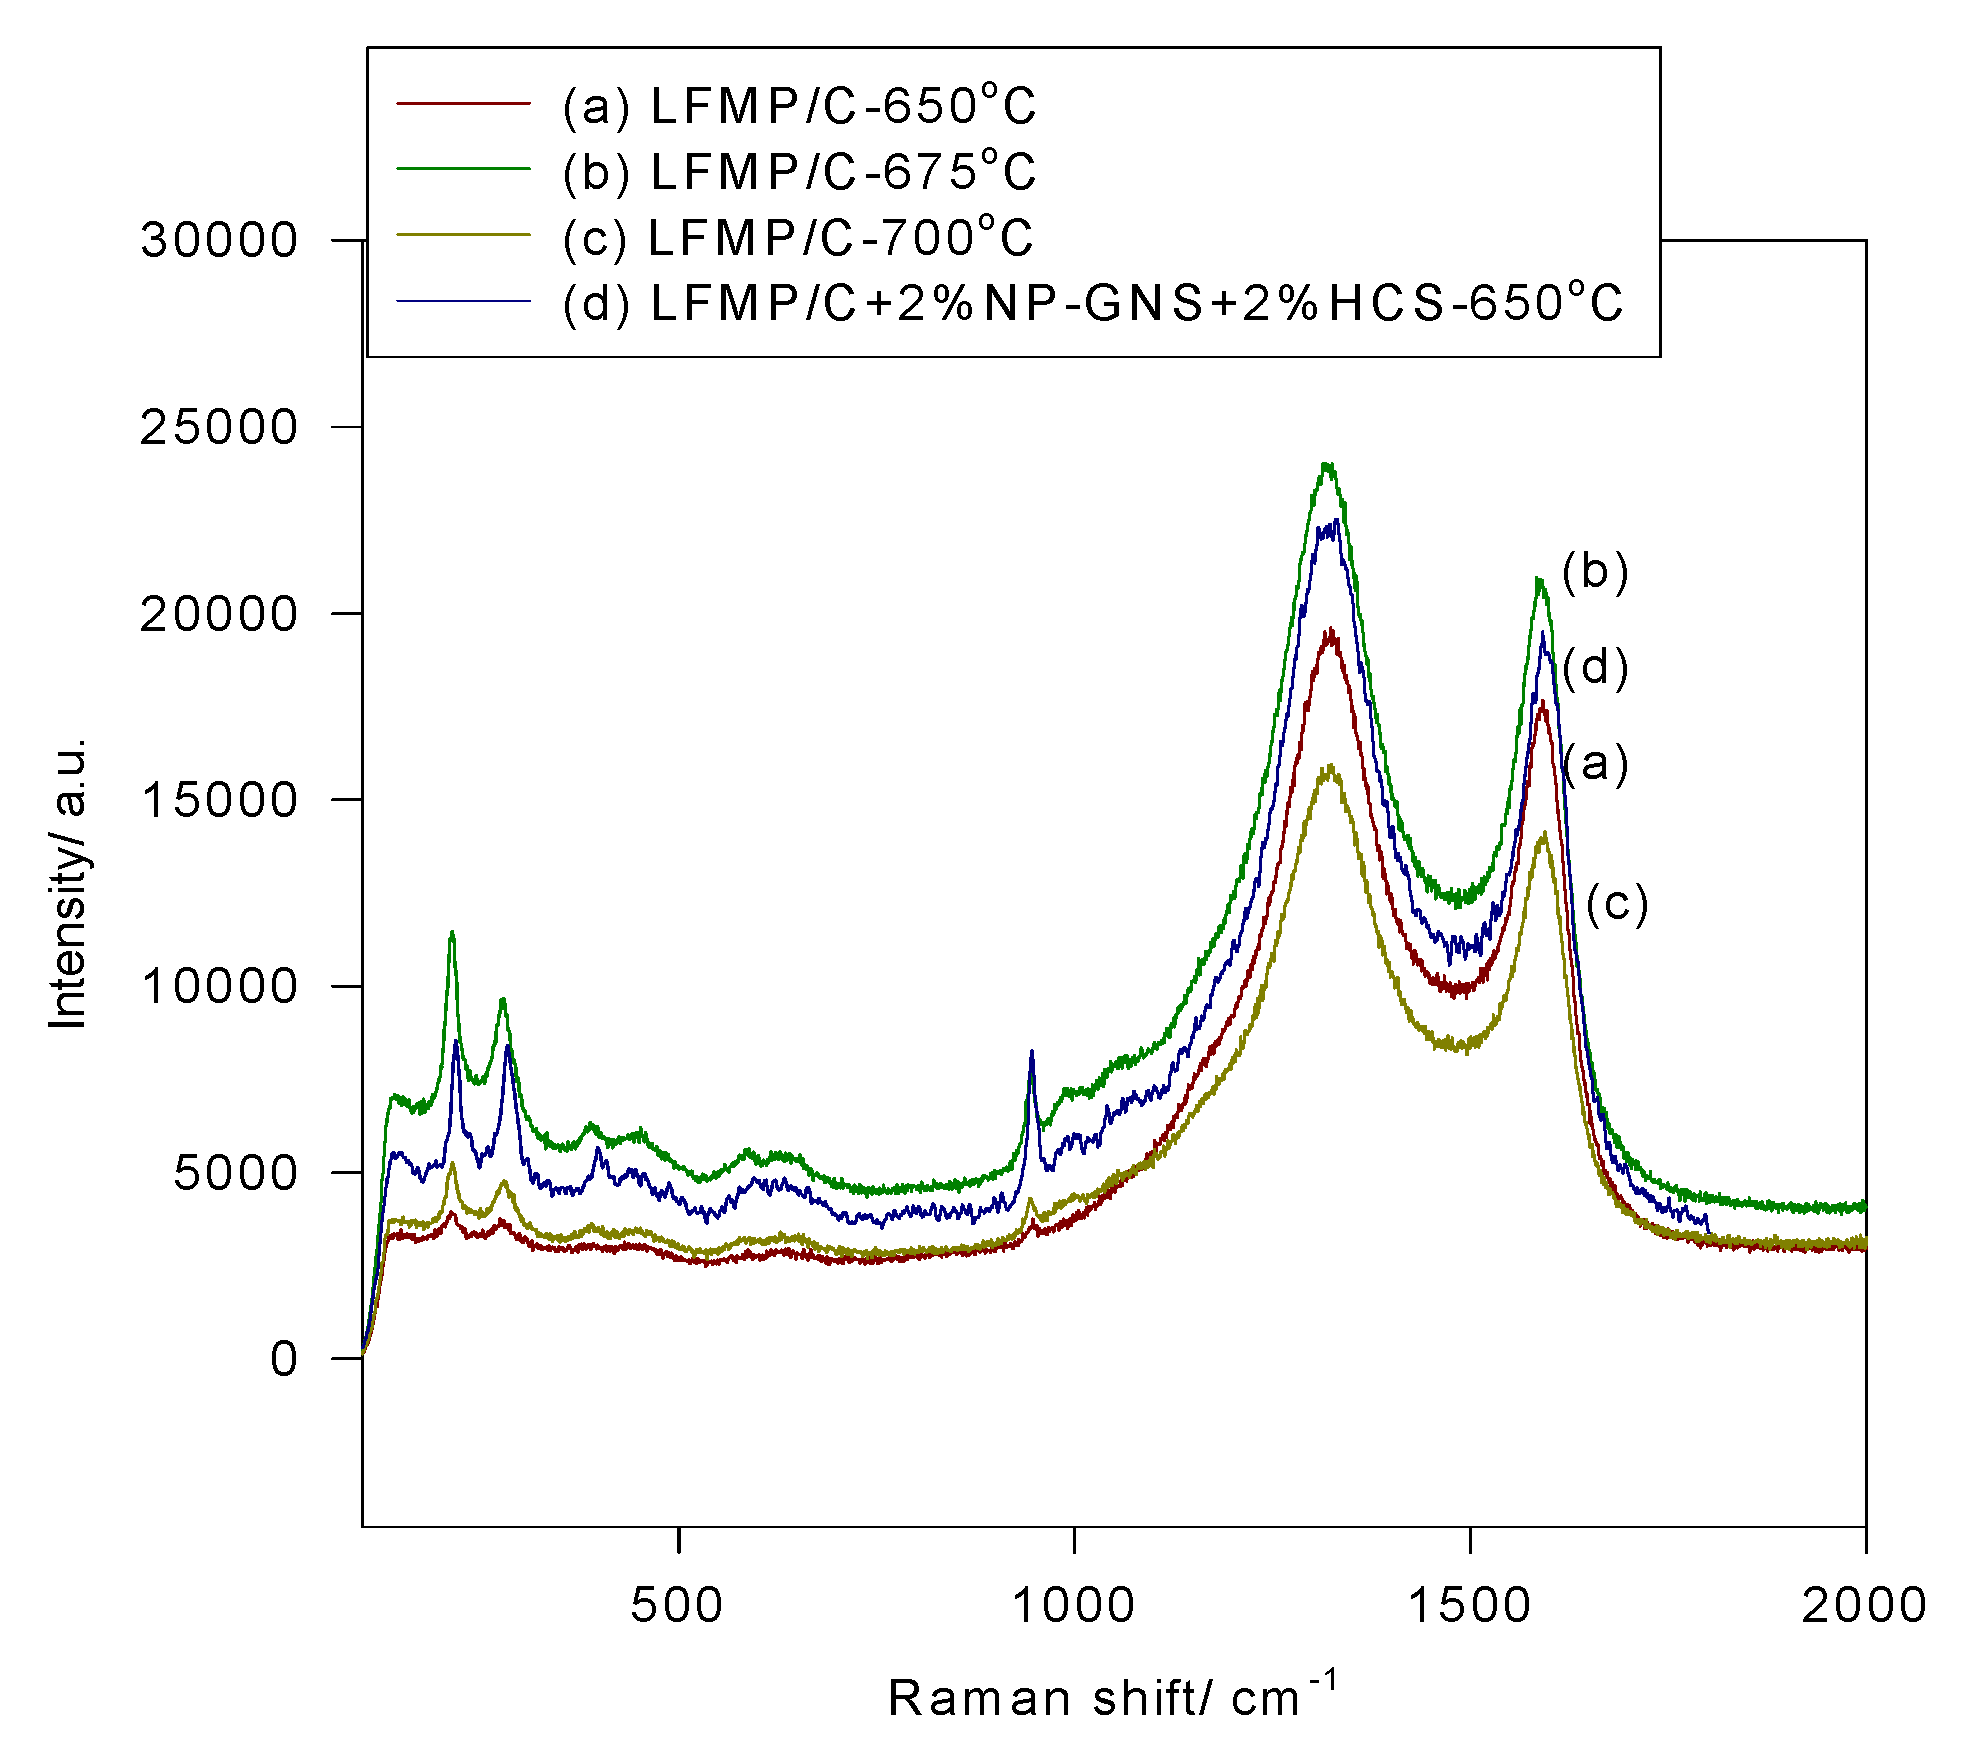
Figure 5 shows the micro-Raman spectra of the LFMP/C samples and the LFMP/C + 2% NP-GNS + 2% HCS composite, indicating three major Raman vibration peaks at 951 cm
−1, 1328 cm
−1, and 1585 cm
−1. Several Raman peaks at approximately between 947–950 cm
−1 and 596–446 cm
−1 were identified as the vibration of the P–O bond, and the peak located at 638 cm
−1 was identified as the vibration of the FeO
x groups. Two Raman peaks of the LFMP/C samples and the LFMP/C + 2% NP-GNS + 2% HCS composite were located at approximately 1328 cm
−1 and 1585 cm
−1; these peaks were attributed to the residual carbon source. Raman peaks at 1326 cm
−1 (D-band) and 1588 cm
−1 (G-band) was observed in the LFMP/C + 2% NP-GNS + 2% HCS composite. Broadening the D (
A1g symmetry) and G (
E2g symmetry) bands with a strong D-band indicated a localized in-plane sp
2 graphitic crystal domain and a disordered sp
3 amorphous carbon, respectively. The intensity ratio of the D-band to the G-band (
i.e.,
R =
ID/
IG) was used to estimate the carbon quality of the LFMP/C samples. The
R-value of the LFMP/C samples at various sintered temperatures of 650–700 °C (
R = 1.11–1.12) was slightly lower than that of the LFMP/C + 2% NP-GNS + 2% HCS composite (
R = 1.15). The discharge capacities and rate capabilities of the LFMP/C samples are strongly related to the intensity ratio of the D- and G-bands [
22,
23,
24].
Table 3 shows the
R values of all LFMP/C samples by micro-Raman analysis in detail.
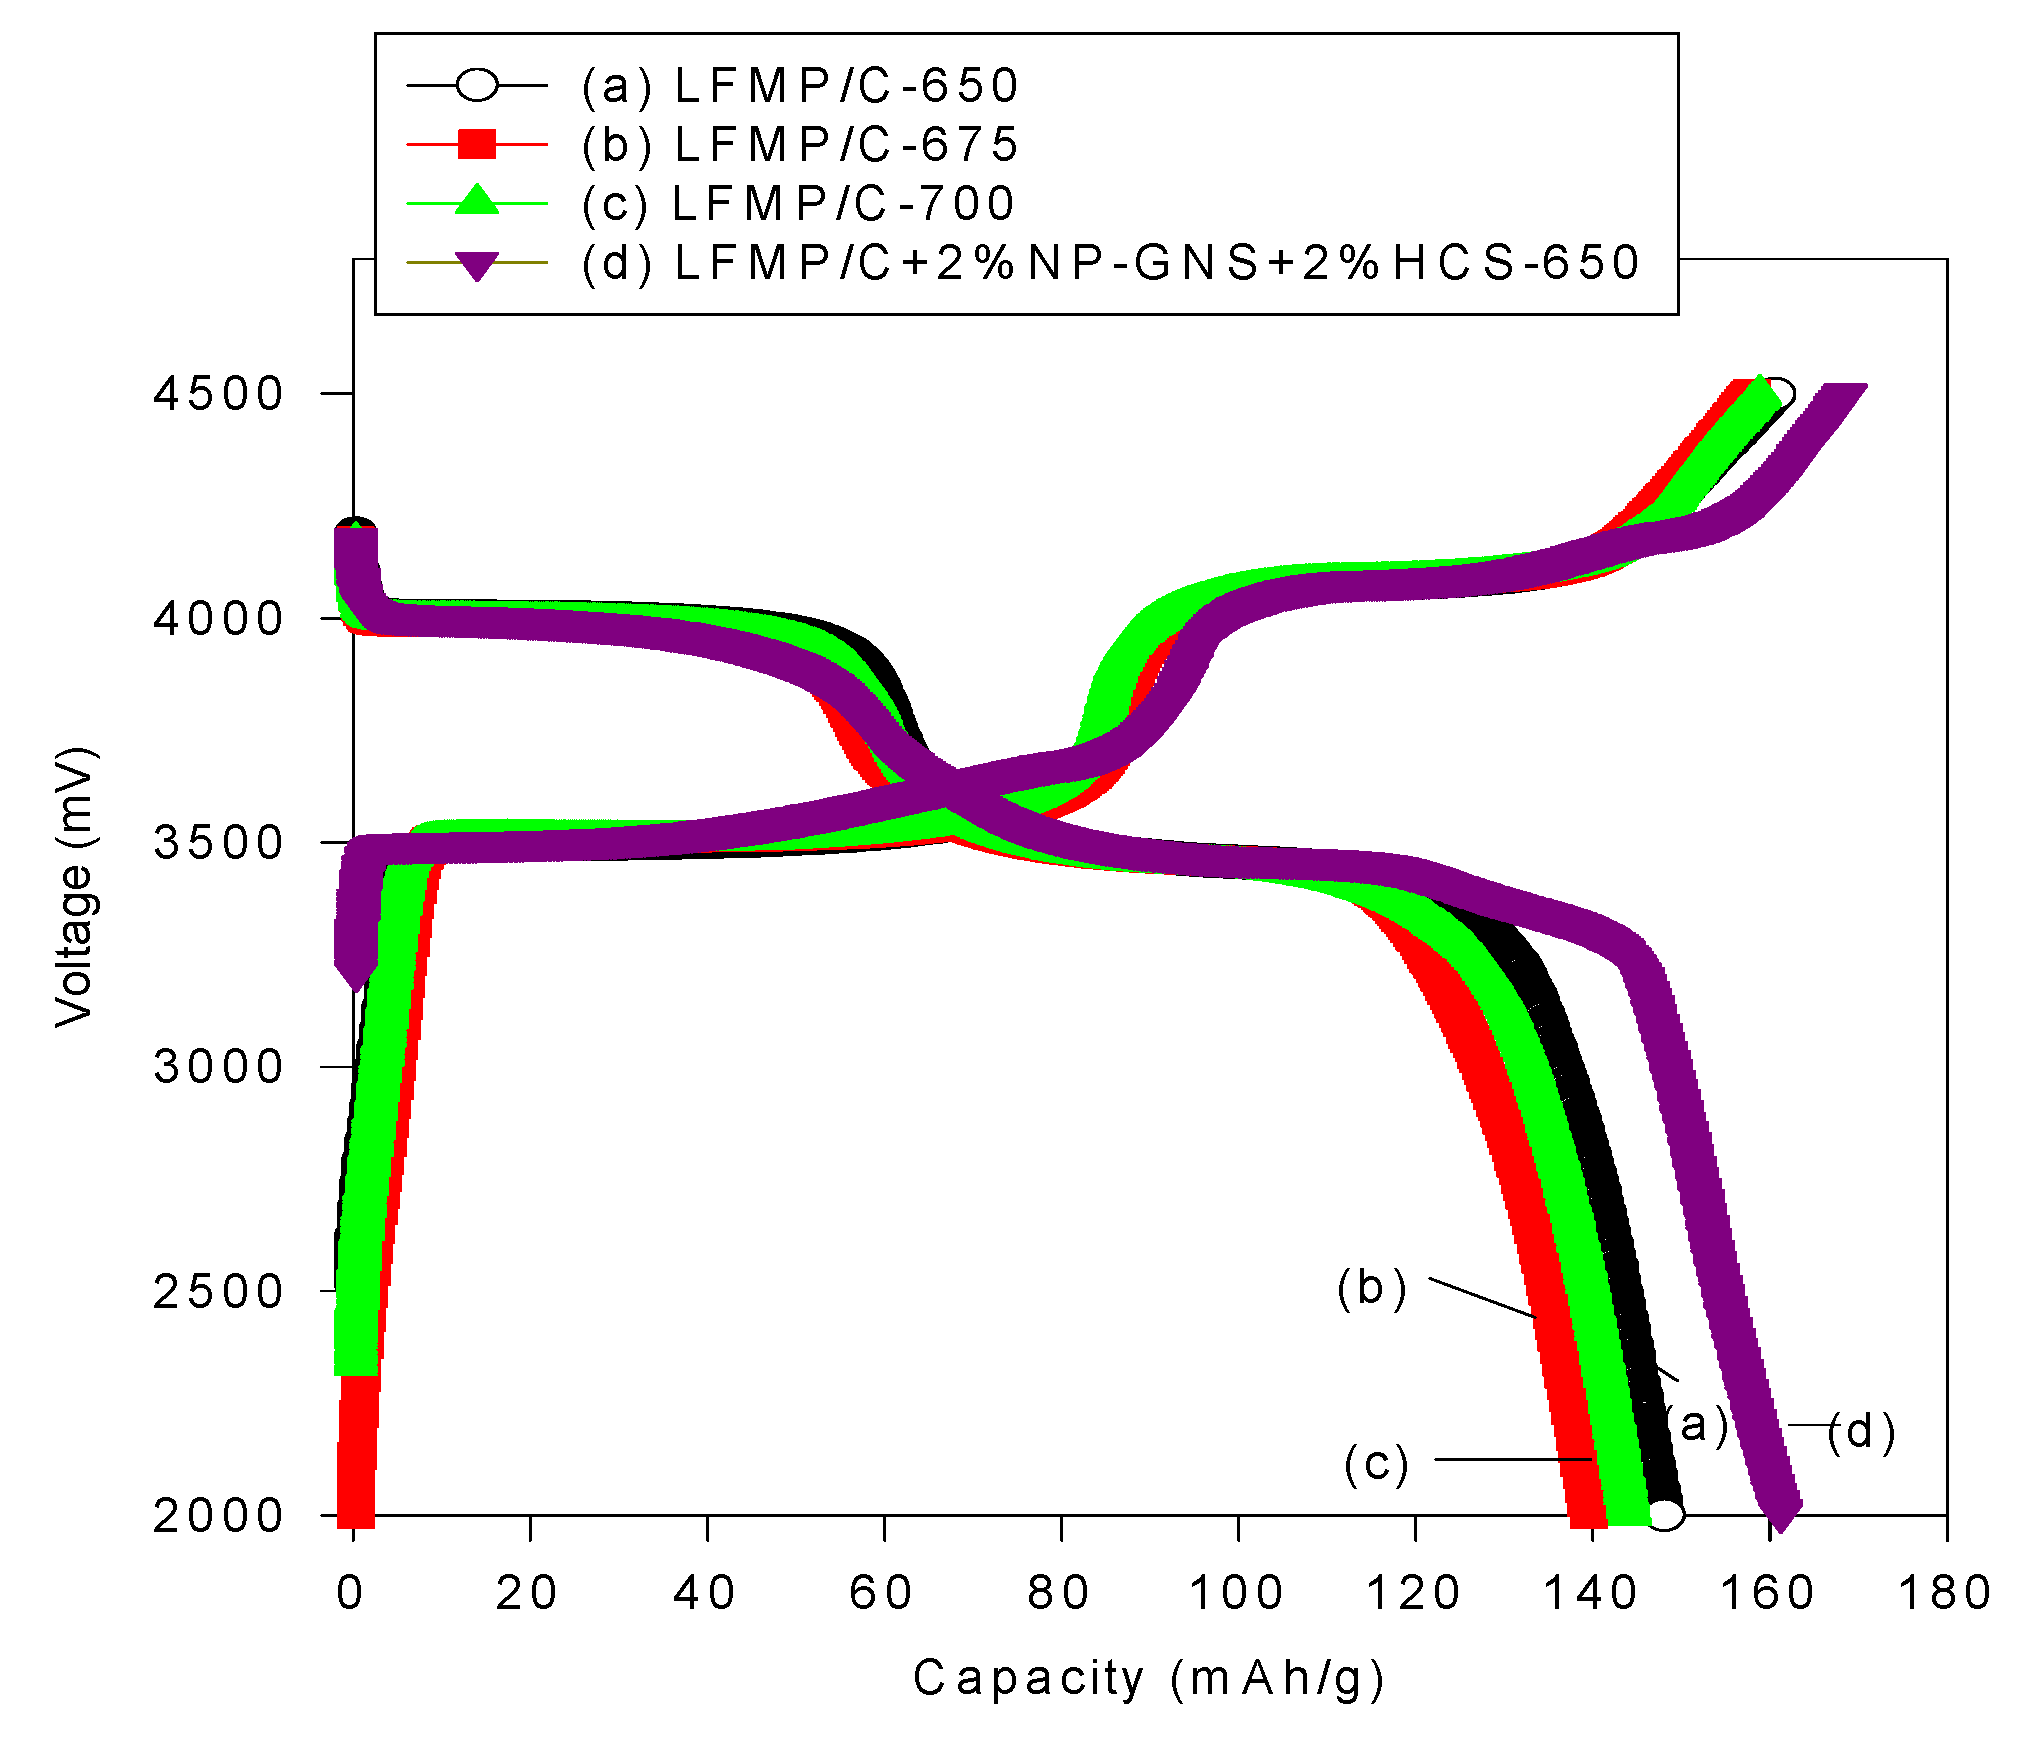
Figure 6 shows the initial charge/discharge profiles of three LFMP/C samples,
i.e., LFMP-650, LFMP/C-675, and LFMP/C-700, and the LFMP/C + 2% NP-GNS + 2% HCS composite at 0.1C rate and 25 °C, indicating that the LFMP/Li half-cell displayed two flat discharge plateaus at
ca. 4.00–4.03 V and
ca. 3.50–3.55 V (
versus Li/Li
+), respectively, associated with two Mn
3+/Mn
2+ and Fe
3+/Fe
2+ redox pairs. The LFMP/C, based on a wet ball-milled method, half-cells based on the as-synthesized materials yielded an initial discharge capacity of 148, 139, and 144 mAh·g
−1 at 0.1C, respectively. By contrast, as shown in
Figure 6, the LFMP/C + 2% NP-GNS + 2% HCS composite showed an initial discharge capacity of around 161.2 mAh·g
−1 at 0.1C, indicating that it is superior in performance to the LFMP/C composite with a suitable amount of carbon additives,
ca. 4 wt% here.
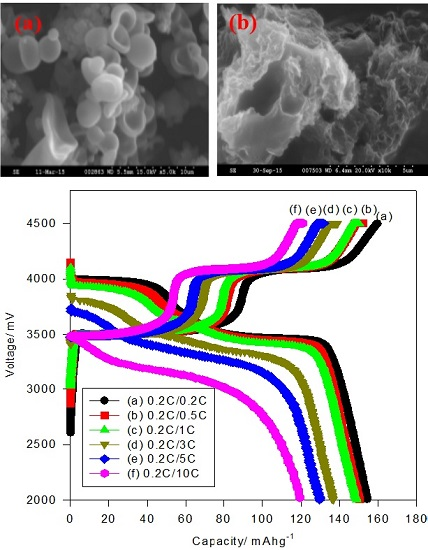
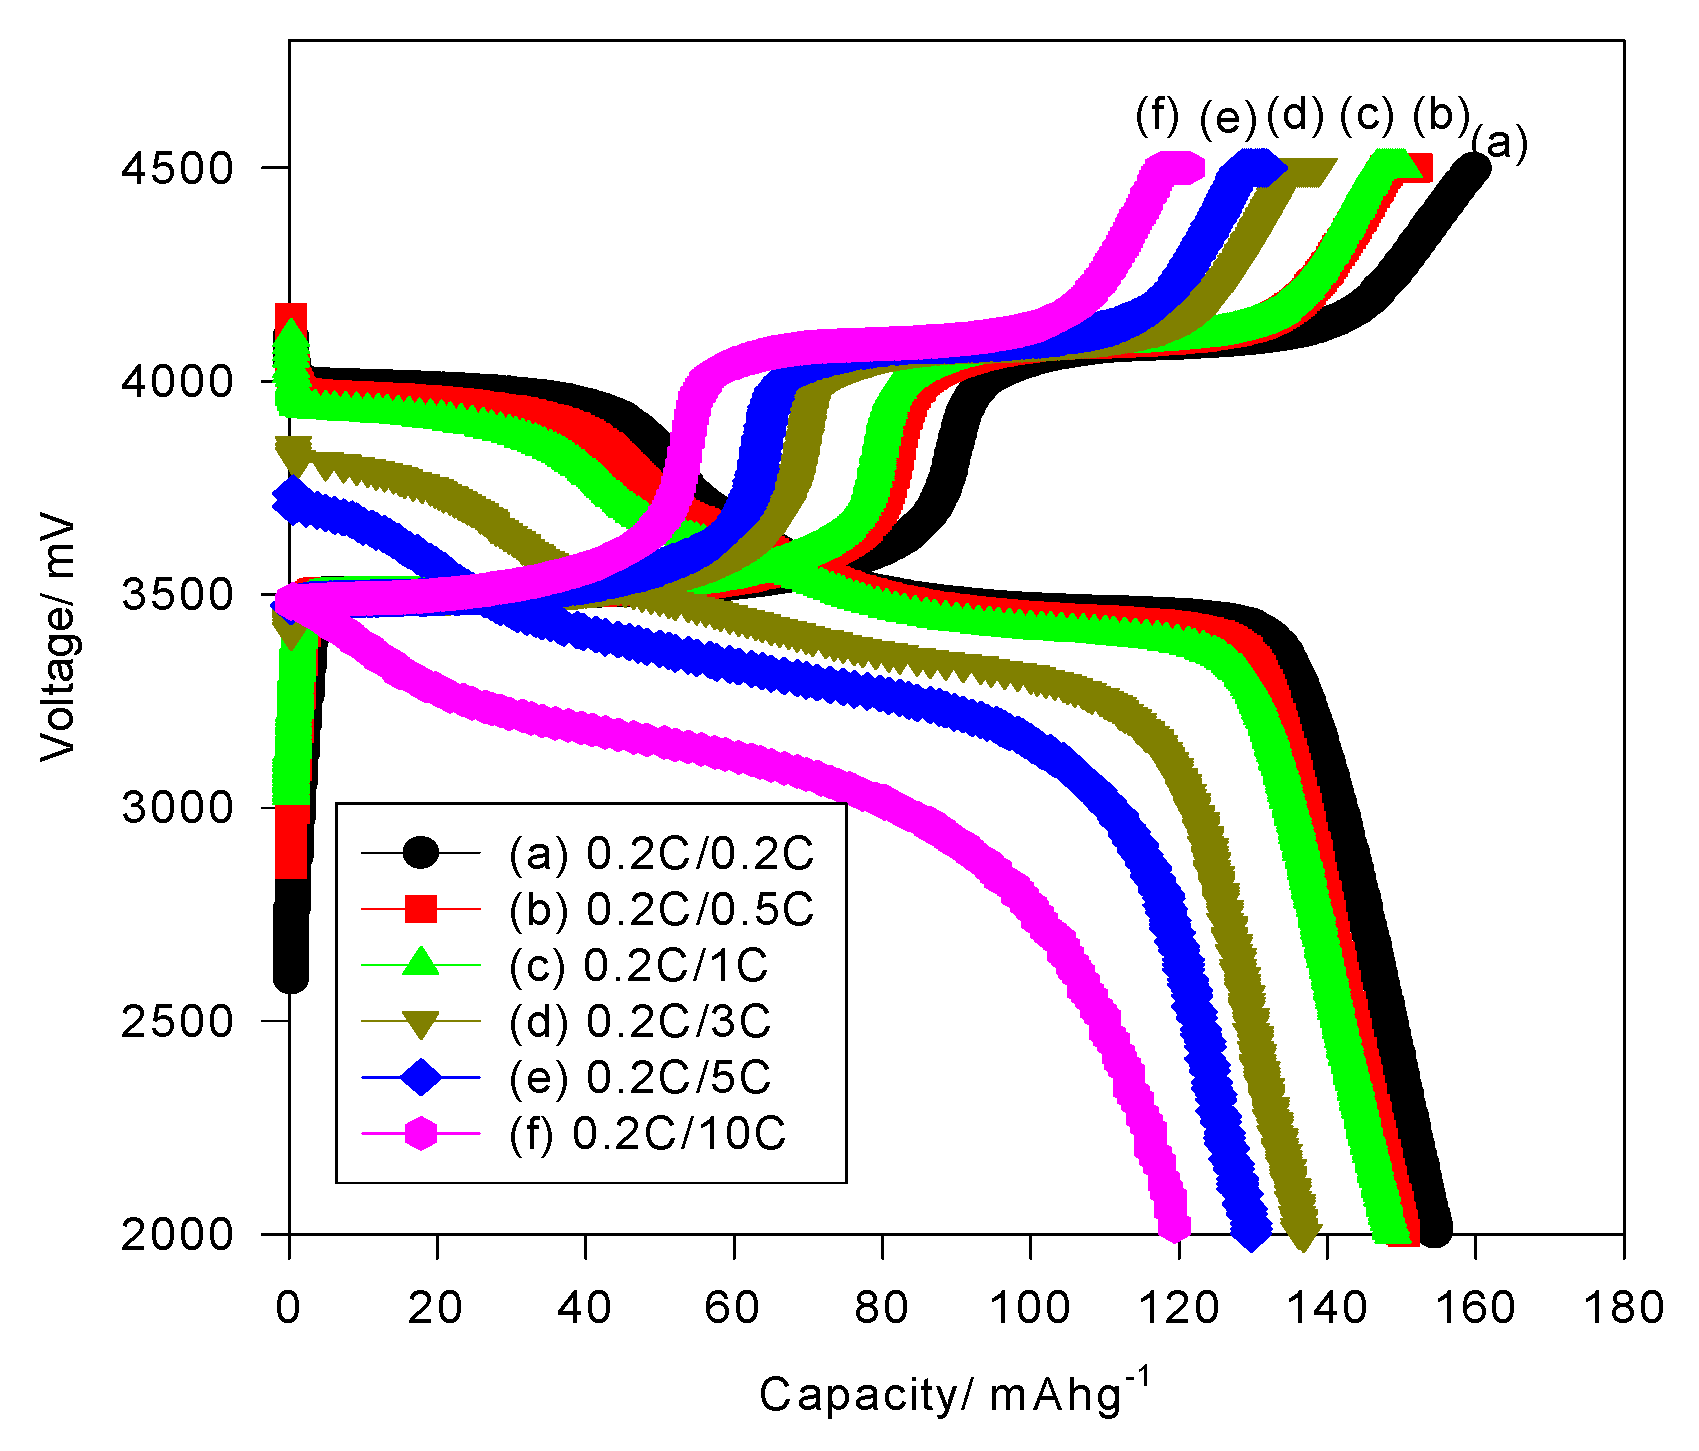
Figure 6 reveals the typical charge/discharge curves of the LFMP/C + 2% NP-GNS + 2% HCS composite at various discharge rates,
i.e., at 0.2–10C.
The LFMP/C + 2% NP-GNS + 2% HCS composite exhibited discharge capacities of 154.7, 150.3, 148.8, 136.7, 130.3, and 120.0 mAh·g
−1 at charge/discharge rates of 0.2C/0.2C, 0.2C/0.5C, 0.2C/1C, 0.2C/3C, 0.2C/5C, and 0.2C/10C, respectively. These results indicate that the LFMP/C + 2% NP-GNS + 2% HCS composite exhibited excellent high-rate capability and reliable cycle-life stability. In a previous study [
17], the discharge capacities of a LiFe
0.6Mn
0.4PO
4/C sample containing 2 wt% MWCNTs and prepared using a spray drying method—were
ca. 163.3 mAh·g
−1 and 148.7 mAh·g
−1 at 0.1C-rate and 1C-rate, respectively. These results are comparable with our results, which are
ca. 161 mAh·g
−1 and 149 mAh·g
−1 at 0.1C and 1C rate, respectively. However, in Zhong
et al. [
19], the discharge capacities of a LFMP/C material prepared by using a rheological phase method—were 138 mAh·g
−1 and 100 mAh·g
−1 at 0.1 and 1C-rate, respectively; these findings show that our sample results are clearly superior to their results.
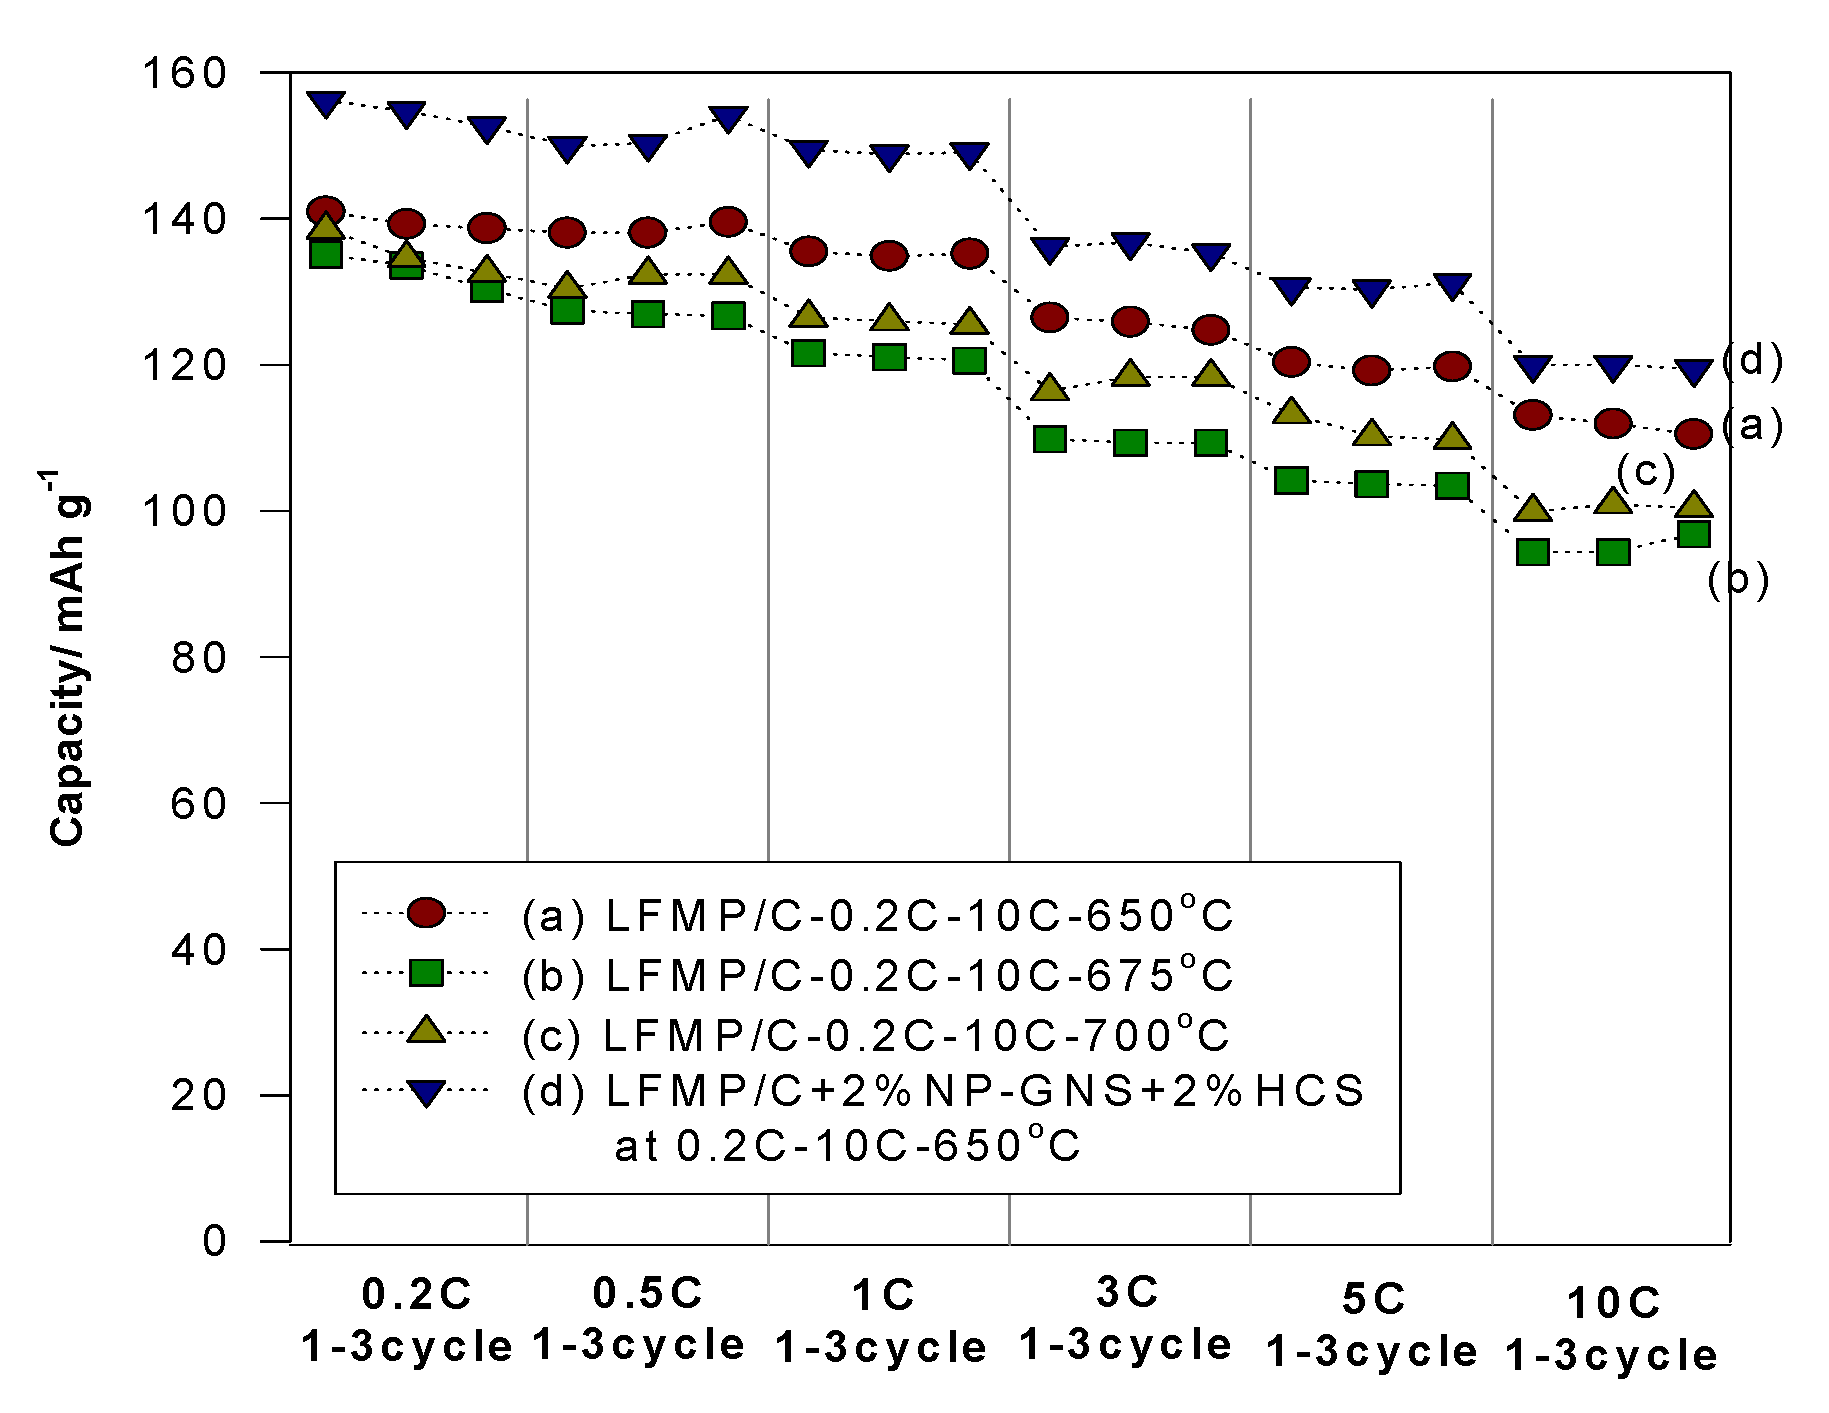
Figure 7 presents a comparison of the rate capability performance of the LFMP/Li half-cell based on the LFMP/C samples (without carbon additives) and the LFMP/C + 2% NP-GNS + 2% HCS composite comprised of extra 2 wt% NP-GNS + 2 wt% HCS carbon conductors, at 0.2–10C rates. We observed that the LFMP/C + 2% NP-GNS + 2% HCS composite exhibited higher rate performance than that of the LFMP/C sample. As shown in
Figure 8, the discharge specific capacities of the LFMP/C + 2% NP-GNS + 2% HCS composite sintered at 650 °C decreased from 154 mAh·g
−1 to 120 mAh·g
−1 as the discharge rate was increased from 0.2C to 10C. By contrast, the discharge-specific capacities of the LFMP/C samples sintered at the same temperature of 650 °C decreased from 141 mAh·g
−1 to 113 mAh·g
−1. We observed that the rate capability performance of the LFMP/C + 2% NP-GNS + 2% HCS composite with a two-type of carbon conductors, namely, two-dimensional (2D)-graphene and 3D carbon sphere, is greatly improved, as compared to the LFMP/C material without any carbon conductor.
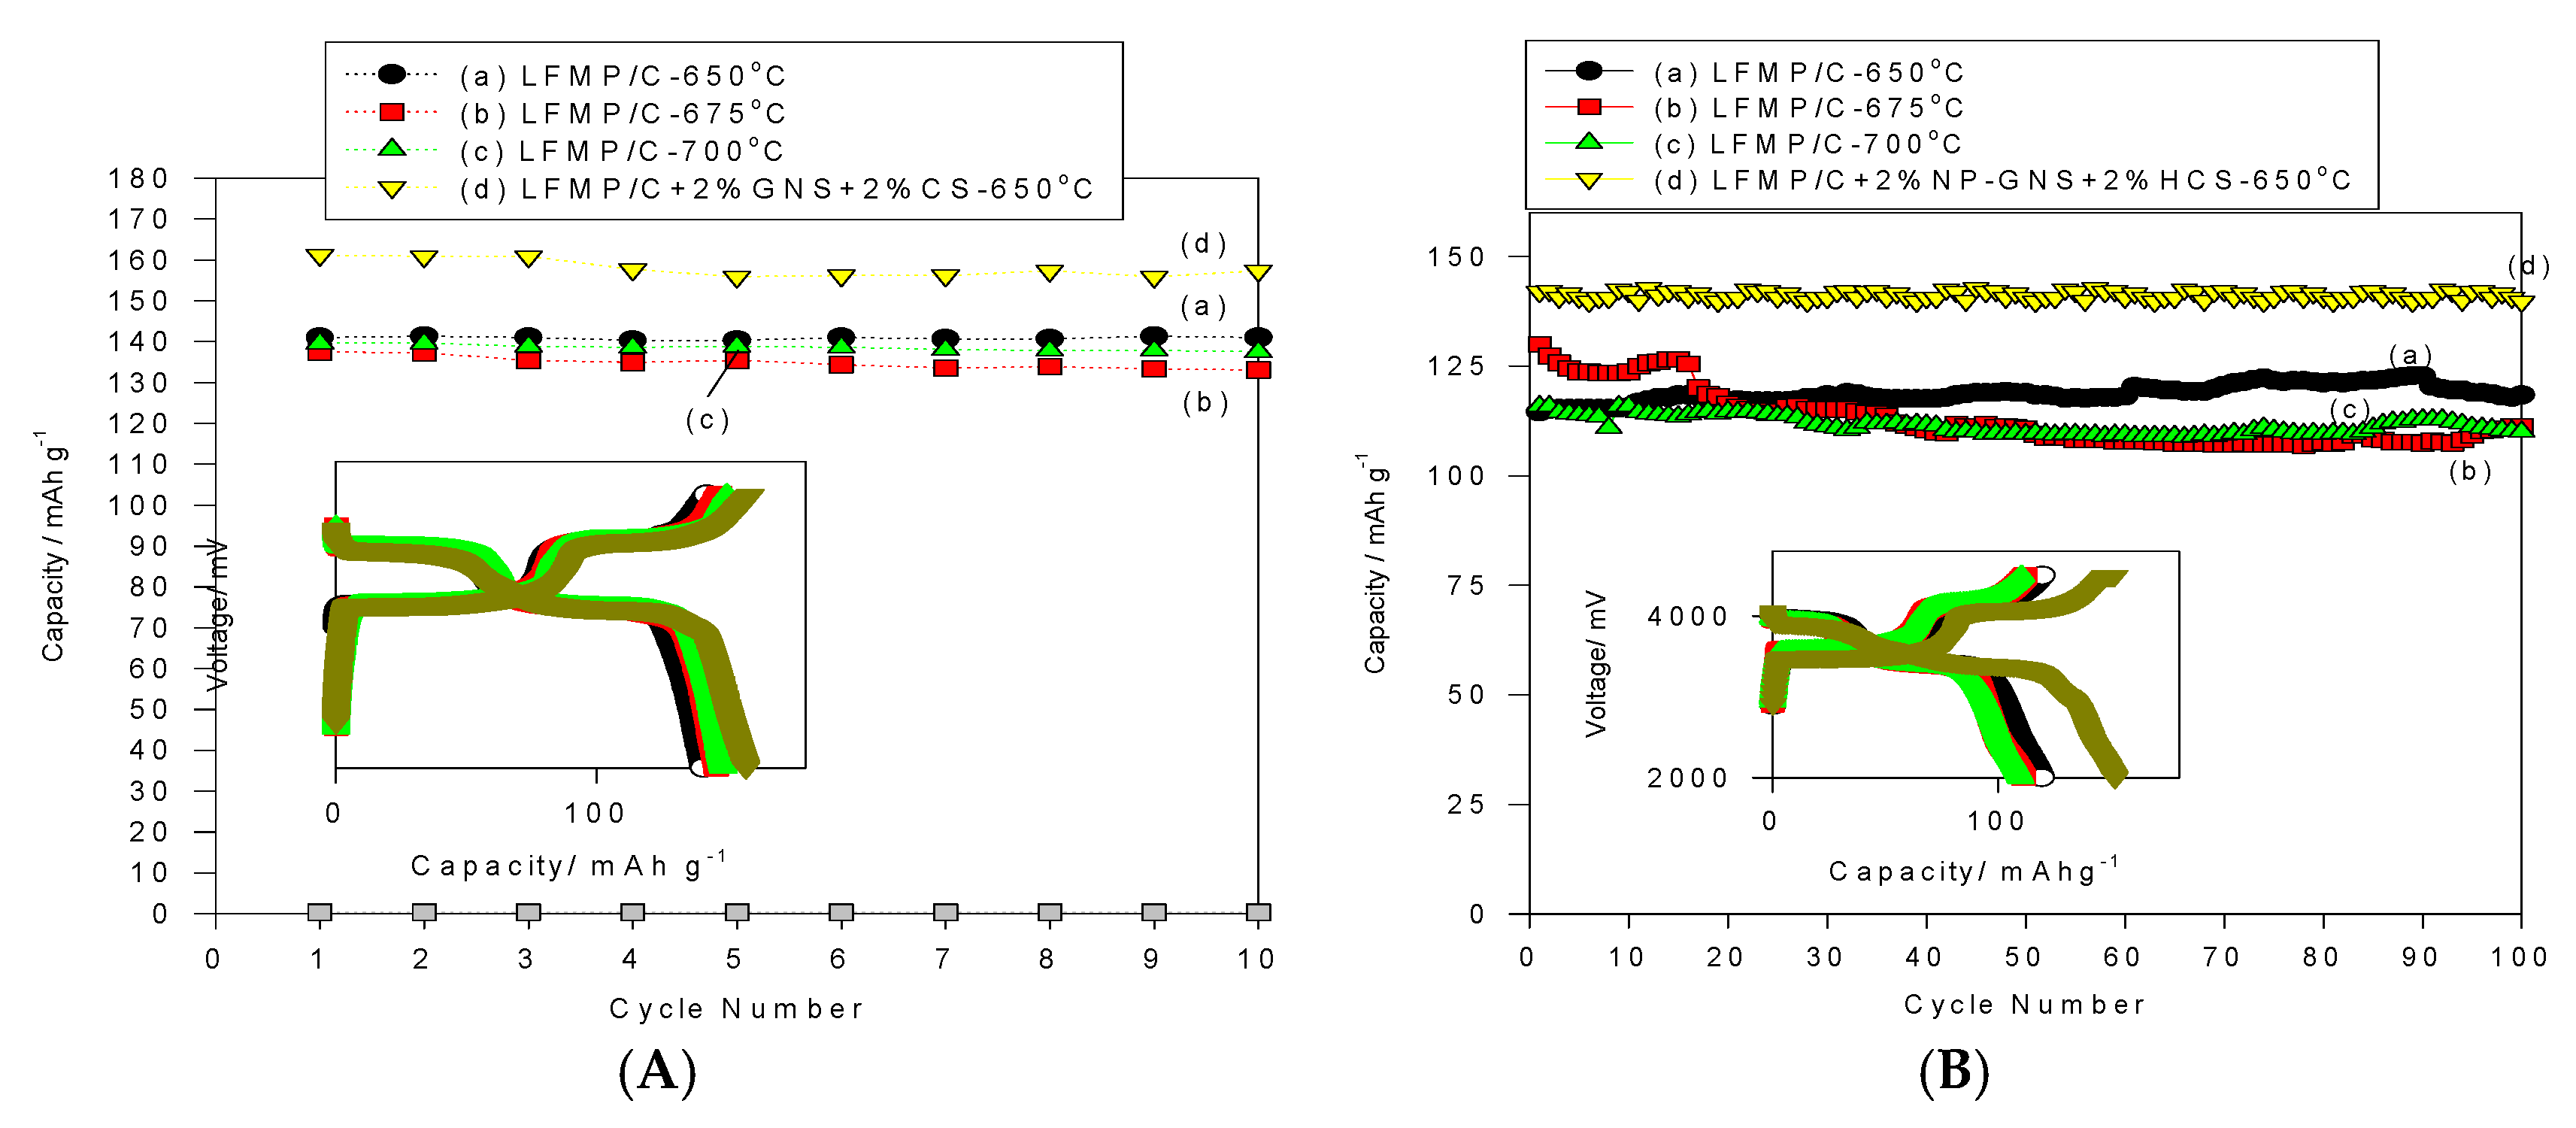
Figure 9A shows the cycle-life performance of the LFMP/C-650, LFMP/C-675, and LFMP/C-700 samples, and the LFMP/C + 2% NP-GNS + 2% HCS composite at charge/discharge rate of 0.1C/0.1C for 30 cycles for comparison. It was found that the discharge capacity of the LFMP/C-650 sample was maintained at 141–139 mAh·g
−1 at 0.1C-rate during the 30 cycling test, and the average discharge capacity was approximately 141 mAh·g
−1, demonstrating excellent cycle stability with no apparent capacity after the 30-cycle test. We observed that the average current efficiency of the LFMP/C-650 sample at 0.1C was approximately 99.32% during the 30-cycle test. Moreover, the discharge capacity of the LFMP/C-675 sample was maintained at 145–137 mAh·g
−1 at 0.1C-rate during the 30 cycles. The average discharge capacity was approximately 137 mAh·g
−1 with a fading rate of −0.57%/cycle at 0.1C rate during the cycling test. In addition, it was found that the average coulombic efficiency of the LFMP/C-675 sample at 0.1C was approximately 99.3% during the 30-cycle test. Furthermore, the discharge capacity of the LFMP/C-700 sample was maintained at 148–139 mAh·g
−1 at 0.1C-rate during the 30 cycles. The average discharge capacity was approximately 140 mAh·g
−1 with a fading rate of −0.63%/cycle at 0.1C rate during the cycling test. In addition, it was revealed that the average current efficiency of the LFMP/C-700 sample at 0.1C was approximately 99.3% during the 30-cycle test.
As expected, the discharge capacity of the LFMP/C + 2% NP-GNS + 2% HCS composite was achieved at 161–155 mAh·g
−1 at 0.1C-rate during the 30 cycles. The average discharge capacity was approximately 158 mAh·g
−1 with a fading rate of −0.23%/cycle at 0.1C rate during the cycling test. In addition, it was found that the average current efficiency of the LFMP/C + 2% NP-GNS + 2% HCS composite at 0.1C was approximately 98.55% during the 30-cycle test. These results indicated that all LFMP/C sample and the LFMP/C + 2% NP-GNS + 2% HCS composite exhibit excellent and stable electrochemical cycling properties.
Figure 9B shows the cycle-life performance of the LFMP/C-650, LFMP/C-675, and LFMP/C-700 samples, and the LFMP/C + 2% NP-GNS + 2% HCS composite at charge/discharge rate of 1C/1C for 100 cycles for comparison. The discharge capacity of the LFMP/C-650 sample was maintained at 122–114 mAh·g
−1 at 1C/1C rate during the 100-cycle test, and the average discharge capacity was approximately 118.2 mAh·g
−1, demonstrating high cycle stability with no apparent capacity decay after the 100-cycle test. It also observed that the average current efficiency of the LFMP/C-650 sample was approximately over 99%. Moreover, the discharge capacity of the LFMP/C-675 sample was kept at 130–107 mAh·g
−1 at a 1C discharge rate during the 100-cycle test. Additionally, the average discharge capacity of the LFMP/C-700 was around 115.7 mAh·g
−1 during the 100-cycle test and the average current efficiency of this sample was approximately 97%–98%. Particularly, the discharge capacity of the LFMP/C + 2% NP-GNS + 2% HCS composite was achieved at 141–130 mAh·g
−1 at a 1C discharge rate and the average discharge capacity was around 138 mAh·g
−1 during the 100-cycle test. It was found that the average current efficiency of this LFMP/C + 2% NP-GNS + 2% HCS composite was approximately 99%. These results clearly demonstrate that the LFMP/C + 2% NP-GNS + 2% HCS composite exhibits excellent and stable electrochemical cycling properties. This may be due to the composite with good electrical conducting channels being built on the electrode material by using 2D graphene and 3D carbon sphere additives. The polarization (the charge transfer resistance) of the LFMP/C + 2% NP-GNS + 2% HCS composite was markedly reduced.
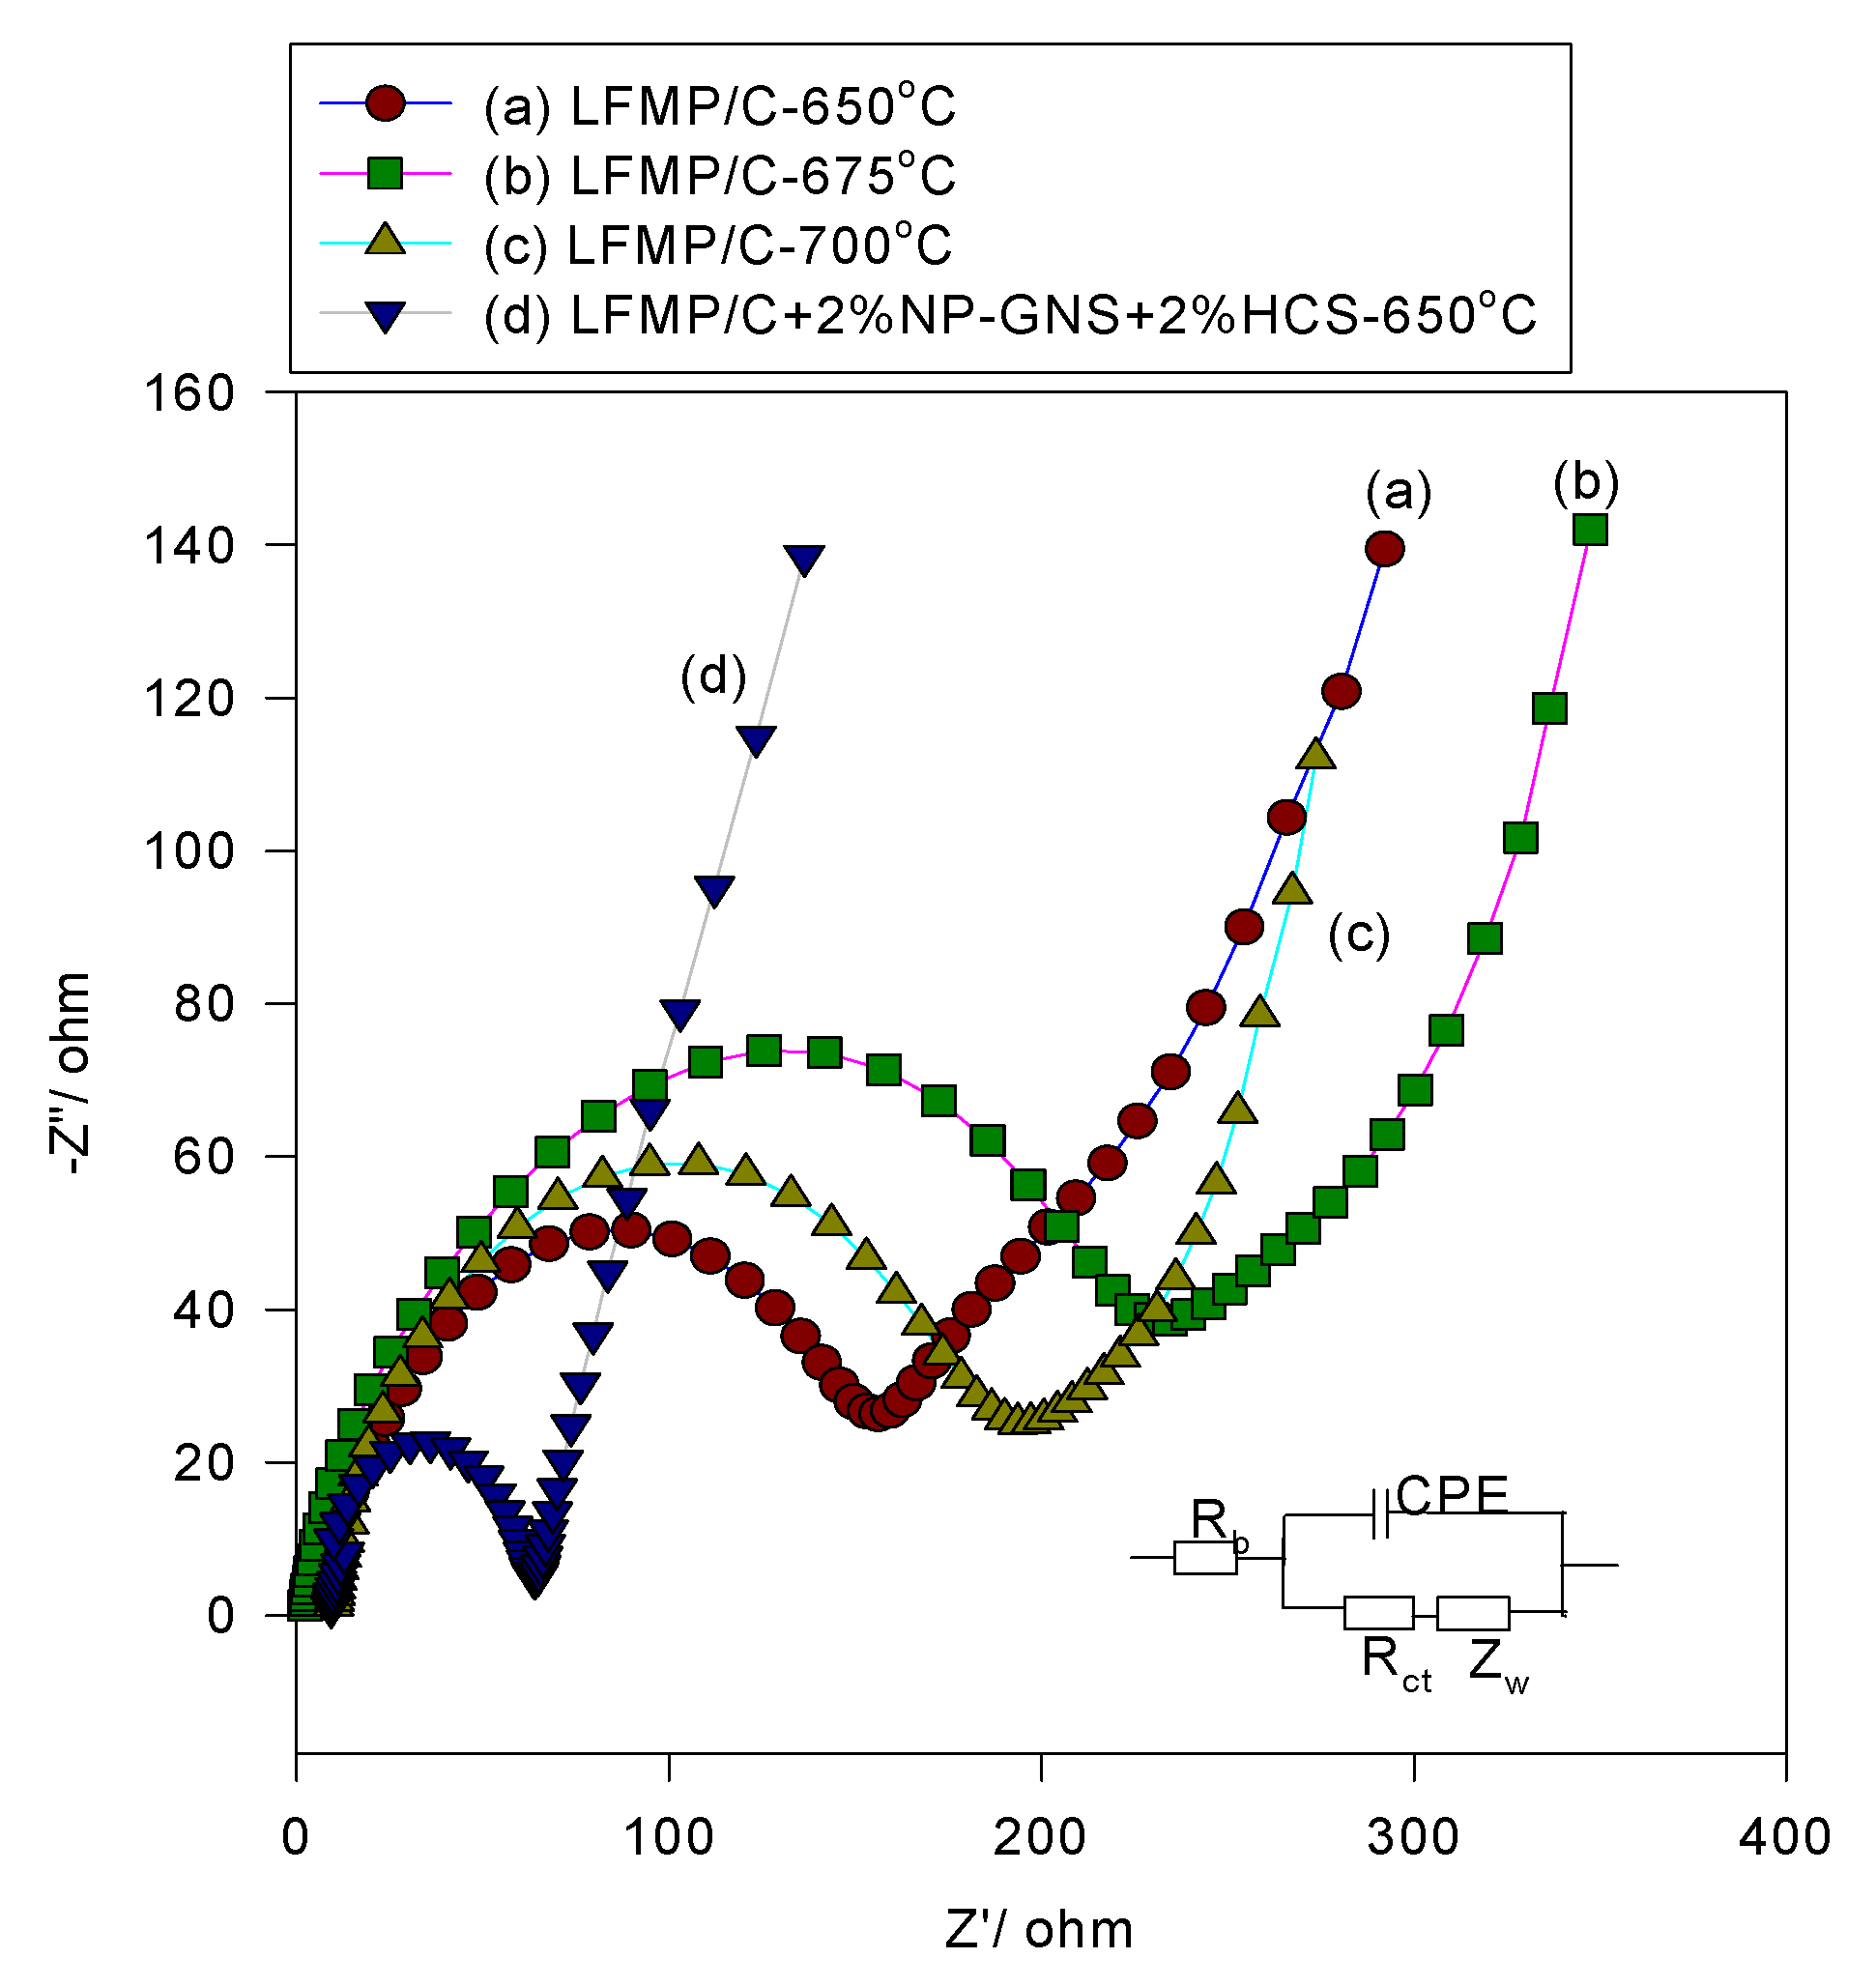
The AC impedance spectroscopy was applied to investigate the interface properties of the LFMP/C samples. The AC spectrum of the LFMP/C samples and the LFMP/C + 2% NP-GNS + 2% HCS composite is illustrated in
Figure 10. The equivalent circuit for LFMP/C is displayed in inset of
Figure 10. Each AC plot comprised of one semicircle at a higher frequency followed by a linear portion at a lower frequency. The lower frequency region of the straight line was considered as the Warburg impedance, which was used for long-range lithium-ion diffusion in the bulk phase. R
b indicates the bulk resistance at the electrolyte,
Rct refers to the charge transfer resistance at the active material interface, and CPE represents the double-layer capacitance and surface film capacitances.
Table 4 summarizes the values of the
Rb and
Rct for all LFMP/C samples. The
Rb and
Rct values of the LFMP/C-650 sample were approximately 5.46 Ω and 156 Ω, respectively. The
Rb and
Rct values of the LFMP/C-675 sample were approximately 4.36 Ω and 234 Ω, respectively. Moreover, the
Rb and
Rct values of the LFMP/C-700 sample were approximately 6.06 Ω and 193.6 Ω, respectively. By contrast, the LFMP/C + 2% NP-GNS + 2% HCS composite show 5.3 Ω and 63.95 Ω for the
Rb and
Rct values. In fact, the LFMP/C + 2% NP-GNS + 2% HCS composite showed the lowest charge transfer resistance, as compared with other LFMP/C samples. We prepared the LFMP/C composite material with 2D and 3D carbon additives, and they can build up the electrical conducting channels within LFMP electrode, which facilitate the electron transport and also greatly reduce the electrode polarization. In conclusion, the LFMP/C + 2% NP-GNS + 2% HCS composite can be prepared by a simple one-pot solid-state ball-milled process. The LFMP/C + 2% NP-GNS + 2% HCS composite showed excellent electrochemical performance; this is due to the reduction of the charge transfer resistance.


