Communication

Calculation of Constant Power Lithium Battery Discharge Curves

Aerospace and Mechanical Engineering Department, Embry Riddle Aeronautical University, Prescott, AZ 86314, USA
Batteries 2016, 2(2), 17; https://doi.org/10.3390/batteries2020017
Submission received: 22 February 2016 / Revised: 17 May 2016 / Accepted: 7 June 2016 / Published: 11 June 2016
(This article belongs to the Special Issue Lithium Ion Batteries)

Abstract

:
Standard battery testing procedure consists of discharging the battery at constant current. However, for battery powered aircraft application, consideration of the cruise portion of the flight envelope suggests that power should be kept constant, implying that battery characterization should occur over a constant power discharge. Consequently, to take advantage of existing battery discharge curves it would be useful to have a methodology that can extract a constant power discharge curve from a constant current discharge curve. The development of such a methodology for lithium batteries is described in this article.

1. Introduction

Battery powered unmanned aerial vehicles have experienced consistent growth in use and application. Like any other class of flight vehicle, accurate estimation of range and endurance is paramount during the design and selection phase. Methods to estimate range and endurance for battery powered aircraft [1,2,3,4] are not as well established as those for fossil fuel powered craft [5,6,7]. In [8], a method is developed to estimate the range and endurance of battery powered aircraft with validation of the approach presented in [9]. To implement the method and approach of [8,9], battery discharge curves are required at constant power, where the battery voltage and current vary. This is atypical from the usual method of battery performance characterization, where the current is fixed and power and voltage are variable. Consequently, to use the method in [8], battery data is required for a constant power discharge, or a means is required to convert constant current discharge curves to constant power discharge curves. Such a technique is the focus of this article.

2. Theoretical Development

Working with lead acid batteries, Peukert [10,11] established that their rate of discharge affected their effective capacity; for discharge rates greater than a 1C, the capacity would reduce (and vice versa). An increase in the discharge current of the battery may decrease the effective capacity due to a decline of the reactivity of the battery’s active materials. Mathematically, this is expressed as:
K = i P t
where P is the Peukert constant, i is current and K is a constant. For lithium batteries, which are at present the “standard” due to their high power density, the impact of the Peukert effect is not well established [12]. A value of P ≈ 1.05 has been suggested [12]. The greatest impact on lithium battery capacity stems from their sensitivity to temperature; low temperatures severely attenuate the rated battery capacity C [13,14]. Lithium batteries are also sensitive to the number of charging and discharging cycles; the greater the number of cycles the less the capacity due to a loss of active material within the cell and primarily loss of lithium inventory [15].
In order to transform a constant current discharge curve, see Figure 1a, Figure 2a and Figure 3a for examples of typical discharge profiles [16,17], it would be useful to correlate the curves by establishing their dependence on discharge rate or current. The data in Figure 1, Figure 2 and Figure 3 was obtained from digitization of the manufacturer’s charts. Higher discharge currents are seen to reduce the voltage during discharge because the polarization voltage in the electrode reactions increases [14]. It was found heuristically within the spirit of Equation (1) that the constant current discharge curves for a given battery collapse when the voltage V during the discharge is multiplied by the current raised to the power n for a given discharged capacity (while this collapse is seen for high power cells used in aircraft application, high energy cells may not show such a correlation):
i n V ( D ) = C o n s tan t ( D )
The discharged capacity, D is the total charge drawn from the battery at the time instant in which it is considered. This correlation is shown in Figure 1b, Figure 2b and Figure 3b where data is presented for lithium batteries from various manufacturers. It was found that values of n ≈ 0.05 (determined using a non-linear least squares minimization) showed the best collapse of the curves. As the discharge curves can be correlated, they may then be used to estimate a constant power discharge via the following procedural steps:
(1)
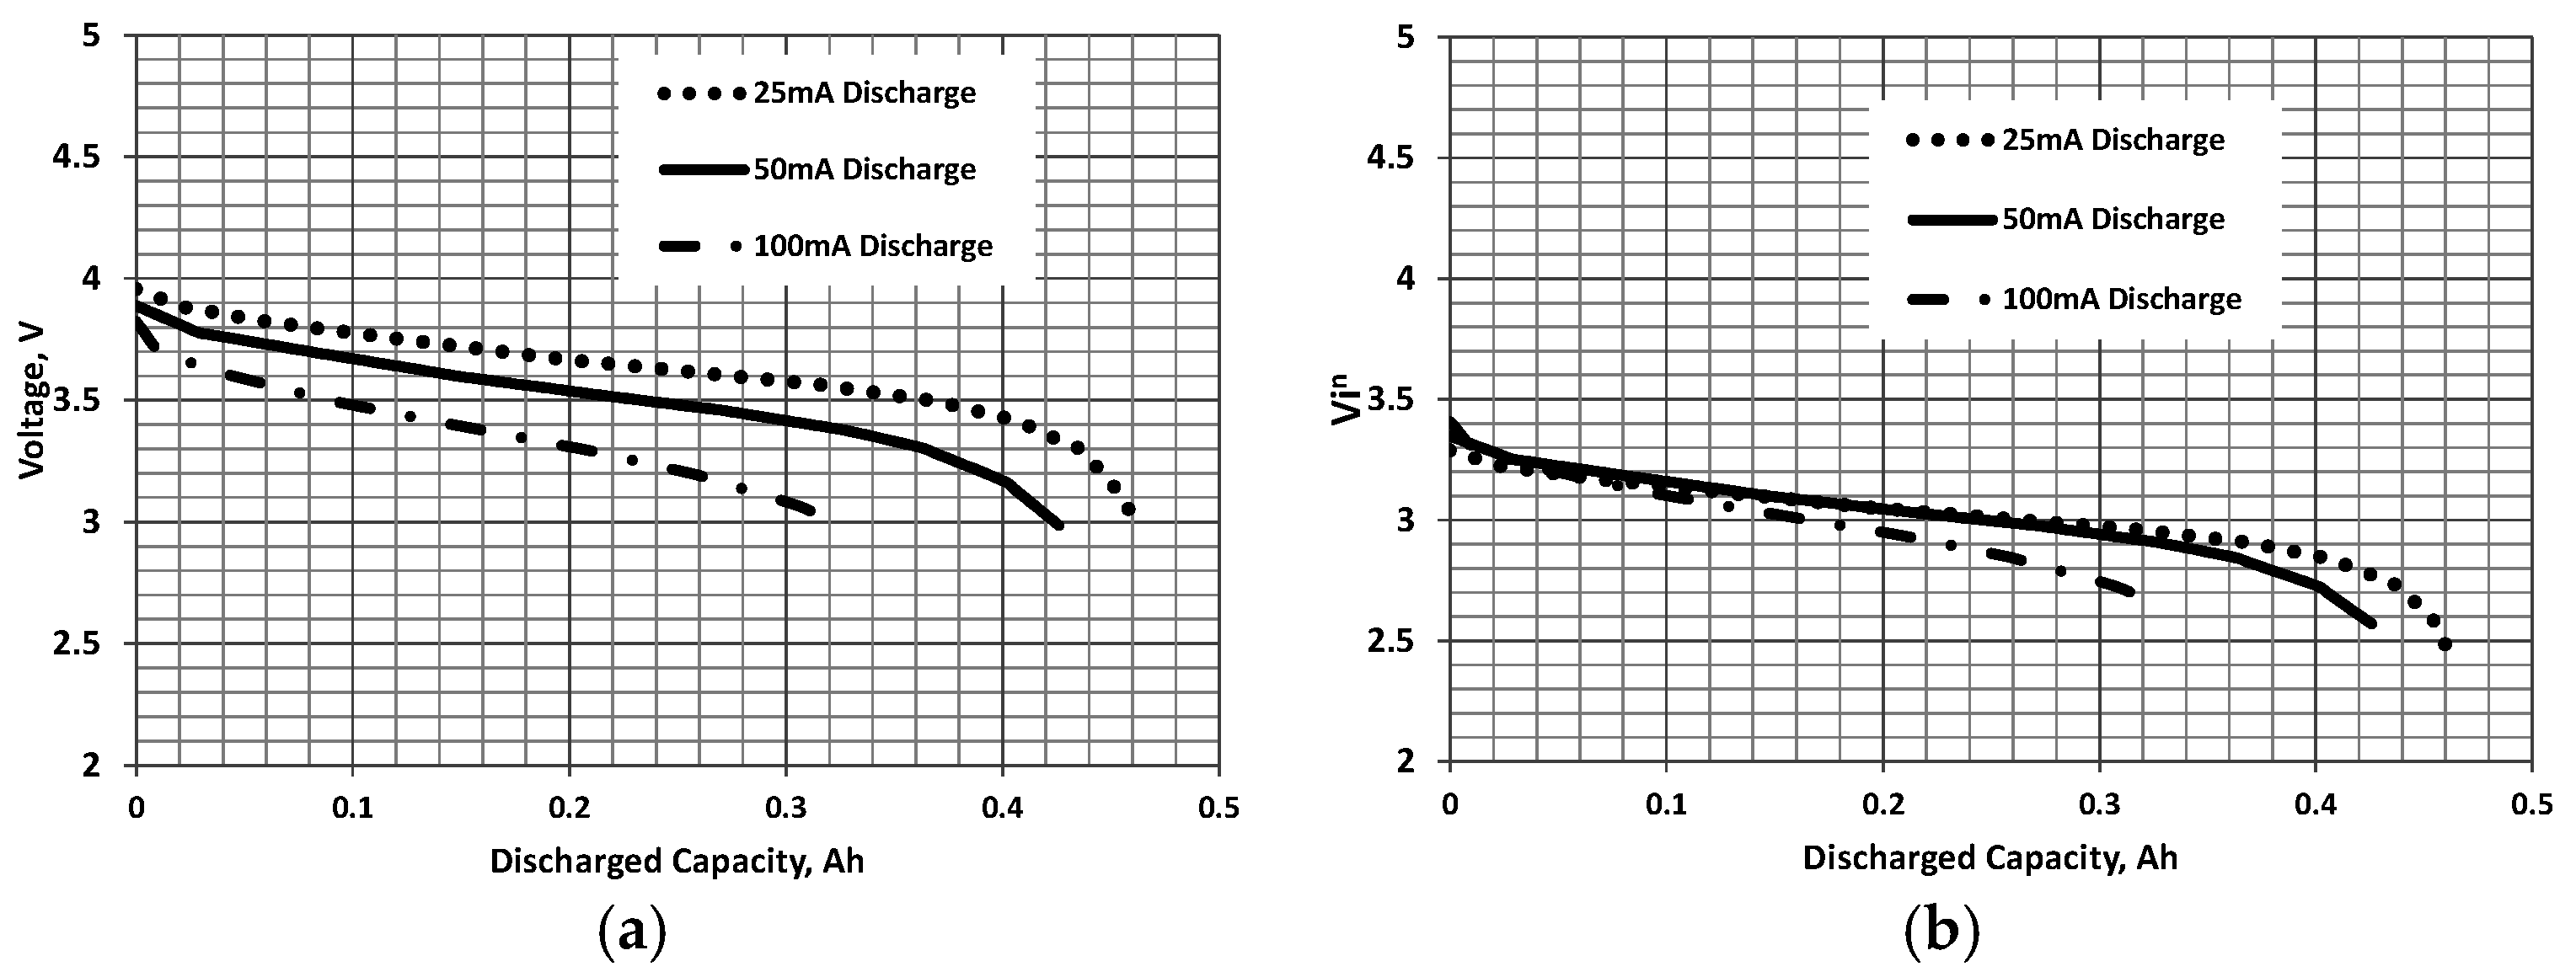
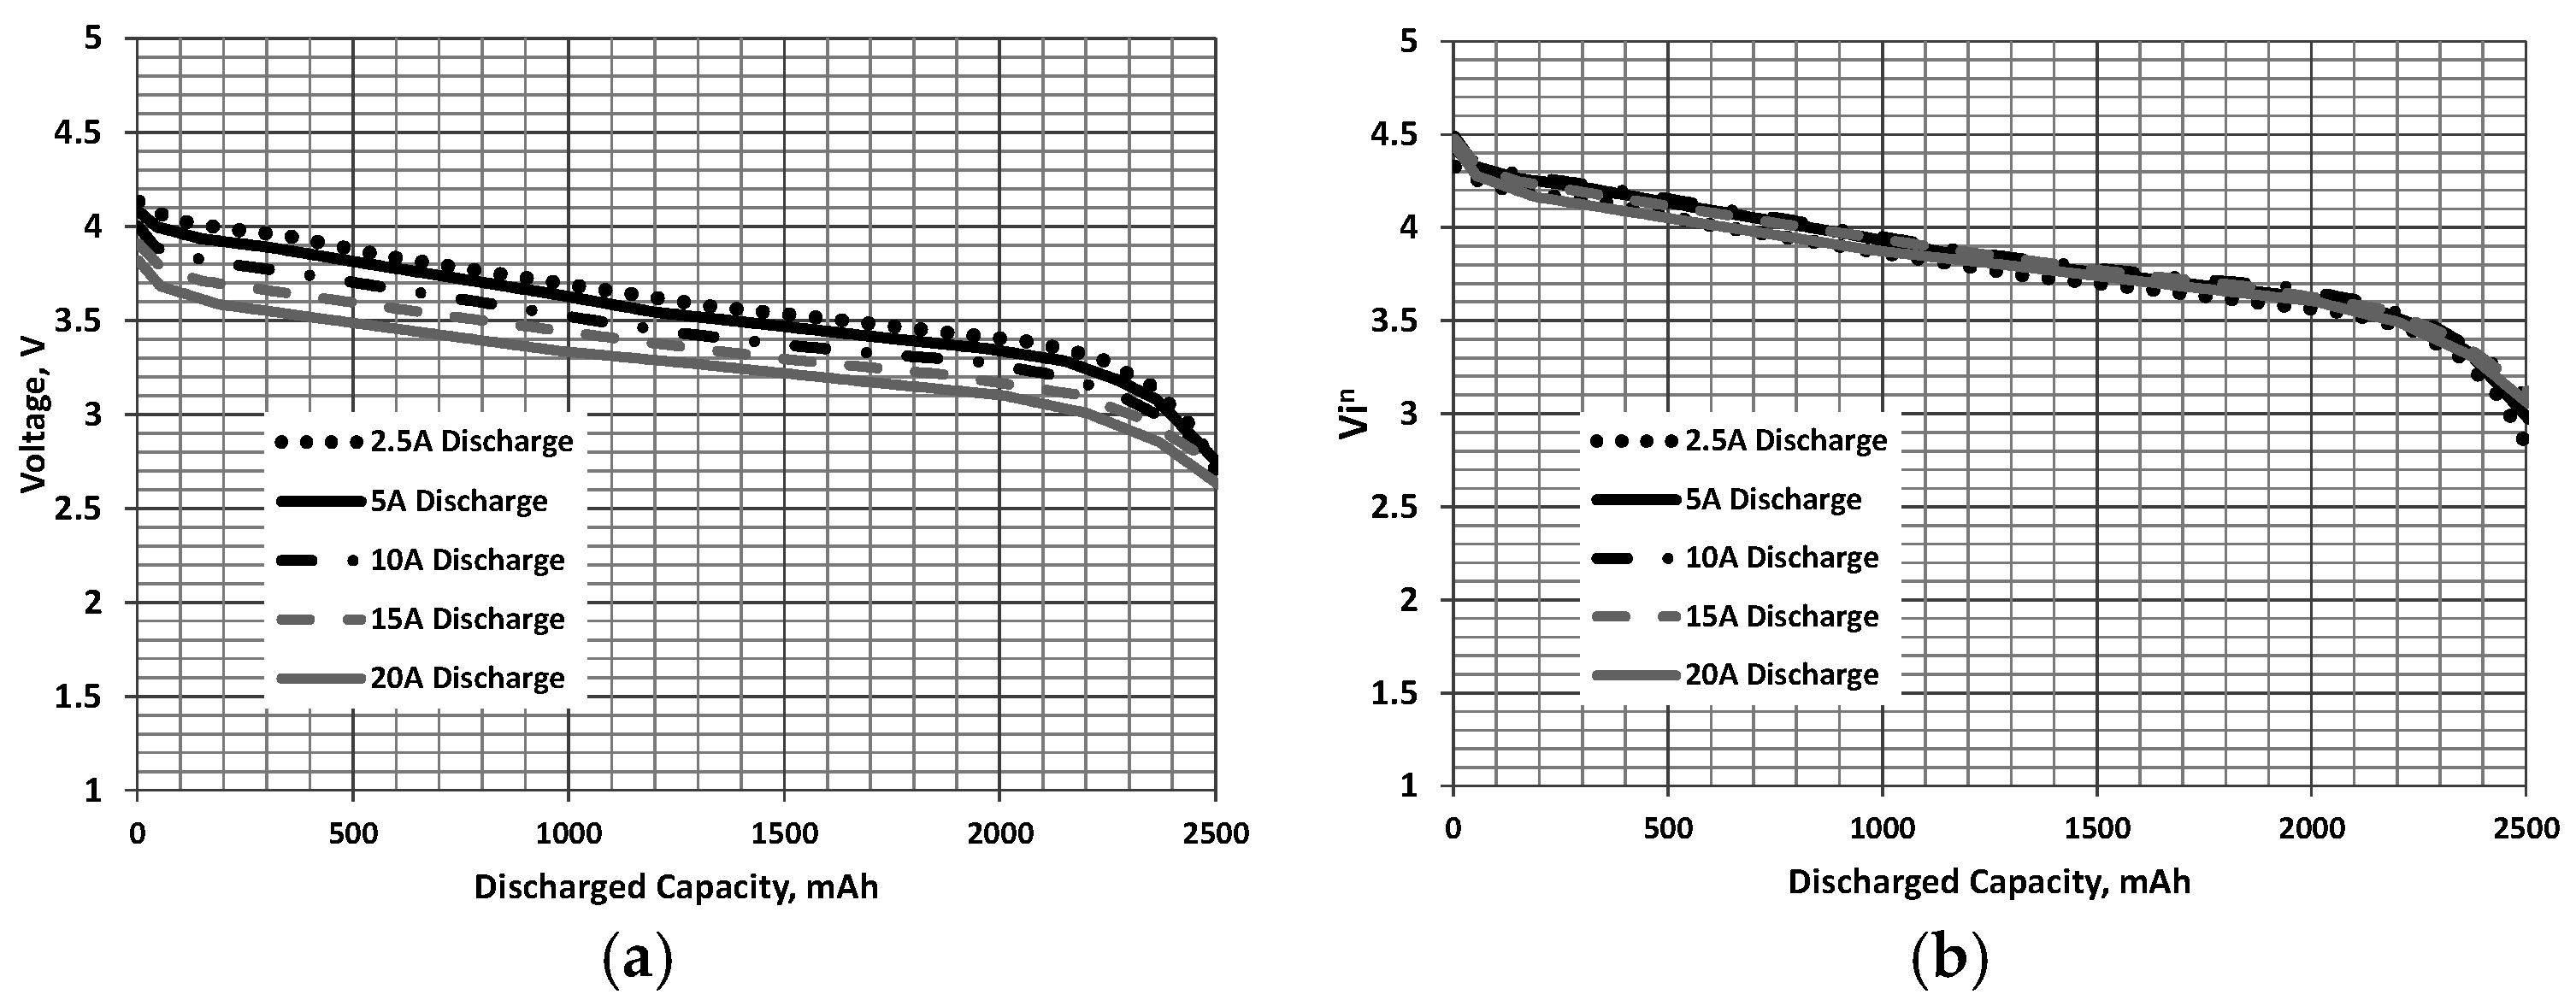
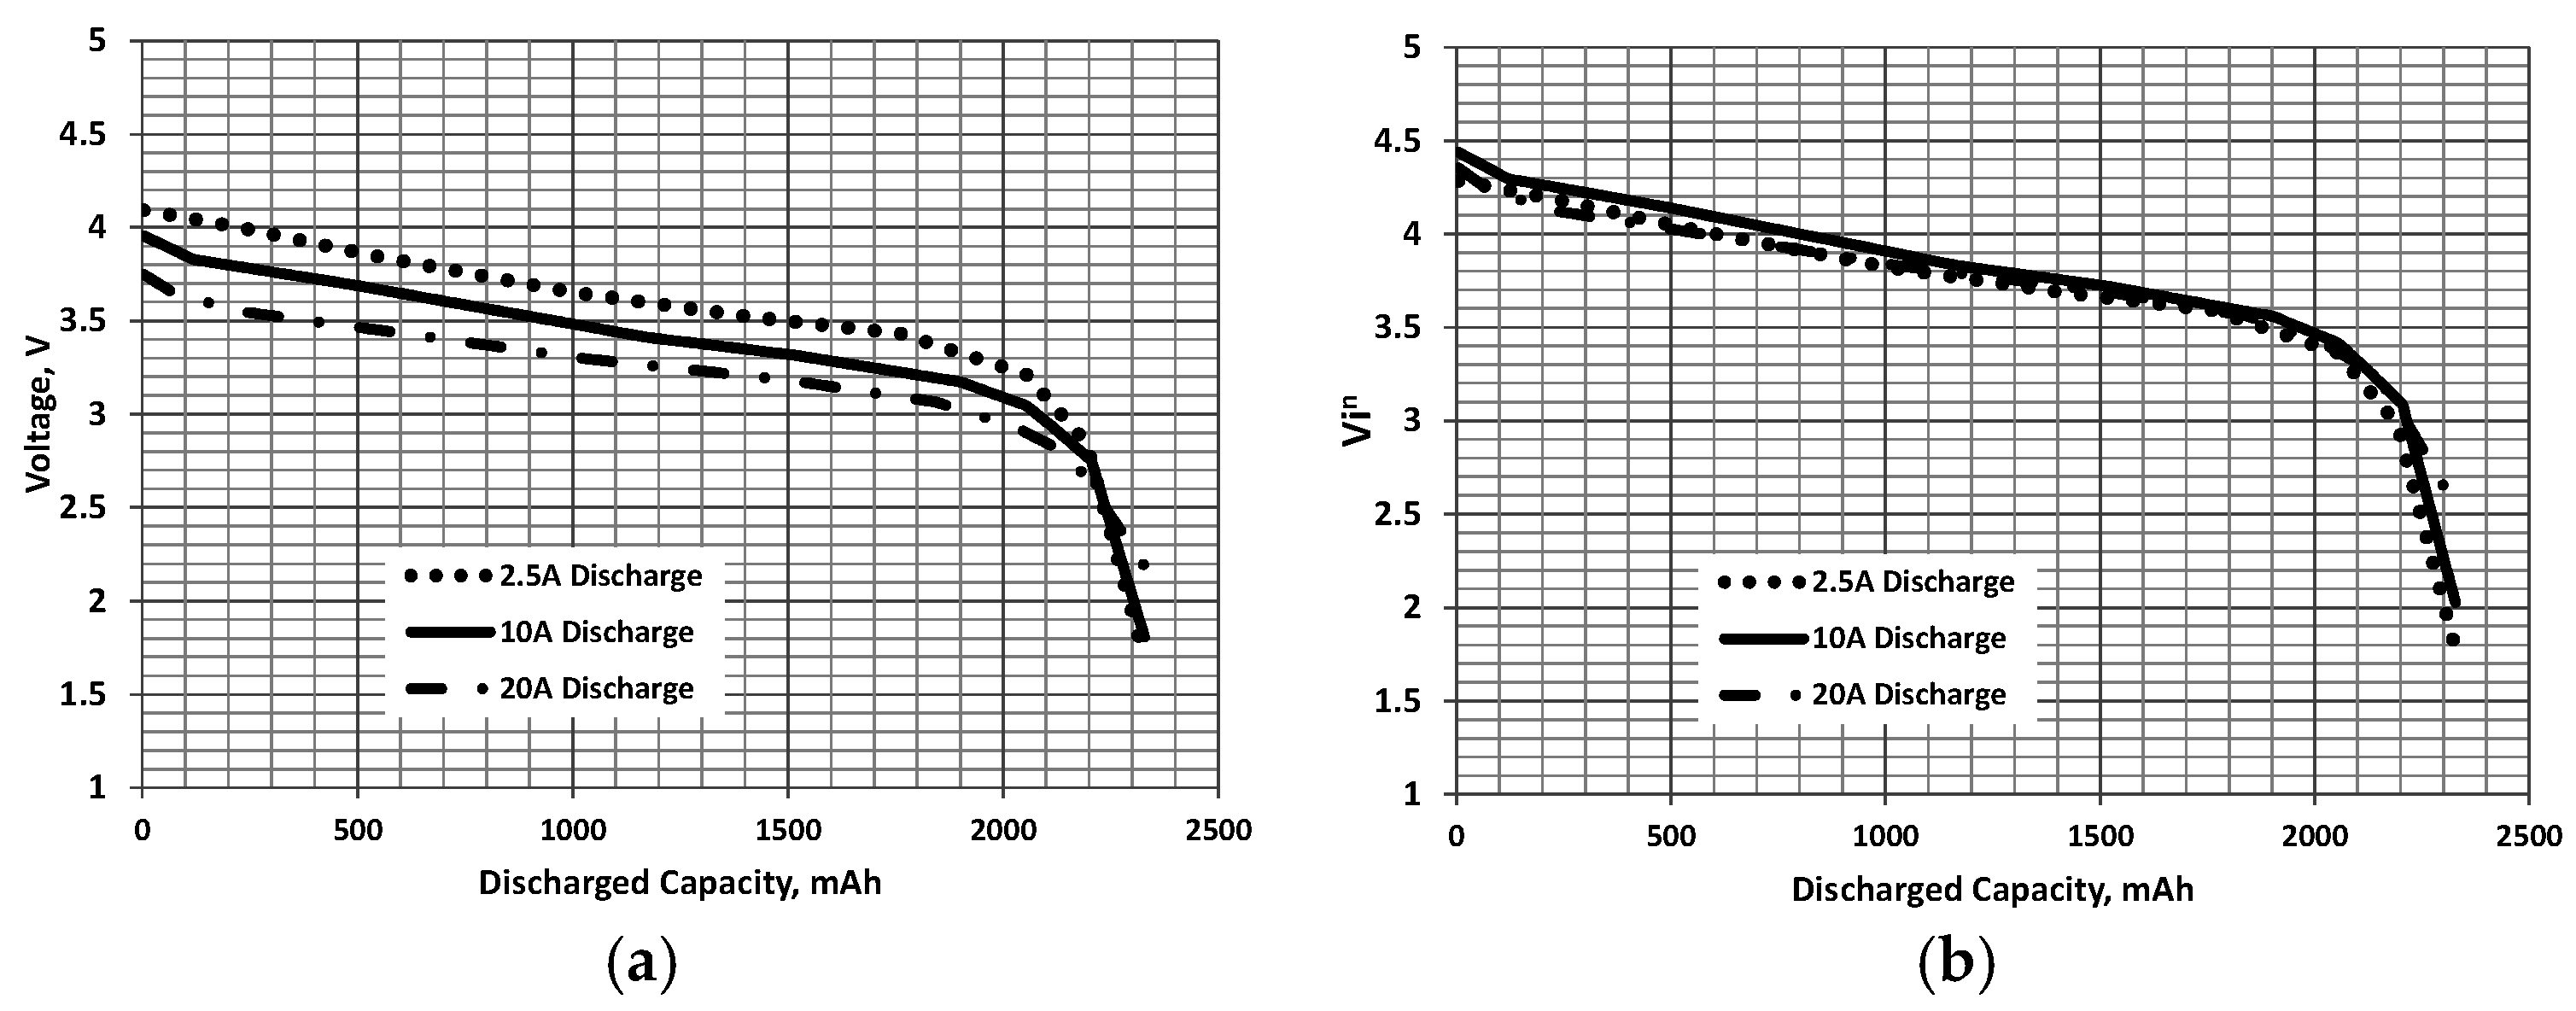
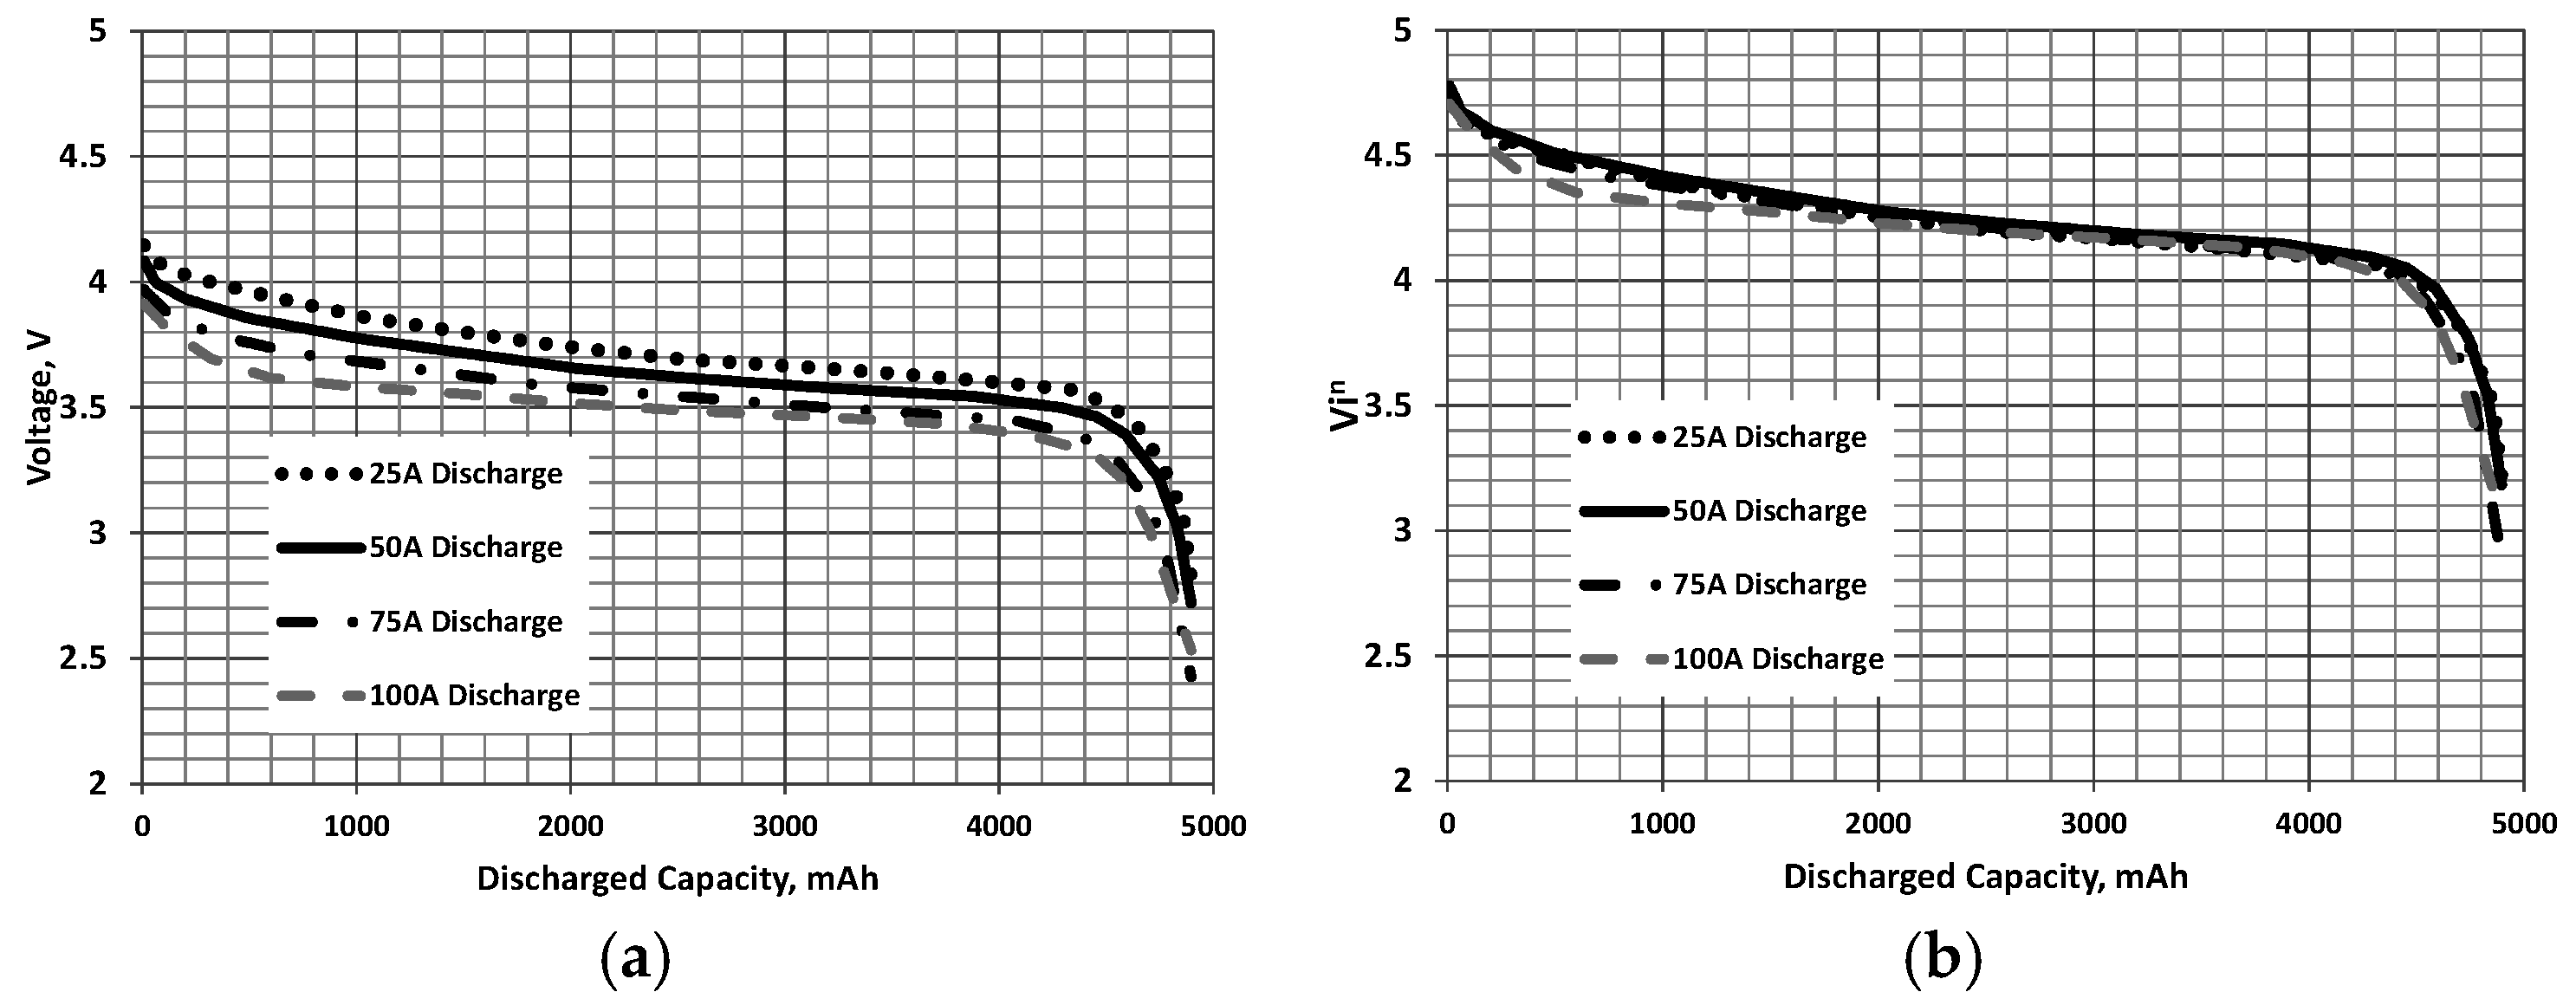
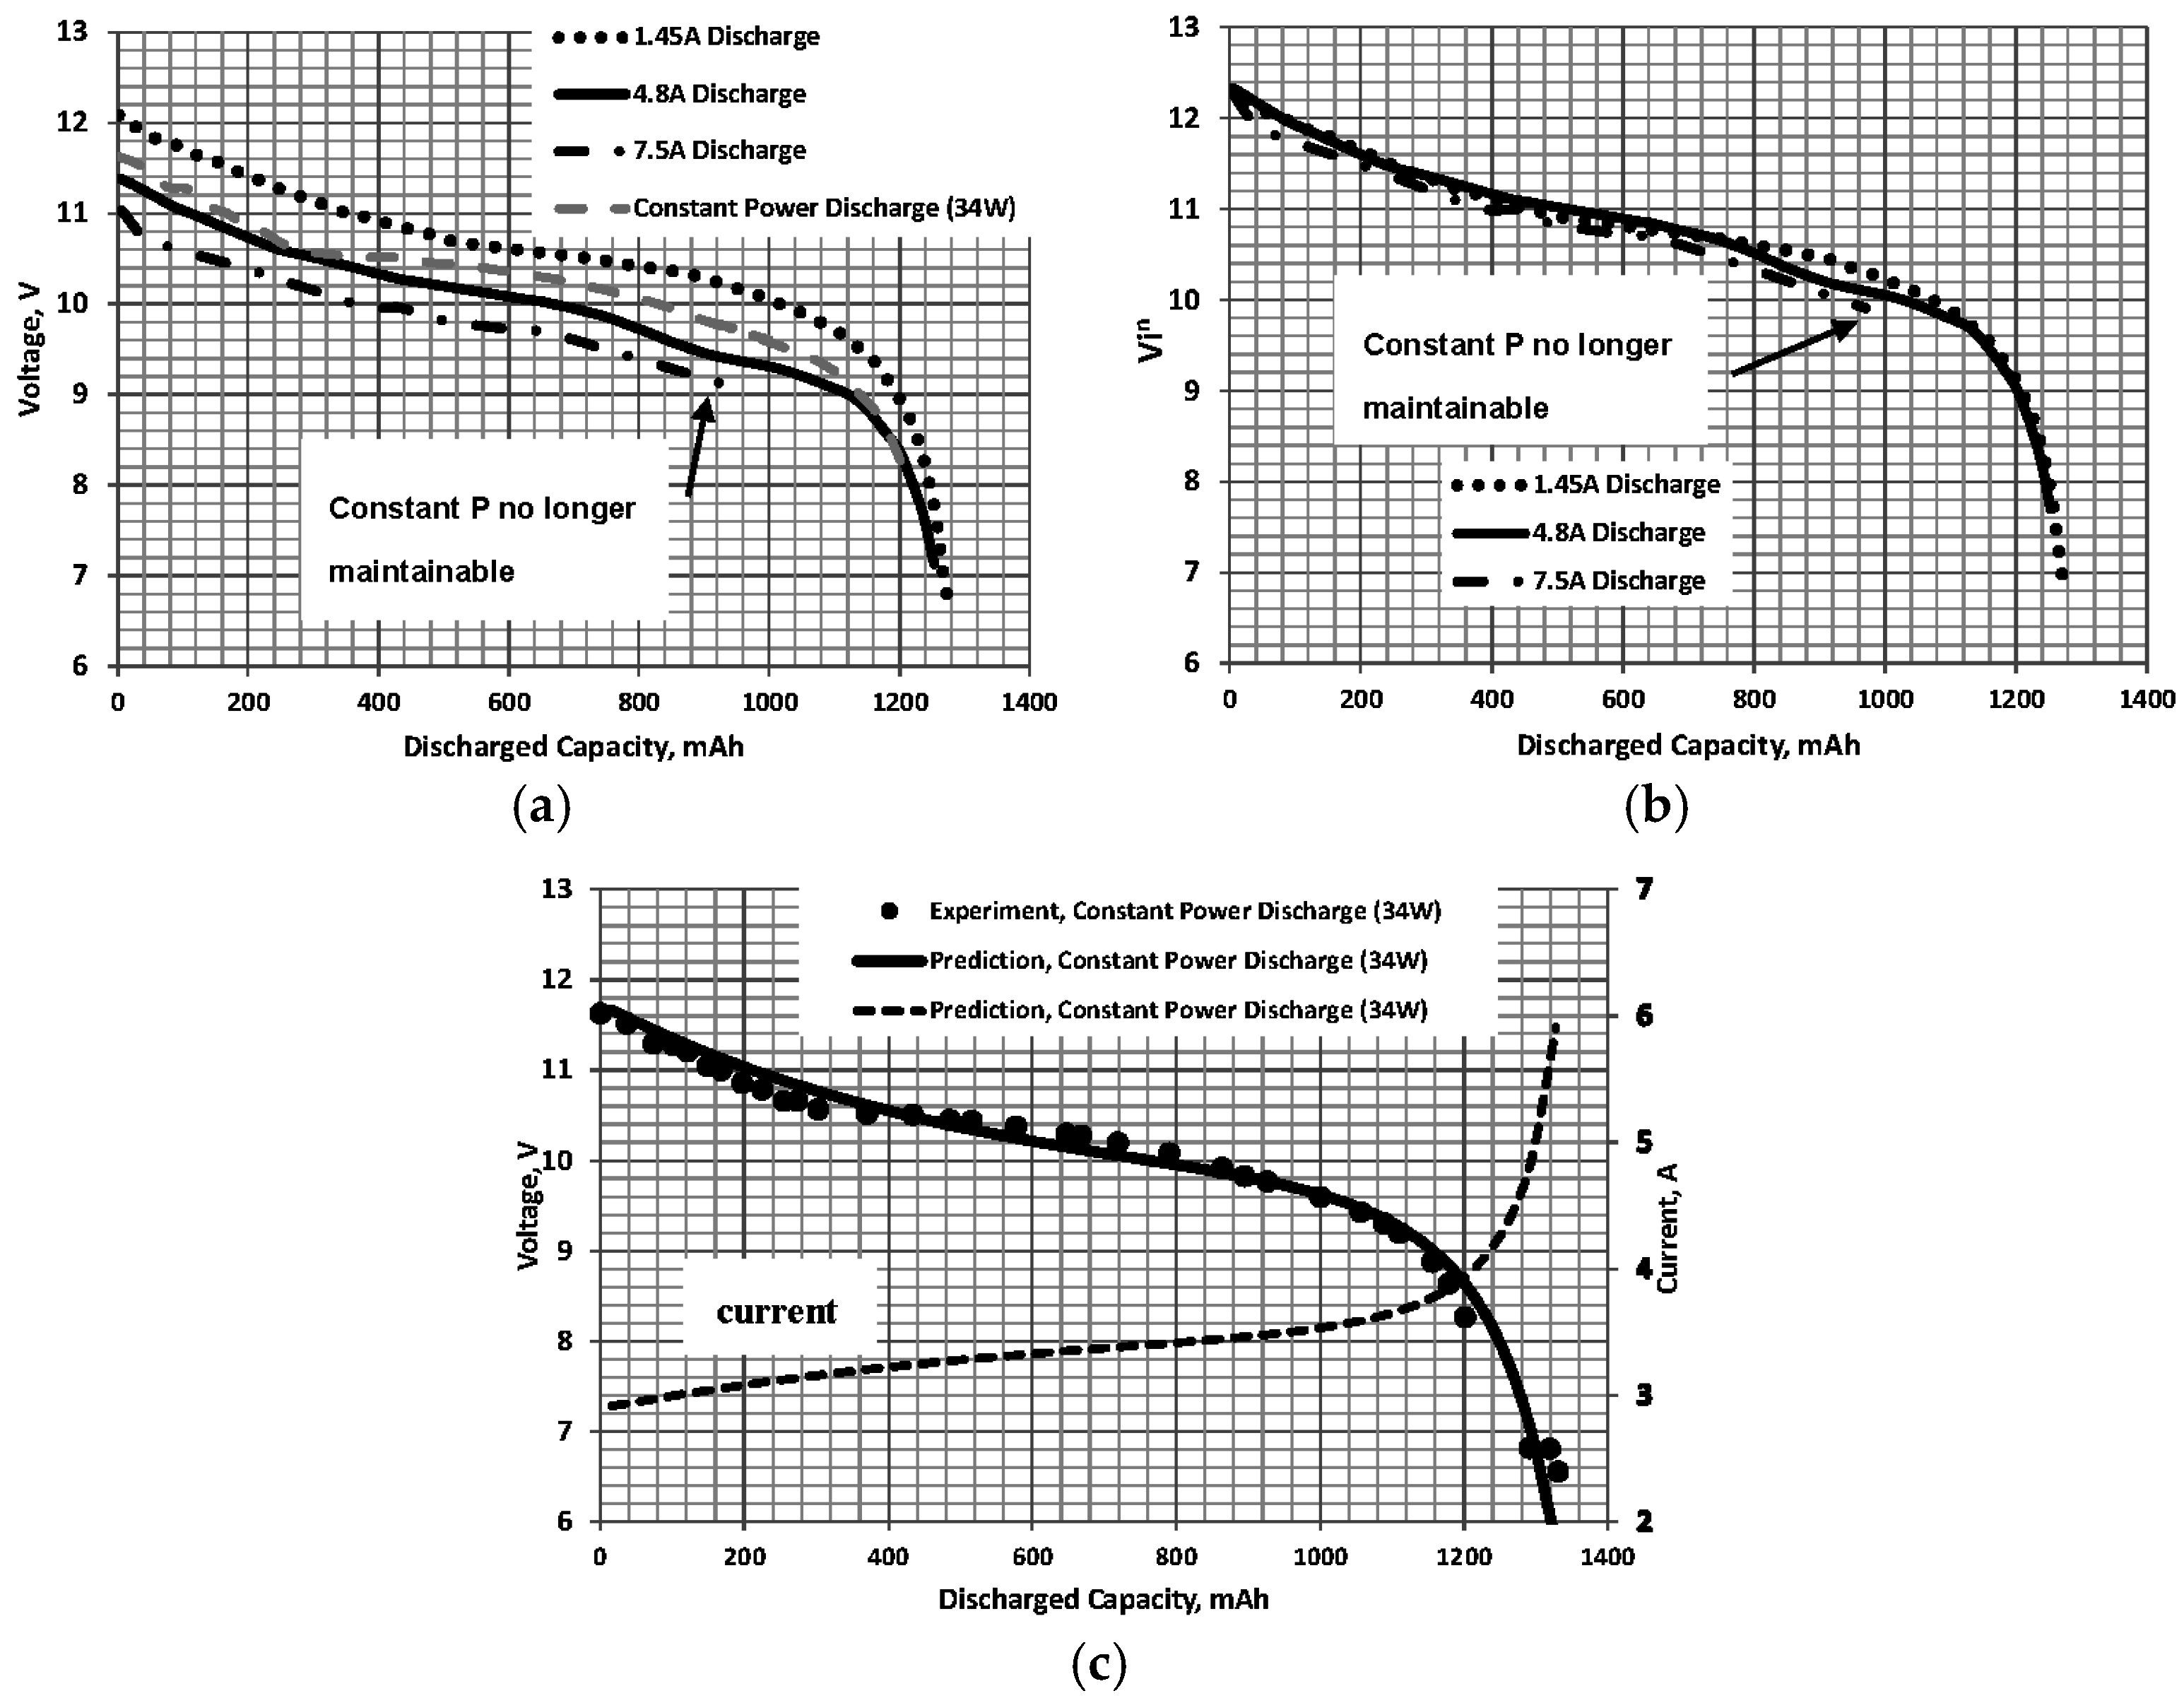
Using the available constant current discharge curves for the battery of interest, plot inV as a function of the discharged capacity, D, see Figure 1b, Figure 2b and Figure 3b for examples. Adjust n to afford the best collapse of the curves. Alternatively, n may be established using a non-linear least square minimization as follows. Let M = the number of test cases (discharges at different i for a given battery). The least square criterion is implemented as:
S u m = j = 1 M [ V j i j n V i n ¯ ] 2
where the overbar indicates an average for all j (for a discharge D). The counter j refers to the individual data sets. A non-linear least square solver (found in MS Excel, or most mathematical computational software) may be used to find the value of n that minimizes the summation.
(2)
Once n has been determined, the collapsed plots are curve fitted as a function of D. A function of the form:
V i n ( D ) = ( a + c D + e D 2 ) ( 1 + b D + d D 2 + f D 3 )
matches a battery discharge curve profile well and can be readily found using software such as TableCurve, MathCad or most statistical curve fitting packages. Naturally, other curve fit functions may also be used. Note that the non-linear least square minimization solver may be used directly to solve Equations (3) and (4) with the form of the curve fit expressed by Equation (4) prescribed. However, ill-conditioning and divergence may be an issue unless the initial estimates of the coefficients in Equation (4) are close to the optimal values.
(3)
The voltage during the discharge may be found using V j = i n V ( D ) j 1 i j n which after substitution of i j = P e V j yields:
V j = ( i n V ( D ) j 1 P e n ) 1 / ( 1 n )
note that for the calculations to not be circular, Vj cannot be a function of inV(D)j. It is thus assumed that inV(D)j = inV(D)j−1 for each successive step, not for successive steps. What this implies is that inV(D) does not change rapidly between each iteration. As long as the time step is small relative to the total discharge time this is a reasonable assumption. If the required Preq or mechanical power is known, then Pe = Preqtot where ηtot is the efficiency of the propulsion system including the propeller, electronic speed controller and motor.
(4)
The corresponding current at this time step is:
i j = P e V j
(5)
The discharged capacity then follows as:
D j = i j × ( Δ t ) + D j 1
(6)
Calculate the voltage, current and discharged capacity at the next time step t (t(h) = j/N where j = 1, 2, 3, ... and N is an arbitrary constant defining the time step increment. In this article N = 180 giving time increments Δt of 20 s). The time step should be small compared to the discharge duration to ensure the validity of Equation (5).
(7)
Repeat Steps 3–5 until the discharged capacity Dj is approximately equal to C.
Note that the discharge curves in Figure 1, Figure 2 and Figure 3 were determined at temperatures between 20 °C and 25 °C. The validity of Equation (2) at very low temperatures needs to be established.
Consequently, Figure 4 presents data for a lithium polymer battery developed at the Jet Propulsion Laboratory (JPL) for application at low temperatures [18]. The cell was tested at −20 °C at various discharge rates. As shown in Figure 4a, a rate dependence on capacity is clearly evident with higher discharge rates reducing the effective capacity. Correlation of the data sets using Equation (2) is presented in Figure 4b. As seen, Equation (2) only affords correlation of the three curves during the initial segment of the discharge. It may thus be inferred that Equation (2) is not representative at very low temperatures.

3. Materials and Methods

To validate the procedure enumerated above, a test was undertaken using an Electrifly 1300 mAh 30C lithium polymer battery (which consists of three cells in series and is rated at 11.1 V with a capacity of 1300 mAh, Great Planes, Champaign, IL, USA). The battery was discharged at different constant current rates (1.45 A, 4.8 A and 7.5 A), while the voltage, power and current were monitored using a Watt's Up Watt Meter and Power Analyzer (Denver, CO, USA). The ambient temperature during testing was maintained at 20 °C. Measurements from this Watt meter and power analyzer were compared against a Fluke 175 multi-meter (Everett, WA, USA). The difference between readings was within 0.3% for voltage and current (up to 10 A—limited by the range of the Fluke meter). After each test, the battery was allowed to cool for at least 2 h so that it was at ambient temperature before recharging. A Great Planes AC/DC Triton EQ Charger Balancer was used to recharge the battery. During discharge either power or current was held constant by monitoring the output of the Watt’s Up meter and manually adjusting the batteries power or current output. This method was viable without implementing a control system as changes in power or current were slow. Using this approach, current could be maintained within 0.06 A and power within 0.24 W. Consequently, the worst case scenario for the presented data gives an error in the current of 2.4% and power of 0.7% respectively.

4. Discussion

The resulting discharge curves are shown in Figure 5a. For reference, also included in this plot is an experimental constant power (Pe = 34 W) discharge curve where both the voltage and current varied. Correlation (application of Step 1) of the constant current discharge curves in Figure 5a yields Figure 5b with n = 0.05. As seen for the other data sets in Figure 1, Figure 2 and Figure 3, collapse of the curves is good. Data for a 7.5 A discharge is included for completeness; however, after approximately 960 mAh discharge, the battery was no longer capable of maintaining power. We fitted the function defined by Equation (4) to the collapsed curves in Figure 5b then defined inV as a function of D (with a = 12.3063, b = −0.000328, c = −0.008112, d = −4.7809 × 10⁻⁷, e = −7.7835 × 10⁻⁷, and f = 1.4086 × 10⁻¹⁰). Implementation of the constant power discharge procedure yielded the estimate shown in Figure 5c, presented in conjunction with the experimentally measured curve. In order to clarify the application procedure, Table 1 contains data for the first two iterations.
The steps for populating the table follow as:
  • The time increment is given by 1/180 = 0.0056 h (20 s);
  • From Equation (5) with j = 1: V 1 = ( 12.3063 34 0.05 ) 1 / ( 1 0.05 ) = 11.67 V; and
  • Equation (6) gives: i 1 = 34 11.67 = 2.914 A;
  • The discharged capacity follows from Equation (7) as: D1 = i1Δt + D0 = 2.914 × 103 × (0.00556) + 0 = 16.202 mAh;
  • Advancing j = 2 and evaluating Equations (5)–(7) yields V2 = 11.601 V, i2 = 2.931 A and D2 = 32.498 mAh.
It must be mentioned that published data for lithium batteries is not consistent in indicating the presence of capacity dependence on the rate of discharge (especially for high power cell technology). For the data sets presented in this article, with battery capacities and discharge rates consistent with that of a small unmanned aerial vehicle, significant rate dependence (which depends on the anode and cathode material as well as the electrolyte in the battery) is not evident. This result was also noted by Chang and Yu [19]. A rate dependency (or Peukert type effect) may only manifest at high discharge current values that would not be used if flying for maximum range or endurance. High discharge rates (>20C) may reduce the data collapse afforded by Equation (2). Consequently, if the application requires discharge rates above 20C, the proposed method should be used cautiously as it may not be representative.

5. Conclusions

Estimates of range and endurance for battery powered aircraft are less well established than those for fossil fuel powered vehicles. A recently developed method to estimate these parameters (range and endurance) requires the variation of battery voltage at constant power as the battery is discharged. However, standard testing procedure for batteries involves discharge at constant current. Consequently, a procedure is developed to estimate constant power discharge curves for lithium batteries using information from constant current discharge data. The method is valid for high power cells and may not be applicable for high energy cells. Constant current discharge curves are shown to correlate when the voltage during the discharge is multiplied by the current raised to a power (with a value of ≈ 0.05). Curve fitting the correlation then allows for the determination of the voltage variation during discharge for a set power. Comparison of a prediction made using the correlation method and an experimental constant power discharge showed close accord. The correlation method is not shown to be applicable at very low temperatures and does require that the effective capacity is not affected by the discharge rate.

Conflicts of Interest

The author declares no conflict of interest.

Abbreviations

CCapacity
DDischarged capacity
eElectrical
iCurrent
jCounter
KConstant
MNumber of test cases
NTime step increment
nExponent
PPower
tTime
VVoltage
ηtotTotal efficiency of propulsion system

References

  1. Lawrence, D.A.; Mohseni, K. Efficiency Analysis for Long-Duration Electric MAVs. In Proceedings of the Infotech@Aerospace Conferences, Arlington, VA, USA, 26–29 September 2005. [CrossRef]
  2. Gur, O.; Rosen, A. Optimizing electric propulsion systems for unmanned aerial vehicles. J. Aircr. 2009, 46, 1340–1353. [Google Scholar] [CrossRef]
  3. Ostler, J.N. Flight Testing Small Electric Powered Unmanned Aerial Vehicles. Master’s Thesis, Brigham Young University, Provo, UT, USA, April 2006. [Google Scholar]
  4. Retana, E.R.; Rodrigue-Cortes, H. Basic Small Fixed Wing Aircraft Sizing Optimizing Endurance. In Proceedings of the 4th International Conference on Electrical and Electronics Engineering (ICEEE), Mexico City, Mexico, 5–7 September 2007; pp. 322–325.
  5. Anderson, J.D. Aircraft Performance, 1st ed.; McGraw Hill: Columbus, OH, USA, 1999; pp. 293–300. [Google Scholar]
  6. McCormick, B.W. Aerodynamics, Aeronautics and Flight Mechanics; Wiley: New York, NY, USA, 1995; pp. 378–385. [Google Scholar]
  7. Hale, F. Introduction to Aircraft Performance, Selection and Design; Wiley: Hoboken, NJ, USA, 1984; pp. 123–129. [Google Scholar]
  8. Traub, L.W. Range and endurance estimates for battery powered aircraft. J. Aircr. 2011, 48, 703–707. [Google Scholar] [CrossRef]
  9. Traub, L.W. Validation of endurance estimates for battery powered UAVs. Aeronaut. J. 2013, 117, 1155–1166. [Google Scholar] [CrossRef]
  10. Peukert, W. Über die Abhängigkeit der Kapazität von der Entladestromstärke bei Bleiakkumulatoren. Elektrotech. Z. 1897, 20, 287–288. (In German) [Google Scholar]
  11. Su, Y.; Liahng, H.; Wu, J. Multilevel Peukert Equations Based Residual Capacity Estimation Method for Lead-Acid Batteries. In Proceedings of the 2008 IEEE International Conference on Sustainable Energy Technologies, Singapore, 24–27 November 2008; pp. 101–105.
  12. Andrea, D. Battery Management Systems for Large Lithium Ion Battery Packs, 1st ed.; Artech House: Norwood, MA, USA, 2010. [Google Scholar]
  13. Sony. Lithium Ion Rechargeable Batteries Technical Handbook. Available online: http://www.dlnmh9ip6v2uc.cloudfront.net/datasheets/Prototyping/Lithium%20Ion%20Battery%20MSDS.pdf (accessed on 15 September 2015).
  14. Sanyo. Lithium Ion Handbook. Available online: http://www.rathboneenergy.com/articles/sanyo_lionT_E.pdf (accessed on 15 September 2015).
  15. Arora, P.; White, R.; Doyle, M. Capacity fade mechanisms and side reactions in lithium-ion batteries. J. Electrochem. Soc. 1998, 145, 3647–3667. [Google Scholar] [CrossRef]
  16. PowerStream. High Discharge Current 18650 Rechargeable Cylindrical Lithium Ion Batteries from PowerStream, Sony VTC4 and VTC5, Samsung 25R and LG HE2, Guaranteed Genuine. Available online: http://www.powerstream.com/18650-high-discharge-rate.htm (accessed on 20 September 2015).
  17. Thunder Power Extreme. Available online: http://www.thunderpowerrc.com (accessed on 20 September 2015).
  18. Smart, M.C.; Huang, C.-K.; Ratnakumar, B.V.; Surampudi, S. Development of Advanced Lithium-Ion Rechargeable Cells with Improved Low Temperature Performance. In Proceedings of the 32nd Intersociety on the Energy Conversion Engineering Conference, Honolulu, HI, USA, 27 July–1 August 1997; pp. 52–57.
  19. Chang, T.; Yu, H. Improving electric powered UAVs’ endurance by incorporating battery dumping concept. Proc. Eng. 2015, 99, 168–179. [Google Scholar] [CrossRef]
Figure 1. INR 18650 [16]: (a) constant current and (b) correlated discharge curves. n = 0.05, and C = 2500 mAh.
Batteries 02 00017 g001
Figure 2. LG18B50HE2 [16]: (a) constant current and (b) correlated discharge curves. n = 0.05, and C = 2500 mAh.
Batteries 02 00017 g002
Figure 3. Thunderpower Extreme [17]: (a) constant current and (b) correlated discharge curves. n = 0.05, and C = 5000 mAh.
Batteries 02 00017 g003
Figure 4. Jet Propulsion Laboratory (JPL)/WGL [18] lithium-ion cell discharged at −20 °C: (a) constant current and (b) correlated discharge curves. n = 0.05, and C = 500 mAh.
Batteries 02 00017 g004
Figure 5. Electrify lithium polymer (LiPo) extreme: (a) constant current; and (b) correlated discharge curves. n = 0.05, and C = 1300 mAh. (c) Comparison of prediction and experiment for 34 W discharge.
Batteries 02 00017 g005
Table 1. Initial calculations for 34 W discharge.
jij (A)Vj (V)D (mAh)t (h)
12.91411.67016.2020.0056
22.93111.60132.4980.0112

