1. Introduction
Residential battery energy storage systems (BESS) to increase the self-consumption of rooftop photovoltaic (PV) installations remain economically unfavorable for the German market under almost all conditions; considering battery prices of 2015, the savings of such systems under German market conditions commonly cannot surpass the battery investment cost within the estimated system lifetime as of now [
1,
2].
In spring 2015, Tesla Motors, Inc. (Palo Alto, CA, USA) announced the Powerwall, a BESS developed for residential PV-systems, surprising the renewable energy industry and gaining attention in the media. The technical specifications are similar to previous lithium-ion battery systems, but the announced system cost is significantly below the market prices of the time. The average retail price in the German market in the first half of 2015 was about 2,000 EUR/kWh [
3]. The price of the Powerwall in Germany was announced to be about 500 EUR/kWh [
4], reducing the specific price by a factor of four compared to previous average price for lithium-ion based systems. It, however, remained vague as to what exactly was included in the announced price.
Tesla’s CEO Elon Musk claimed during the launch event that Germany is one of the key target markets to sell their BESS [
4]. He suggests that regulations and market are favorable for the product, however, no supporting numbers were mentioned.
Rough estimations of the Powerwall's economic benefits have been undertaken for selected regions and market settings [
5,
6,
7,
8]. However, multiple influencing factors—such as battery aging and variation of parameters—have not been considered in detail. As such, these studies cannot be used to judge the system’s financial benefit for a given residential customer in Germany.
In this work, the economic benefit of a system with technical data based on Tesla’s announcements regarding the Powerwall is assessed for the German market. The aim is to give a reliable evaluation of Tesla’s Powerwall and to estimate the conditions under which the storage systems become financially favorable. The results are likewise applicable to other residential BESS with similar price and technical parameters. Tesla’s product is a mere, yet well-known, example to analyze the economics of BESS for residential PV-systems.
This paper is organized as follows:
Section 2 depicts the technical data of the analyzed BESS and the households;
Section 3 describes the simulation model;
Section 4 outlines the assumptions and scenarios investigated;
Section 5 illustrates and discusses the simulation results; and
Section 6 summarizes the findings and gives an outlook for future work.
2. Technical Data of the Powerwall and the Simulated Households
We use a proprietary power flow simulation model, implemented and run in Matlab R2015b, to assess the technical and economic outcome of a residential PV-battery system [
1]. The model is described in
Section 3. The simulation model is run with parameter sets matching typical single-family houses in Germany with a rooftop PV-system installation. Simulated PV-system size ranges from 1 kWp to 10 kWp, which is considered the most likely scenario-range for a combined installation with small scale BESS like the discussed system [
9]. PV-systems with sizes above 10 kWp operate under different economic framework conditions in Germany [
10] and are not considered in this work.
The average consumption of four- and six-person households is 4300 kWh and 4750 kWh, respectively, per year [
11]. However, households with more than average power load are found to be more likely to invest in PV-systems and BESS to reduce their dependency on the grid-electricity price [
3]. In order to cover all relevant consumption scenarios, simulations are run with a scaled annual consumption from 1000 kWh to 10,000 kWh. The in-depth analysis is conducted for two specific household configurations.
The load profile utilized for the simulation consists of 15-min-mean-values of the average of about 100 measured households in Germany over a year [
12]. Consequently, fast load variations and prolonged periods without major electricity use (for example, during holidays of individual households), are not captured. The generation profile has been measured with a sample time of one minute at a PV-system in Munich, Germany, in 2009. Both profiles are scaled to match the PV-system’s peak power and annual consumption of the household respectively.
Two models of Tesla’s Powerwall are currently promoted: a 6.4 kWh version for residential PV system integration suitable for daily cycling applications and a 10 kWh version for backup power [
4].
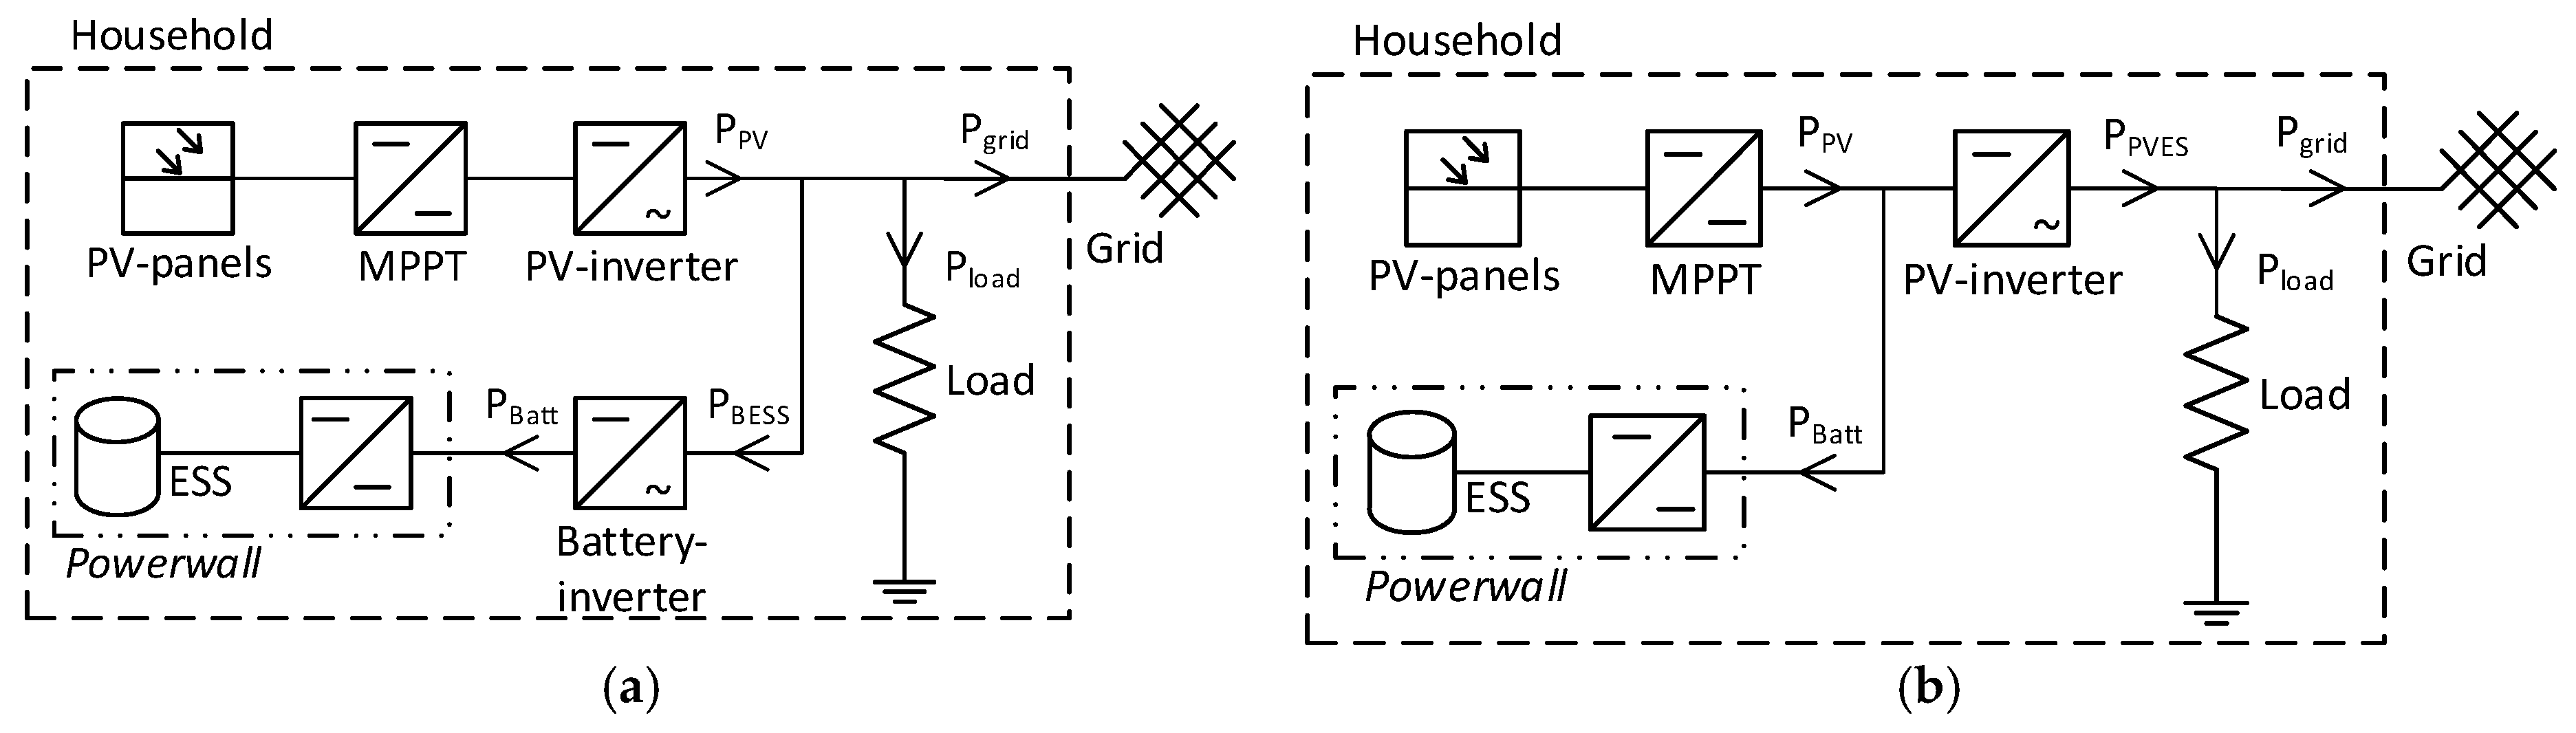
The Powerwall as it is can be connected to the AC-side of the household power system, using a separate inverter at additional cost for the battery link (
Figure 1a). It is also feasible to couple the BESS directly to the PV-system on the direct current (DC) side of the PV-inverter that converts DC into alternating current (AC) for the household’s usage (
Figure 1b) [
2]. The system simulation takes into account efficiency losses of all components depicted, according to the respective topology shown in
Figure 1.
As Tesla claims that no maintenance is required after the system is in operation, no operational costs are considered in the cost calculations throughout the storage lifetime. The battery capacity is guaranteed to retain at least 60% after 10 years [
4]. Our simulation include the battery’s capacity fade; we do, however, not consider the replacement of the battery after the warranty period in contrast to previous work [
1] to avoid additional complexity and distraction from the core results. It is important to note that a system lifetime below the assumed 20 years corrupts the achievable savings of the BESS.
3. Simulation Model and Economic Calculation
The simulation model computes the power flow between solar generation (PPV), household load (Pload), BESS (PBatt) and the public electricity grid (PGrid), considering inverter efficiency (ηinv) and battery round-trip efficiency (ηBatt) as well as the aging related capacity fade of storage. The sample time (Δt) between the simulation steps (k) is 5 min. The simulation is run for the whole regarded period to explicitly capture the effect of battery degradation on the system performance and consequently the generated savings.
The modeled system equations for AC-coupled devices are given below. The power values are calculated in watts, energies are considered in watt-seconds, the state of charge (
SOC) and efficiencies are calculated in per unit values between 0 and 1.
PBESS is the input power of the inverter.
SOC describes the state of charge of the device’s battery. Self-discharge of lithium-ion batteries typically ranges around a few percent per month [
13] and is thus neglected in our calculations. The battery energy capacity (
cBatt) does not remain constant, but continuously decreases over time because of aging effects.
The implemented “greedy” control algorithm of the BESS-model is set to store the PV-generated surplus energy and to release it, as soon as the household load exceeds the PV-system’s generation:
In case of DC-coupled systems, the equations are slightly different because of the different topology and power conversions. The power output at the PV-inverter is now labeled as
PPVES. The following equations are used for this topology:
with constraints:
The formulation of the implemented control algorithm for the DC-coupled storage system slightly changes, yet the system essentially behaves the same way:
Both models always operate within the constraints regardless of the reference values. The
SOC limits are:
The SOC limits seem optimistic, however, limiting the SOC to common values requires utilization of the unknown rated energy capacity instead of the specified usable energy capacity of 6.4 kWh. The assumptions regarding the SOC limits are very pessimistic regarding the aging of the battery.
The round-trip efficiency (η
Batt) of the Powerwall amounts to 92.5% on average [
4]. We assume that the charging and discharging efficiencies are equivalent. The inverter efficiency depends on the output power and is implemented for both coupling-topologies in the same manner:
with the following parameters:
The inverter is modeled with a power dependent efficiency curve in Euqation (16) with parameters in Euqation (17) as provided by Notton
et al. [
14]. As such, the inverter’s efficiency remains above 90% for an output power load of about 10% to 100% of the rated power. However, output power below 10% results in significantly lower efficiencies.
In this work we consider the capacity fade caused by mechanical and electro-chemical aging mechanisms, in contrast to the majority of publications about economics of energy storage systems [
15,
16,
17]. The overall system’s performance varies during the simulated operation period, as it is strongly affected by battery aging. Our battery aging model adjusts the capacity of the simulated residential BESS continuously with respect to simulation time passed and the battery’s load. Efficiency degradation is not included in the aging model. A self-developed cycle-counting approach is used to determine the stress put on the battery. This method stems from the materials science, where material-fatigue is defined as the weakening of material due to repeatedly applied mechanical stress. Experimentally gained Wöhler-curves (also referred to as S/N-curves) describe the amount of stress cycles related to the applied force onto the material, until it fails [
18].
We adapted this method to estimate cycle aging of batteries based on findings in literatures [
19,
20,
21,
22,
23,
24]. Assuming independency of calendric and cycle aging, a superposition approach to account for both simultaneous aging effects is used. Cyclization-caused degradation depends only on the inflicted stress on the battery; the aging progress itself does not influence the aging speed, hence time-dependency is neglected in the system simulation.
The depth of cycle (DOC) describes the amplitude between the peak and the minimum state of-charge within a cycle and determines the cycle-aging. The cycle-counting algorithm detects half-cycles. These are distinguished between charging, discharging, and resting periods of the batteries. The cycle-counter determines the cycles by detecting zero-crossing of the battery terminal power-flow. Every time the power-flow changes to zero, the end of a half-cycle is declared and the difference of the SOC at the beginning and at the end of the detected cycle is calculated in order to obtain the DOC.
According to a model provided by Rosenkranz
et al. [
25], smaller
DOCs lead to reduced aging when compared to large
DOCs. We scaled this model curve to attain 5000 full cycles for the battery with a capacity degradation to 80% of its initial value, as announced for the Powerwall product [
26]. The cycle aging parameters are given in
Table 1. The respective amount of equivalent full cycles for each occurring
DOC is obtained with piecewise cubic interpolation of the given parameter set.
The capacity degradation due to calendric aging (Δ
Ccal) and the degradation caused by cycling (Δ
Ccyc) depend on the time period (
tcalendric) until 20% of the capacity is diminished just by calendric aging and the amount of equivalent full cycles (
kcycle) until the battery degrades by 20% of its capacity:
For the economic calculations, all future cash flows (
CF) are discounted with a fixed interest rate (
i) to estimate the net present value (
NPV). The
NPV of the initial investment cost of the BESS (
Cinvest), electricity purchase cost (
Cenergy), feed-in remuneration (
Rremun), and subsidies (
Rsubsidy) are taken into account. The entire discounted value of the system is then compared to a PV-system without a BESS to elucidate the financial benefit (
Rsavings) of storage installation at the residential site. PV-system costs are not included, as they are equal in both cases.
The key performance indicator is the return on investment (
ROI) of the total savings’
NPV in relation to the initial investment costs of BESS. We choose a depreciation period of 20 years for BESS, equivalent to the endorsed depreciation period for PV-systems [
27], an interest rate of 4% p.a., and an inflation rate of 2% p.a., being in the same range as other publications [
28,
29,
30,
31].
5. Results and Discussion
The simulation results are presented and discussed in the following section. The reference households (
Table 3) are analyzed with regard to the influence of the parameter variants (
Table 4).
Table 5 lists the resulting self-sufficiency rates for the reference households with and without BESS. In both scenarios, the simulated BESS have remaining capacities of 56.54% and 54.69% after 20 years of operation. The reference scenario is then investigated for the entire chosen range of household consumption and PV-system size in order to outline the interrelation between the household’s parameters and the BESS’ benefit. Fading battery capacity leads to decreasing self-sufficiency by the BESS.
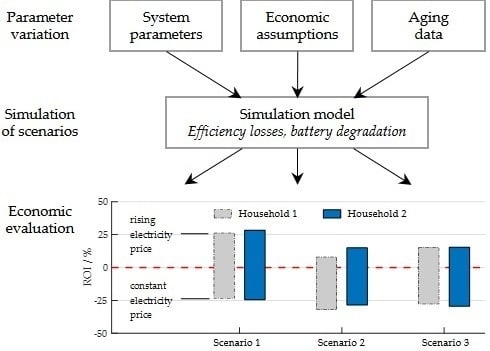
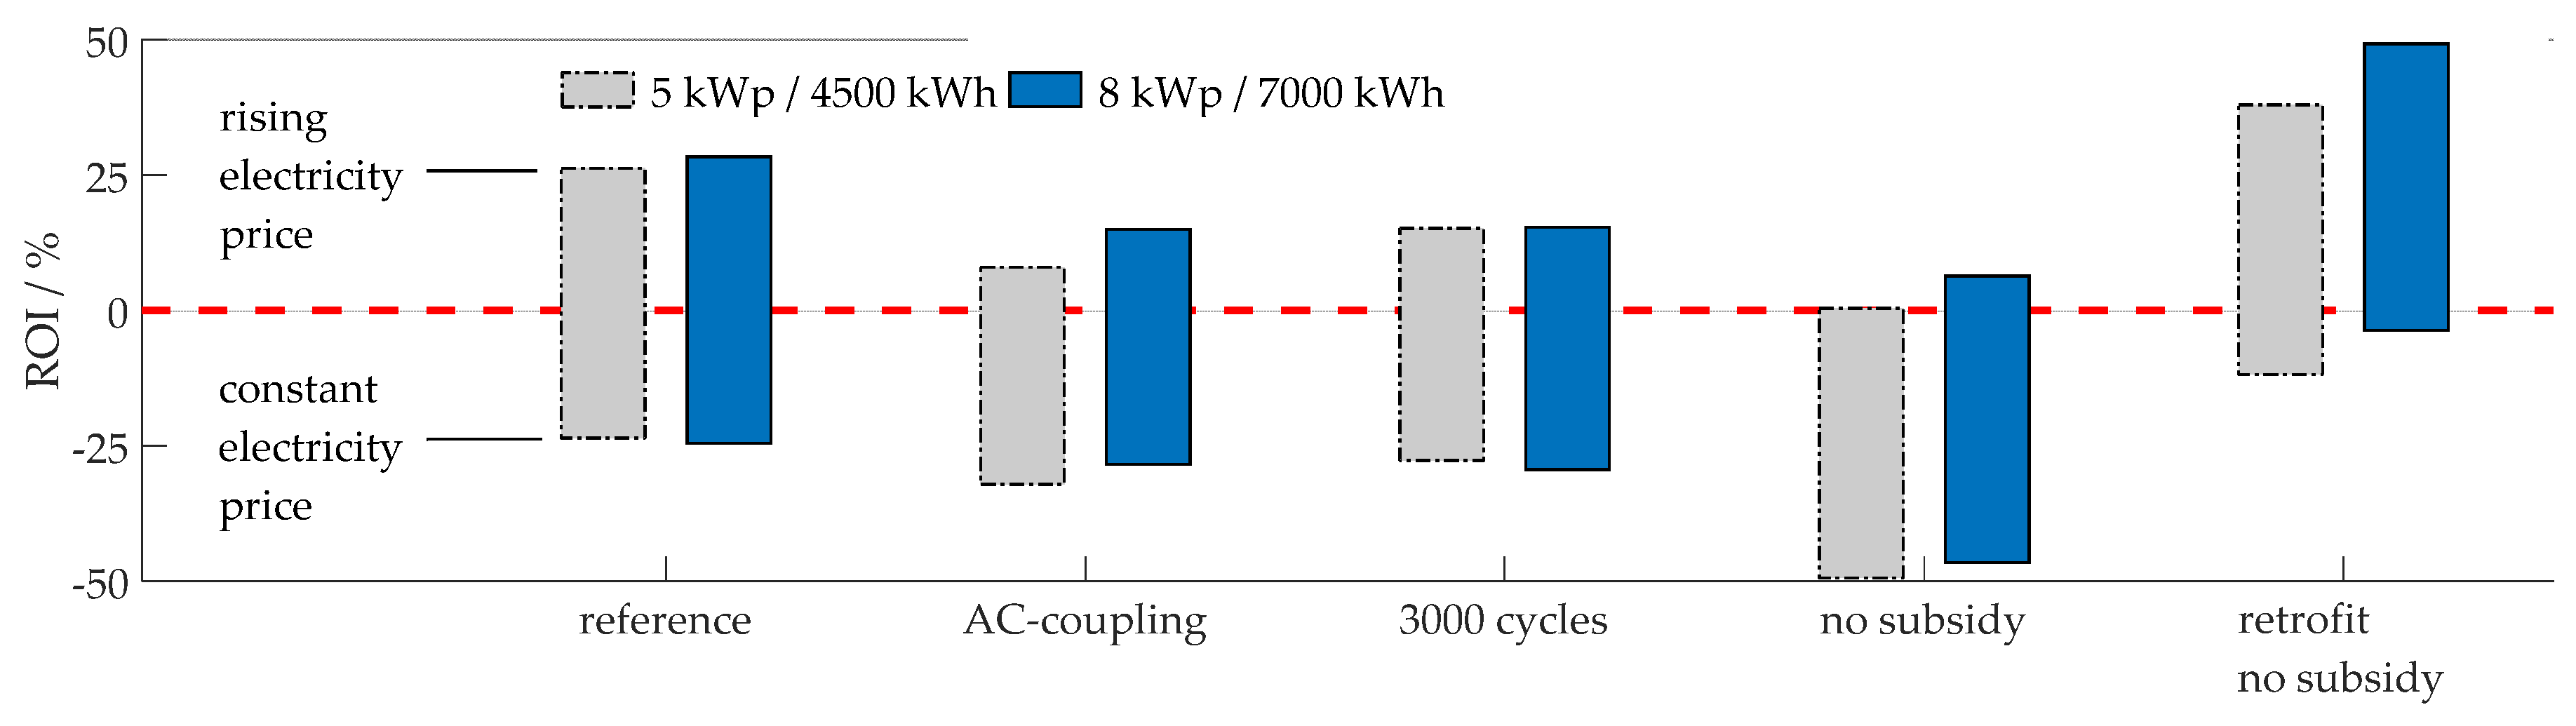
Figure 2 depicts the different parameter variants described in
Table 4. Each categorical group represents a certain parameter set. The variation from the reference scenario is named on the x-axis. The parameter sets are chosen to illustrate the impact of each sensitivity parameter on the economics. The lower ends of the bars show the
ROI for the constant electricity price scenario. The upper ends represent the
ROI assuming the rising electricity price scenario.
The gray bars on the left of each group represent the value for the average household with a load of 4500 kWh p.a. and a 5 kWp PV-system. The blue bars on the right of each group represent the large household with a load of 7000 kWh p.a. and an 8 kWp PV-system.
As shown in the figure, depending on the electricity price development in the future, the ROI achieved by the BESS in the reference scenarios range from −24% to 26% for the average household and −25% to +28% for the large household.
Each scenario in
Figure 2 shows a significant change of the
ROI compared to the reference scenario on the left. Hence every single investigated variation parameter strongly influences the probability of the BESS being able to generate a positive return within a time period of 20 years.
Choosing to purchase an additional inverter in order to AC-couple the BESS changes the ROI to ranges from −32% to +8% and from −28% to +15% for each of the two respective scenarios. Batteries that exhibit strong aging and last 3000 full cycles instead of 5000 until their capacity degrades to 80% of the initial value reduce the ROI to a spectrum of −28% to +15% and −30% to +15%, respectively, compared to the reference. The scenario where the subsidy is omitted yields a decline of the ROI to spans from −49% to 0% and from −47% to +6%, respectively. The retrofitting of a PV-system after it is excluded from the guaranteed remuneration rate in 2020 results in a ROI-improvement to ranges from −12% to +38% and from −4% to +49% respectively, presuming that they are not entitled to a subsidy. The reduced remuneration, and ultimately the spread between electricity price and remuneration rate, induce the large increase of the ROI.
5.1. Coupling of the Powerwall
Adding an additional inverter to the Powerwall in order to enable AC-coupling increases the investment cost and reduces the ROI by 4% to 18%. It may be required to add an inverter to the system in some cases; the retrofitting of existing PV-systems with a DC-coupled BESS requires costly rewiring. This is, however, not considered in our calculations, as we assume fixed installation costs for all cases.
The impact of the coupling mode for the BESS also affects the overall efficiency of the system. Charging the AC-coupled BESS with PV-produced energy requires an additional lossy conversion step compared to DC-coupled systems. The numbers in
Figure 2 show, however, that average households would suffer greater financial losses than larger households, even though they cause less energy throughput and, consequently, less conversion losses are expected. The 3.5 kW inverter in the AC-coupled system is more favorable than the 8 kW PV-inverter in the DC-coupled system in terms of energy efficiency during discharge of the BESS to meet the household’s power demand. This indicates that an additional well dimensioned inverter may improve energy efficiency of overall systems even though an additional conversion step is required. This is determined by the distribution of the discharge power.
5.2. Battery Aging
A significant influence of the battery’s cycle-aging characteristics on the overall economics of BESS can be deduced by comparison of the aging parameters shown in
Figure 2: the
ROI diminishes by 4%–13% if we assume strong aging, as smaller available capacity reduces the generated savings. A decreasing capability of the BESS has a slightly more significant effect on larger households for two reasons:
- (1)
Larger energy throughput leads to stronger degradation, resulting in greater performance loss.
- (2)
The BESS is better utilized in the larger household. Impairment of the system’s capability inherently translates into declining performance. In contrast, the daily load and daily PV-harvest of the average household is often too small to fully utilize the system. The battery is often not completely charged or discharged in the daily cycle and the deterioration affects the system’s resulting performance to a lesser extent, as it still yields sufficient capacity in most cases.
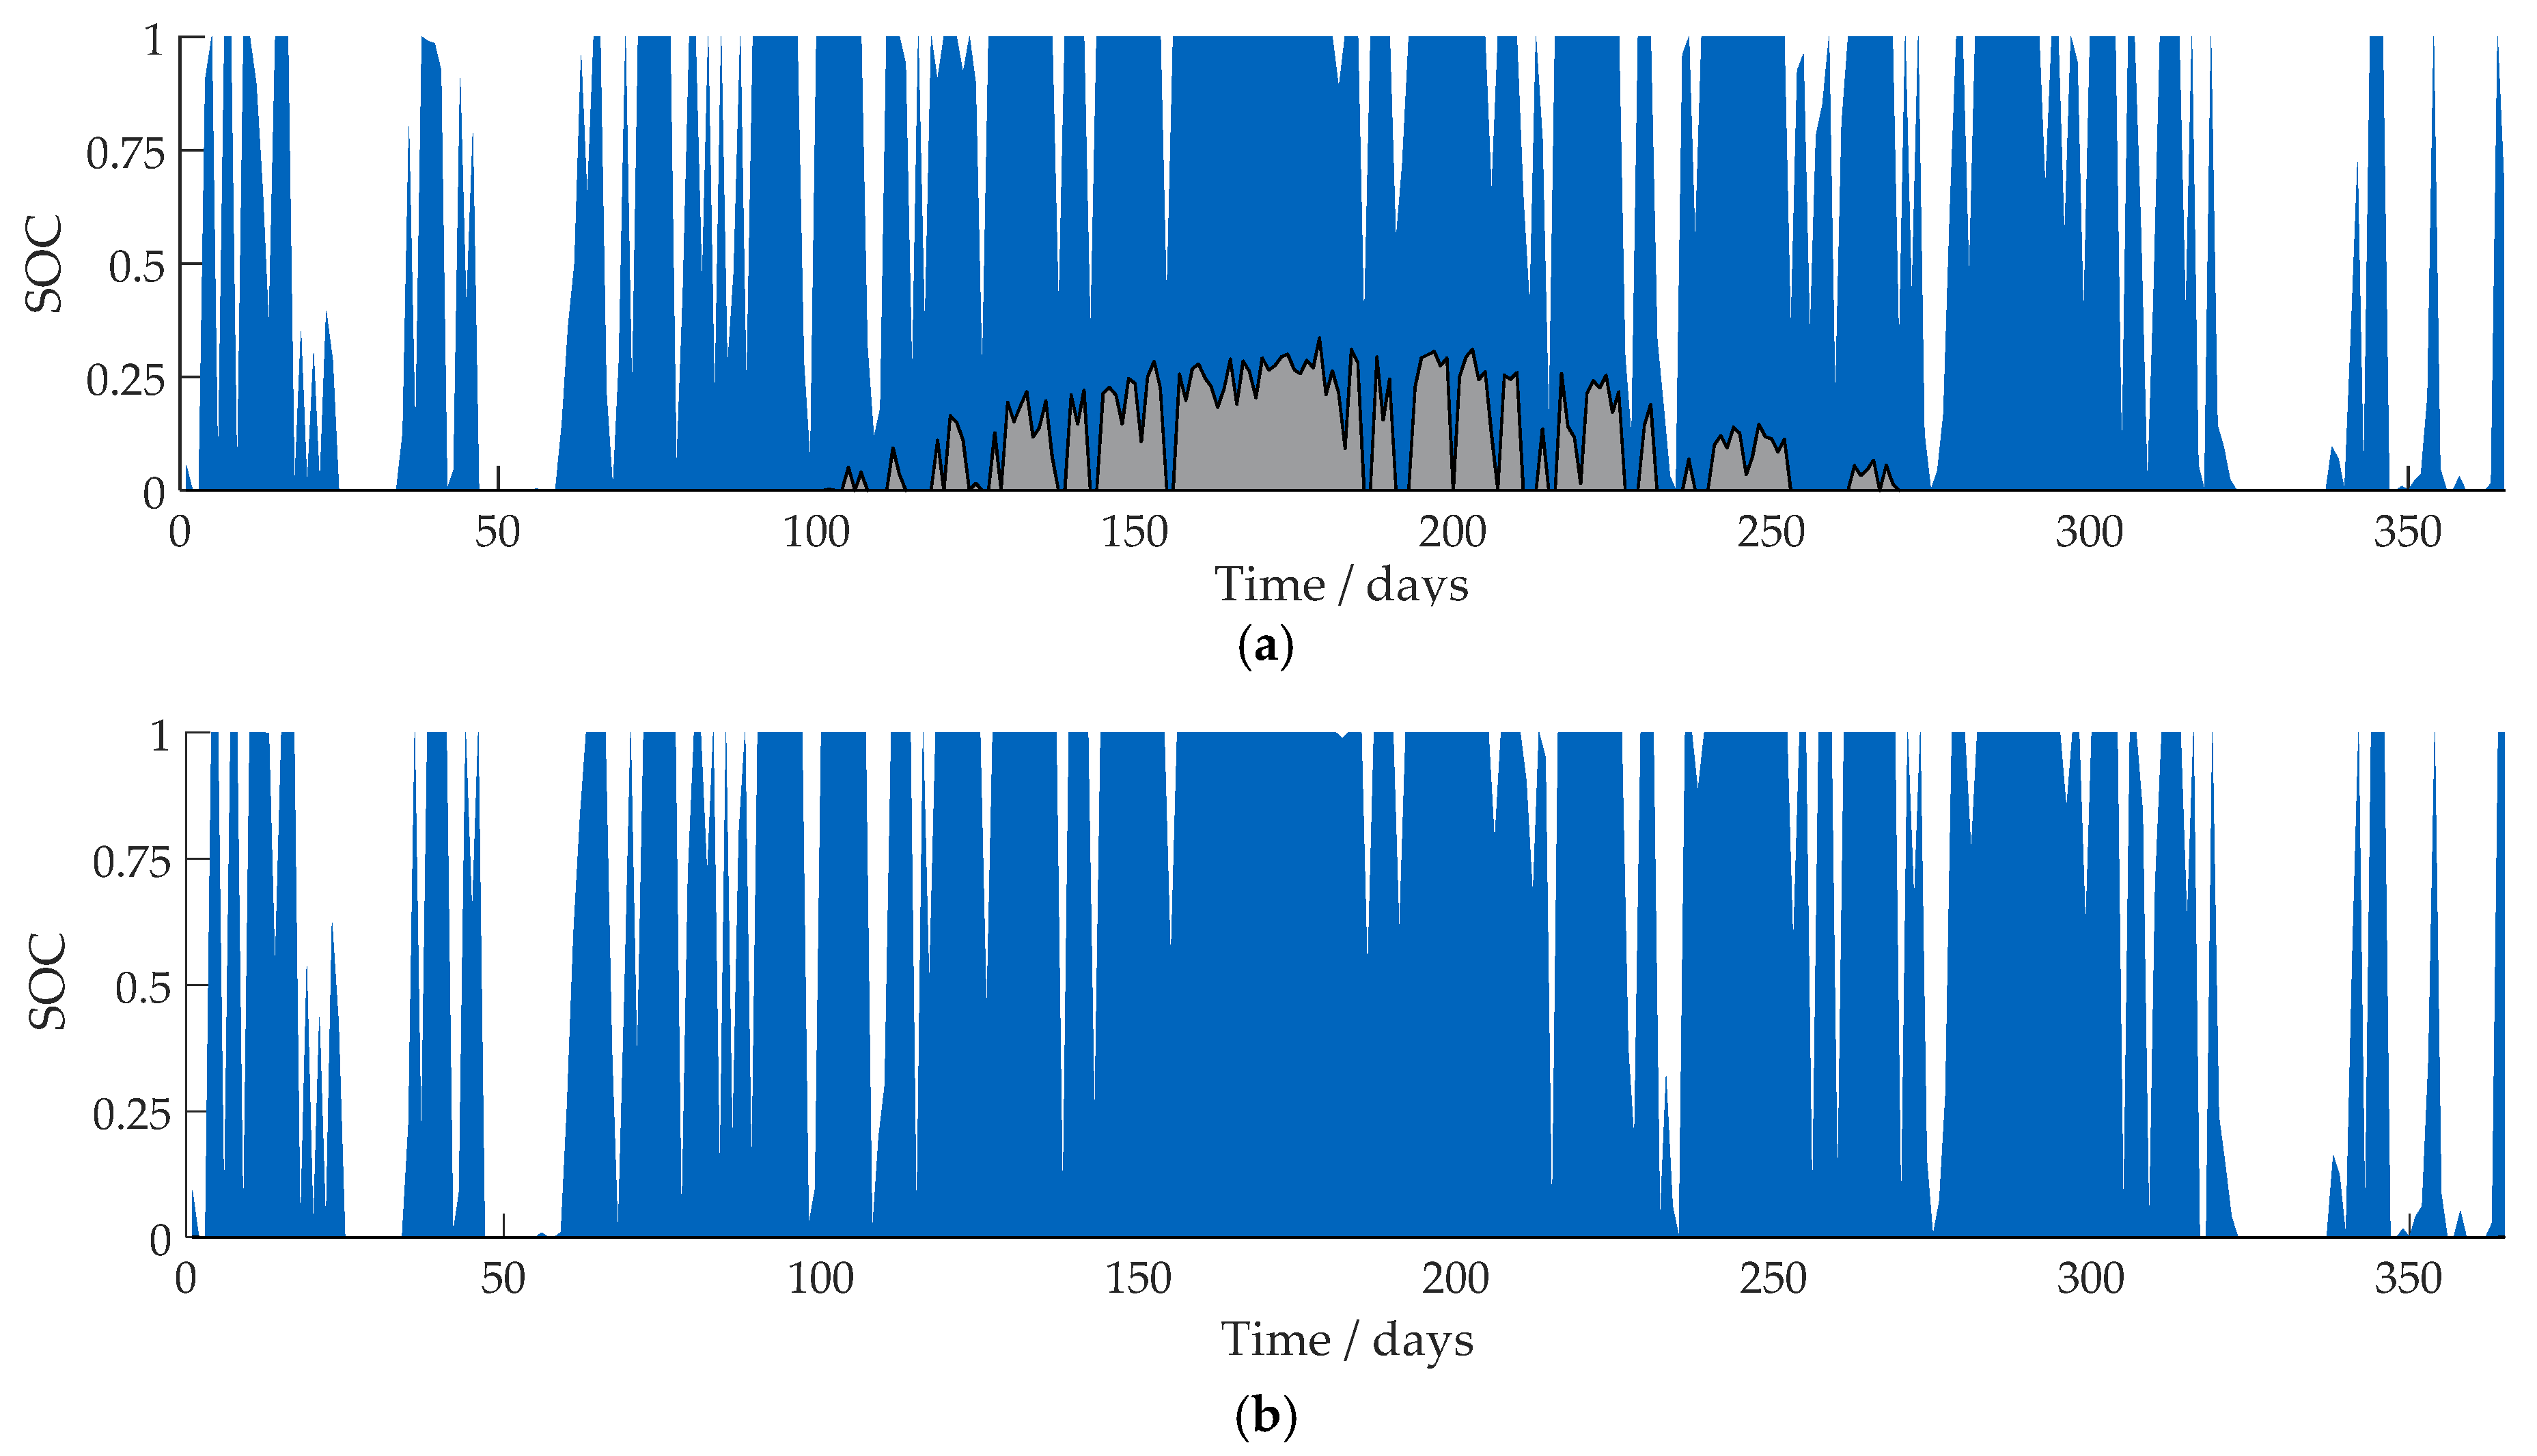
The utilization of the BESS is illustrated in
Figure 3, where the
SOC-range of the BESS is shown for a year. The blue area shows the
SOC-range of each day, the gray area at the bottom illustrates the energy content of the BESS that is not consumed within the entire day. The
average household is shown in
Figure 3a, with a significant gray area at the bottom during the summer months. The load of the average household is not sufficient to use the whole energy stored in the BESS. The system’s capability to store the energy surplus on the next day is therefore reduced. The BESS in the large household shows no gray area, meaning that the stored energy in the BESS is consumed every day (
Figure 3b).
This indicates that smaller BESS are sufficient for the average German household under the given parameters of the simulation. Weniger
et al. [
2] also found smaller BESS to be optimal. A capacity of 6.4 kWh seems to be oversized for most houses in Germany with a rooftop PV-system.
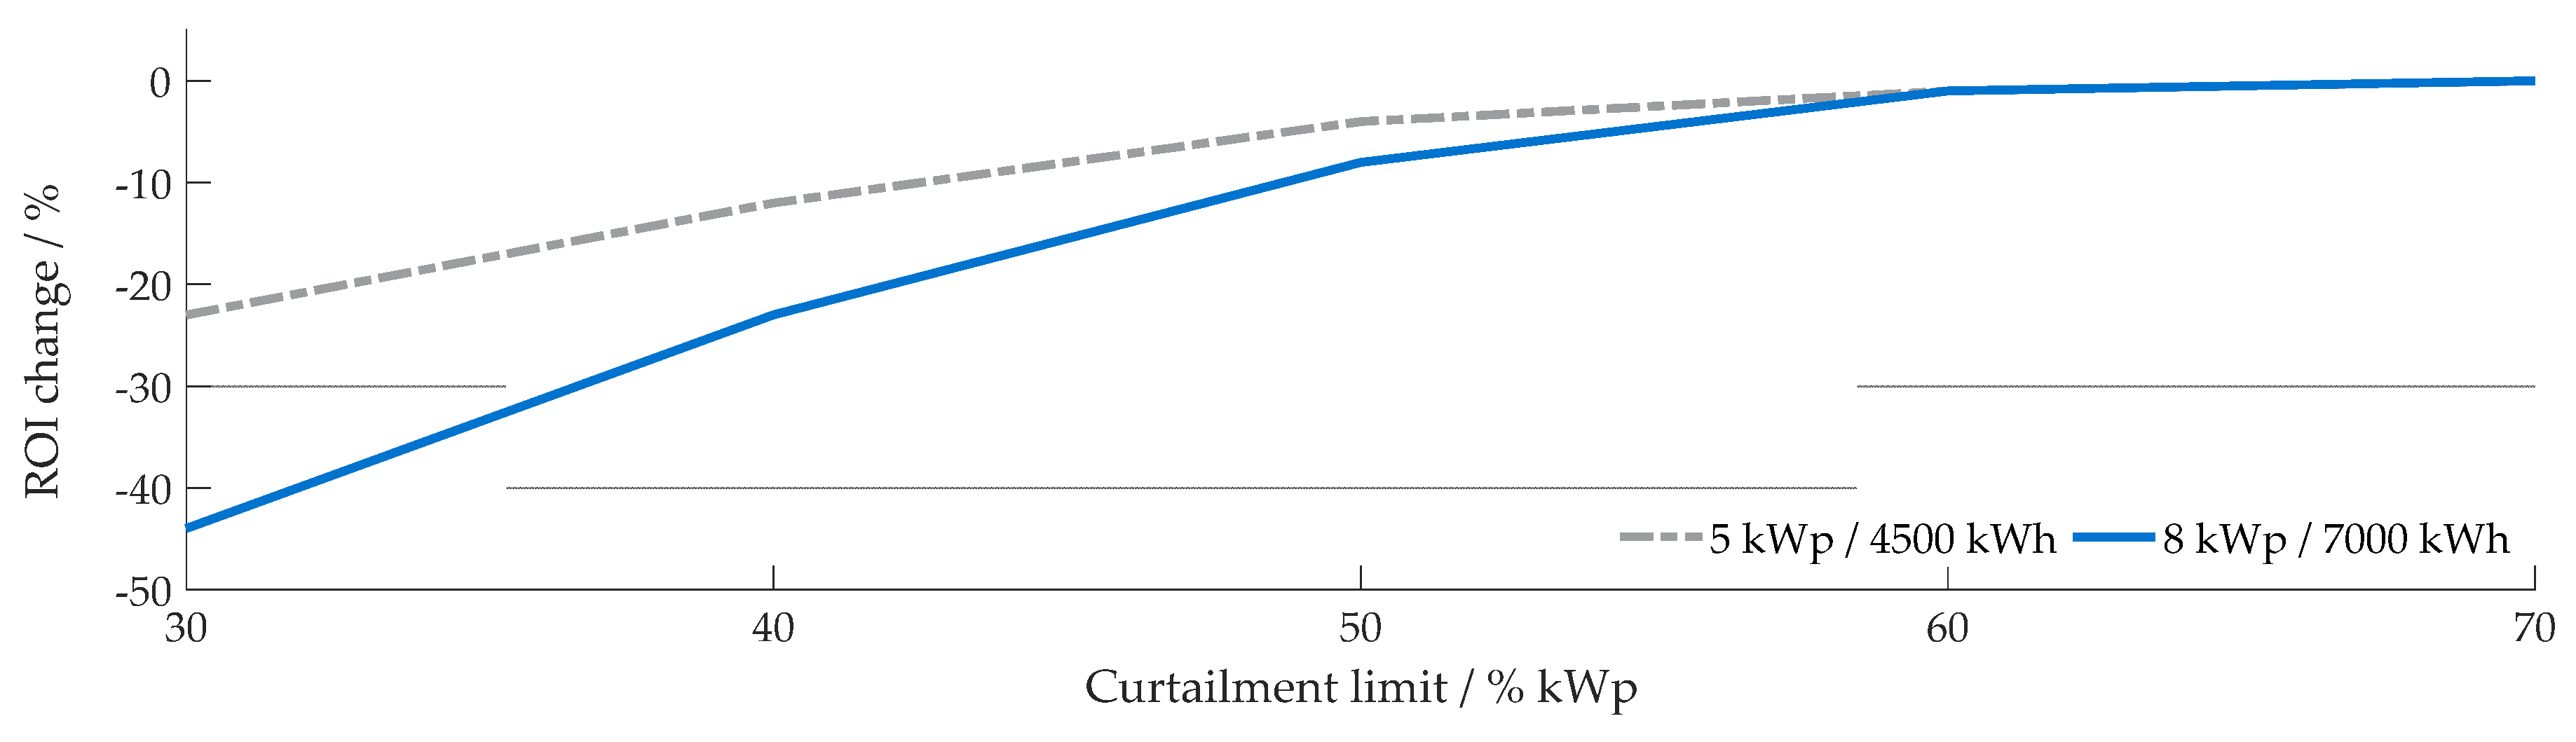
5.3. Subsidy and Curtailment Limit
Reimbursment by subsidy directly translates to an improved ROI. On the other hand, a possibly more severe PV-feed-in limit for the subsidies has a noticable, yet small influence on the ROI—we assume a 50% curtailment as being a requirement.
Lower feed-in limits cause larger waste of the PV-generated electricity.
Figure 4 shows the decrease of the
ROI due to additional curtailment losses. The added losses yield noticable impacts for lower feed-in limits.
The simulations are however conducted with a “greedy” control strategy that aims to maximize the self-consumption and does not consider the effect of power curtailment. This is evaluated for the case that only storage subsidy will introduce lower limits. If newly installed PV-systems are likewise required to lower the feed-in limit, the economic drawbacks do not solely account towards the BESS’ savings, but the overall PV-system with battery will suffer economic losses instead.
BESS are capable of reducing curtailment losses by utilizing enhanced control algorithms that preferrably store the PV-generated energy during peak periods. Their benefit for PV-systems will significantly increase in this case.
5.4. Installation Time of the Photovoltaic-System
The analysis of retrofitting existing PV-systems shows the significance of the remuneration rate on the overall economics of BESS. The discounted average gap between electricity price and remuneration rate for a PV-system installed in 2016 accounts to 13.47 ct/kWh for a constant electricity price and 26.02 ct/kWh in case of the rising electricity price scenario, over the depreciation period. The discounted average gap for retrofitted PV-systems comes to 20.94 ct/kWh and 33.49 ct/kWh, respectively. Despite no storage-subsidies taken here, the
ROI of the retrofitting scenario (PV installation in 2000, battery installation in 2020) improves by 12% in the worst case and 21% in the best case compared to our reference scenario. The heightened curtailment limit of 70% raises the
ROI only by about 2% because of the low remuneration rate in this scenario. A price drop for batteries is expected [
41], rendering the case more beneficial in the future, however we also assume the PV-system built in 2000 to be fully operational until 2040 in our calculations. Shorter life cycles of the PV-system decrease the overall savings.
Retrofitting PV-systems of newer age (installed after 2000) receive the guaranteed remuneration rate for a longer time span and will benefit less from BESS than in the discussed cases because the price gap between electricity price and remuneration is even smaller in those cases.
5.5. Impact of the Household Consumption and Photovoltaic-System Size on the Battery Energy Storage Systems’ Effectiveness
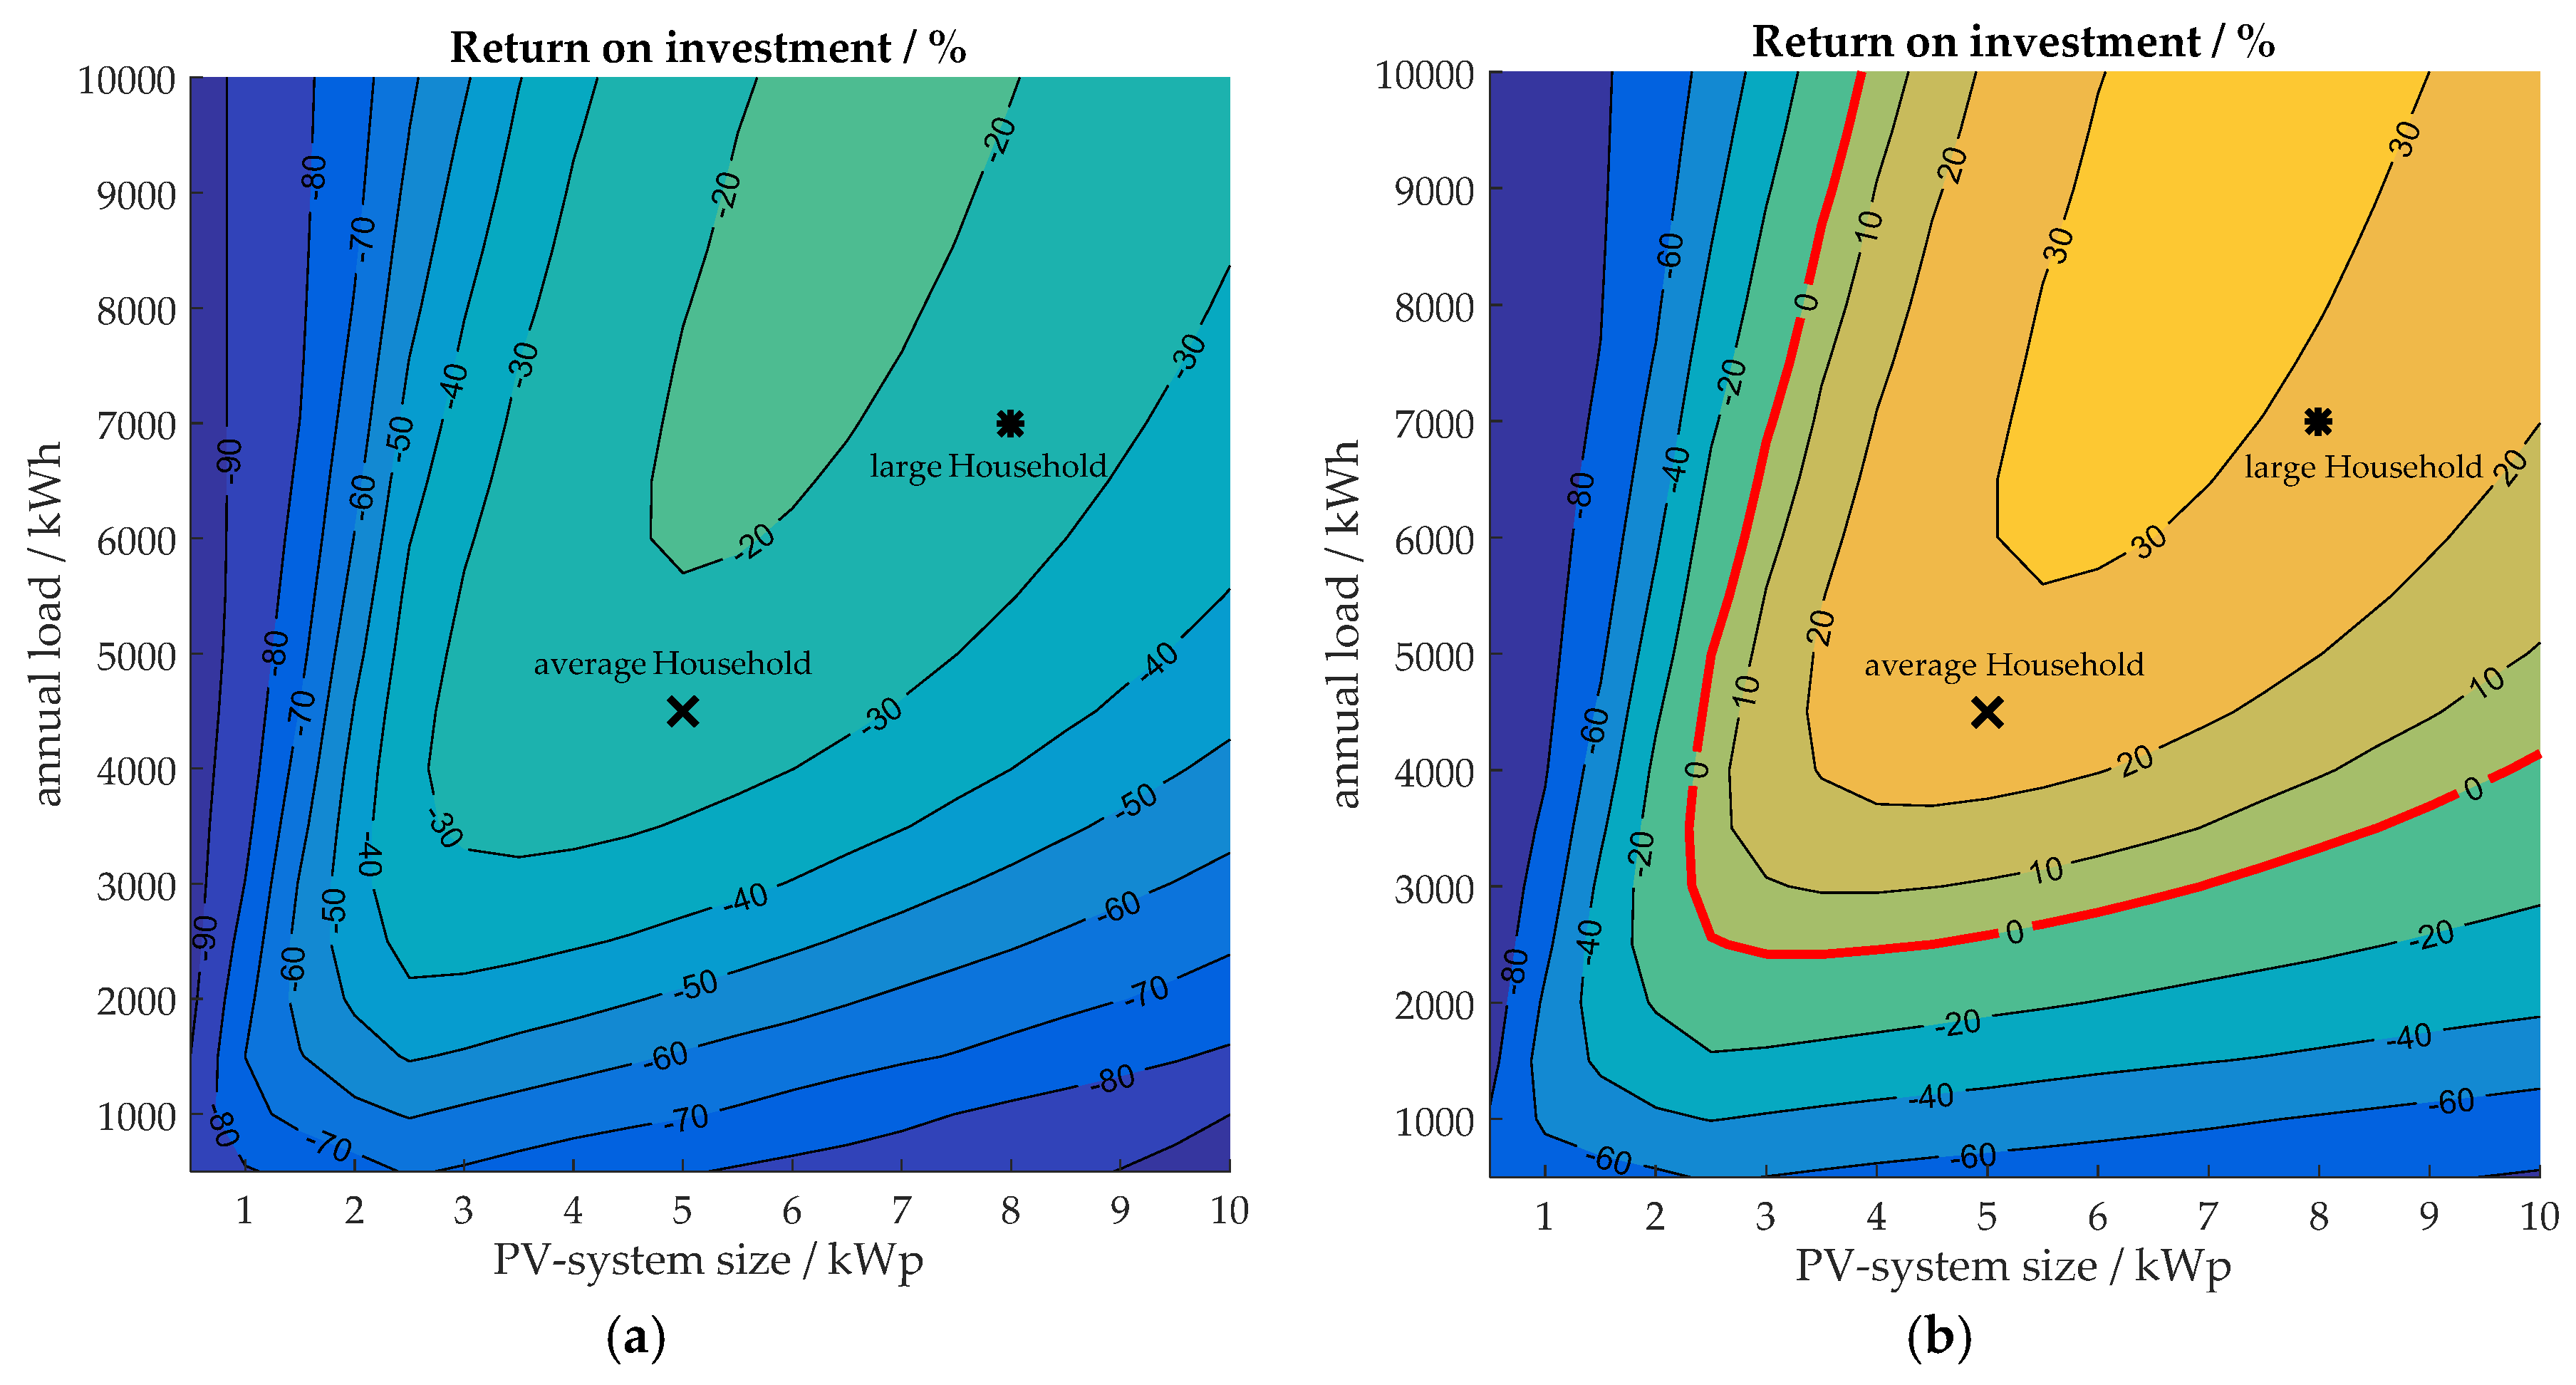
The
ROI over all simulated PV-system sizes and annual loads are shown in
Figure 5 for the reference scenario (
Table 4). The numbers in
Figure 5a are calculated assuming a constant electricity price of 28.72 ct/kWh over 20 years.
Figure 5b shows the
ROI for the rising electricity price scenario.
The ROI increases with both the PV-system size and the annual load, until saturation is reached. As the figures depict, this results in an U-shaped contour: Neither the annual load nor the PV-size directly correlate with the economics of the BESS. Instead, both variables yield matching values for the BESS to achieve the optimal ROI.
The decrease of the ROI with larger loads is consistent with our observation that the BESS-induced enhancement of the self-consumed energy decreases for larger annual loads. Larger loads allow for an augmented share of the household’s load that is directly met by the PV-produced energy instead. If the direct-consumption exceeds a certain value, the excess PV-produced energy is not sufficient to fully charge the BESS, hence the BESS is not completely utilized and appears oversized for the desired application. Smaller loads on the other hand generate situations where the energy demand does not require the entire energy stored in the BESS. In this case the BESS is not fully discharged until the next charging period and the utilization ratio of the BESS is sparse as well.
Larger PV-systems experience more curtailment losses. The storage-subsidy lowers the feed-in limit, hence the increased losses account to the cost of the BESS, reducing its ROI. Consequently, the additional curtailment losses for larger PV-units will surpass the savings generated by the BESS, given it operates with a simple “greedy” control algorithm.
In case of a constant electricity price (
Figure 5a), the cost savings generated by the BESS cannot compensate for the system’s investment cost. Hence, deploying the BESS results in financial losses, assuming the reference scenario.
In the increasing electricity price scenario (
Figure 5b), the BESS is economically favorable for households with an annual load larger than 3000 kWh and a PV-system size of at least 3 kWp. The majority of PV-systems below 10 kWp yield a capacity of 5 kWp and the average 4-person household consumes more than 4000 kWh p.a., hence the average single-family house in Germany with a rooftop solar facility gains savings by installing the Powerwall.
The development of the electricity price has a major impact on the economics of BESS. The span between the chosen scenarios of constant nominal electricity prices and of energy prices that increase by 4.55% p.a. exceeds 50% difference in the resulting ROI in some cases. The high impact and the distinct uncertainty of the future electricity price need to be taken into account for economic ratings of residential BESS in general.
6. Conclusions and Outlook
This work assesses the economic value of a residential BESS with parameters taken from Tesla’s Powerwall. We present a comprehensive comparison of different parameters’ influence on the economics of residential BESS that increase the self-consumption of home-owners. The results show no distinct trend on the possible economic benefit regarding residential BESS in the price range of Tesla’s Powerwall. The product can be an economically viable purchase now with a ROI over 25% in some of the discussed cases with a rising electricity price. These numbers further improve in future scenarios with lower remuneration rates and increasing electricity prices. However, some investigated scenarios yield a negative ROI for the Powerwall, including a large proportion of scenarios with a constant electricity price. This underlines the need to accurately analyze the situation for each installation in order to obtain a realistic economic estimation. The high impact and distinct uncertainty of future electricity prices need to be taken into account for such economic estimations as well.
6.1. Conclusions
The results are highly sensitive to factors beyond control, such as future electricity prices and household loads. However moderate assumptions, such as slightly rising electricity prices and slightly decreasing remuneration rates lead to the Powerwall being financially favorable for many households in Germany.
Each of the investigated parameters exhibits a high impact on the total economics of BESS. Varying both the electricity price and the remuneration rate underline the essential impact of the price gap between them on the economics of increasing the self-consumption. We expect further increases of the electricity price and decreases of the remuneration rate in the future, thus creating a larger gap that will further enhance the savings of residential BESS, given that the regulatory framework does not introduce additional cost factors for the operation of BESS.
The analysis regarding system coupling and the impact of subsidies emphasizes the significance of total system costs. The anticipated subsidy scheme of the KfW-Bank significantly improves the financial benefit of installing a BESS. Further subsidization and the predicted further price-decline of batteries [
41] indicate increasing benefits. Possible future taxes on self-consumption and fixed grid fees, however, worsen the economics of BESS. Assuming a constant electricity price of 28.72 ct/kWh, the average household would earn a neutral
ROI of 0% in our calculation if the purchase and installation of a BESS with the same parameters as the Powerwall amounts to 3,823 EUR in total.
The announced subsidy scheme is expected to require grid-relieving feed-in limits: electrical energy storage systems are endowed with funding, provided the grid feed-in power is limited to a certain fraction of the PV-systems peak power. We have shown that stricter limits will lead to larger energy waste in cases where simple “greedy” control algorithms are used. Residential BESS are technically capable of reducing the power peak injected into the grid and diminish curtailment losses, hence providing more grid-relief, without significantly compromising the benefits to the BESS-owner [
9]. This could lead to further financial incentives for residential BESS to do so. If stricter curtailment limits are required in the future, more advanced, predictive operation strategies that prevent curtailment losses will be necessary.
The economic value of BESS heavily depends on the load and generation profile: a large increase of self-consumption, by usage of storage, results in higher savings. Households with large PV-systems and high annual load and households with little simultaneity of load and generation are especially favorable. The results illustrate that the Powerwall, with a usable capacity of 6.4 kWh, seems to be oversized for the average German BESS-buyer. Smaller storage at a lower price might allow for an improved economic benefit for most German PV customers.
The generated savings are subject to the usable battery capacity, as the study on different battery aging parameters reveals. Narrow limits of the SOC, that effectively reduce the available energy of the storage system, interfere with the cost saving performance of BESS. This also concerns the aging characteristics of batteries.
6.2. Outlook
Aging may also lead to an efficiency reduction of batteries, however, we assume this effect has a small impact compared to capacity fade. Nevertheless, this effect should be analyzed in the future for improved preciseness. The aging behavior of batteries, in general, requires further investigation. The simulations show a capacity degradation down to 36% after 20 years for the most battery demanding household configurations of 10 kWp PV-system size and 4500 kWh load p.a. in the strong aging case.
Other publications report about severe accelerated degeneration of nickel manganese cobalt oxide (NMC) based lithium-ion batteries, after reaching a certain amount of degradation [
42]. Such long-term aging effects may disrupt the conclusions about BESS’ economics drawn in this work. Auxiliary means (such as cooling to prevent aging, hence preserving the storage’s capacity) need to be analyzed in terms of efficiency losses and compared to the heightened capacity in order to obtain economic favorable design rules for the thermal management of BESS.
The question of the optimal sizing of PV-systems and BESS remains open and needs to be studied, taking into account the factors with high impact on the economics. Not only the energy capacity of the BESS should be subject to future studies, but the sizing of the inverter and the energy efficiency of the different coupling topologies need to be analyzed. Also, the impact of different load and generation profile characteristics on the BESS-performance and the accompanying economics need to be investigated further.


 ,
, 


