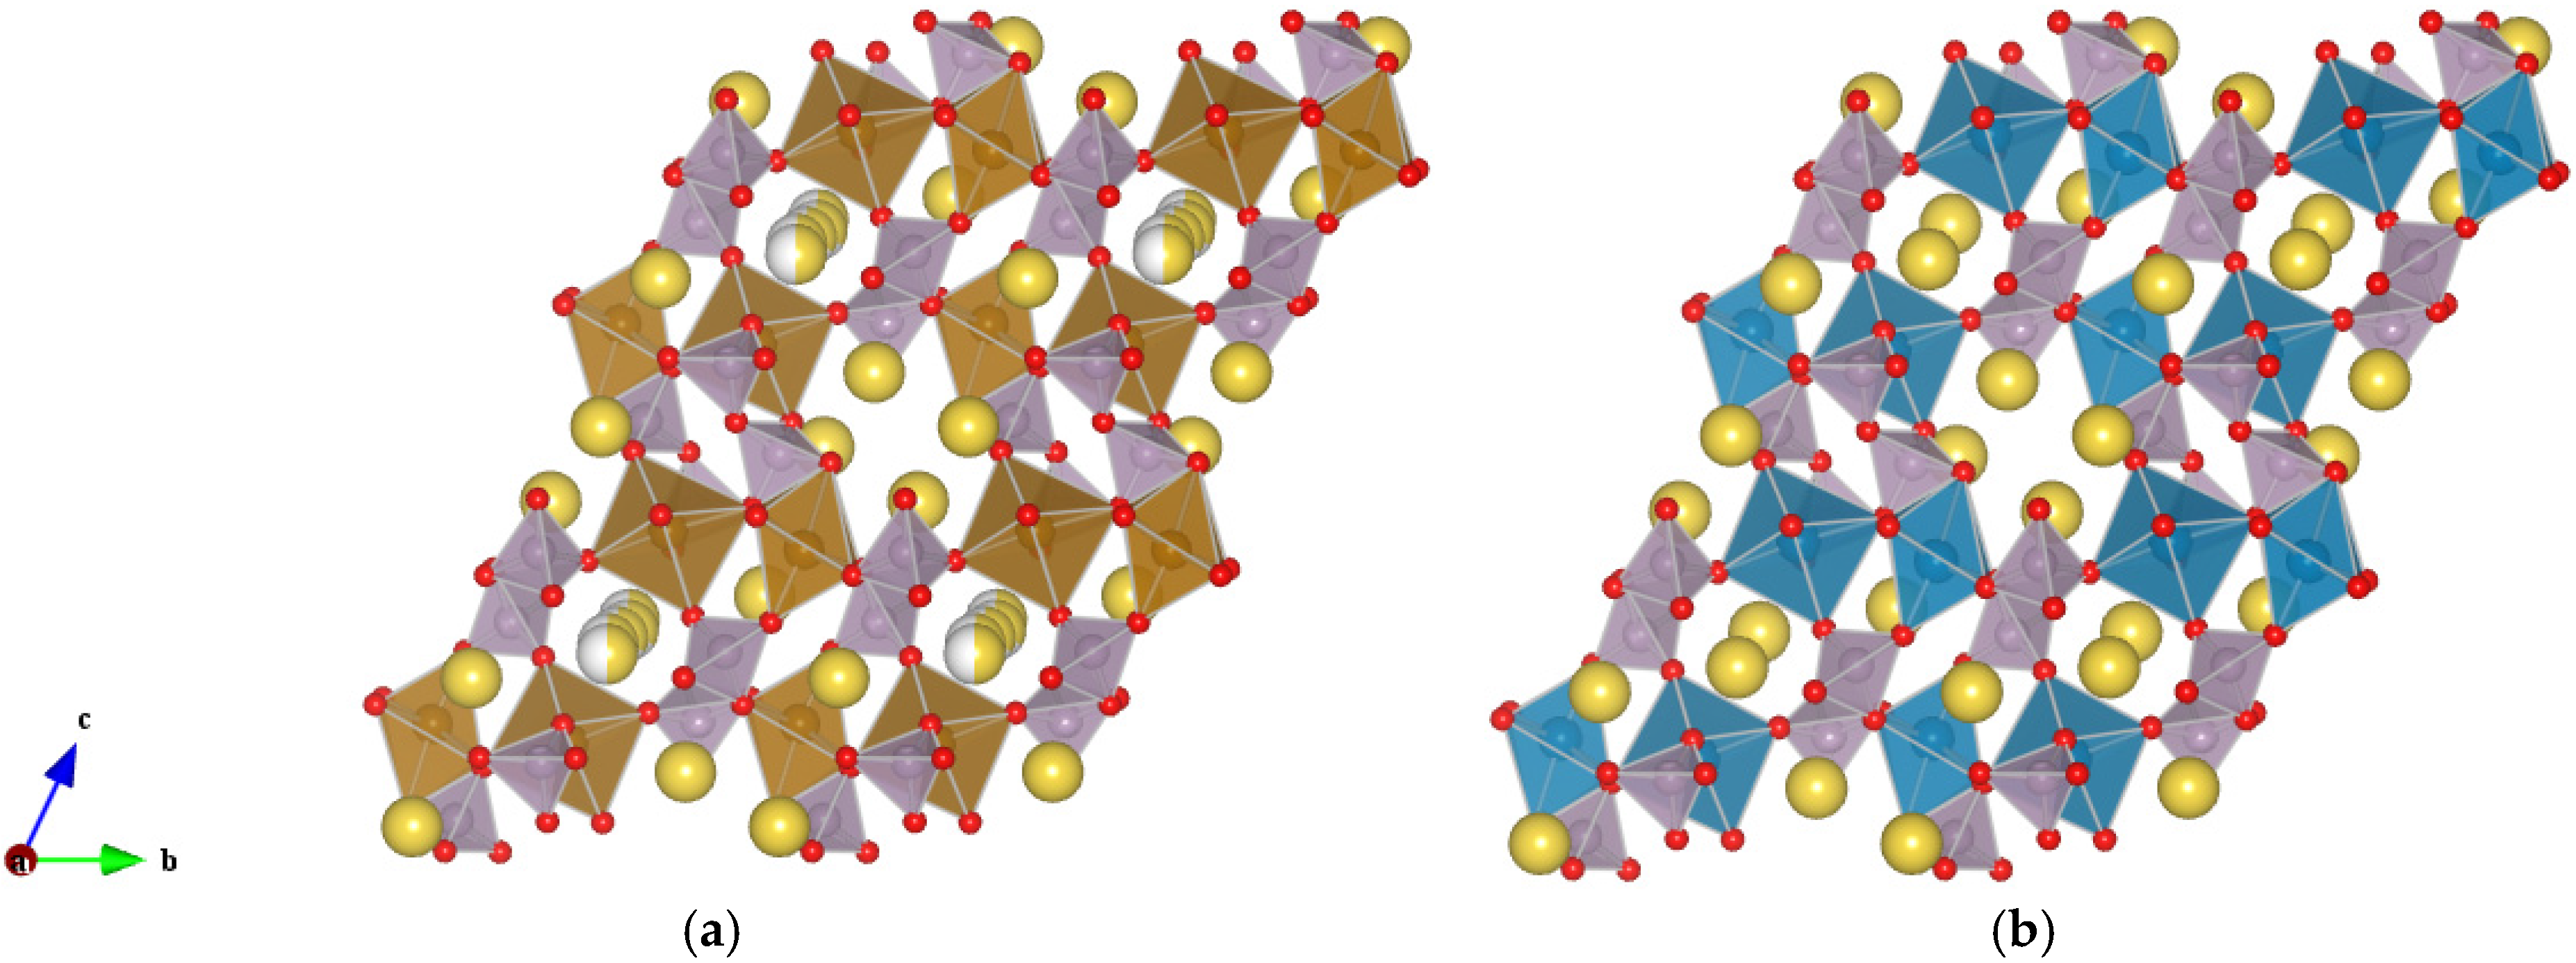
1. Introduction
The improvement in the performances of secondary batteries attracts a great deal of attention, both in the portable and stationary applications market. The technological aspects bring along an increasing demand for materials optimization in terms of faster charge/discharge and capacity retention over prolonged usage. In addition, metal ion alternatives to Li for use in room temperature rechargeable batteries are currently under intense investigation and, in this context, Na-ion battery materials, in particular cathode materials, are the subject of a growing research interest [
1,
2,
3,
4,
5,
6]. Among the cathode materials currently proposed for use in Na-ion batteries, one of the most interesting is the family of two-sodium metal pyrophosphates of the general formula Na
2MP
2O
7 (M = Co, Cu, Fe, Mn) [
7]. Such materials are known to crystallize in different polymorphic forms and, depending on the metal ion and the synthetic conditions, triclinic, monoclinic, orthorhombic or tetragonal structures have been reported [
8,
9,
10,
11]. Na
2FeP
2O
7 and Na
2MnP
2O
7 can be considered isostructural, crystallizing in the
P-1 space group at room temperature [
12]. In particular, among the possible polymorphs reported in the literature, this structure seems to be the most likely for the Na
2MnP
2O
7 composition when prepared by solid-state reaction under reducing conditions [
13]. As shown in
Figure 1, for both compounds the metal ions (Fe or Mn) occupy two crystallographic sites in the distorted octahedral environment. The (Fe,Mn)O
6 units are corner-shared and, together with P
2O
7 units, they form a three-dimensional framework with open channels, running parallel to the
a axis, where the Na ions are positioned. While the metal-polyanion framework is essentially equivalent for the two compositions, a major difference between the two compounds has been identified in the number and relative occupancy of the Na sites. In particular, in Na
2FeP
2O
7 six distinct Na sites are present, with five of them being partially occupied [
14], while in Na
2MnP
2O
7 Na sites are characterized by full occupancy [
12]. Such a structural difference may be among the causes at the basis of a different electrochemical activity for the two polymorphs.
Figure 1.
Schematic representation of the triclinic (space group P-1) (a) Na2FeP2O7 and (b) Na2MnP2O7 compounds. Partial occupancy on the Na sites is indicated by presence of two colors (yellow/grey) on the same sphere. Fe octahedra in brown, Mn octahedra in blue, and P tetrahedral in violet.
Figure 1.
Schematic representation of the triclinic (space group P-1) (a) Na2FeP2O7 and (b) Na2MnP2O7 compounds. Partial occupancy on the Na sites is indicated by presence of two colors (yellow/grey) on the same sphere. Fe octahedra in brown, Mn octahedra in blue, and P tetrahedral in violet.
The theoretical capacity of Na
2FeP
2O
7, based on the one-electron process, is 97 mAh·g
−1. Since the first reports, the electrochemical properties of Na
2FeP
2O
7 were described as highly promising, exhibiting a clear electrochemical activity in the potential range of 2–4.5 V
versus Na/Na
+ with a reversible capacity of almost 90 mAh·g
−1 at C/20 [
15,
16]. High reversible capacities of approximately 90 mAh·g
−1 were found for this composition, in combination with ionic liquid electrolytes [
17] and aqueous electrolytes [
18]. Good capacity values, just below 80 mAh·g
−1, were shown to be retained also at 1C rate [
15] and improve when carbon-based nanocomposites are prepared [
19]. The properties of Na
2MnP
2O
7 are more controversial, since either promising, approaching a reversible capacity of 80 mAh·g
−1, [
13,
20] or very limited [
12] electrochemical activity has been reported for this compound. In particular, a previous experimental study deals with the structural and magnetic characterization of the Na
2Fe
1-xMn
xP
2O
7 series of compounds. The electrochemical investigation was restricted to a slow charge/discharge rate of C/20, but the study showed that, under these conditions, the electrochemical properties of the samples within this series were dramatically affected by the Fe/Mn substitution, with the activity of pure Na
2MnP
2O
7 being barely observable [
12]. In this study we reinvestigate the Na
2Fe
1−xMn
xP
2O
7 series, presenting electrochemical data related to a charge/discharge rate up to C/5, and discuss the results in view of the morphological characteristics of these compounds.
2. Experimental Section
Powder samples of nominal composition Na2Fe1−xMnxP2O7 (x = 0, 0.25, 0.5, 0.75, 1) were prepared by solid-state reaction starting from stoichiometric mixtures of Fe(C2O4)·2H2O (Sigma-Aldrich, St. Luis, MO, USA, 99%), MnCH3COOH (Sigma-Aldrich, 99%) and NaH2PO4 (Sigma-Aldrich, 98%). The reagents we thoroughly mixed in acetone and treated at 300 °C for 3 h under steady Ar flow. After being reground and pelletized, the powers underwent a final thermal treatment at 600 °C for 6 h (heating/cooling rate 5 °C/min). In order to reach the completion of the synthesis, for the Na2MnP2O7 composition a further treatment at 700 °C for 3 h was necessary. All the thermal treatments were performed under Ar flow.
Phase purity was checked by means of X-ray powder diffraction (XRPD) measurements collected at ambient temperature through the use of a Bruker D8 Advanced powder diffractometer (Bruker, Billerica, MA, USA) operating in Bragg-Brentano geometry (Cu Kα wavelength). Data were analyzed according to the “Profile matching” procedure (Le Bail fitting) [
21] to derive cell parameters and unit cell volume using the FullProf software [
22].
Scanning electron microscope (SEM) measurements and energy dispersive microanalysis (SEM-EDS) were performed using a Zeiss EVO MA10 microscope (Zeiss, Oberkochen, Germany) coupled with an EDS detector (X-max 50 mm2).
For the electrochemical tests, the cathode slurry was prepared by mixing in a planetary milling (Fritsch, Pulverizette 7, Idar-Oberstein, Germany) for 10 min at 300 rpm the active material, carbon black (Alpha Aesar, Ward Hill, MA, USA, 99.9%) and PVdF in the ratio 70:20:10. The mixed powders were then dissolved in the minimum amount of N,N-methyl-pyrrolidone (Sigma-Aldrich, 99%) and kept under continuous stirring for 3 h. The slurry was casted onto an Al foil and heated at 100 °C for 1 h under vacuum to remove the organic solvent and subsequently cut in disks of 1 cm in diameter. Swagelok-type cells were assembled in an Ar-filled glove box using a cathode disk as working electrode, Na metal foil as counter and reference electrodes, Whatman disks as separators and NaPF6 (Sigma-Aldrich, 98%) in a 0.5 M solution of anhydrous polycarbonate (PC) as the electrolyte.
Cyclic voltammetry (CV) measurements were collected using an Autolab PGSTAT30 Echo Chemie (Metrohm Autolab, Utrecht, The Netherlands) in the range 1.5–4.0 V versus Na/Na+ at a scan rate of 0.1 mV·s−1 starting from open circuit voltage (OCV) conditions. Galvanostatic cycling tests were performed using an Arbin battery cycler (Model BT-2000, Arbin, College Station, TX, USA) in the range 1.5–4.0 V. All the cells were tested at room temperature.
3. Results and Discussion
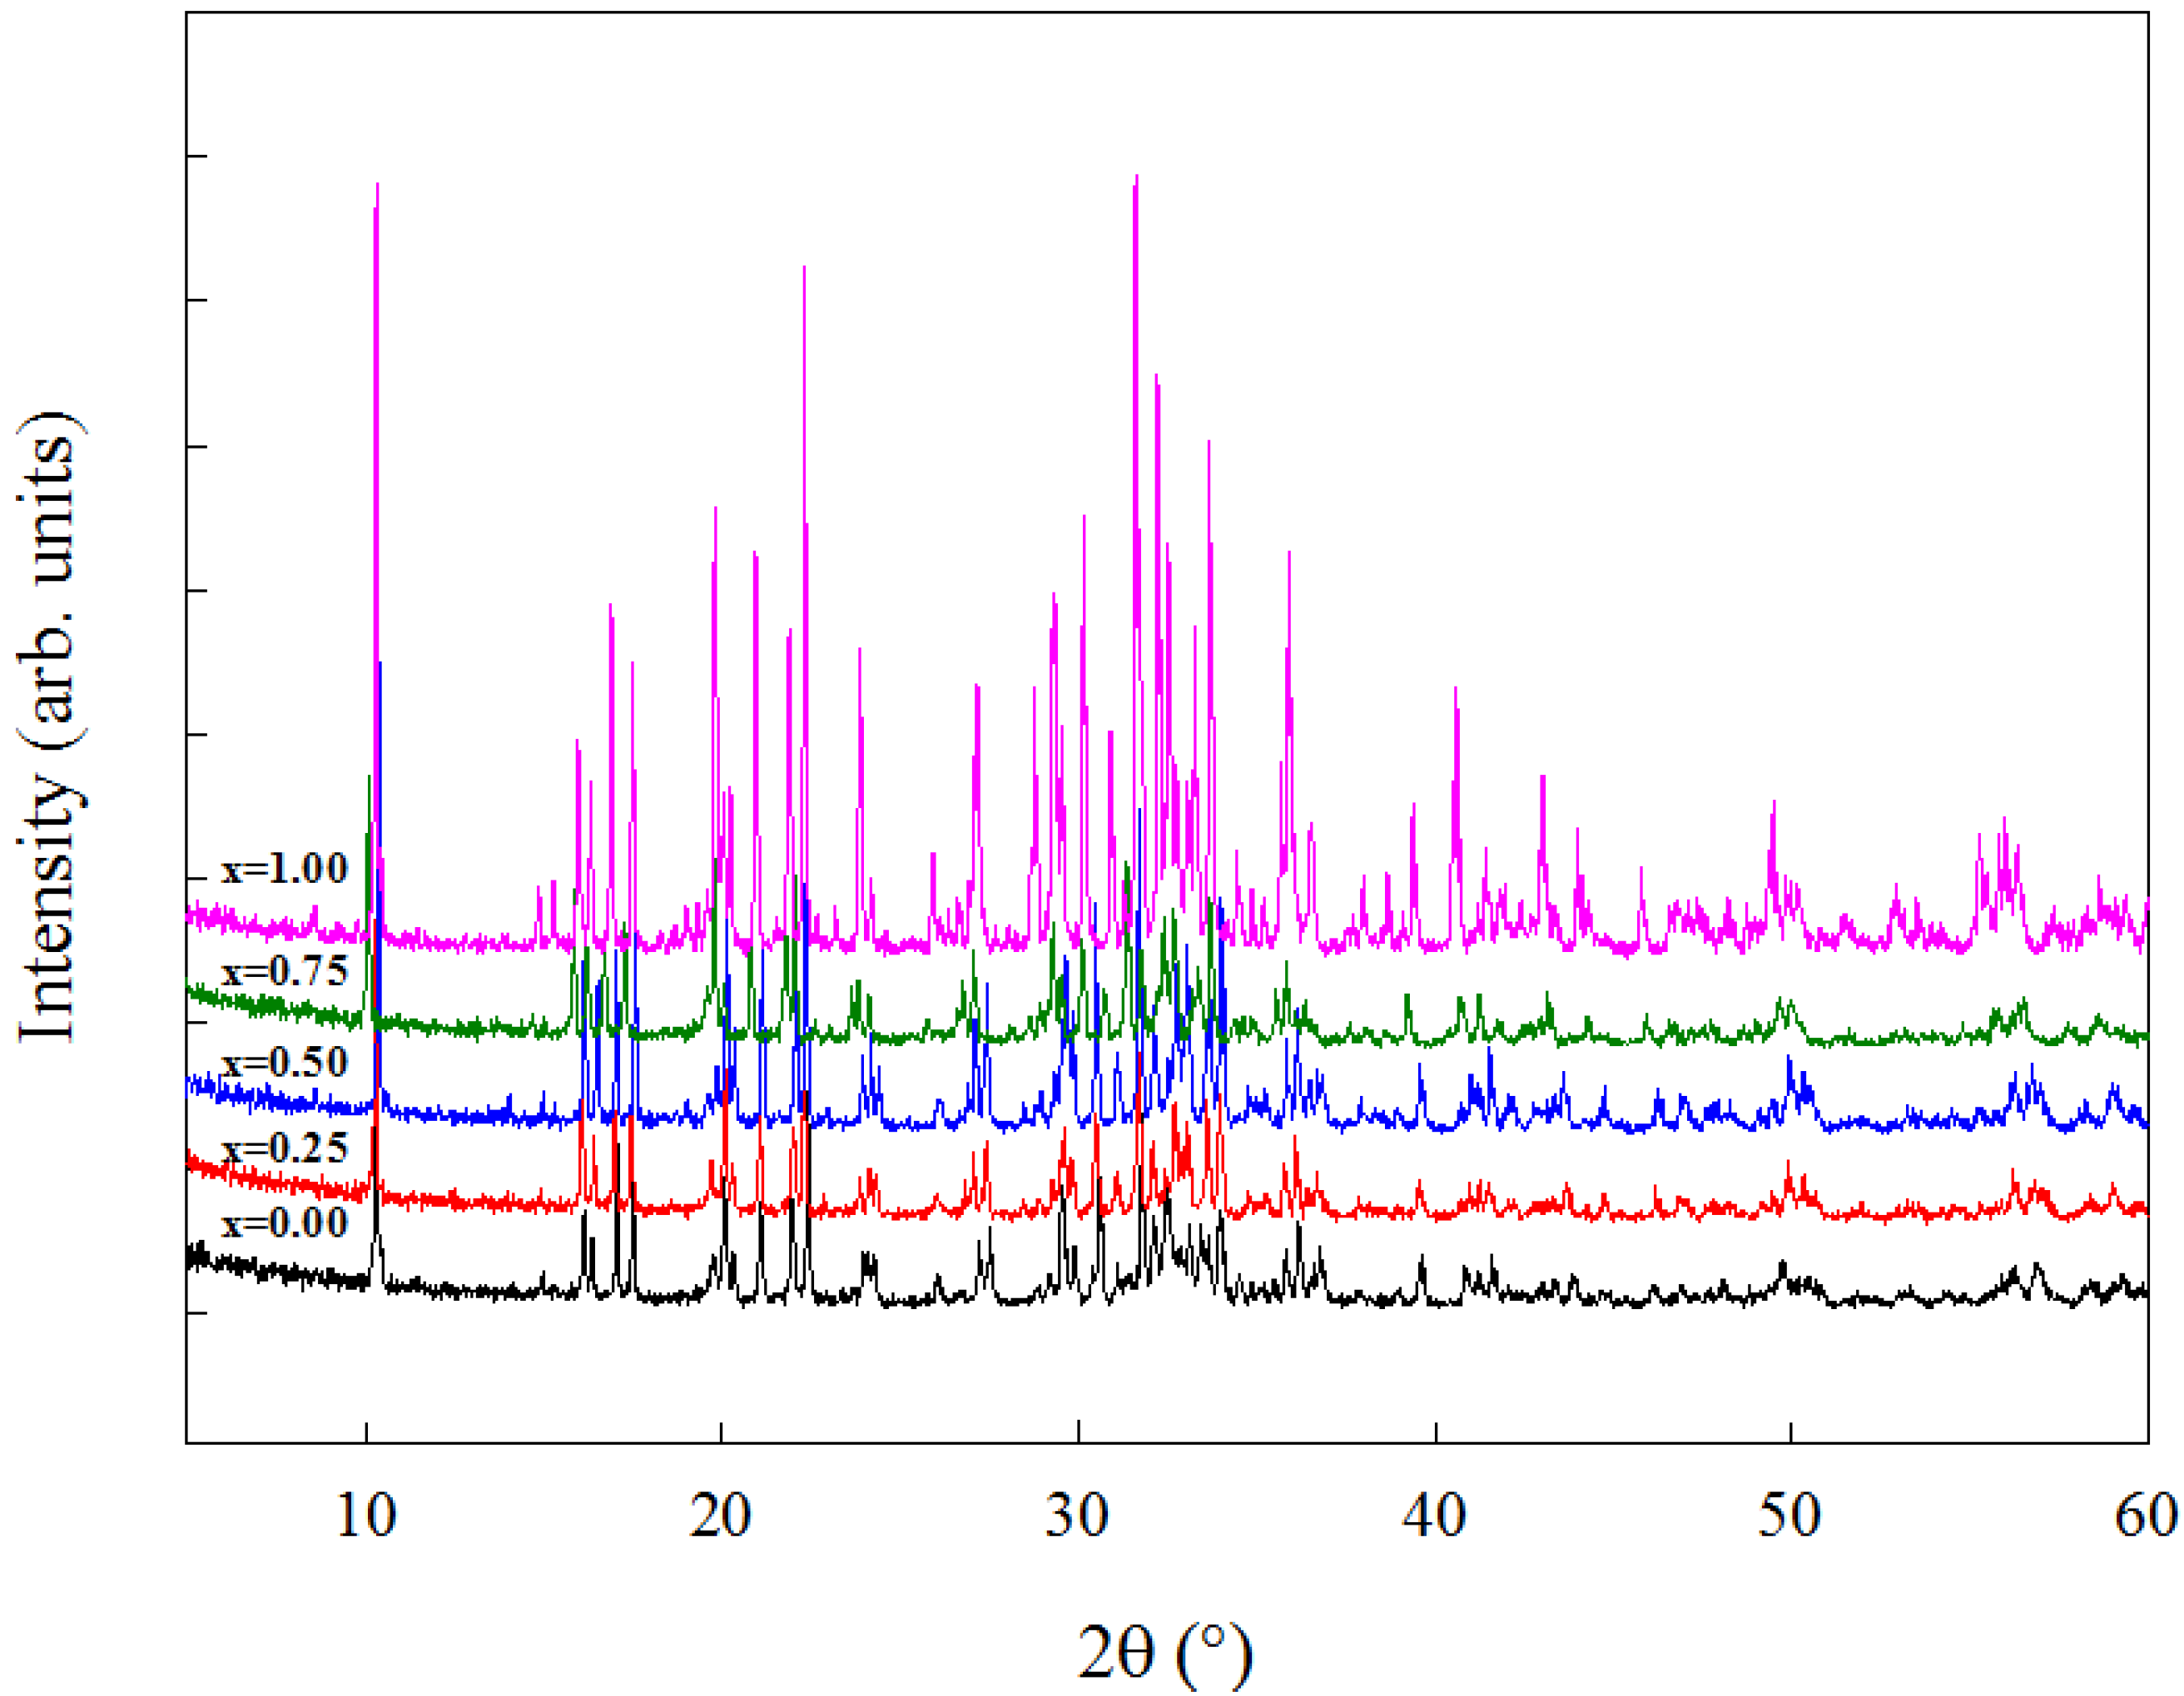
Figure 2 shows the XRPD patterns of the Na
2Fe
1−xMn
xP
2O
7 series. The diffraction patterns are in agreement with those previously reported for these compositions and they can be indexed according to the triclinic
P-1 space group [
12]. These results show that, as expected, the similarity between Fe and Mn facilitates the formation of a solid solution of nominal composition Na
2Fe
1−xMn
xP
2O
7 in the whole compositional range. As shown in the Introduction (
Figure 1), the two end-members, Na
2FeP
2O
7 and Na
2MnP
2O
7, can indeed be considered isostructural since the rigid framework constituted by (Fe,Mn)O
6 and PO
43− units is substantially equivalent, the major difference between the two compounds being identified in the number and relative occupancy of the Na sites [
12].
Figure 2.
X-ray powder diffraction (XRPD) patterns of the Na2Fe1−xMnxP2O7 series.
Figure 2.
X-ray powder diffraction (XRPD) patterns of the Na2Fe1−xMnxP2O7 series.
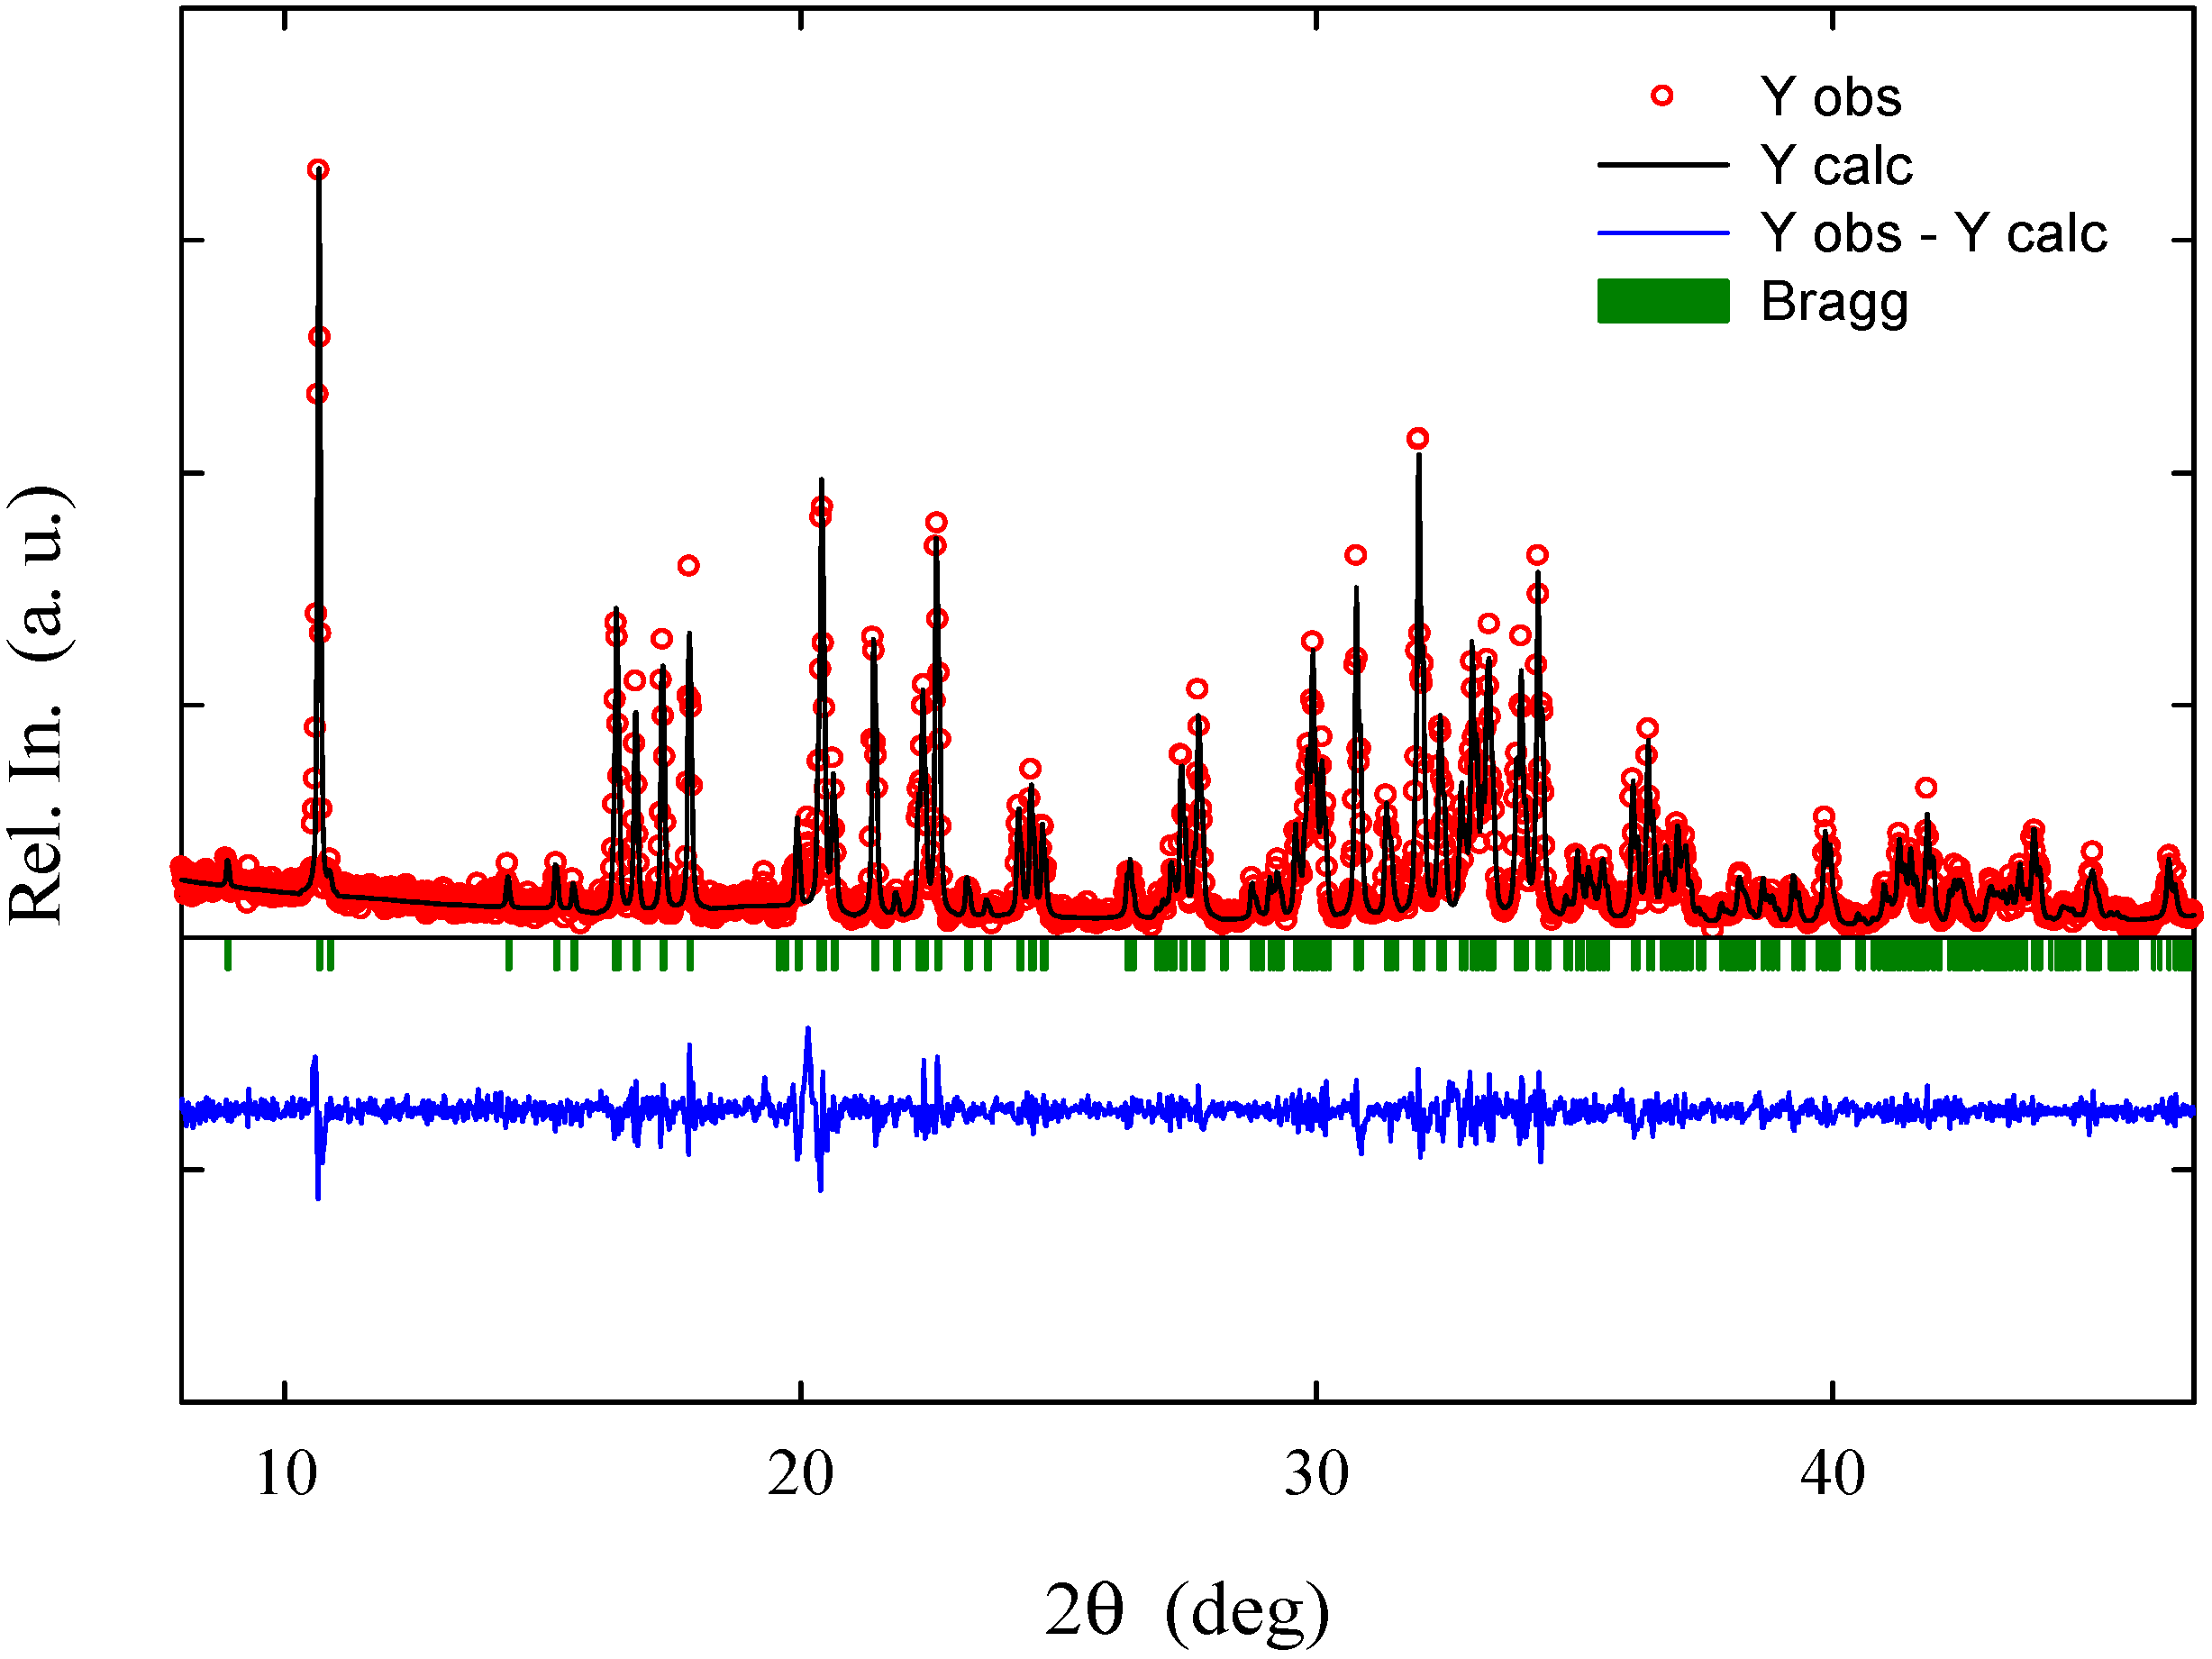
Le Bail fitting was performed on all the patterns to derive unit cell parameters and volume; an example of such refinement is presented in
Figure 3 for the Na
2Fe
0.5Mn
0.5P
2O
7 composition.
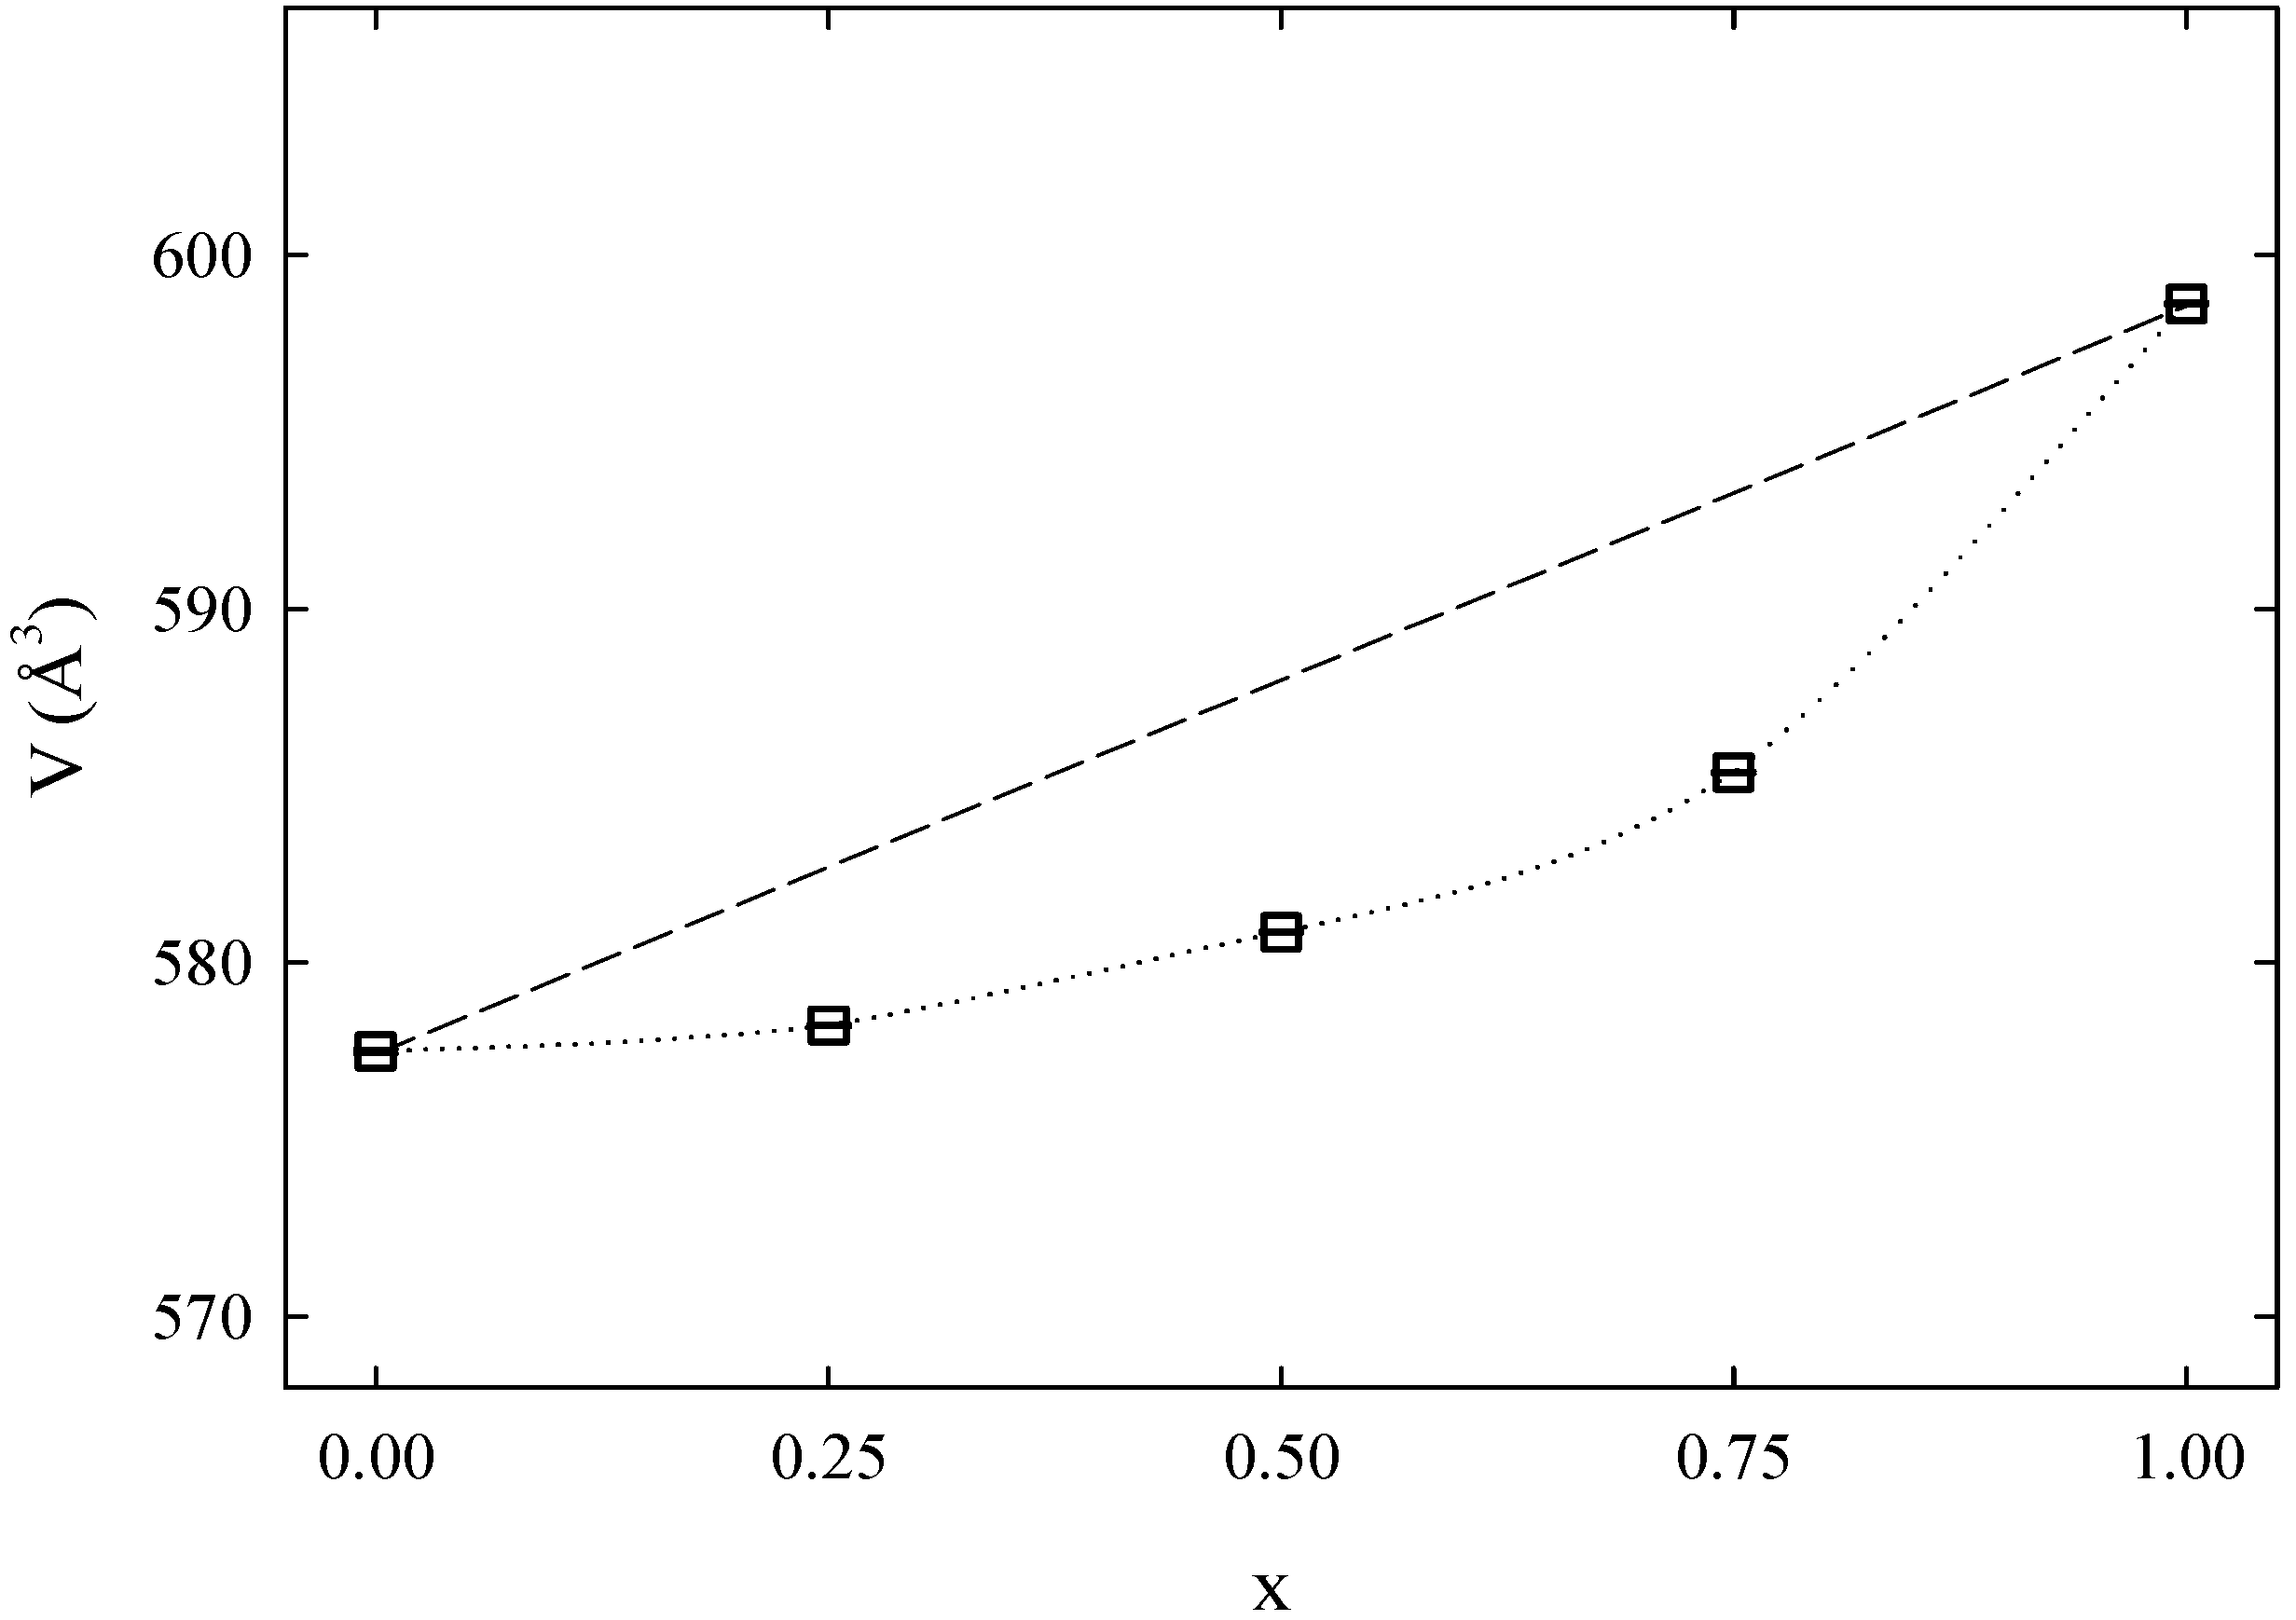
Figure 4 shows the evolution of the unit cell volume along with the composition for the Na
2Fe
1−xMn
xP
2O
7 series while in
Table 1 the cell parameters are reported. This graph is indicative of the formation of a solid solution, with negative deviation from ideal Vegard law behavior. The calculated unit cell volume for the Na
2MnP
2O
7 end-member is in excellent agreement with values previously reported for this structure and composition [
12,
13]. The value obtained for the Na
2FeP
2O
7 end-member is in line with previous reports [
12,
14,
17,
18]. It should be recognized that a certain spread in volume parameters is observed in the literature for the Fe-based end-member, with values ranging from 570.66 Å
3 [
18] to 581.44 Å
3 [
14]. Variation in the unit cell volume for the same nominal composition may be indicative of the slight deviation from such nominal composition, in particular with regard to the exact Na content, which could be related to differences in synthetic procedure.
Figure 3.
Example of LeBail fitting of the XRPD pattern of the Na2Fe0.5Mn0.5P2O7 sample (χ2: 1.55).
Figure 3.
Example of LeBail fitting of the XRPD pattern of the Na2Fe0.5Mn0.5P2O7 sample (χ2: 1.55).
Figure 4.
Unit cell volume as a function of x for the Na2Fe1−xMnxP2O7 series. Lines are guides for the eyes only. Standard deviations are within the size of the symbol.
Figure 4.
Unit cell volume as a function of x for the Na2Fe1−xMnxP2O7 series. Lines are guides for the eyes only. Standard deviations are within the size of the symbol.
Table 1.
Cell parameters obtained from LeBail fitting of XRPD data for the NaFe1−xMnxP2O7 series.
Table 1.
Cell parameters obtained from LeBail fitting of XRPD data for the NaFe1−xMnxP2O7 series.
| x | a/Å | b/Å | c/Å | α/deg. | β/deg. | γ/deg. | V/Å3 |
|---|
| 0 | 6.4431 (4) | 9.4445 (6) | 11.0014 (7) | 64.639 (3) | 85.689 (4) | 72.978 (4) | 577.46 (6) |
| 0.25 | 6.4655 (1) | 9.4550 (5) | 11.0114 (4) | 64.581 (4) | 85.692 (6) | 72.530 (3) | 578.23 (7) |
| 0.5 | 6.4824 (2) | 9.4573 (3) | 11.0545 (3) | 64.207 (1) | 85.458 (2) | 72.749 (2) | 580.86 (3) |
| 0.75 | 6.5042 (3) | 9.4676 (4) | 11.0752 (5) | 64.114 (2) | 85.374 (3) | 72.931 (3) | 585.38 (4) |
| 1 | 6.5608 (3) | 9.5304 (2) | 11.0964 (6) | 64.101 (3) | 85.699 (4) | 73.329 (5) | 598.13 (5) |
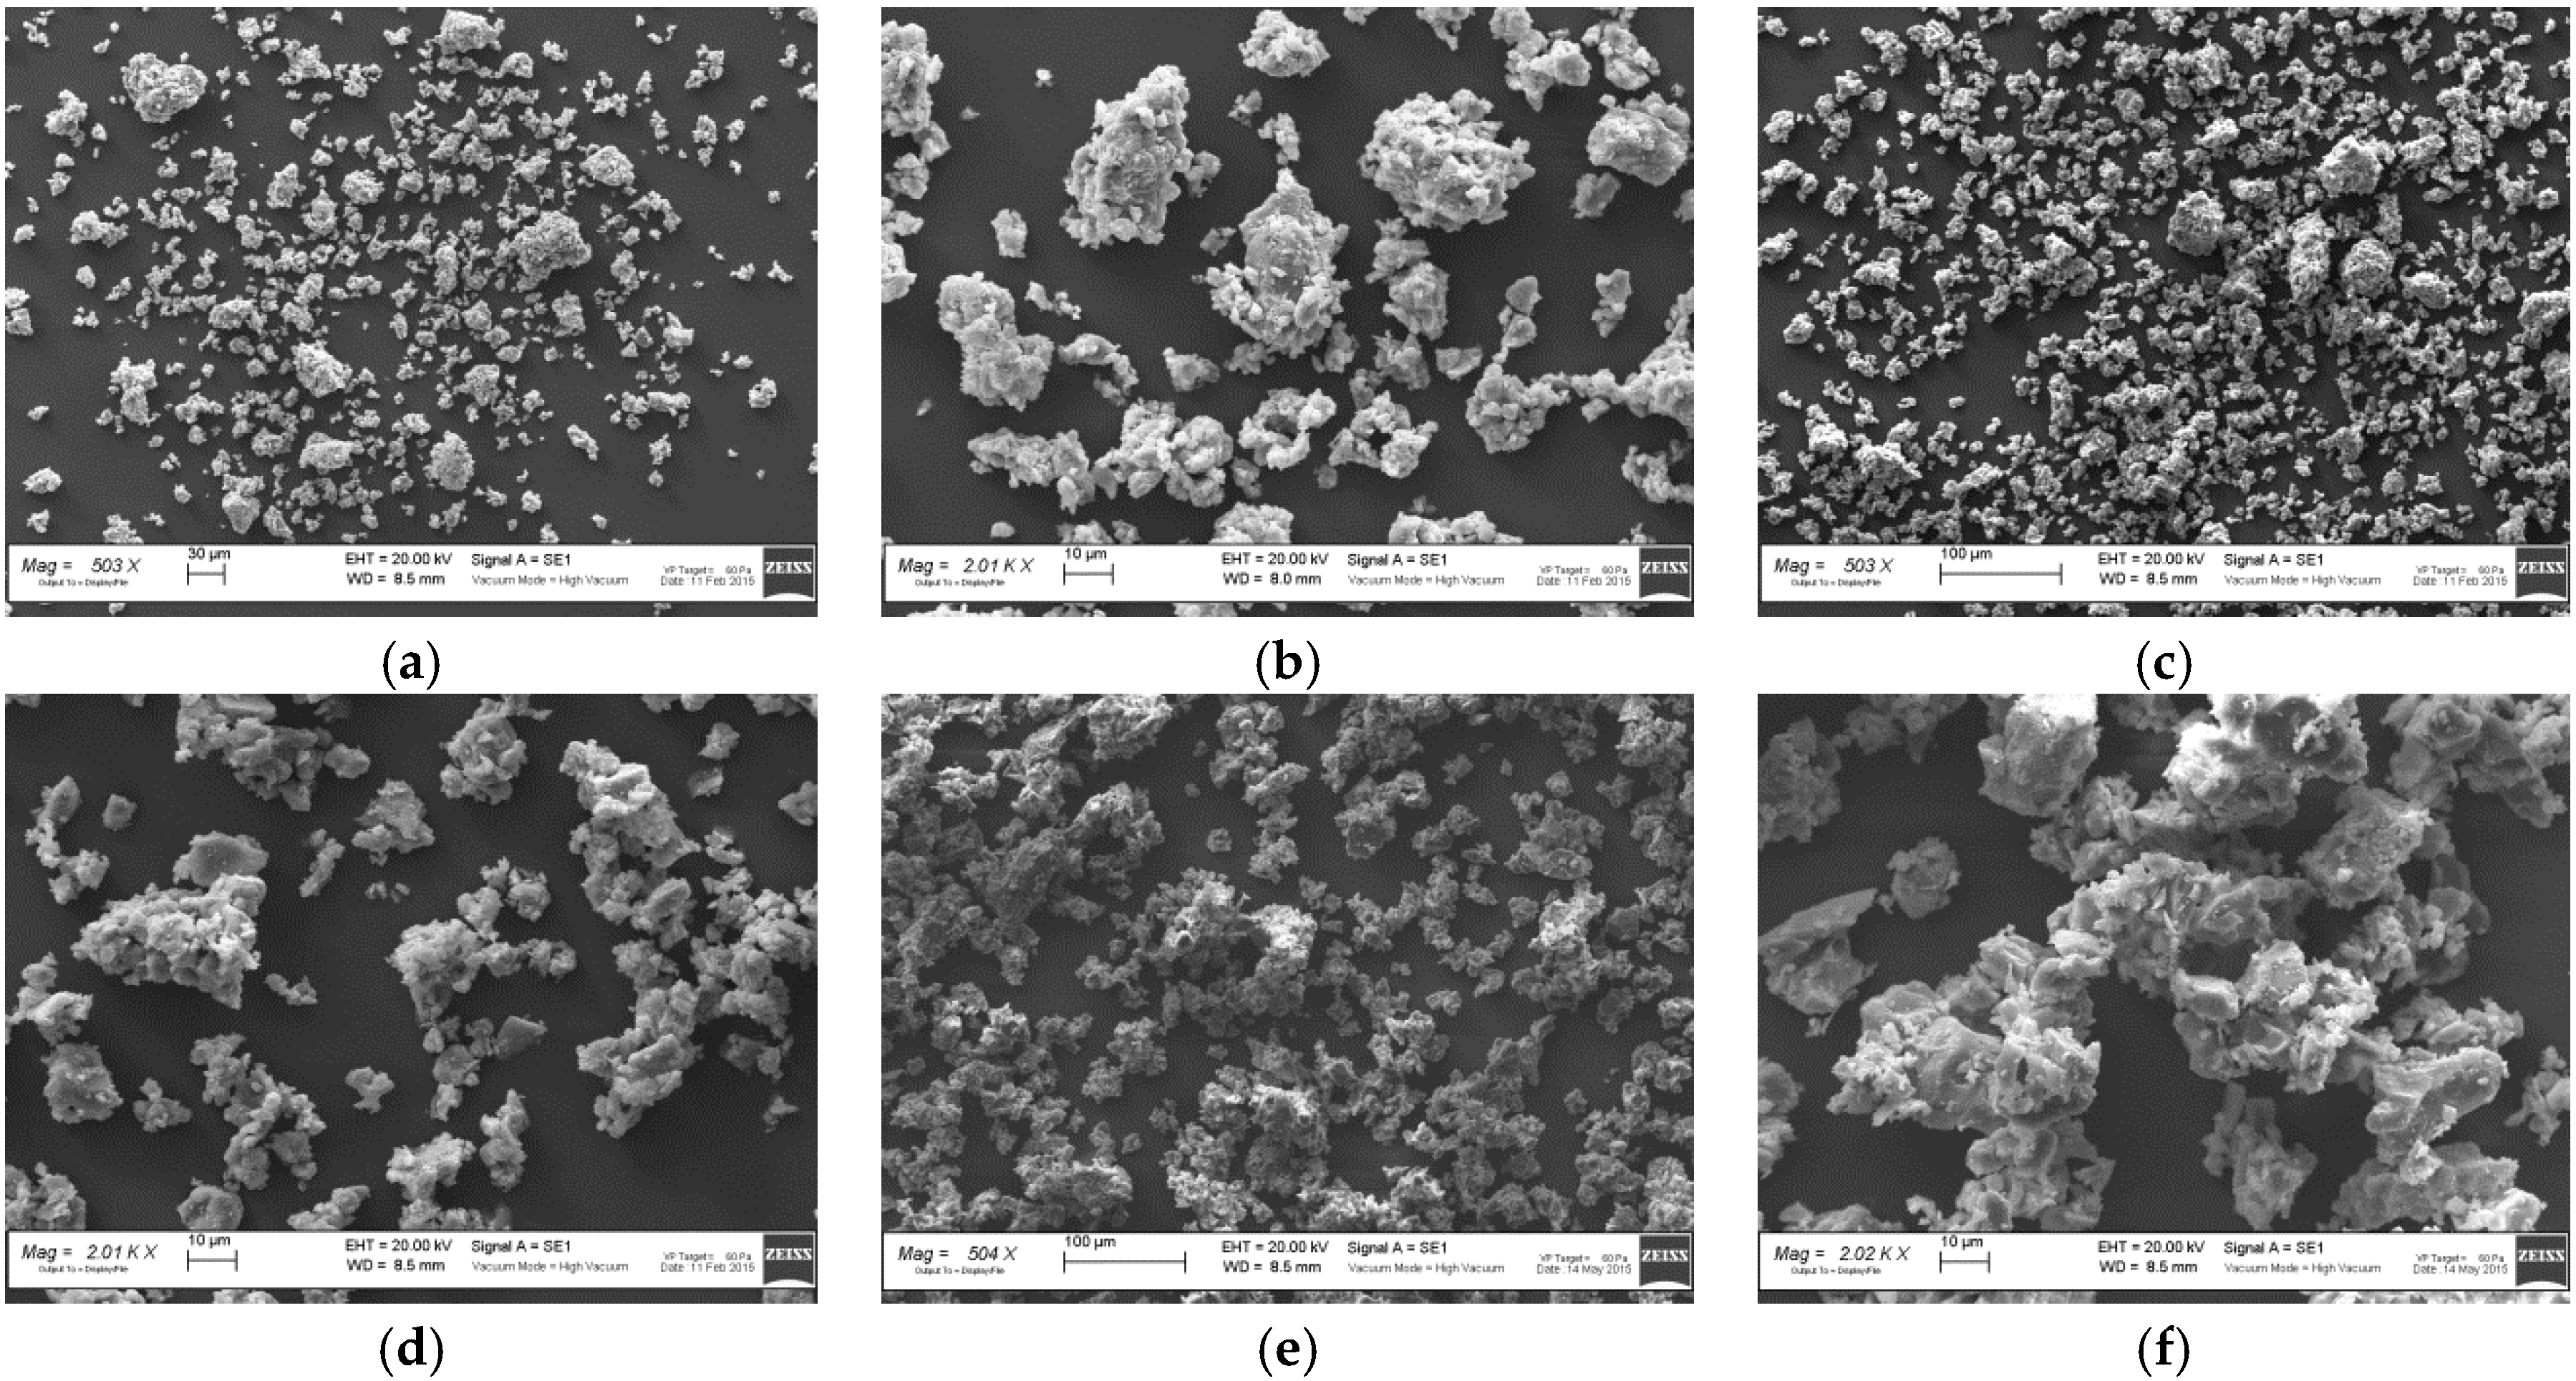
SEM analysis shows that, on average, Mn-rich samples are characterized by larger grain dimensions (
Figure 5). Such results are consistent with the higher thermal treatment necessary to achieve phase purity for Na
2MnP
2O
7 compared to Na
2FeP
2O
7 (700 °C
versus 600 °C) and in line with the trend already observed in the literature for similar compositions [
12].
Figure 5.
Scanning electron microscope (SEM) images at different magnification of (a,b) Na2FeP2O7 powders; (c,d) Na2Fe0.5Mn0.5P2O7 powders; (e,f) Na2MnP2O7 powders.
Figure 5.
Scanning electron microscope (SEM) images at different magnification of (a,b) Na2FeP2O7 powders; (c,d) Na2Fe0.5Mn0.5P2O7 powders; (e,f) Na2MnP2O7 powders.
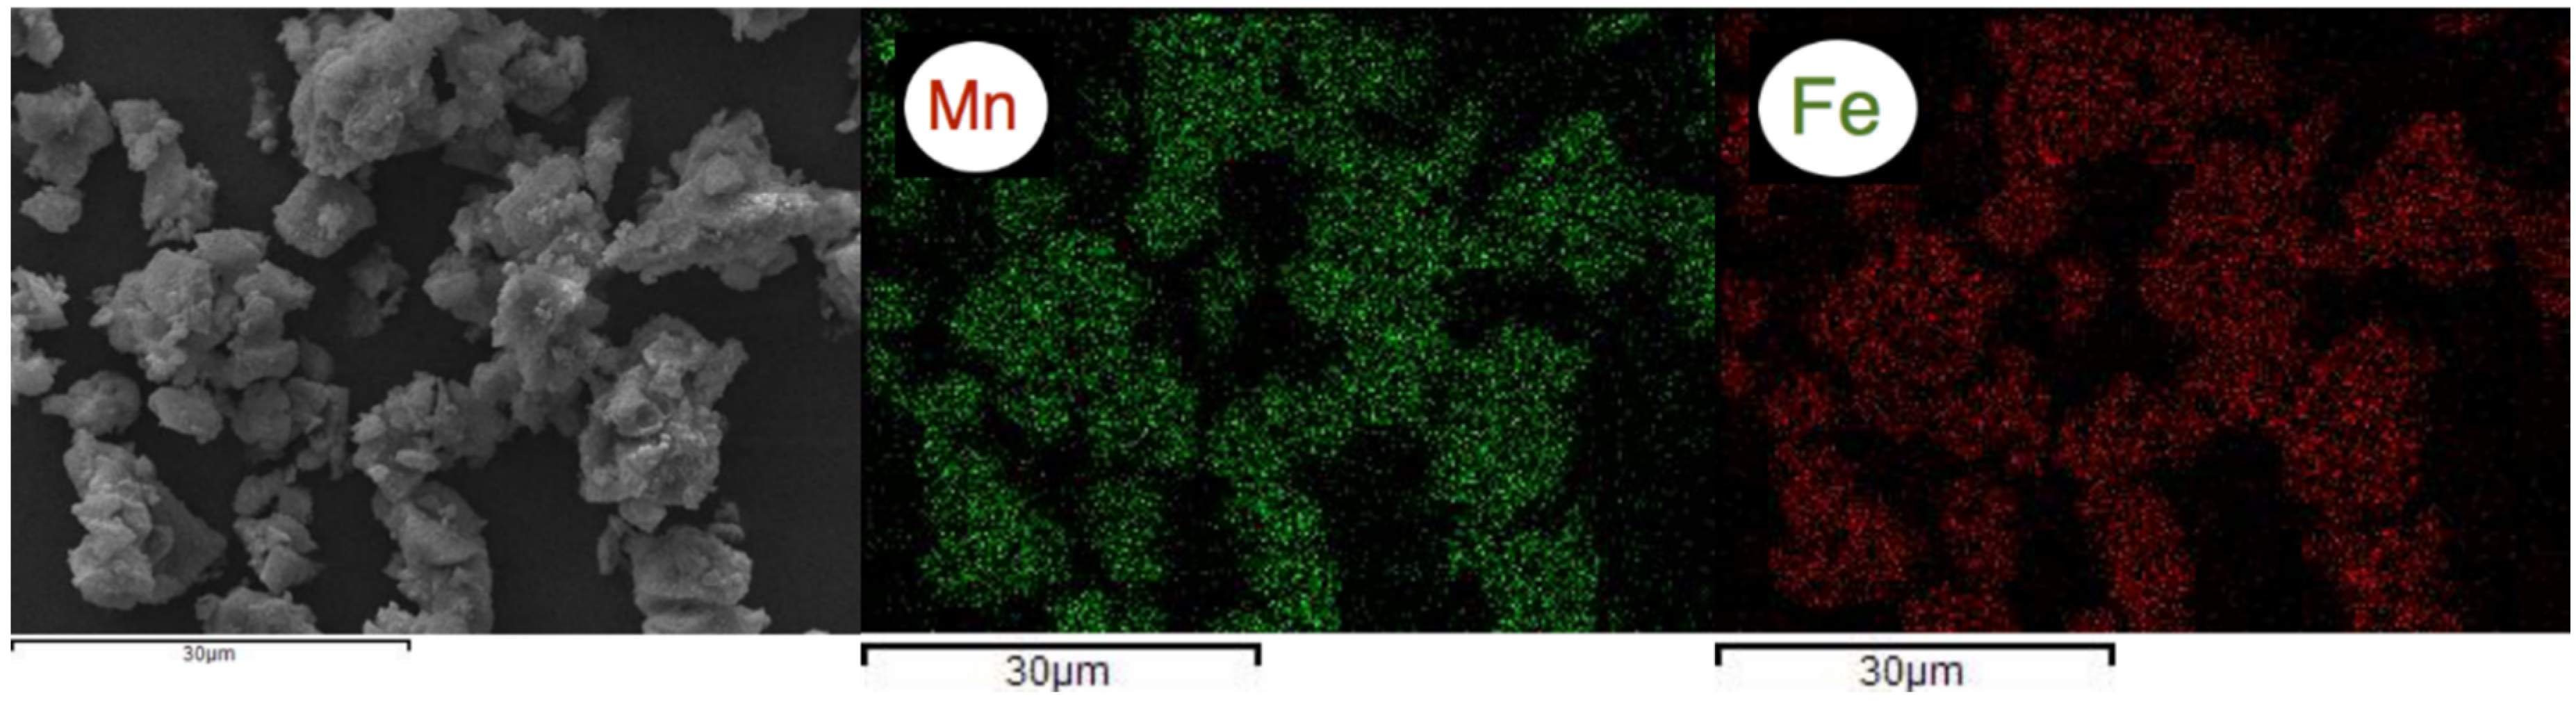
In
Figure 6, the SEM image and the maps of Mn and Fe obtained by the elemental microanalysis on the Na
2Fe
0.5Mn
0.5P
2O
7 sample are reported. It is evident that the distribution of both ions accurately reproduces the sample morphology. Thus, this technique supports the fact that, indeed, the two end-members form a solid solution of composition Na
2Fe
0.5Mn
0.5P
2O
7, rather than a two-phase mixture of compositions Na
2FeP
2O
7 and Na
2MnP
2O
7.
Figure 6.
SEM-energy-dispersive X-ray spectroscopy (EDX) characterization of Na2Fe0.5Mn0.5P2O7 showing the distribution of Fe and Mn within the powder sample.
Figure 6.
SEM-energy-dispersive X-ray spectroscopy (EDX) characterization of Na2Fe0.5Mn0.5P2O7 showing the distribution of Fe and Mn within the powder sample.
All the samples in the Na
2Fe
1−xMn
xP
2O
7 (
x = 0, 0.25, 0.5, 0.75, 1) series were characterized for their electrochemical performances with standard half-cell assembly, as described in the Experimental Section.
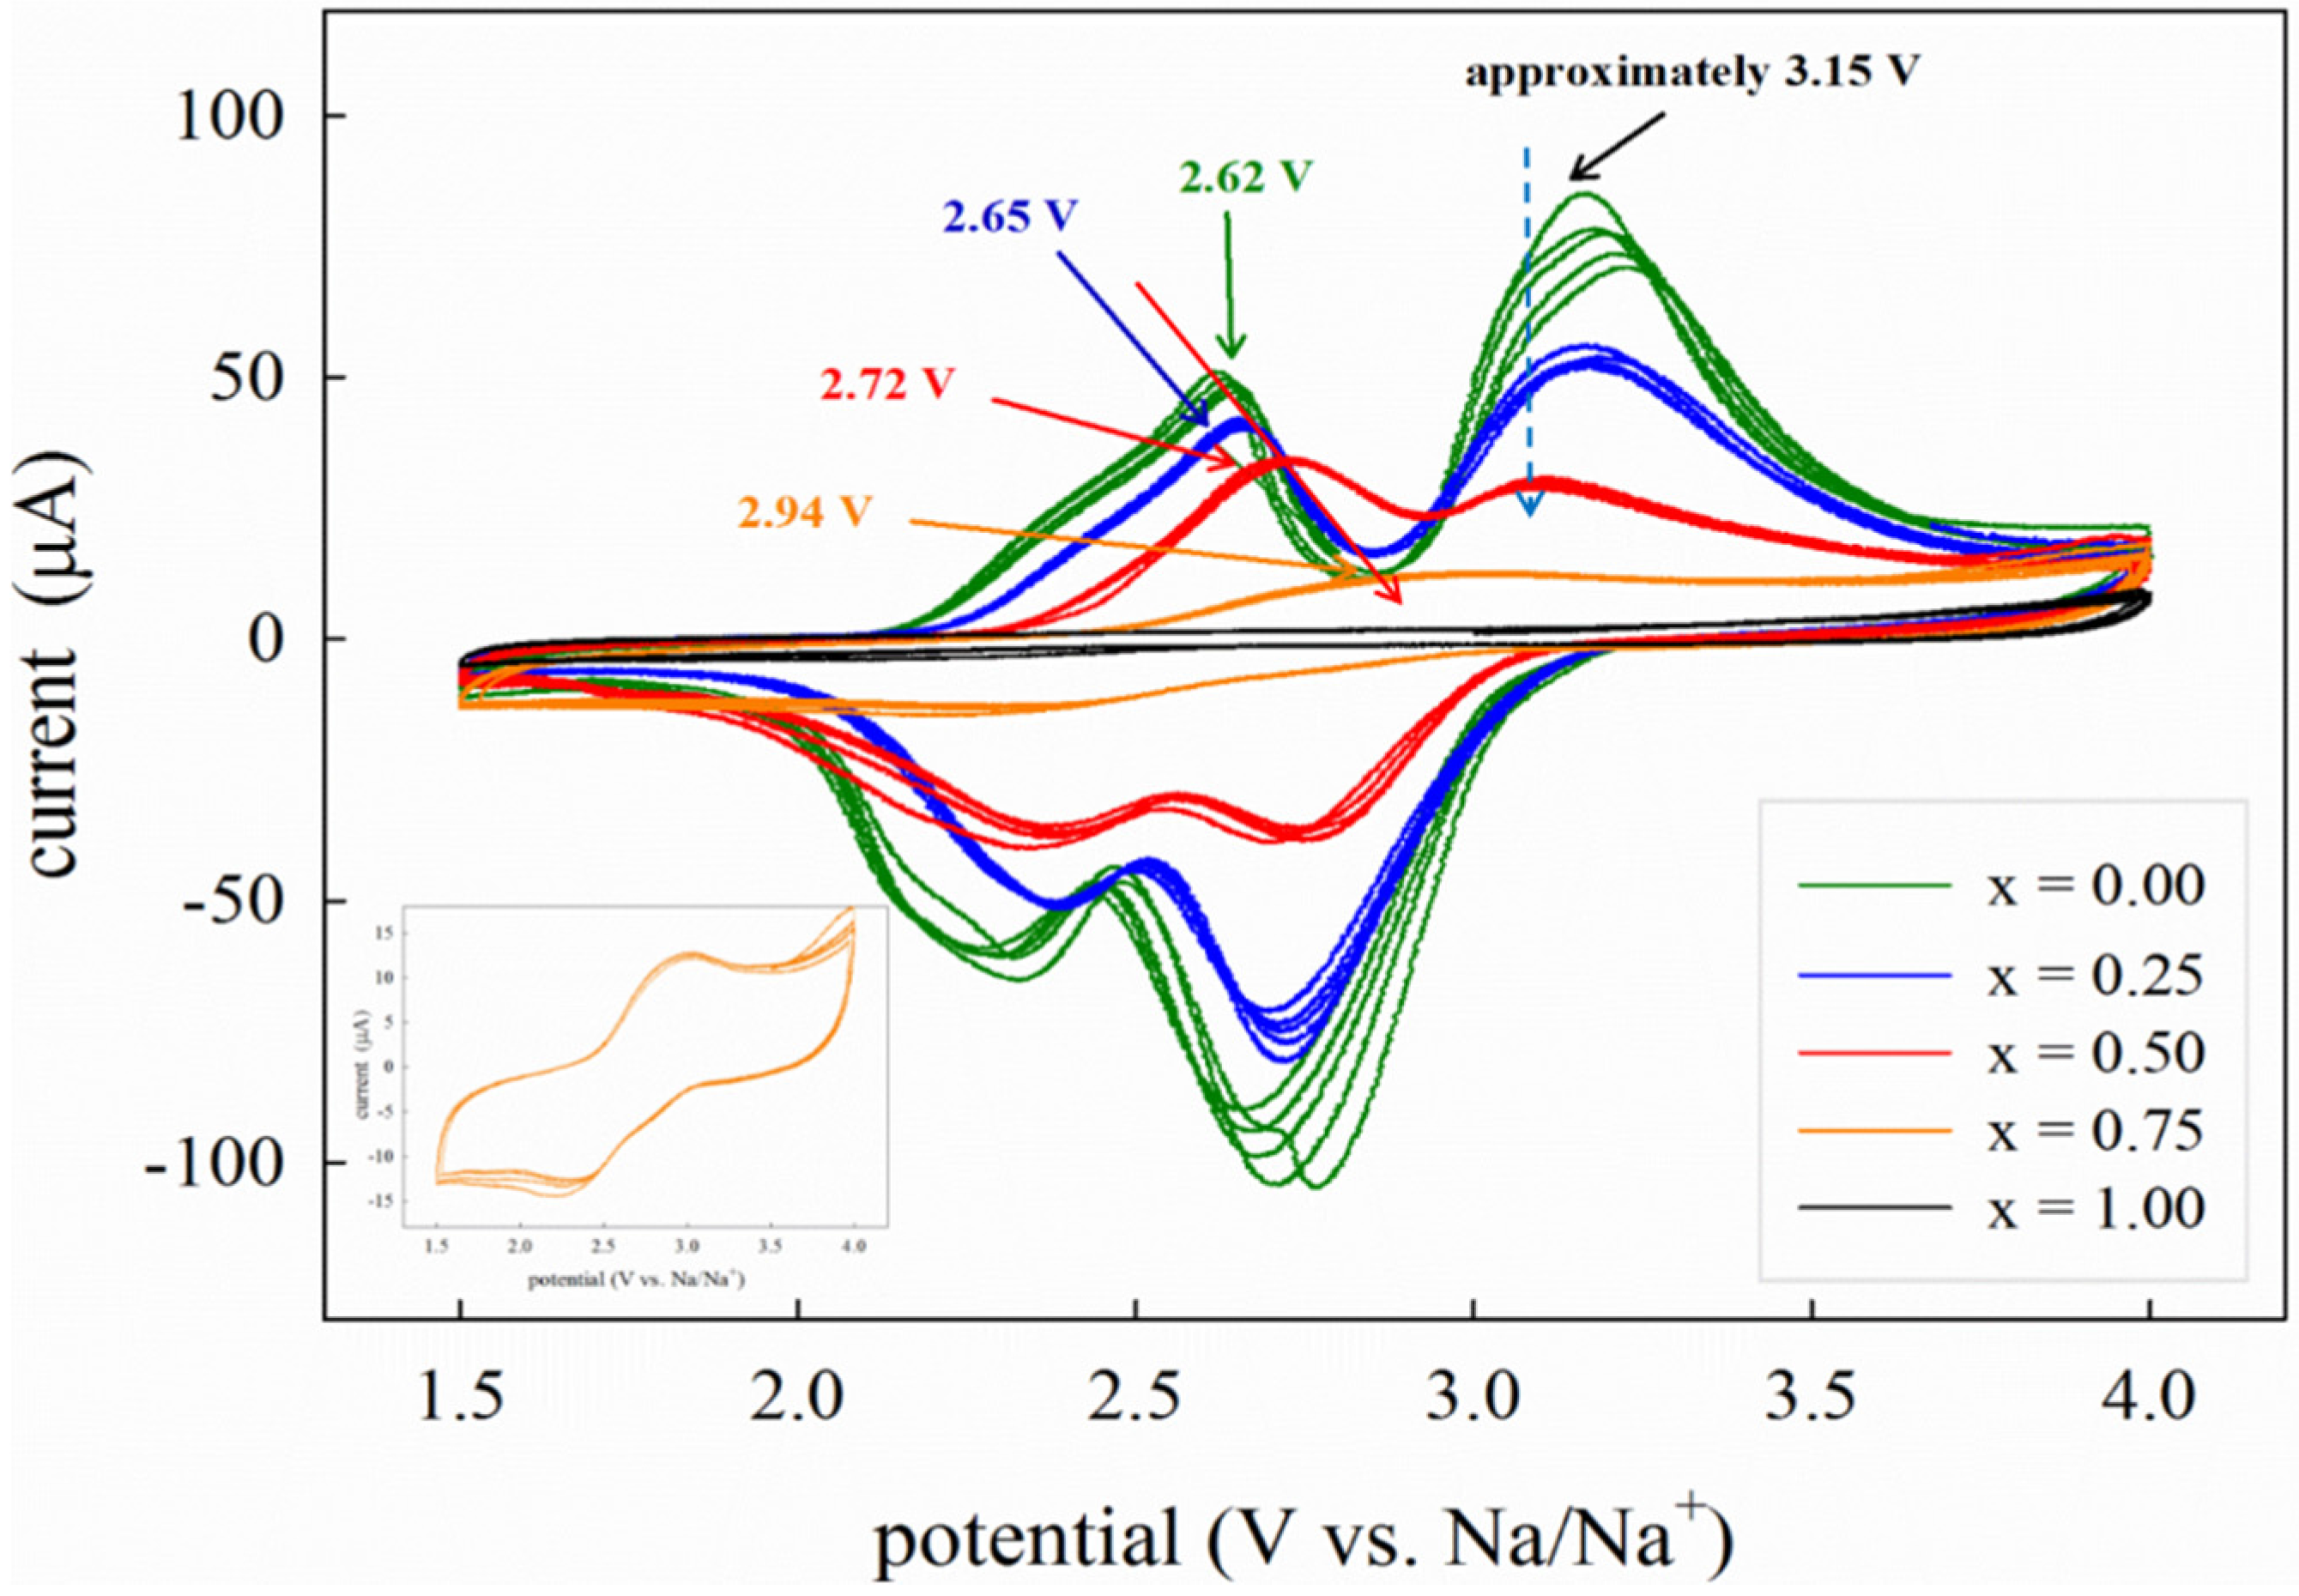
Figure 7 shows the CV curves in the potential range 1.5–4.0 V
versus Na/Na
+. The first information that can be extracted from these curves is that, under the experimental conditions used in this study, the CV response of the samples is strongly reduced as the Mn content increases, at the point that the electrochemical activity of pure Na
2MnP
2O
7 is barely observable, as previously reported for this system [
12]. A decrease in electrochemical performances along with the substitution of Mn for Fe is common to other Mn-based polyanionic compounds, such as Li
2(Fe,Mn)P
2O
7 [
23], and it has been generally attributed to the peculiar features of the Mn
2+/Mn
3+ redox couple, affected by large Jahn-Teller structural effects [
13]. We recall here that the kinetics of sodium insertion/deinsertion is a very complex mechanism depending on several factors including lattice mismatch, low electronic conductivity, Jahn-Teller distortion, lattice strain upon intercalation/deintercalation,
etc. Park
et al. [
13] proposed the degree of atomic rearrangement as a key metric for kinetic evaluation. In particular, structural rearrangements due to the accommodation of the Jahn-Teller distortion can provide a reference framework for the interpretation of noticeable differences in electrochemical behavior.
As it is possible to observe from
Figure 7, for the Na
2FeP
2O
7 compound, the average voltages of the two major peaks are in fair agreement with those previously reported for this composition [
14,
15,
16]. The shift in the average voltage as a function of composition is consistent with the trend observed for the two end-members, Na
2FeP
2O
7 [
16] and Na
2MnP
2O
7 [
13], where a shift of approximately 0.85 V was reported. Unfortunately, the very limited activity of Na
2MnP
2O
7 does not allow us to evaluate the absolute shift value between pure Fe and pure Mn in this study. We can presume that Fe-rich samples are characterized by a smaller shift in the voltage as Mn is introduced in the structure, whereas a more pronounced effect is expected for higher Mn contents (
x > 0.5), as suggested by the difference between Na
2Fe
0.25Mn
0.75P
2O
7 (2.94 V) and Na
2Fe
0.50Mn
0.50P
2O
7 (2.72 V) compared to Na
2FeP
2O
7 (2.62 V) and Na
2Fe
0.75Mn
0.25P
2O
7 (2.65 V).
Figure 7.
Cyclic voltammetry (CV) curves of the Na2Fe1-xMnxP2O7 series acquired at the scan rate of 0.1 mV·s−1. Inset: CV curve of the x = 0.75 sample in the range 1.5–4.0 V.
Figure 7.
Cyclic voltammetry (CV) curves of the Na2Fe1-xMnxP2O7 series acquired at the scan rate of 0.1 mV·s−1. Inset: CV curve of the x = 0.75 sample in the range 1.5–4.0 V.
From
Figure 7 it is also possible to note that, while for the peak centered at approximately 2.6 V a clear upward shift is detected along with increasing Mn content, the effect on the second part of the CV curve, centered around 3.15 V, is less pronounced. The reasons for such a behavior are unclear at the moment. The two regions of the CV curves have been associated with different electrochemical processes. In particular, the lowest potential peak, around 2.5 V for the Na
2FeP
2O
7 composition and around 3.3 V for the Na
2MnP
2O
7 composition, was identified as the result of a single phase reaction, while the second part of the curve, centered at approximately 3 V for Na
2FeP
2O
7 compound and above 4 V for Na
2MnP
2O
7, was attributed to different two-phase reactions [
13,
16]. From the present data, it can be inferred that the single-phase reaction process is sensitive to the nature of the metal cation, although it is possible that the second peak is also affected by the same voltage shift for higher Mn contents, but this is not visible in our case due to the low activity and the restricted voltage window used in these measurements, because of the electrolyte stability limit. Indeed, the CV profiles shown in a previous report of electrochemical activity for Na
2MnP
2O
7 were acquired up to 4.5 V and clearly showed, as visible in the inset of
Figure 7, that the current was still increasing at such voltage [
13]. We can also observe from
Figure 7 that the shape of the CV curve for the Na
2FeP
2O
7 compound, as well as for the other compositions, is not as resolved as those previously reported in literature [
16], in particular for what concerns the peaks around 3 V which, on the other hand, are attributed to less thermodynamically and kinetically favored two-phase transitions. This behavior may be due to several reasons: (i) the adopted scan rate that, as nicely shown in [
16], is severely affecting the resolution of the CV curve, in particular for the high voltage region; (ii) the cathode microstructure (shape and size of particles) which, together with an efficient carbon coating, may strongly affect the kinetics of Na intercalation and de-intercalation in the system.
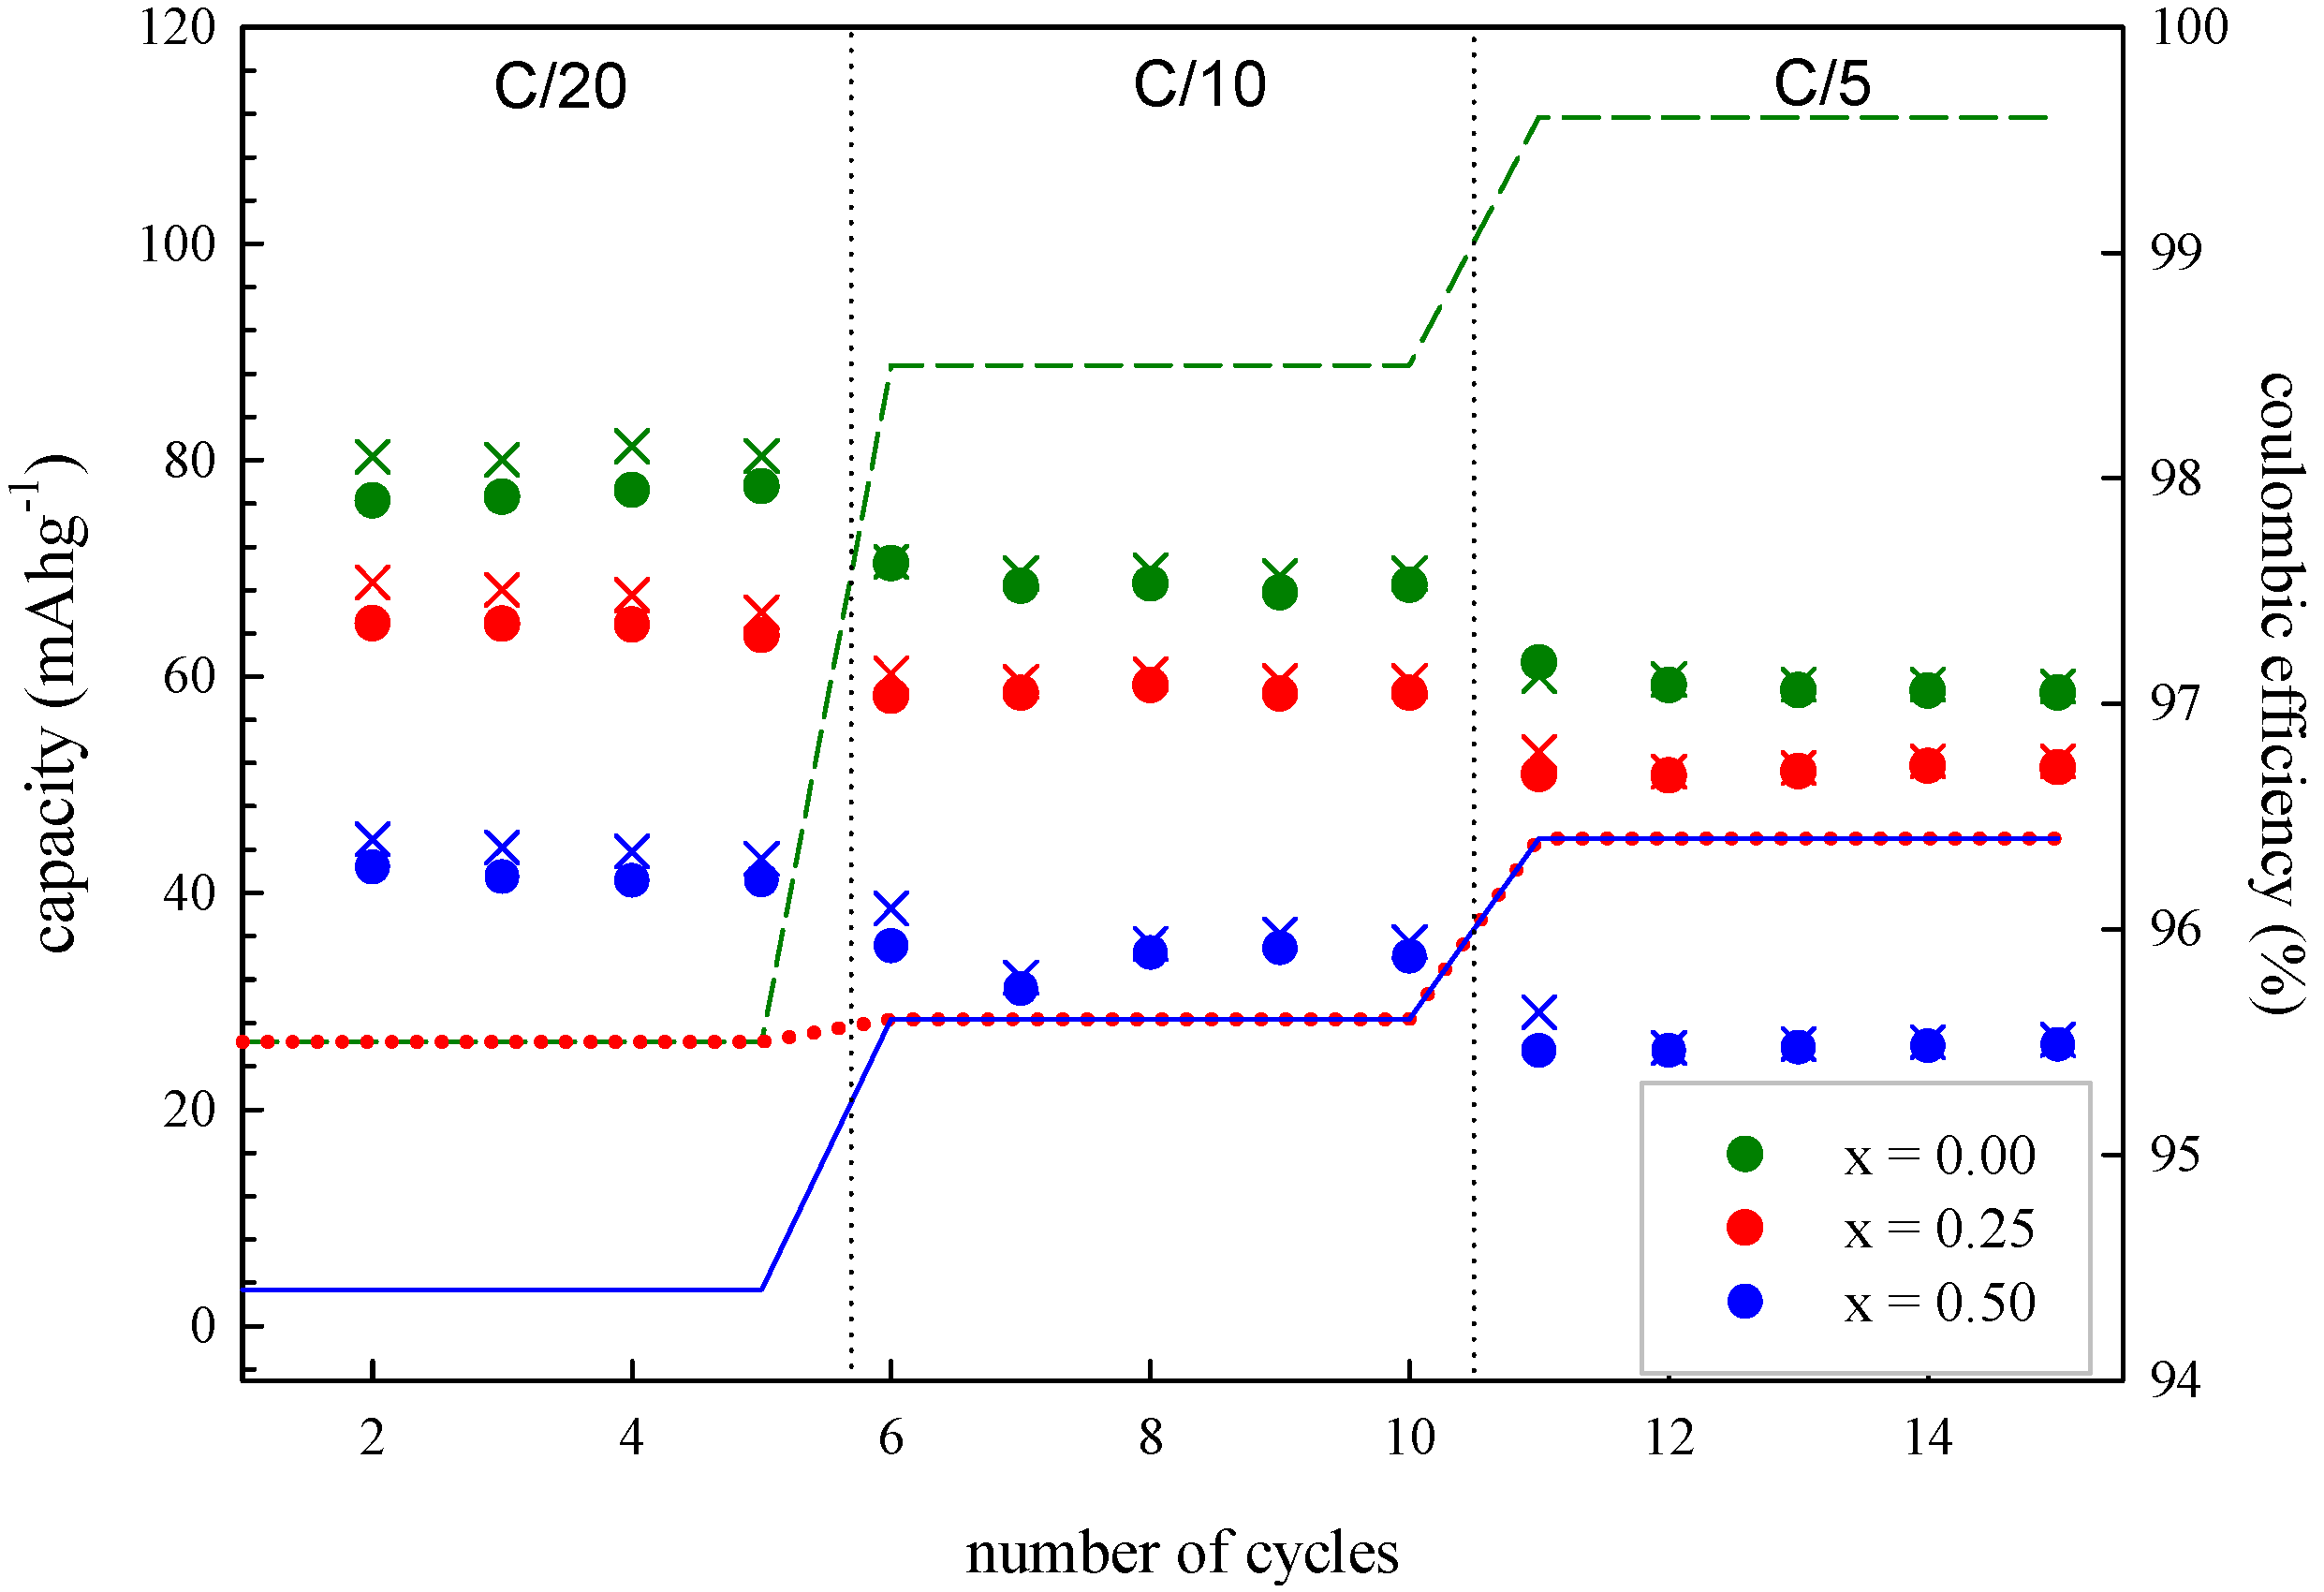
Figure 8 presents the charge/discharge cycles of the compounds of composition Na
2Fe
1−xMn
xP
2O
7 (
x = 0.0; 0.25; 0.50) at different C rates. At a given scan rate, the materials present a decreasing capacity as the Mn content increases. The most Mn-rich samples were not cycled as a consequence of the bad electrochemical activity presented in the CV curves. This worsening of the electrochemical properties is in line with what was previously reported for this system [
12]. Overall, the capacity decreases when faster charge rates are used, as expected. However, a nice result is that the capacity is substantially retained over a certain number of cycles and the coulombic efficiency is almost 100% overall at higher current densities. Concerning the bad performances of the pure Mn compound, we stress that there is no full agreement in the literature. In particular, Barpanda
et al. [
12] reported bad properties for samples prepared by standard solid-state reactions. In contrast, Choi and co-workers [
13] reported much better performances for samples subjected to ball-milling post-treatment for carbon coating. Since the morphology of the samples discussed in both the papers is similar, and is also similar to that of the present materials, we conclude that the optimization key in Mn (and even Mn-rich) pyrophosphates is a proper conductive coating able to counteract the intrinsic low electronic conductivity of these samples which is likely related to the electronic/structural features of the Mn
3+/Mn
2+ redox couple [
13]. Indeed, a strong decrease of the particle dimensions can help to overcome this problem, as recently modeled for interphase electrochemical intercalation reactions [
24].
Figure 8.
Charge/discharge plot for the Na2Fe1−xMnxP2O7 series (x = 0.0; 0.25; 0.50) at different charging rates in the 1.4–4.0 V range. Crosses indicate the charging process, points relate to the discharge process while lines indicate the coulombic efficiency.
Figure 8.
Charge/discharge plot for the Na2Fe1−xMnxP2O7 series (x = 0.0; 0.25; 0.50) at different charging rates in the 1.4–4.0 V range. Crosses indicate the charging process, points relate to the discharge process while lines indicate the coulombic efficiency.


 ,
, 


