Article

Power Quality Issues of a Battery Fast Charging Station for a Fully-Electric Public Transport System in Gothenburg City

Electric Power Engineering Division, Energy and Environment Department, Chalmers University of Technology, 41296 Gothenburg, Sweden
*
Author to whom correspondence should be addressed.
Batteries 2015, 1(1), 22-33; https://doi.org/10.3390/batteries1010022
Submission received: 29 September 2015 / Revised: 28 October 2015 / Accepted: 30 October 2015 / Published: 5 November 2015
(This article belongs to the Special Issue Rechargeable Battery Technologies--From Materials to Applications)

Abstract

:
An automatic fast charger station with a power level of 120 kW is developed for city Bus Line 60 in Gothenburg, Sweden. There are some power quality issues towards the utility grid during the charger operation. The aim of this paper is to explain the project and to present the measurement results with respect to power quality issues. The main specifications of the battery, charger, charging infrastructure and bus route are explained. The measurement results show that the harmonic emission is within the prescribed limit despite the high amount of low-frequency harmonics because of a passive diode rectification. It is suggested to replace the passive diode rectifier with an active front-end converter to eliminate low order current harmonics and to obtain a unity power factor operation. The main contribution of this work is to demonstrate a practical example of an electric charging system for an electric public transport system in Gothenburg.

1. Introduction

To promote the idea of hybrid plug-in buses in city environments, a pilot project is established and executed by city authorities and industrial partners in Gothenburg city in Sweden. One appropriate bus route, Bus 60, is selected, and the required infrastructure or changes in the system are implemented to achieve a more electric transport system based on a plug-in hybrid bus [1,2,3,4]. A total of 61% of fuel savings is reported in this project [1].
There have been several similar attempts to utilize the plug-in or hybrid solutions of passenger buses in the city environment to have more clean transport systems; one can refer to [4,5,6,7,8,9,10] for some examples. However, plug-in buses are in their early stages in the application perspective, and this project is one of the few examples of these buses being in service.
The project is called the Hyper Bus project. Business Region Göteborg, a public company owned by the city of Gothenburg, is the project manager. The other partners include Göteborg Eenergy, City of Gothenburg Transport Department, Volvo Buses and Västtrafik. The plug-in hybrid buses, three in this case, were delivered by Volvo Bussar AB. All charger stations and the related infrastructure are provided by Göteborg Energy, an energy company owned by the city of Gothenurg. The Gothenburg Transport Department is the city’s public transport authority that has arranged the process of the integration of the busses into the city transport system, especially in regard to legal issues. Västtrafik is the regional public transport authority responsible for bus route planning in this project.
The project is briefly presented to emphasize the main features, such as charging power and fuel savings. Two fast charger stations are installed at the two ends of the route to provide electric power for the bus batteries. The charger includes a front-end passive rectifier and a DC/DC converter. Measurement results of the charger show that there are some power quality issues because of a passive rectification, which are described in this work.

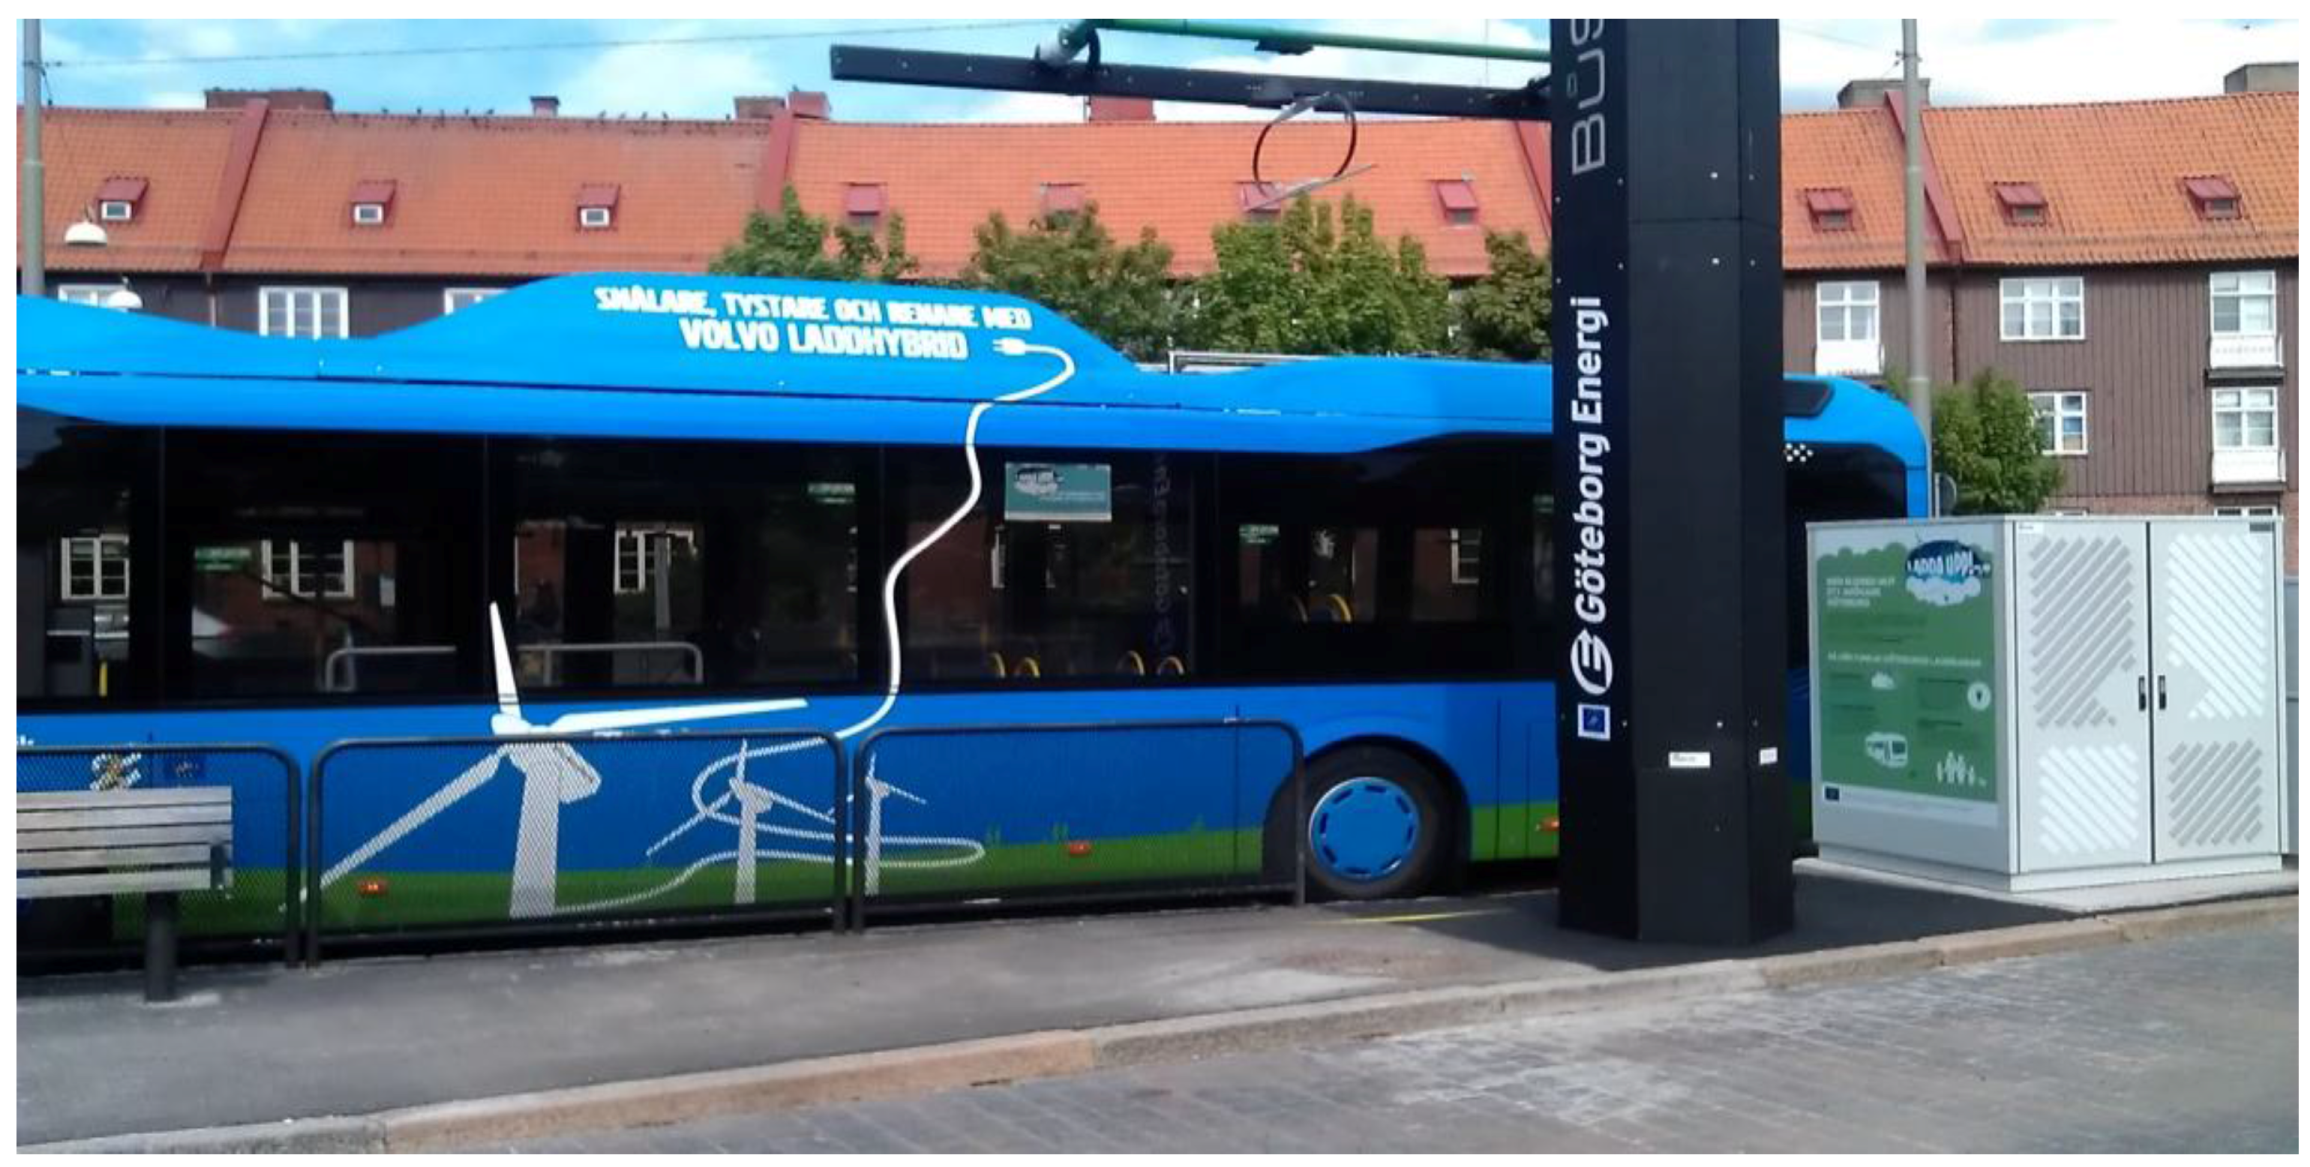
2. The Hyper Bus Project

The aim of the Hyper Bus project was to operate the major part of the route in electric mode. Some changes have been made in the Volvo 7700 hybrid buses to have a more efficient and longer lasting battery. The plug-in buses are called Hyper Buses in the context of this project.
The selected bus route can be described as follows [2]:
  • The distance covered is 8.3 km in one direction.
  • There are 24 stops along the route.
  • The number of passenger journeys is about 400,000 per month.
  • Route 60 has 18 buses, plus three Hyper Buses.
  • The journey time is 35–36 min.
  • Electricity provides up to 70% of the power along the route.
Three buses are the plug-in type with respect to the bus fleet in this route. The bus specifications can be summarized as:
  • Hybrid electric and diesel.
  • Passengers: 35 seated + 35 standing.
  • Twin-axle low-floor urban bus, identical to the Volvo 7900 hybrid.
  • Battery chemical: lithium iron phosphate.
  • Battery capacity: 28 kWh.
  • Charging procedure for the driver: position bus correctly under the charging pole (tolerance ±40 cm sidewise, ±70 cm lengthwise).
  • D5F215 diesel engine: 4.8 L, 161 kW (216 hp), 800 Nm, Euro 5.
  • Electric motor: 150 kW (203 hp) and max 1200 Nm.
The charging stations have the following specifications:
  • Charging time: about 6 min.
  • Local wind-generated electricity from DinEl.
  • Charging capacity: 100 kW.
  • Charging stations input supply: 400 V AC.
  • Charging voltage: 600–750 V DC.
  • Complete charge: 10 kWh.

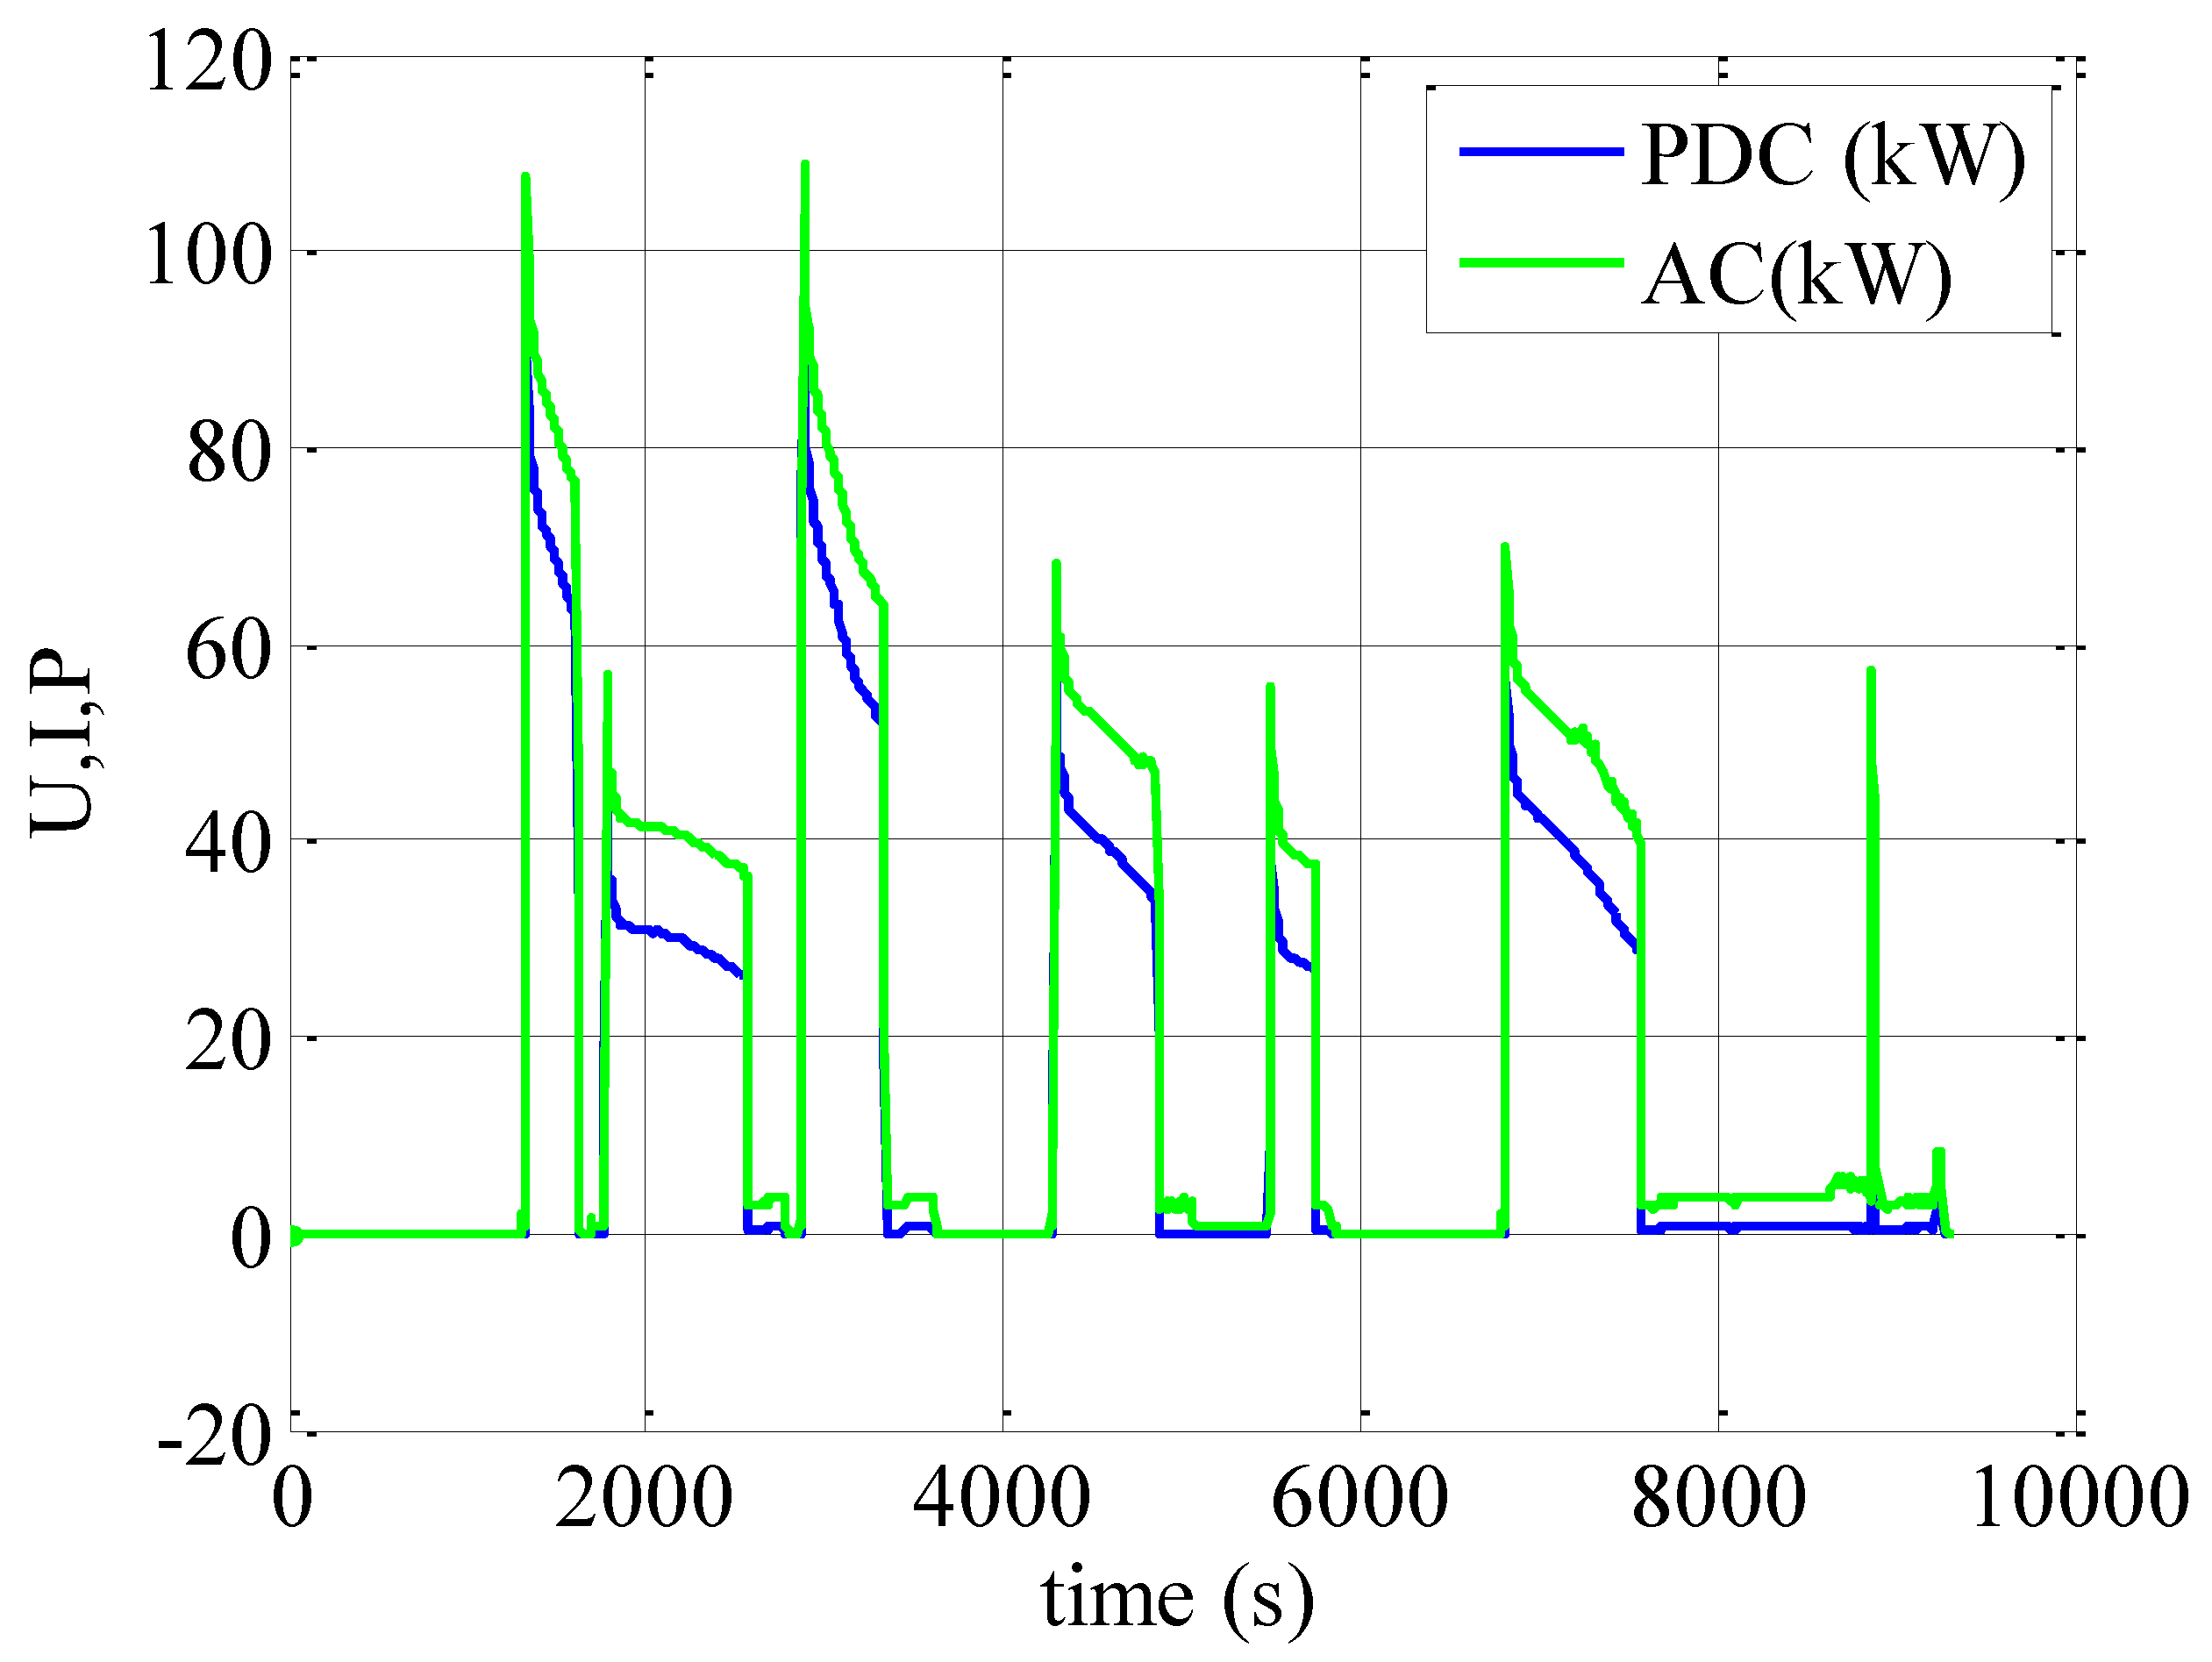
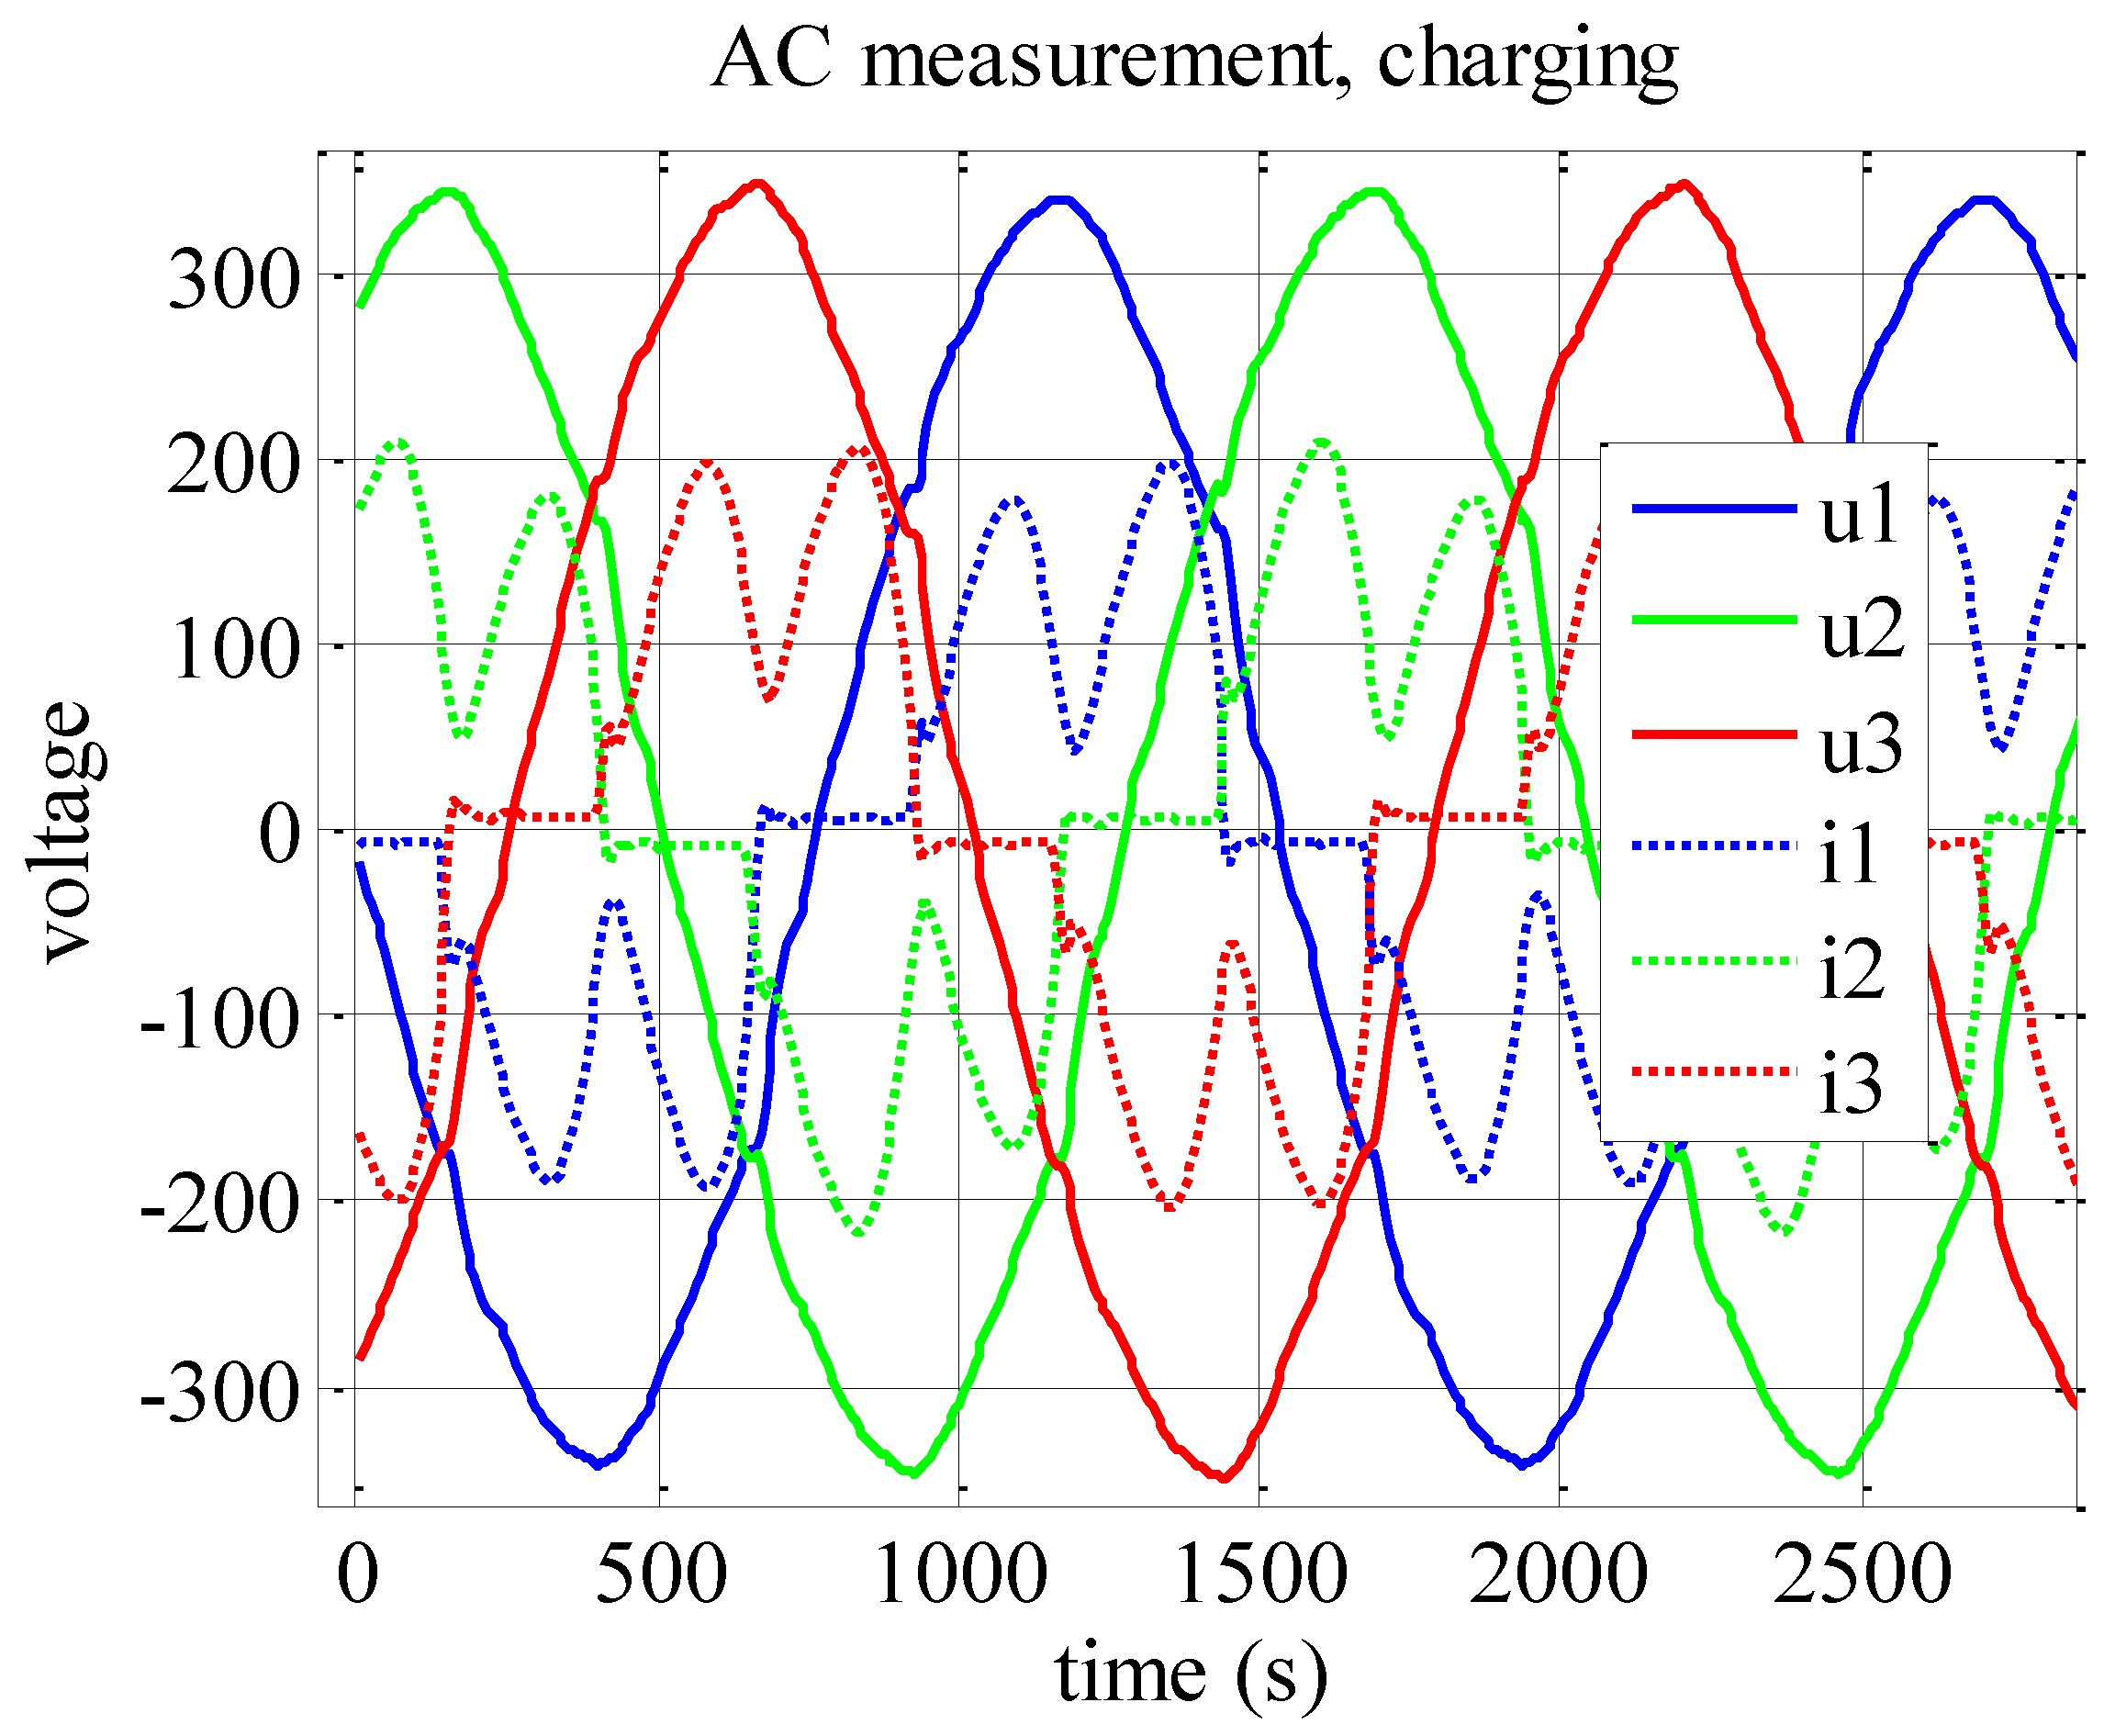
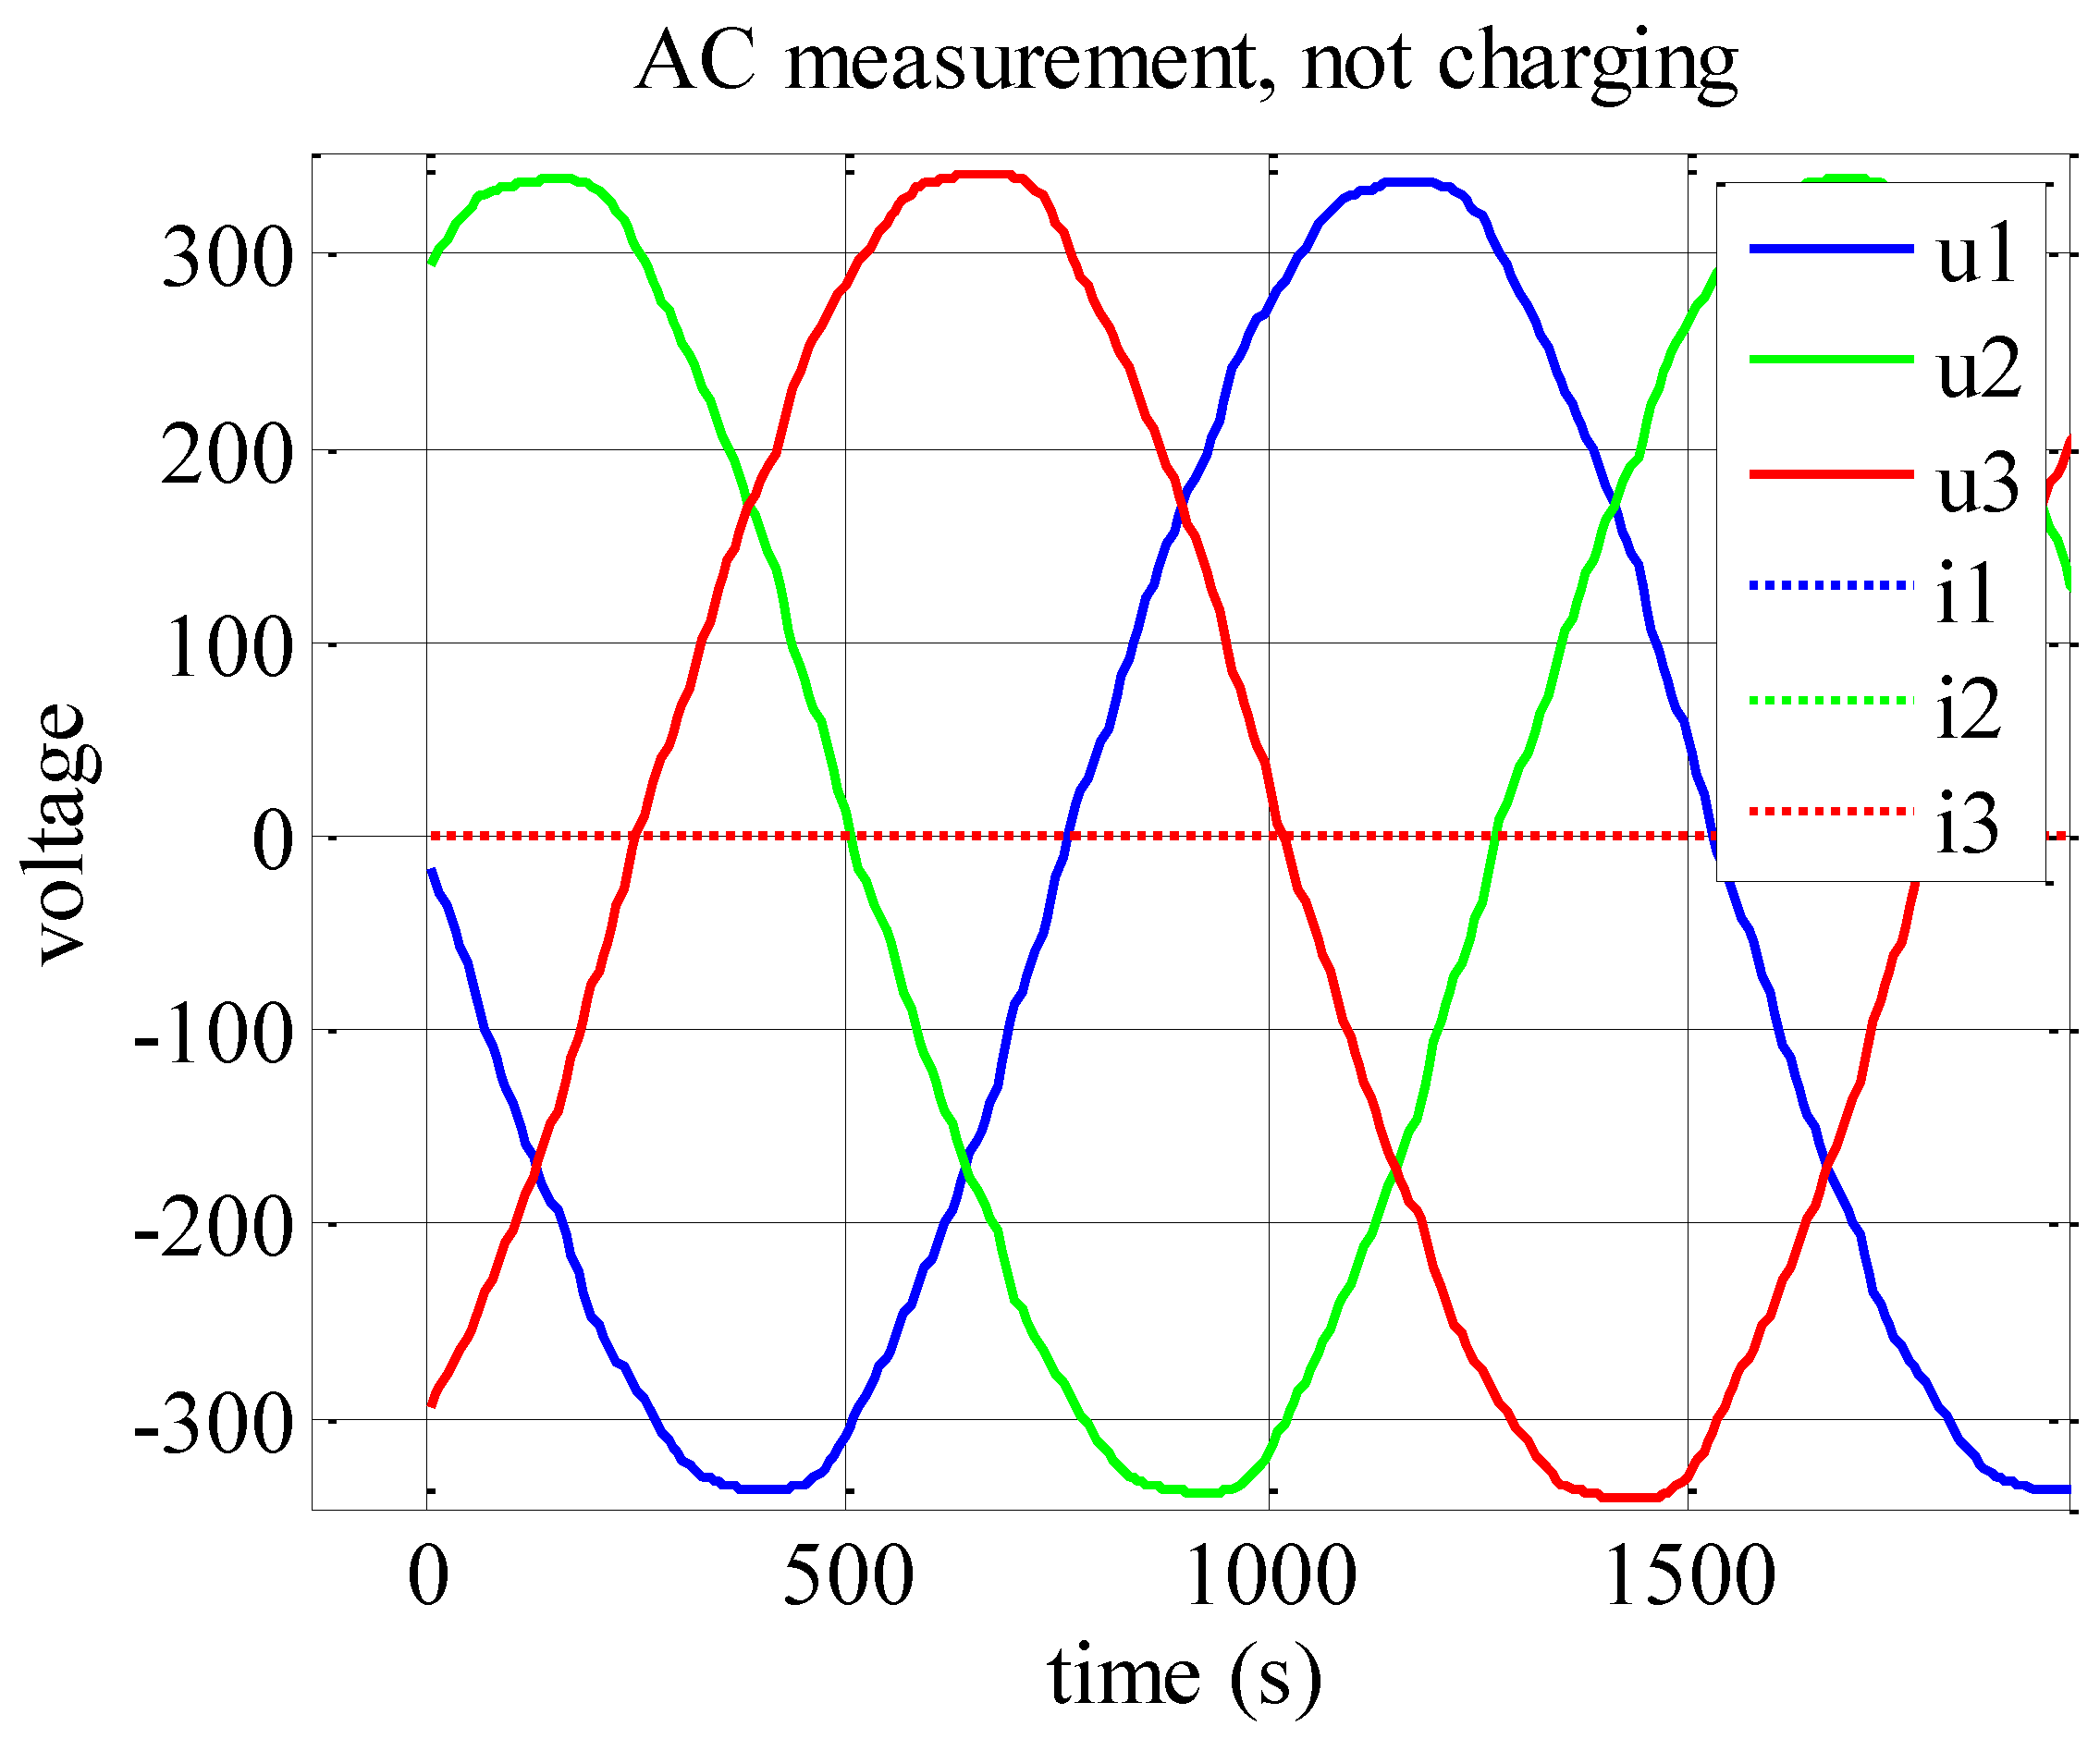
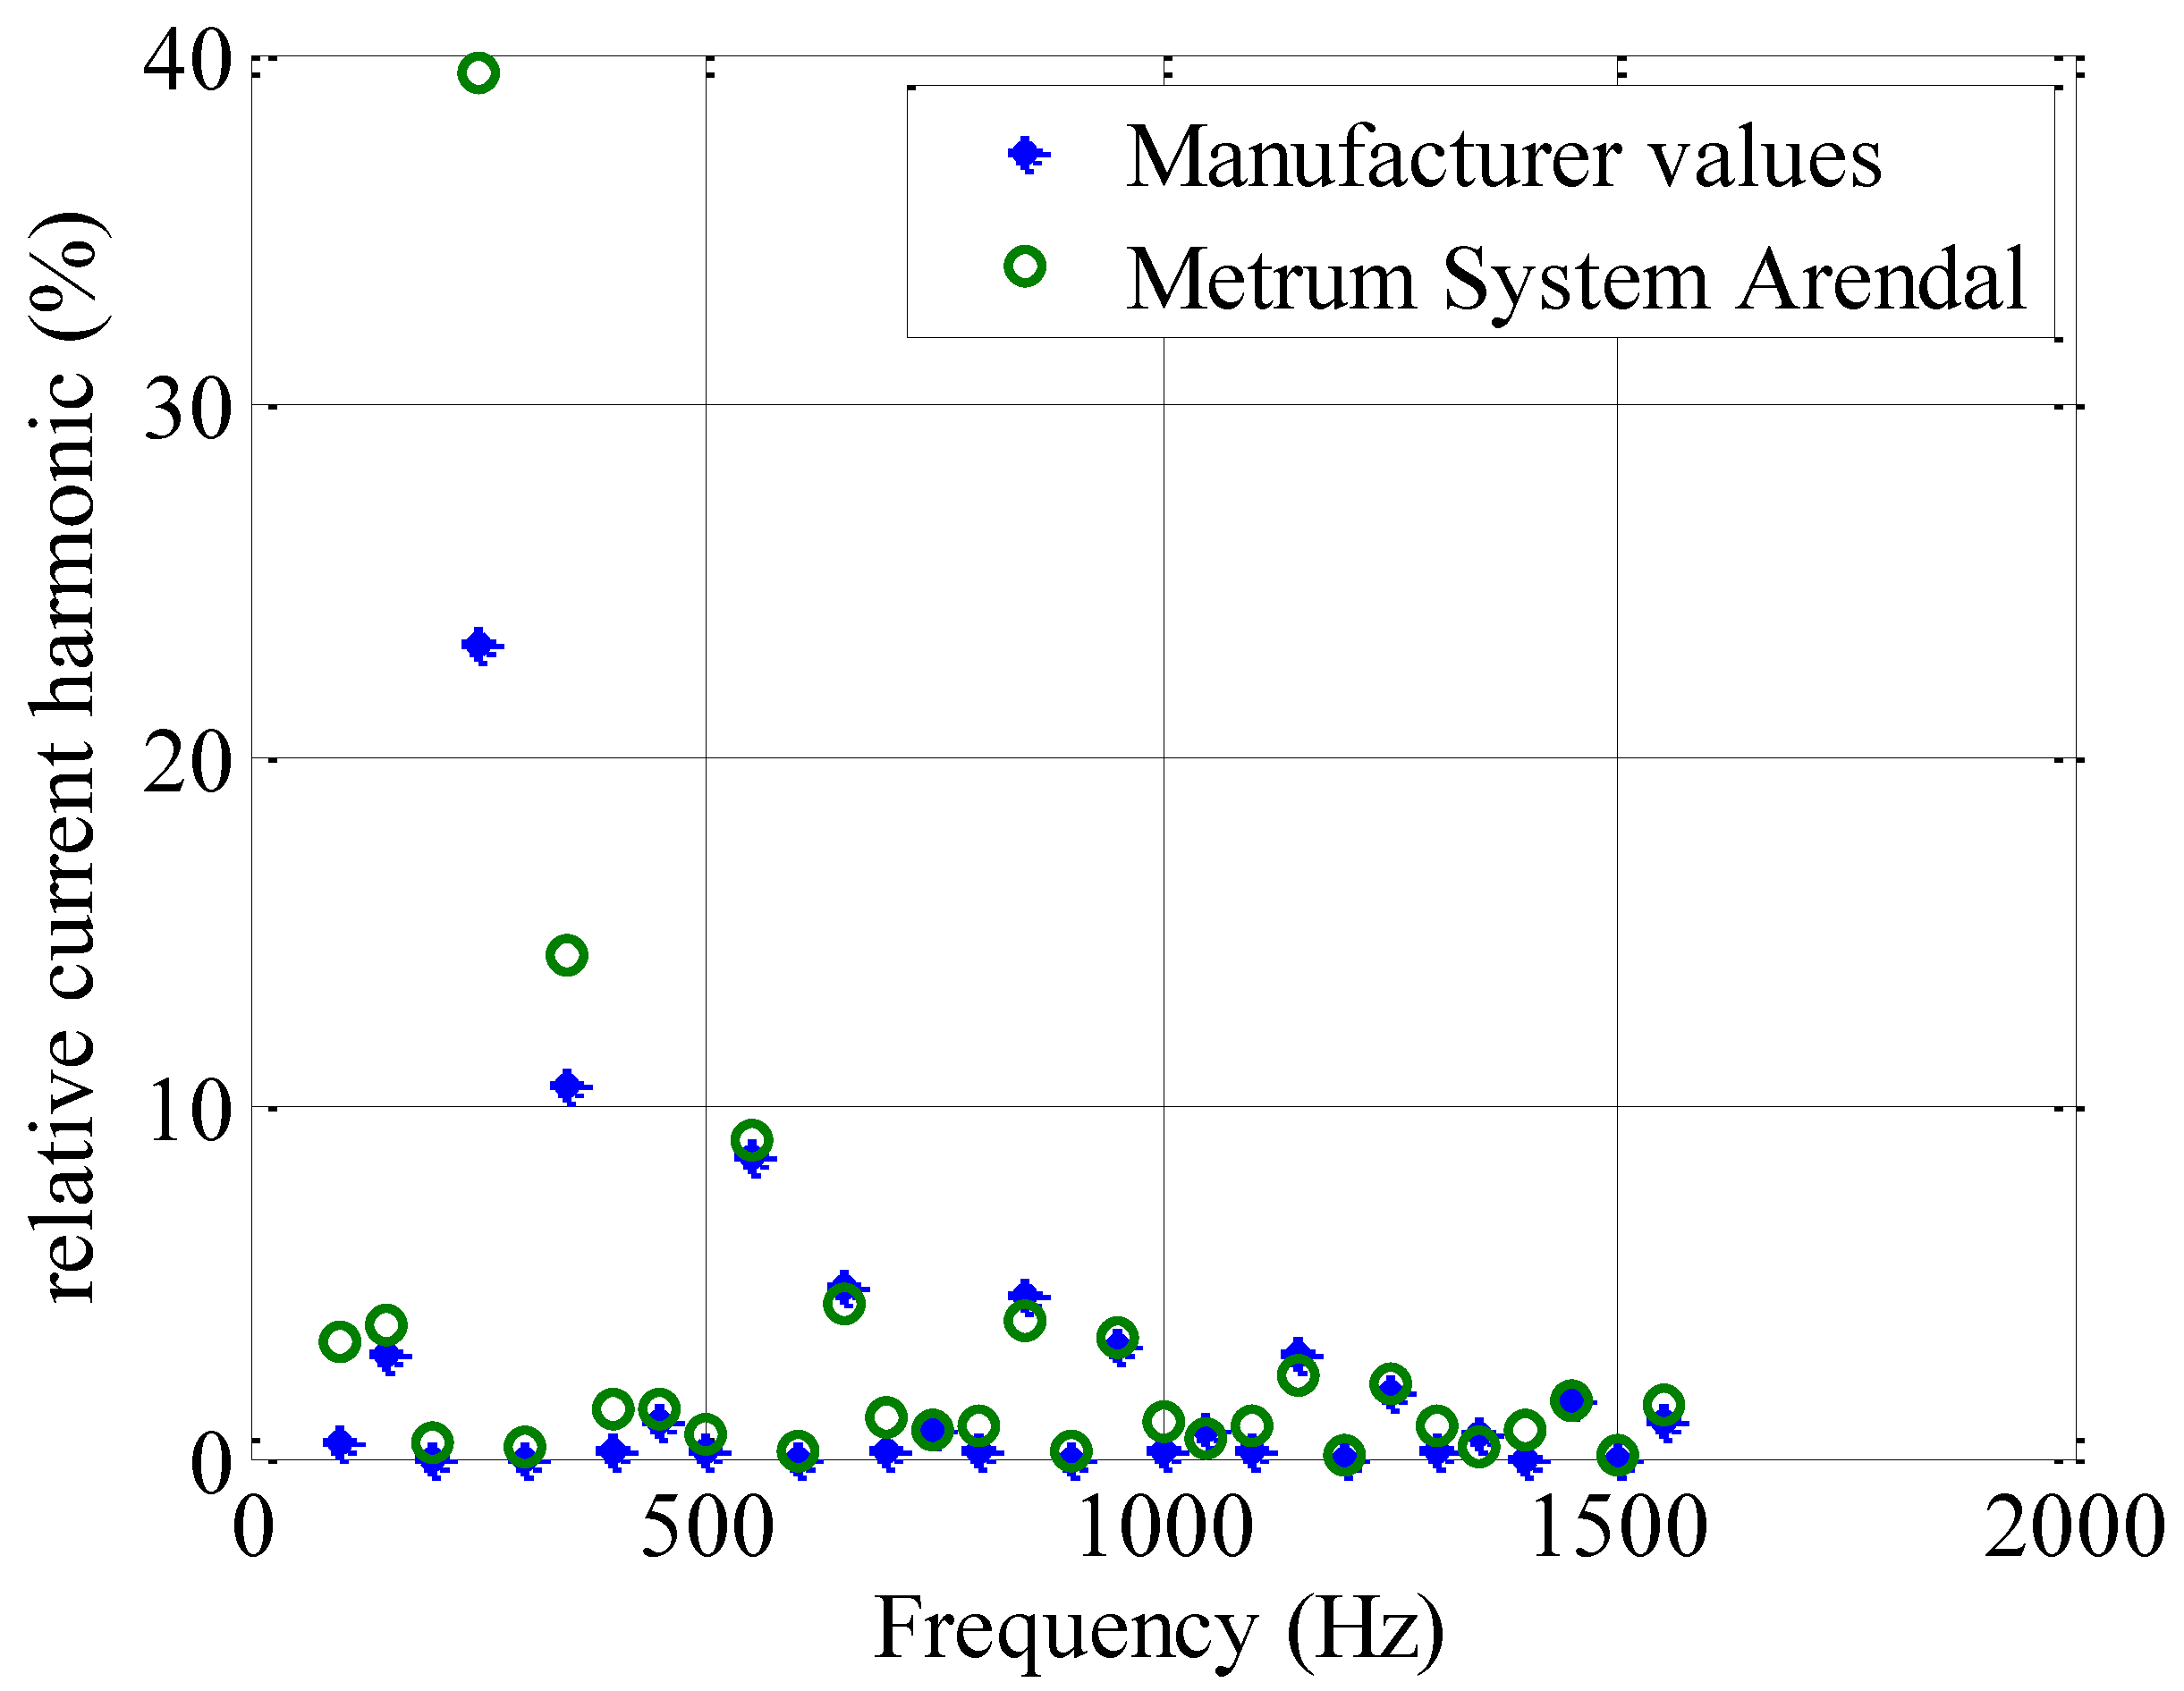
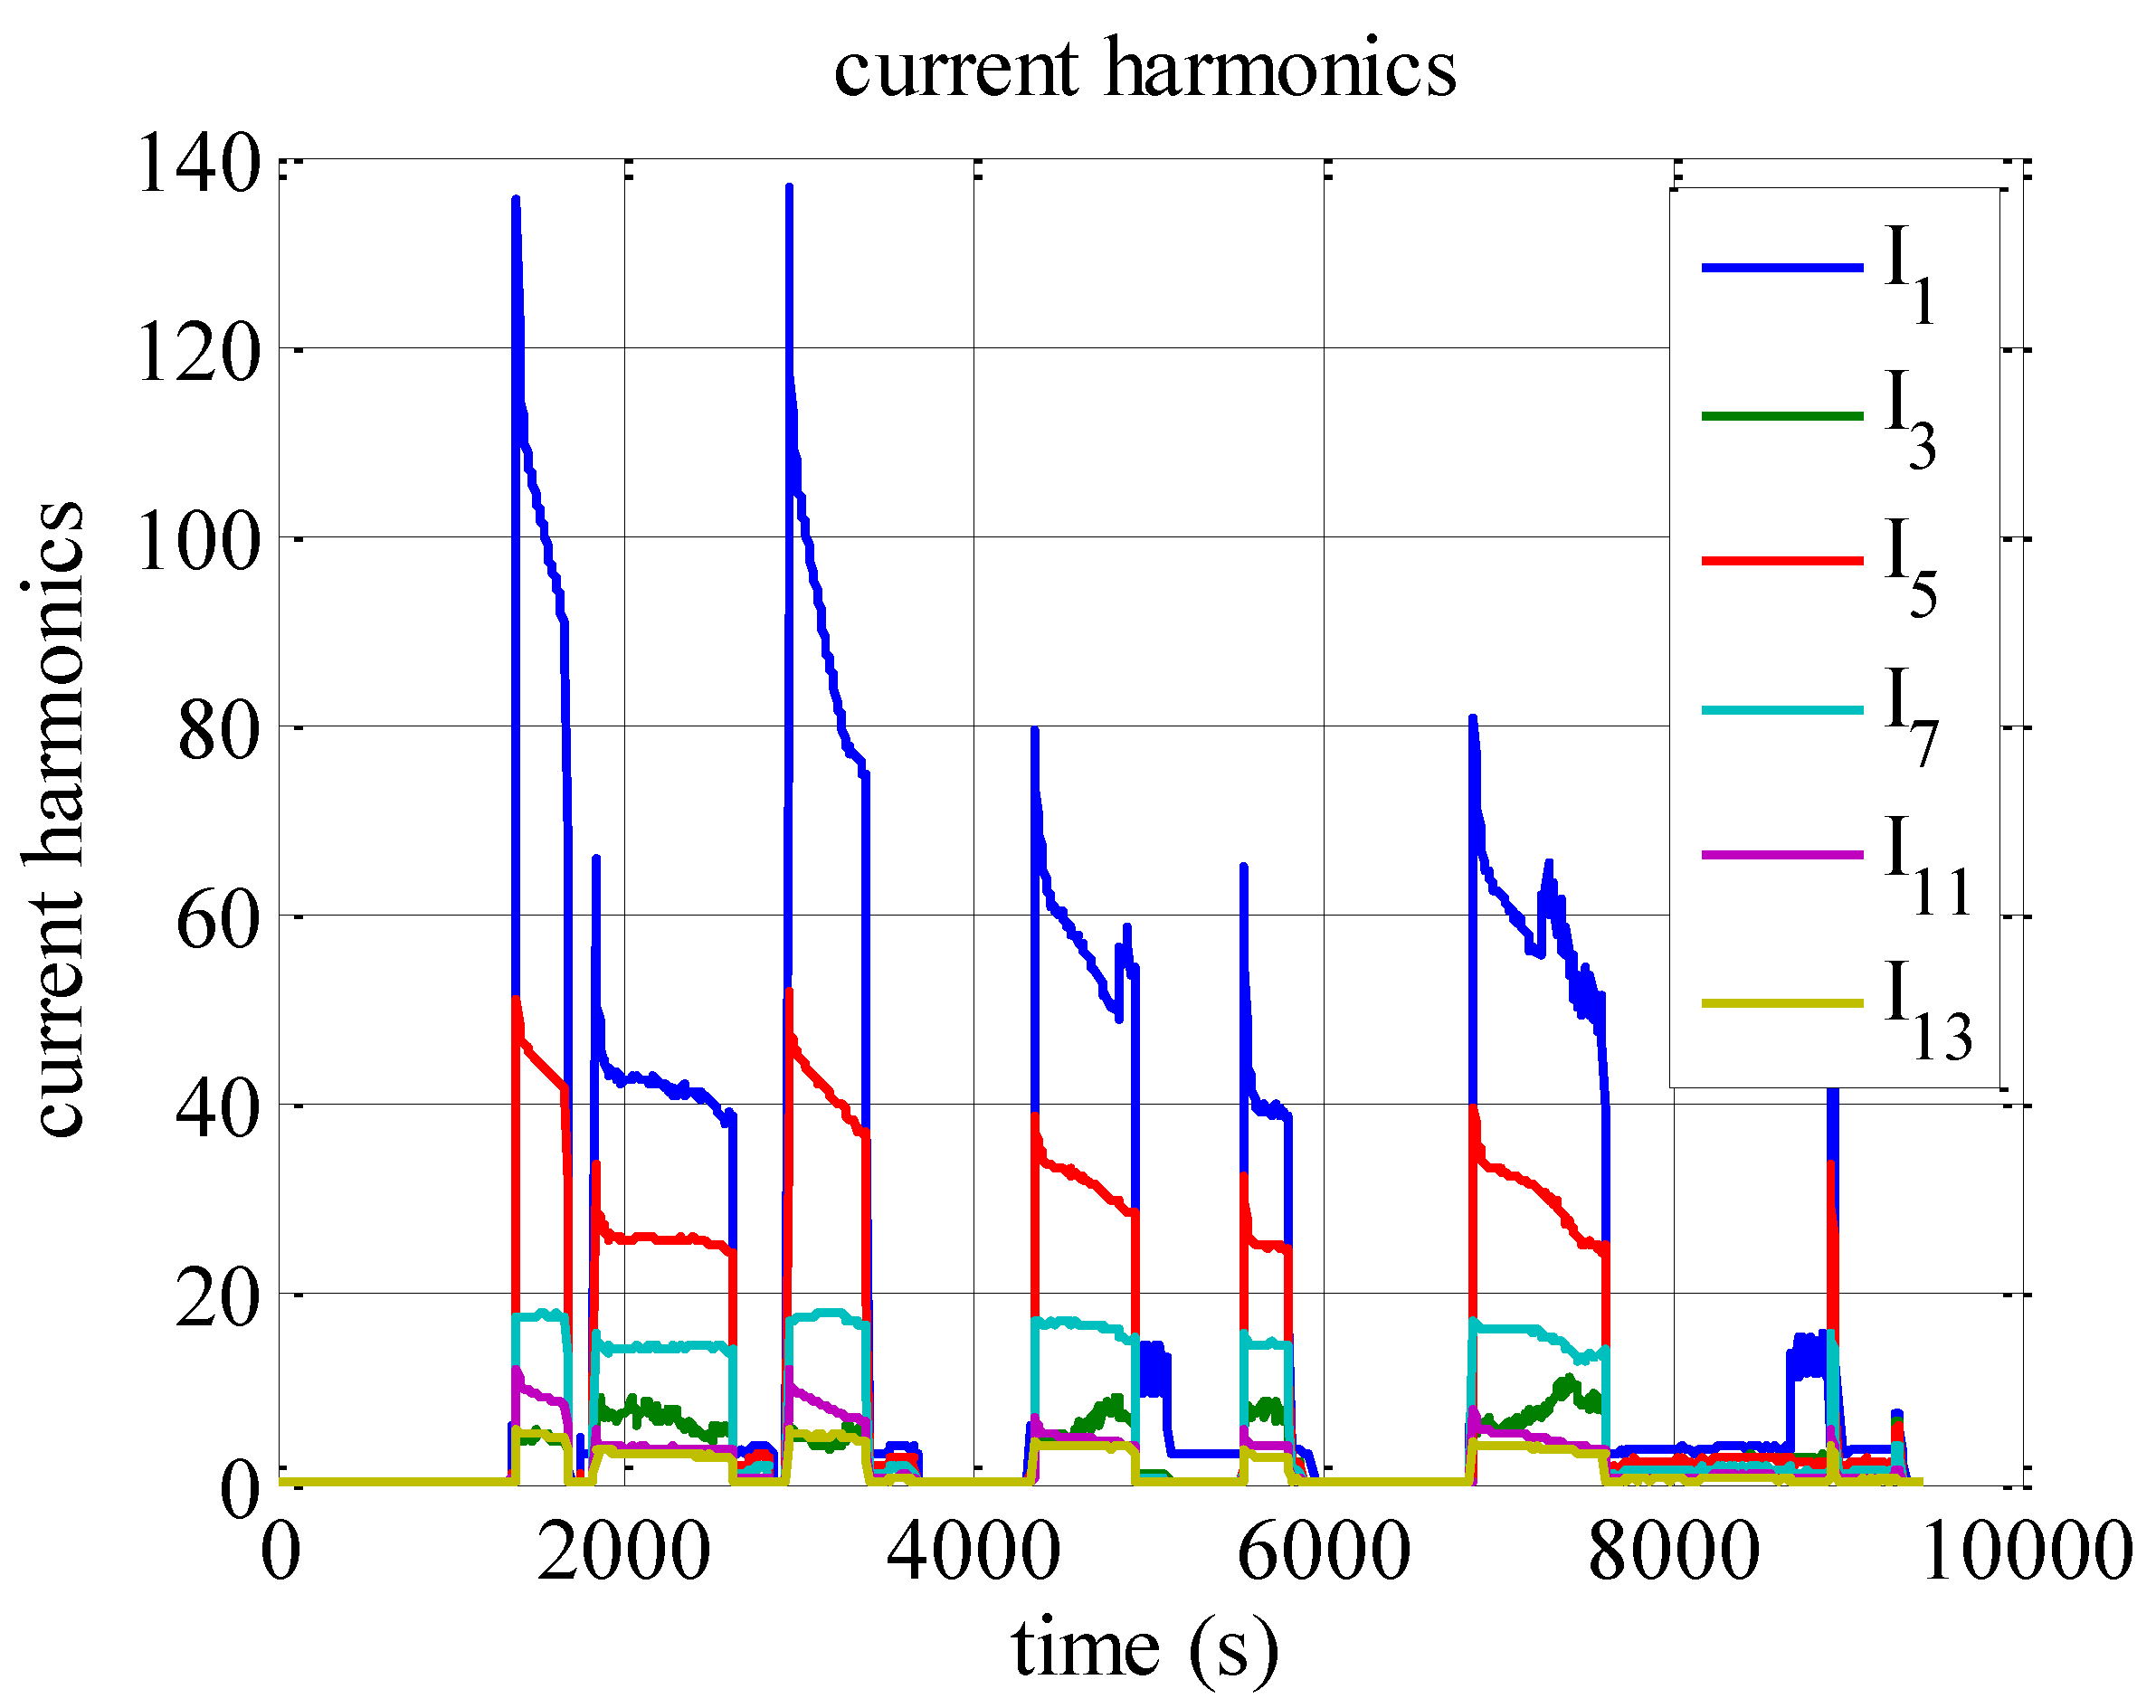
3. The Measurements of a Charger Station

One of the bus stop stations equipped with a charger unit is shown in Figure 1. The bus is connected to the charger through an overhead pantograph. Besides the pantograph, there is box including power electronics.
Figure 1. A project bus stop station equipped with the charging facilities [3].
Batteries 01 00022 g001
Figure 2 shows the basic diagram of the charger unit in which the measurement points are specified. There is a three-phase passive rectifier and then an isolated DC/DC converter. The DC/DC converter can be a parallel connection of smaller modules. The voltages and currents were registered on the AC and DC side of the charger. The measurements were made with two Metrum PQ 120 instruments.
Figure 2. Charger units, as well as the location of the AC and DC side sensors.
Batteries 01 00022 g002
Figure 3 shows the charger measurements for a recorded time interval on 12 April 2014. The voltage, current and power were recorded on the AC side. It can be observed in Figure 3 that the active power peaks at 100 kW. At the same time, the same quantities on the DC were registered and are shown in Figure 4.
Figure 3. Voltage, current and active power on the AC side, 12 April.
Batteries 01 00022 g003
Figure 4. Voltage, current and active power on the DC side.
Batteries 01 00022 g004
Here, it can be noted that the power level reaches 80 kW, which is slightly under the full capacity of the charger, i.e., 120 kW. During the charging, the power goes down as the battery in the bus is reaching its maximum allowed charge. The reason for not reaching a higher power is that the maximum voltage allowed over the battery is reached.
The power on the DC and AC sides is shown in Figure 5. In the figure, it can be noted that the losses appear to be fairly constant. Many of the losses in the magnetic parts, as well as the semiconductor parts are much higher in relative terms, when the power level is low. In addition, there could also be constant loads, such as fans and coolers, which operate regardless of the power level; this can be a reason for the almost constant power losses, regardless of the converter power level. It can also be noted that after the charging has stopped, there is a power consumption of ca. 5 kW; this could definitely be a fan/cooler. The efficiency is presented in Figure 6.
Figure 5. Power on the DC and AC side.
Batteries 01 00022 g005
Figure 6. Measured efficiency of the charger.
Batteries 01 00022 g006
As can be noted in the figure, the efficiency reaches about 85%. This is slightly lower than the efficiency at the rated power that has been stated to be 90.9%. Apart from the fact that the rated power of 120 kW is not reached, another factor that influences this lower value is the fact that there is a cooler consuming 6 kW that could not be turned off.

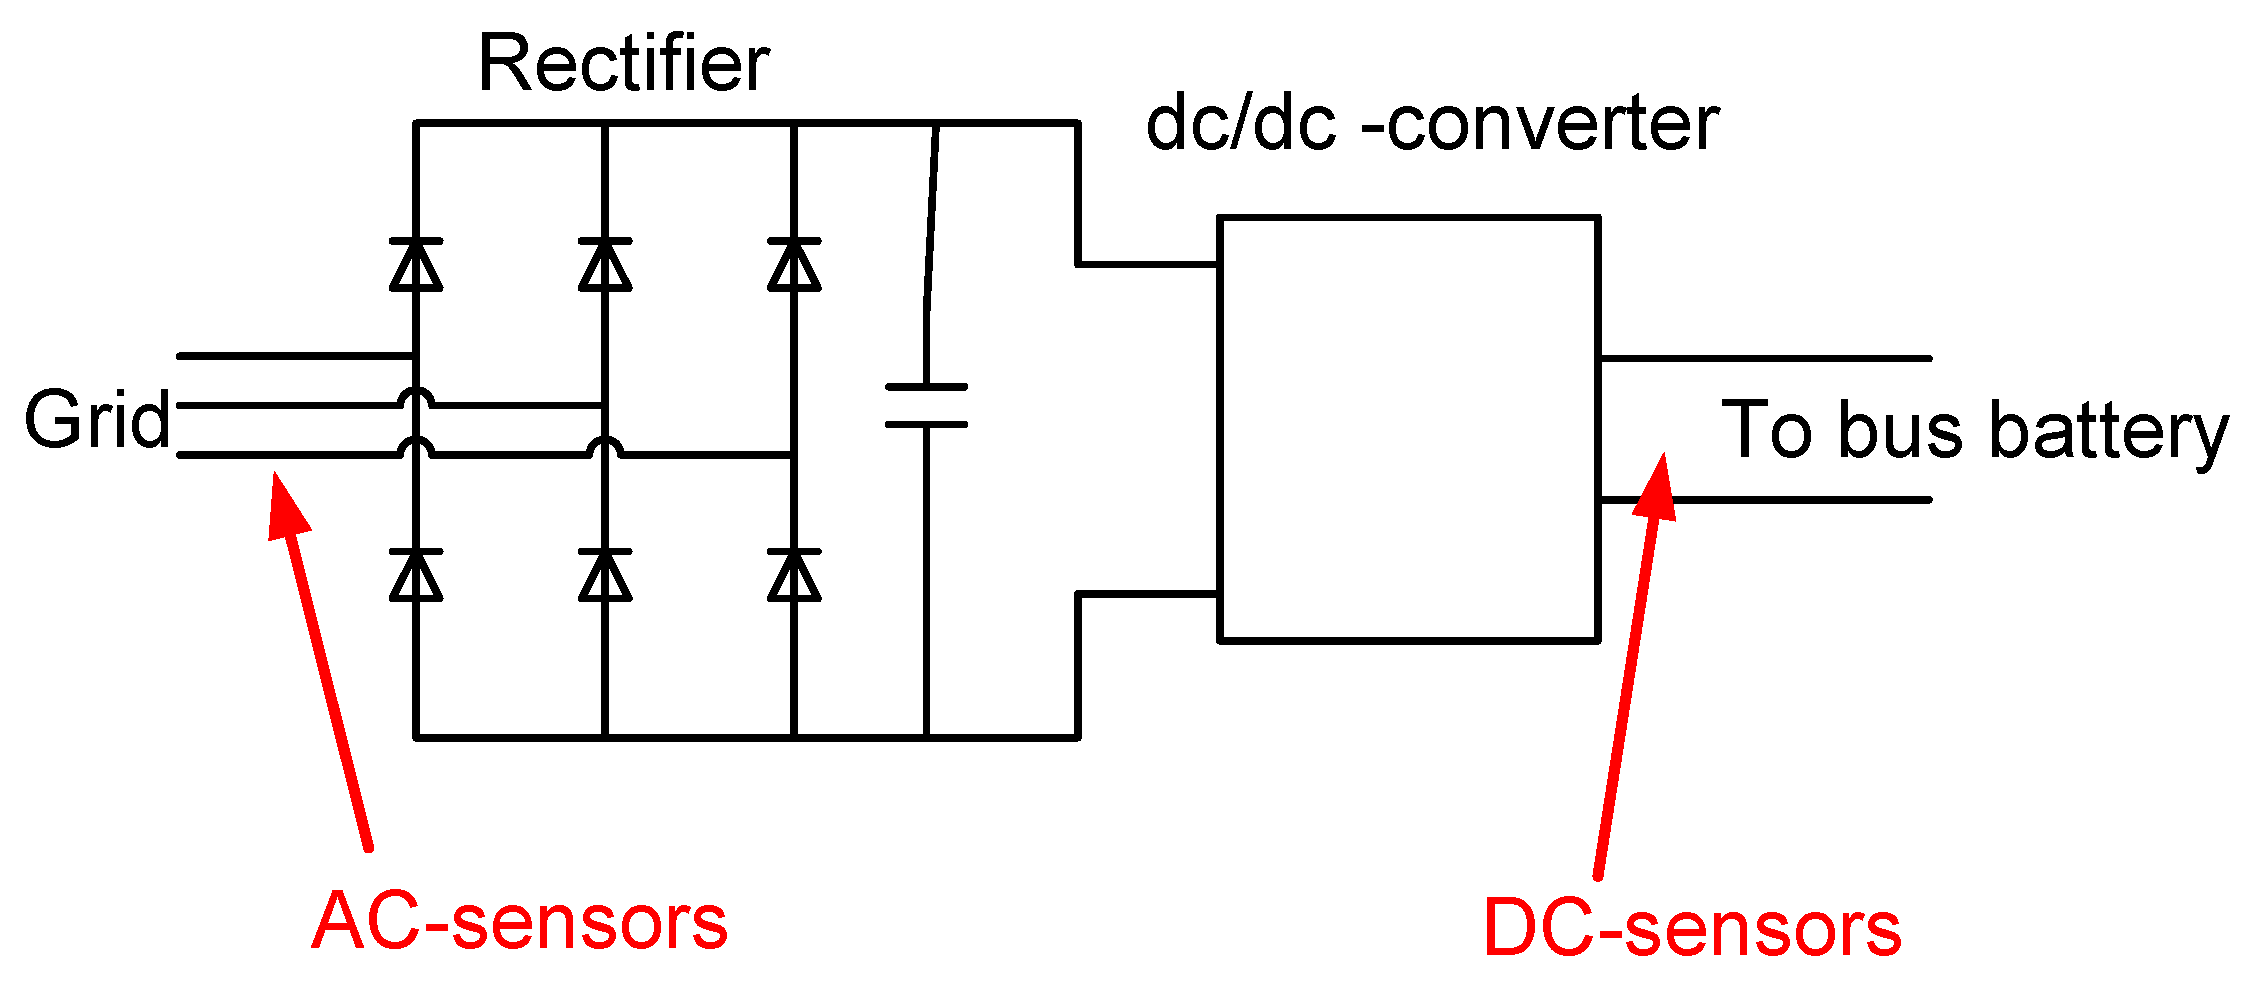
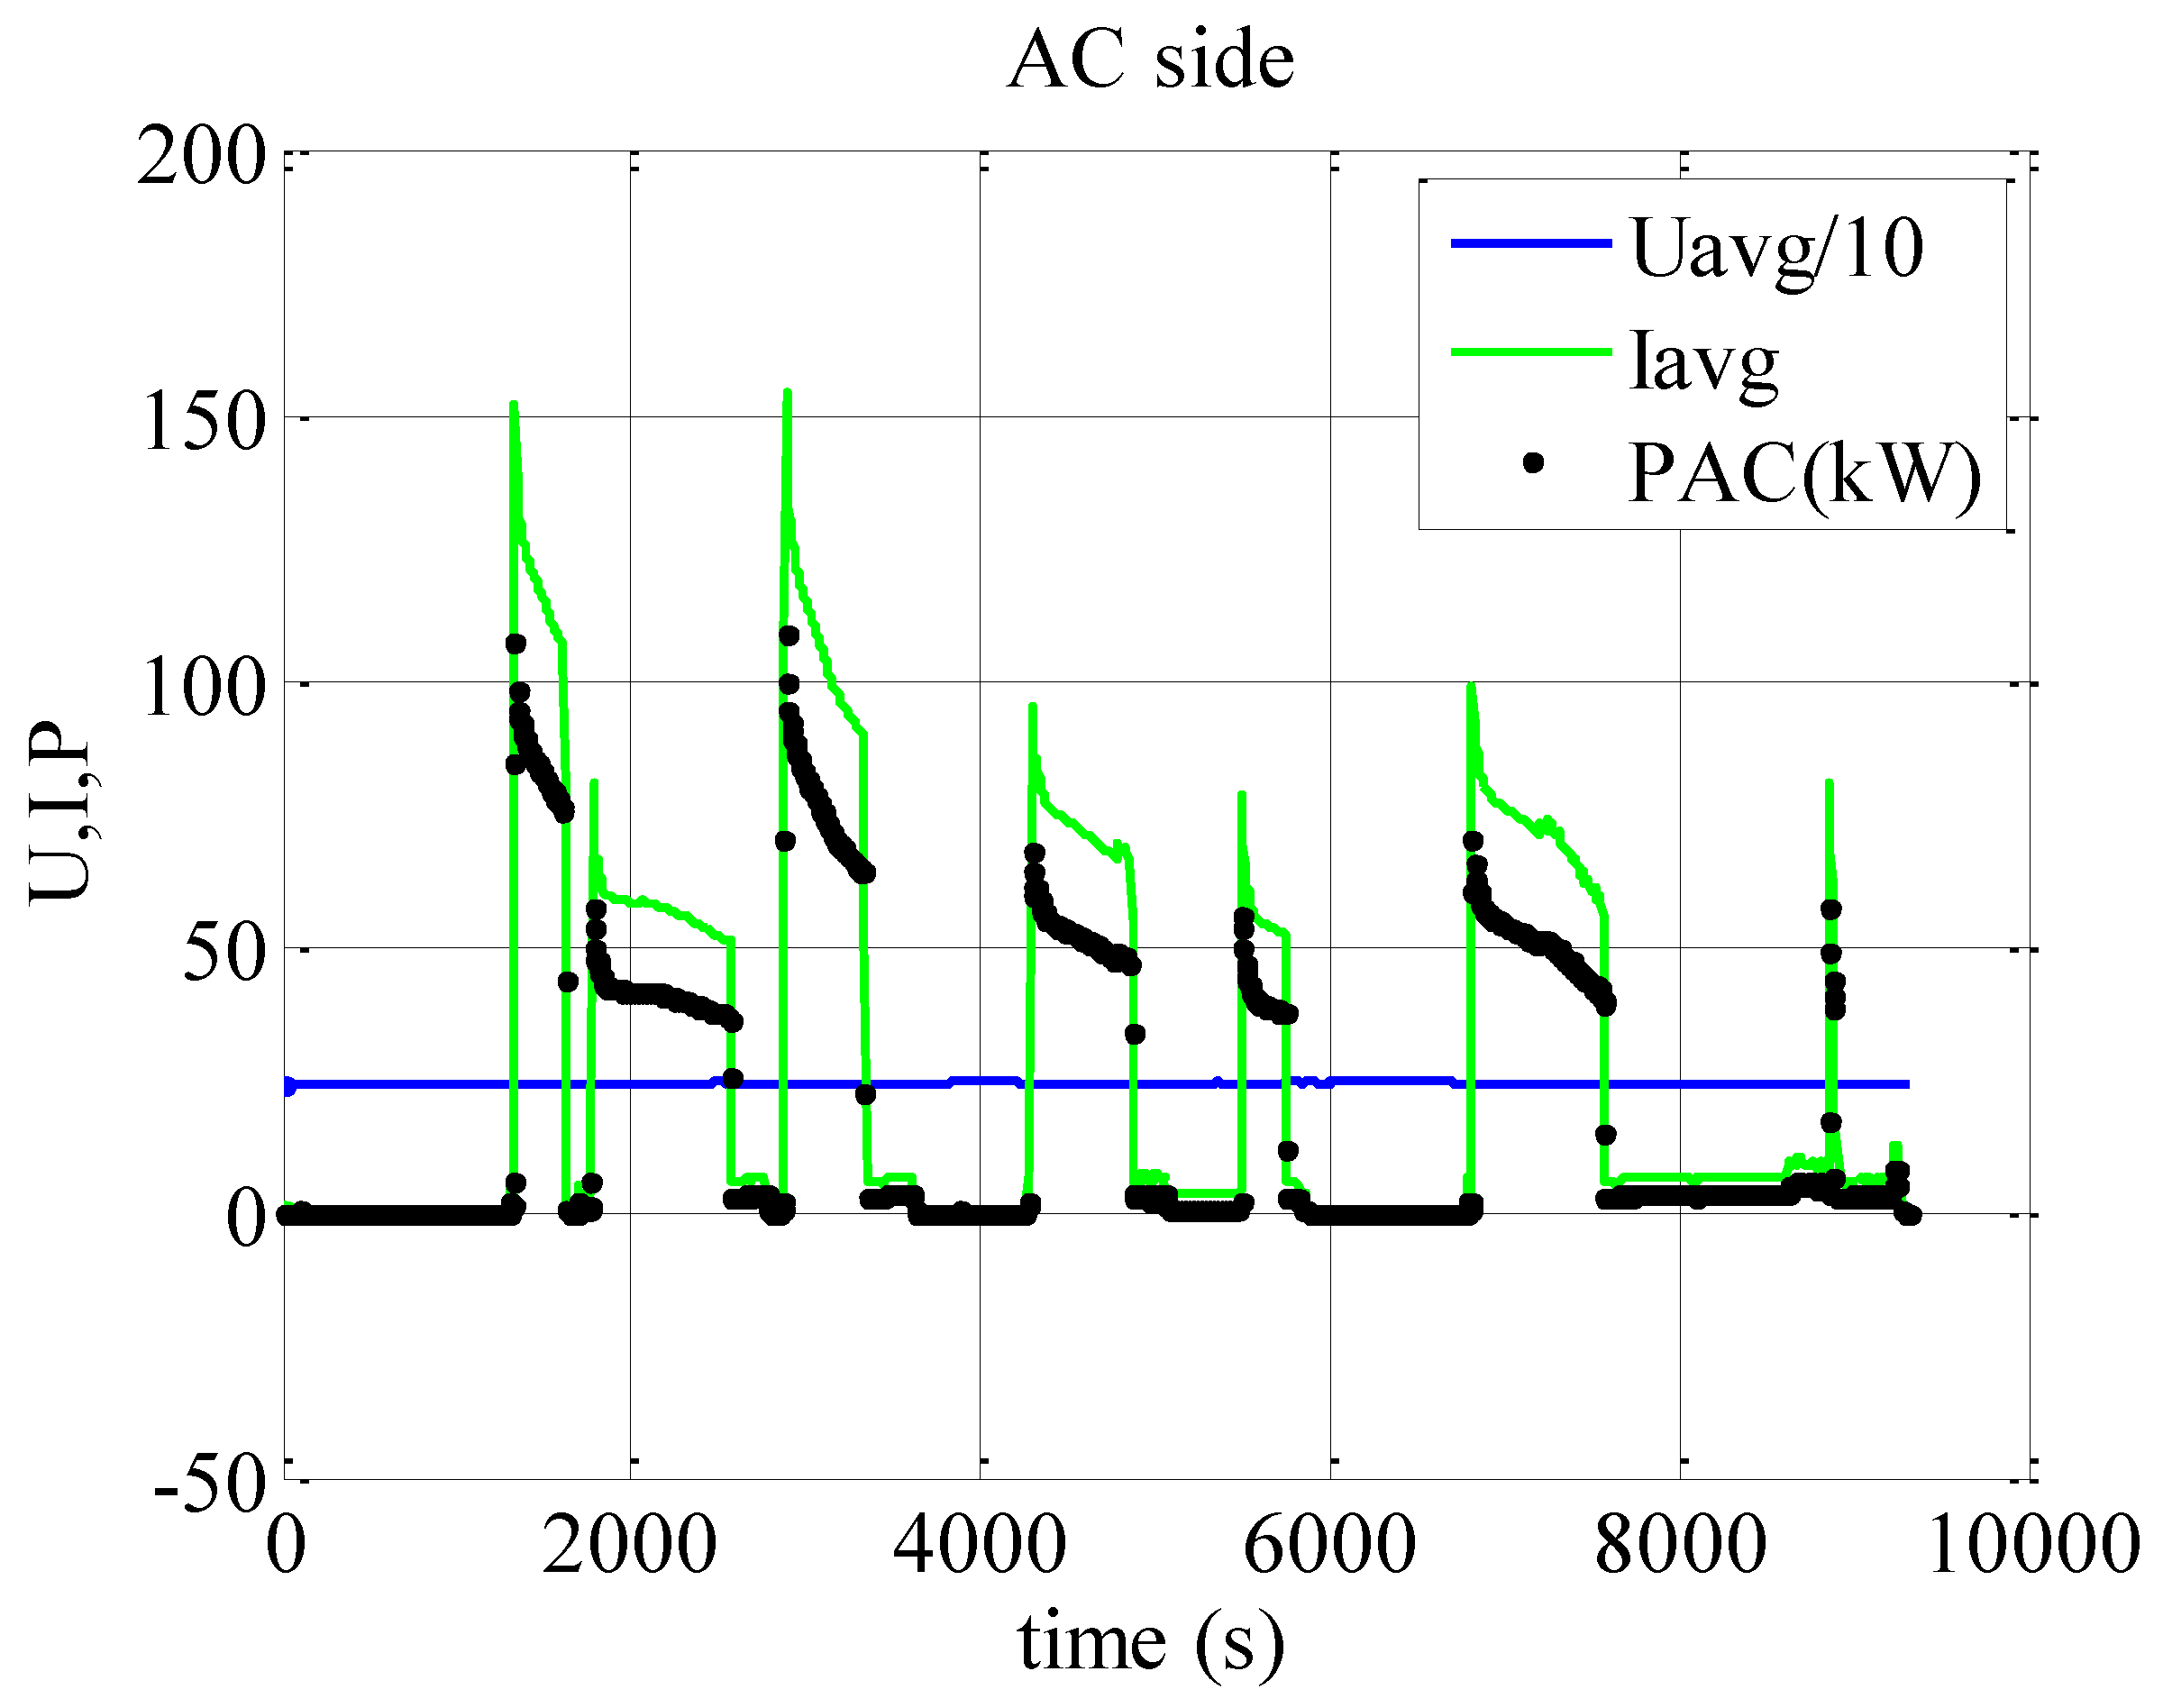
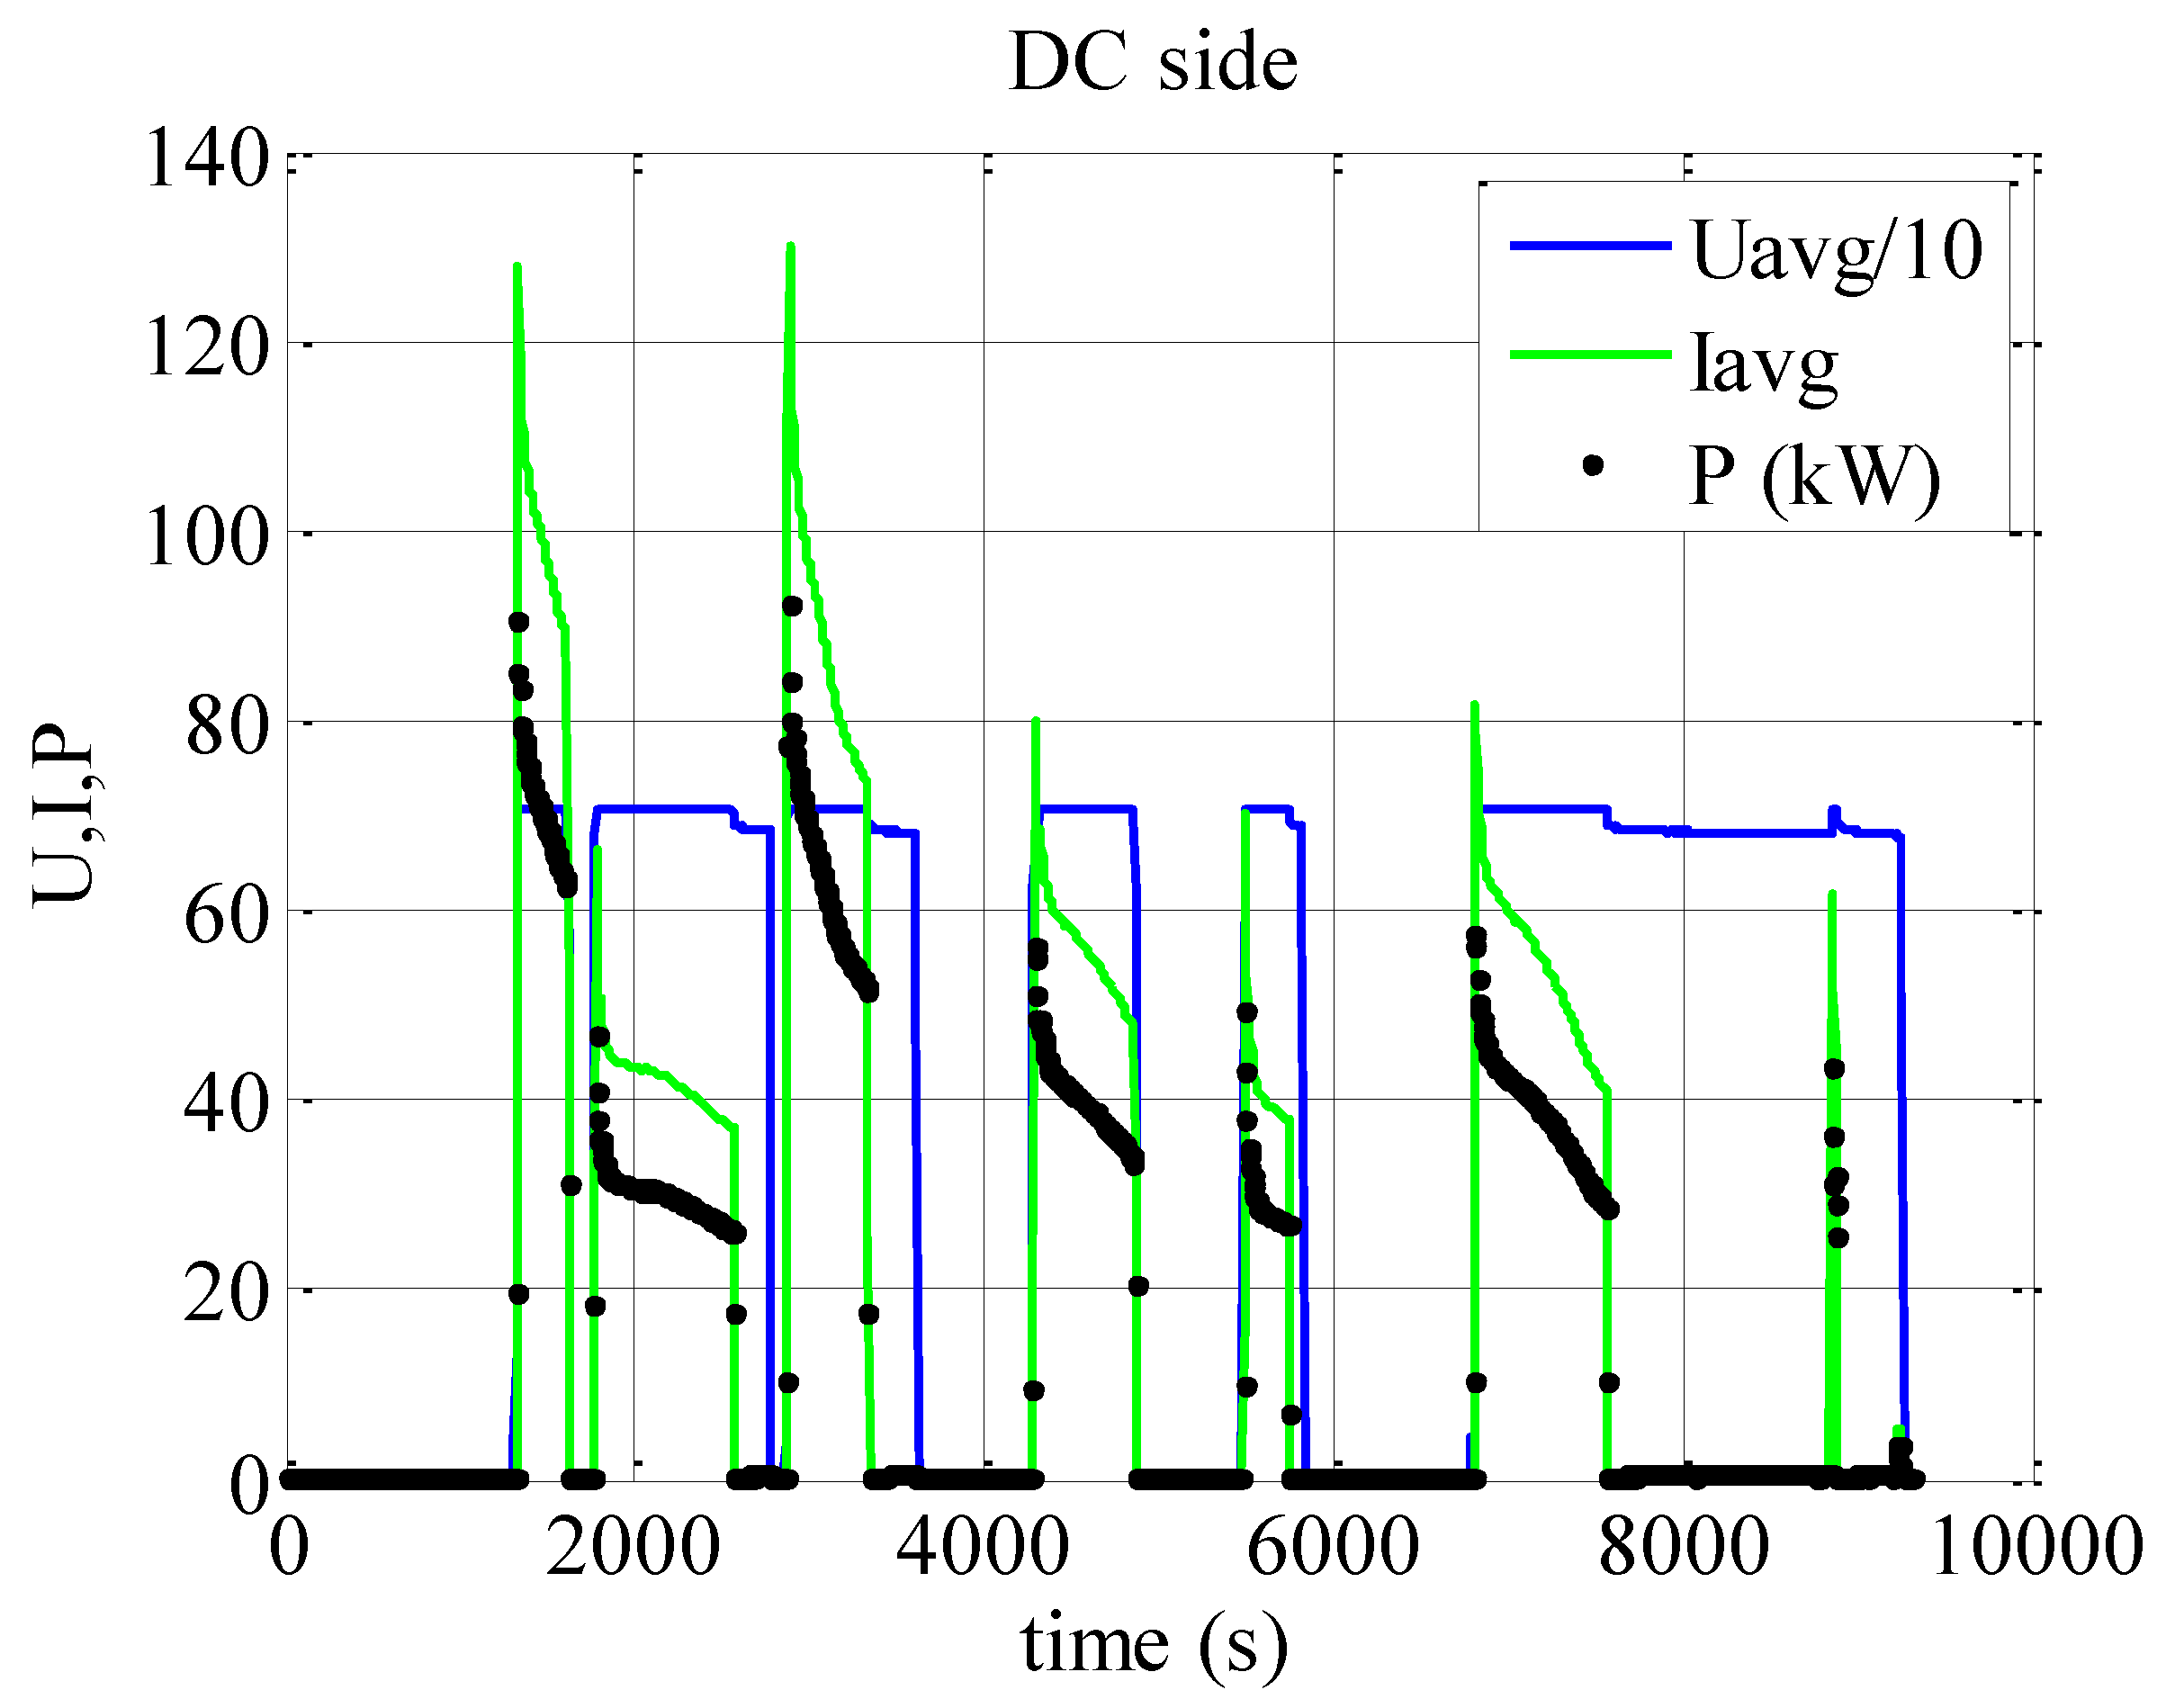
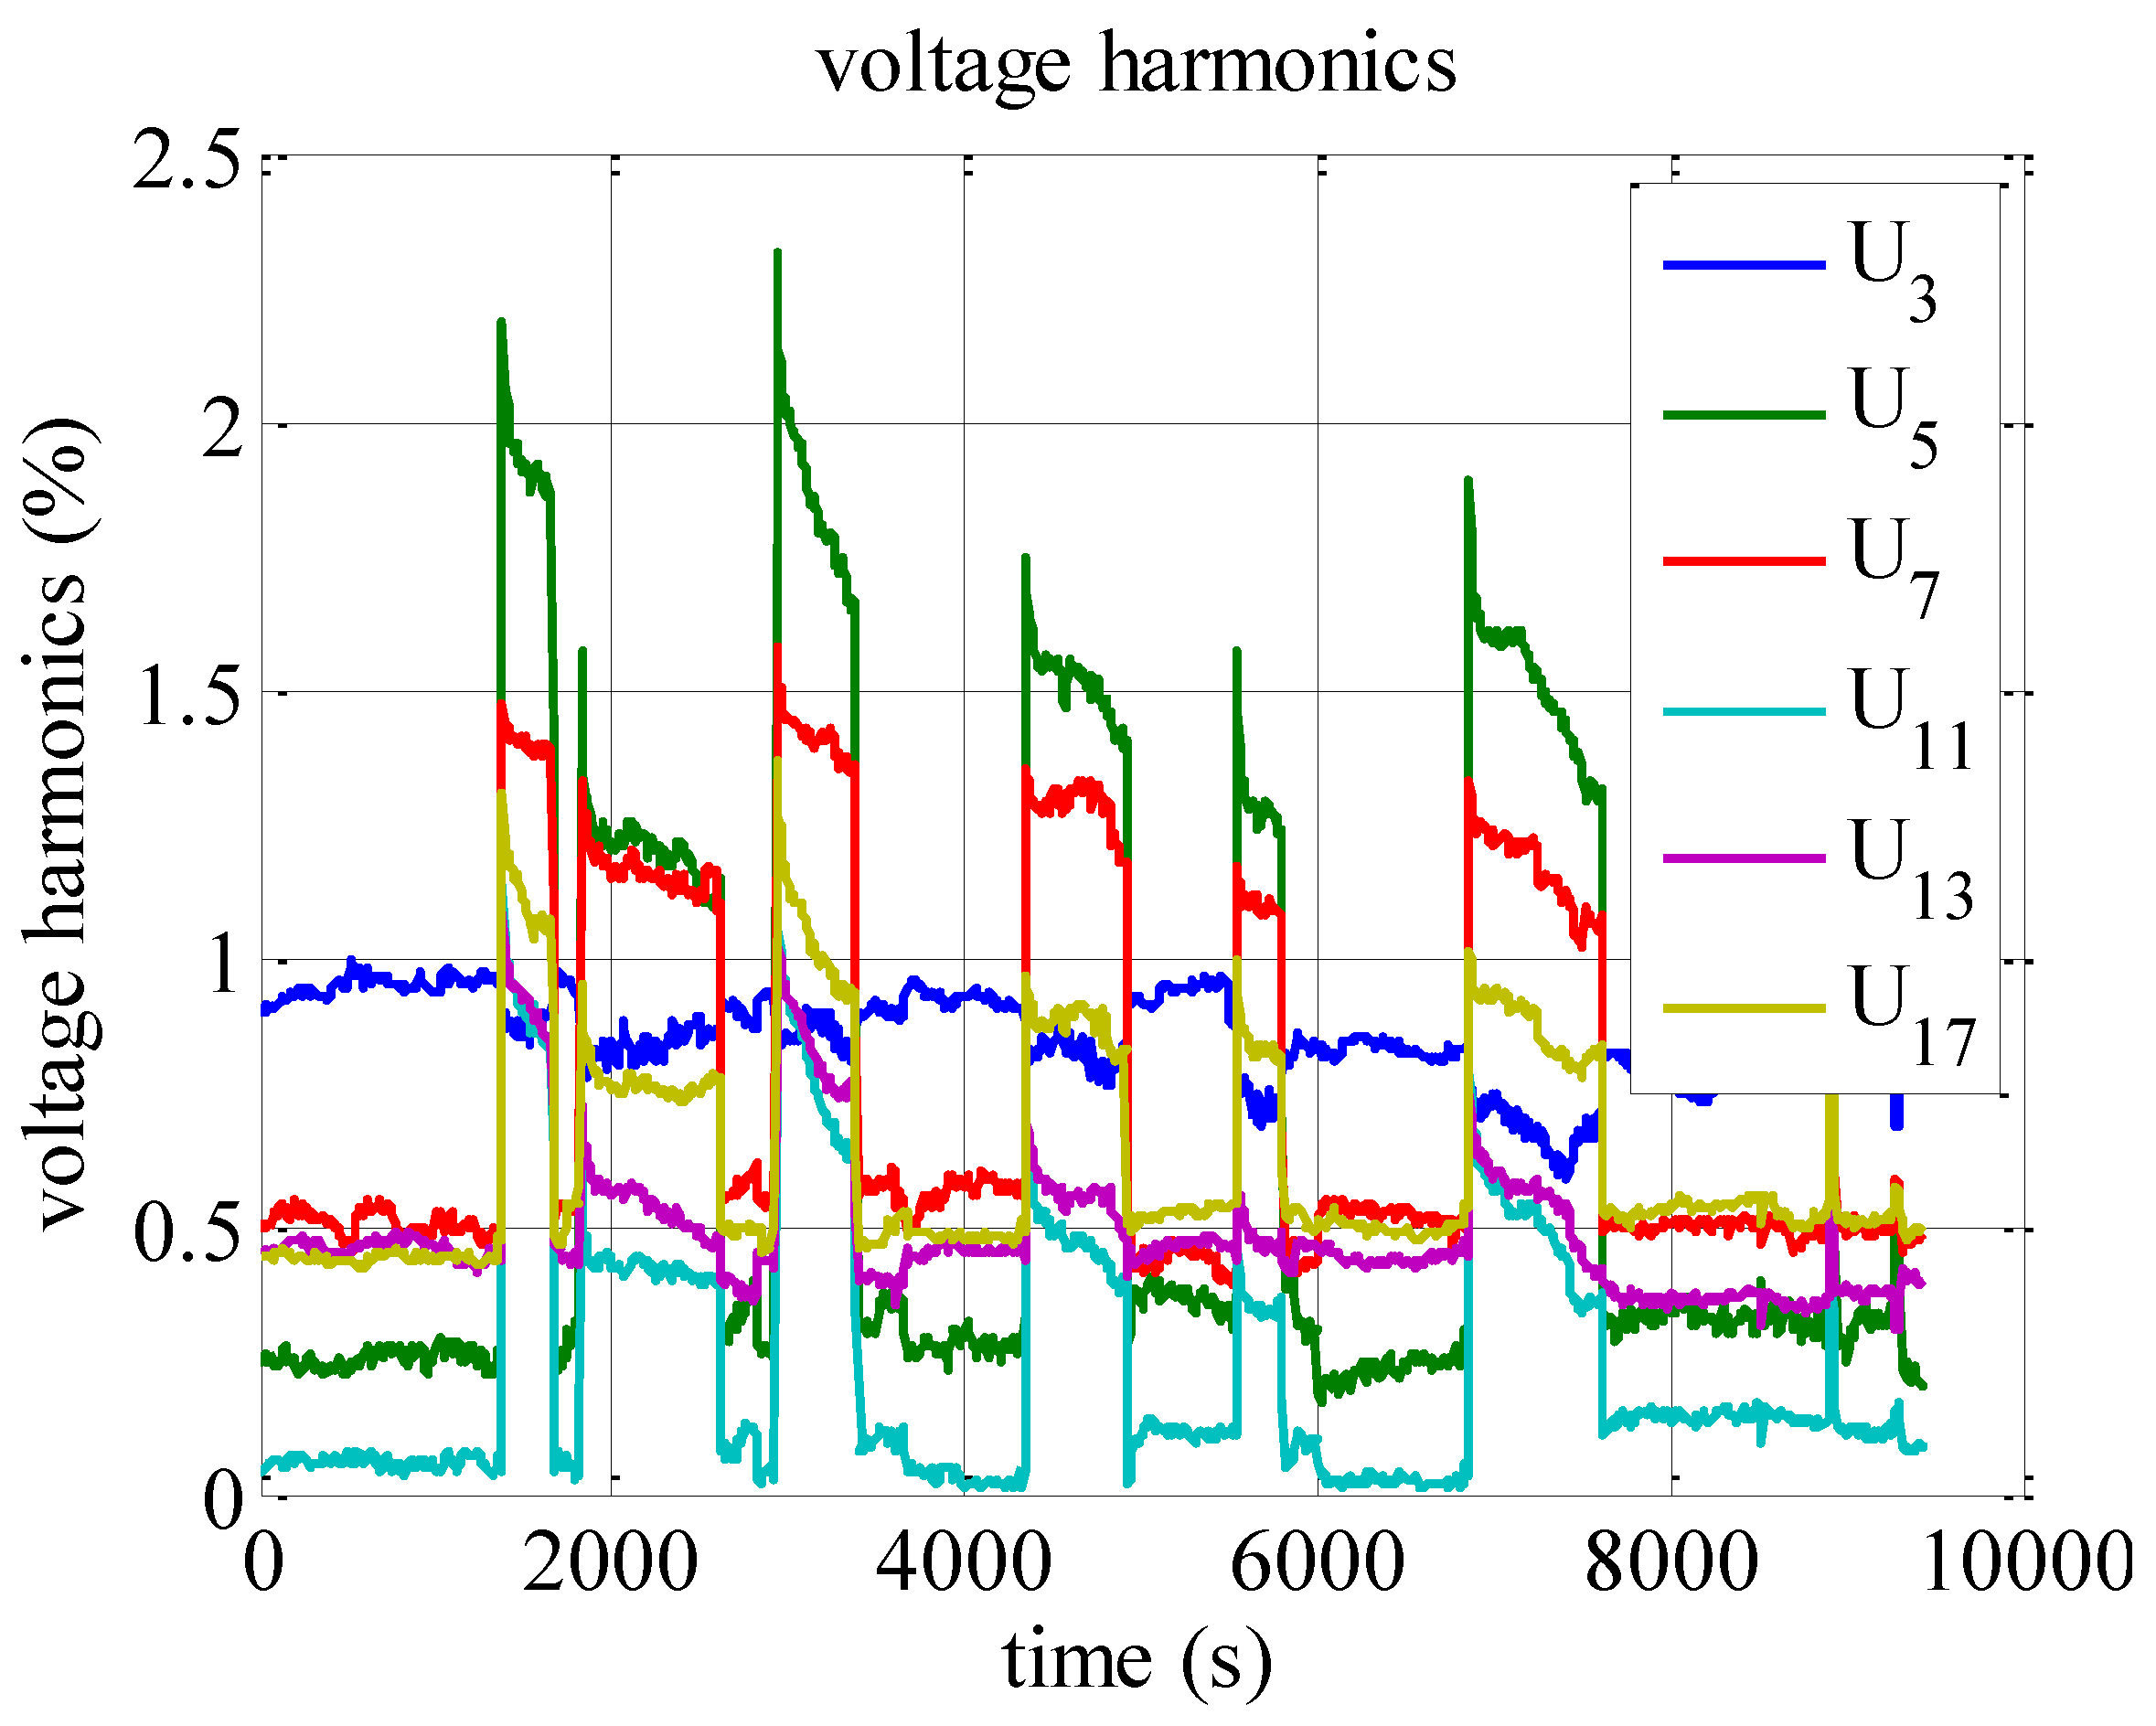
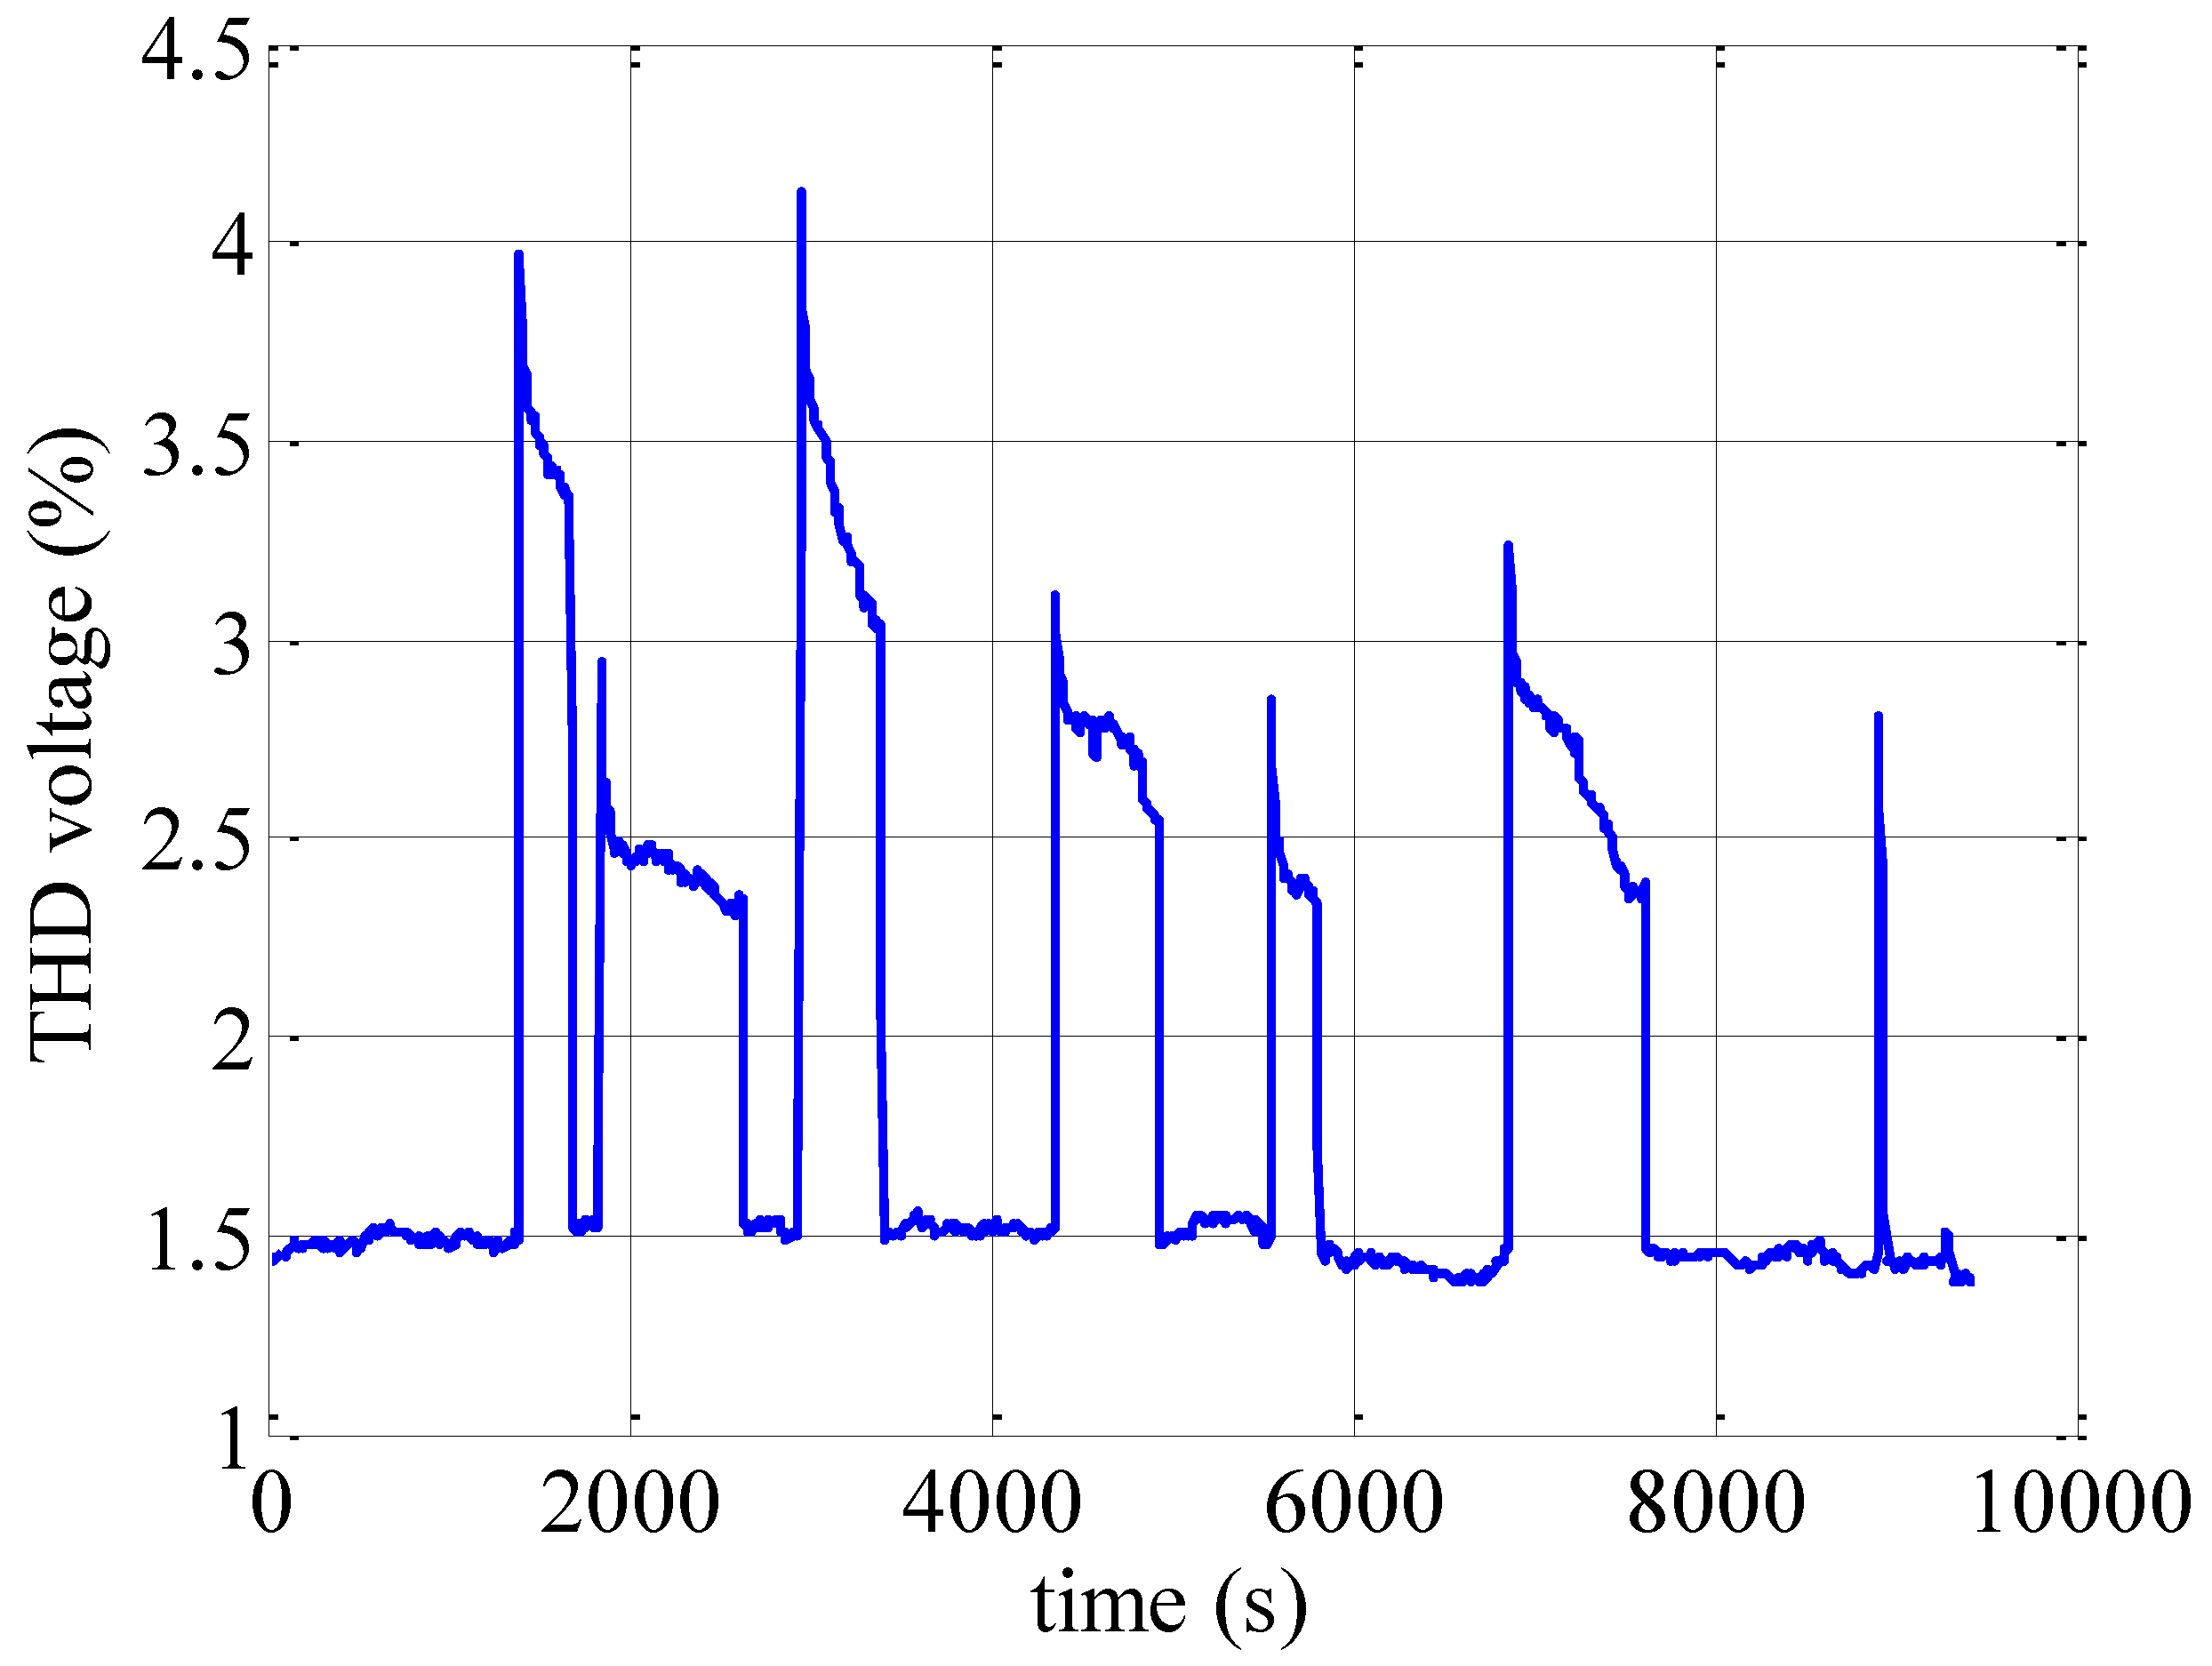
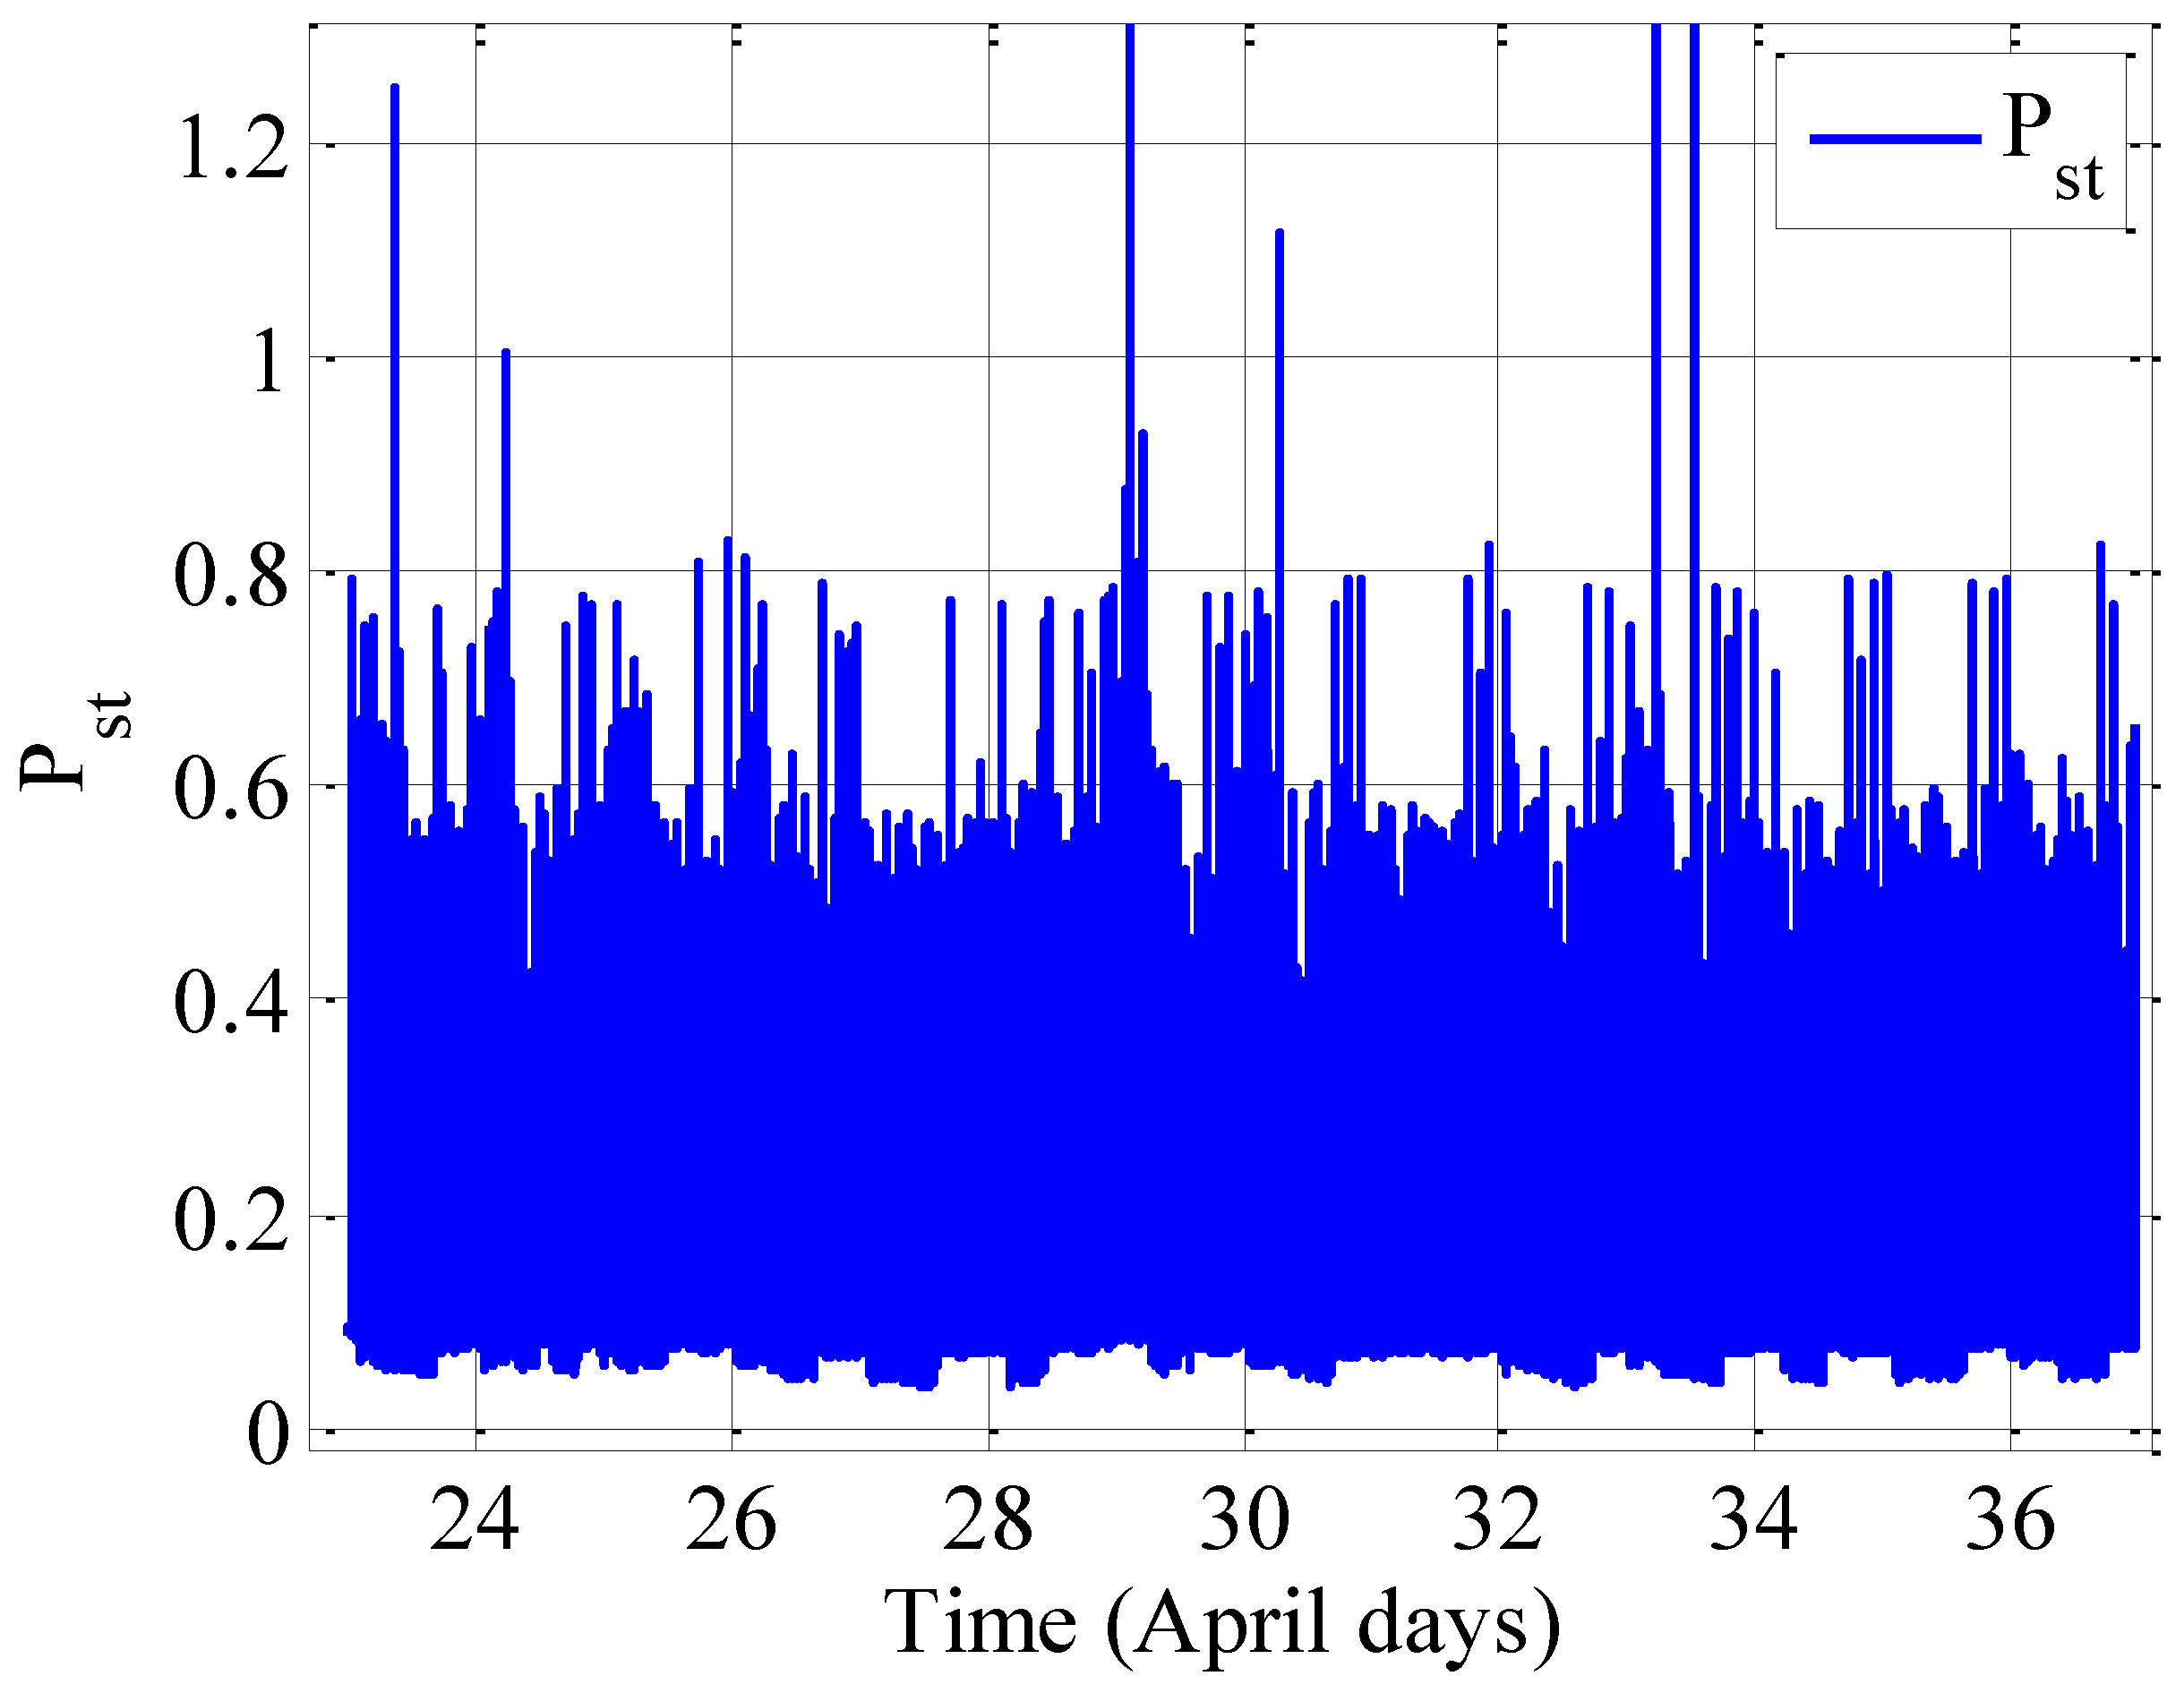
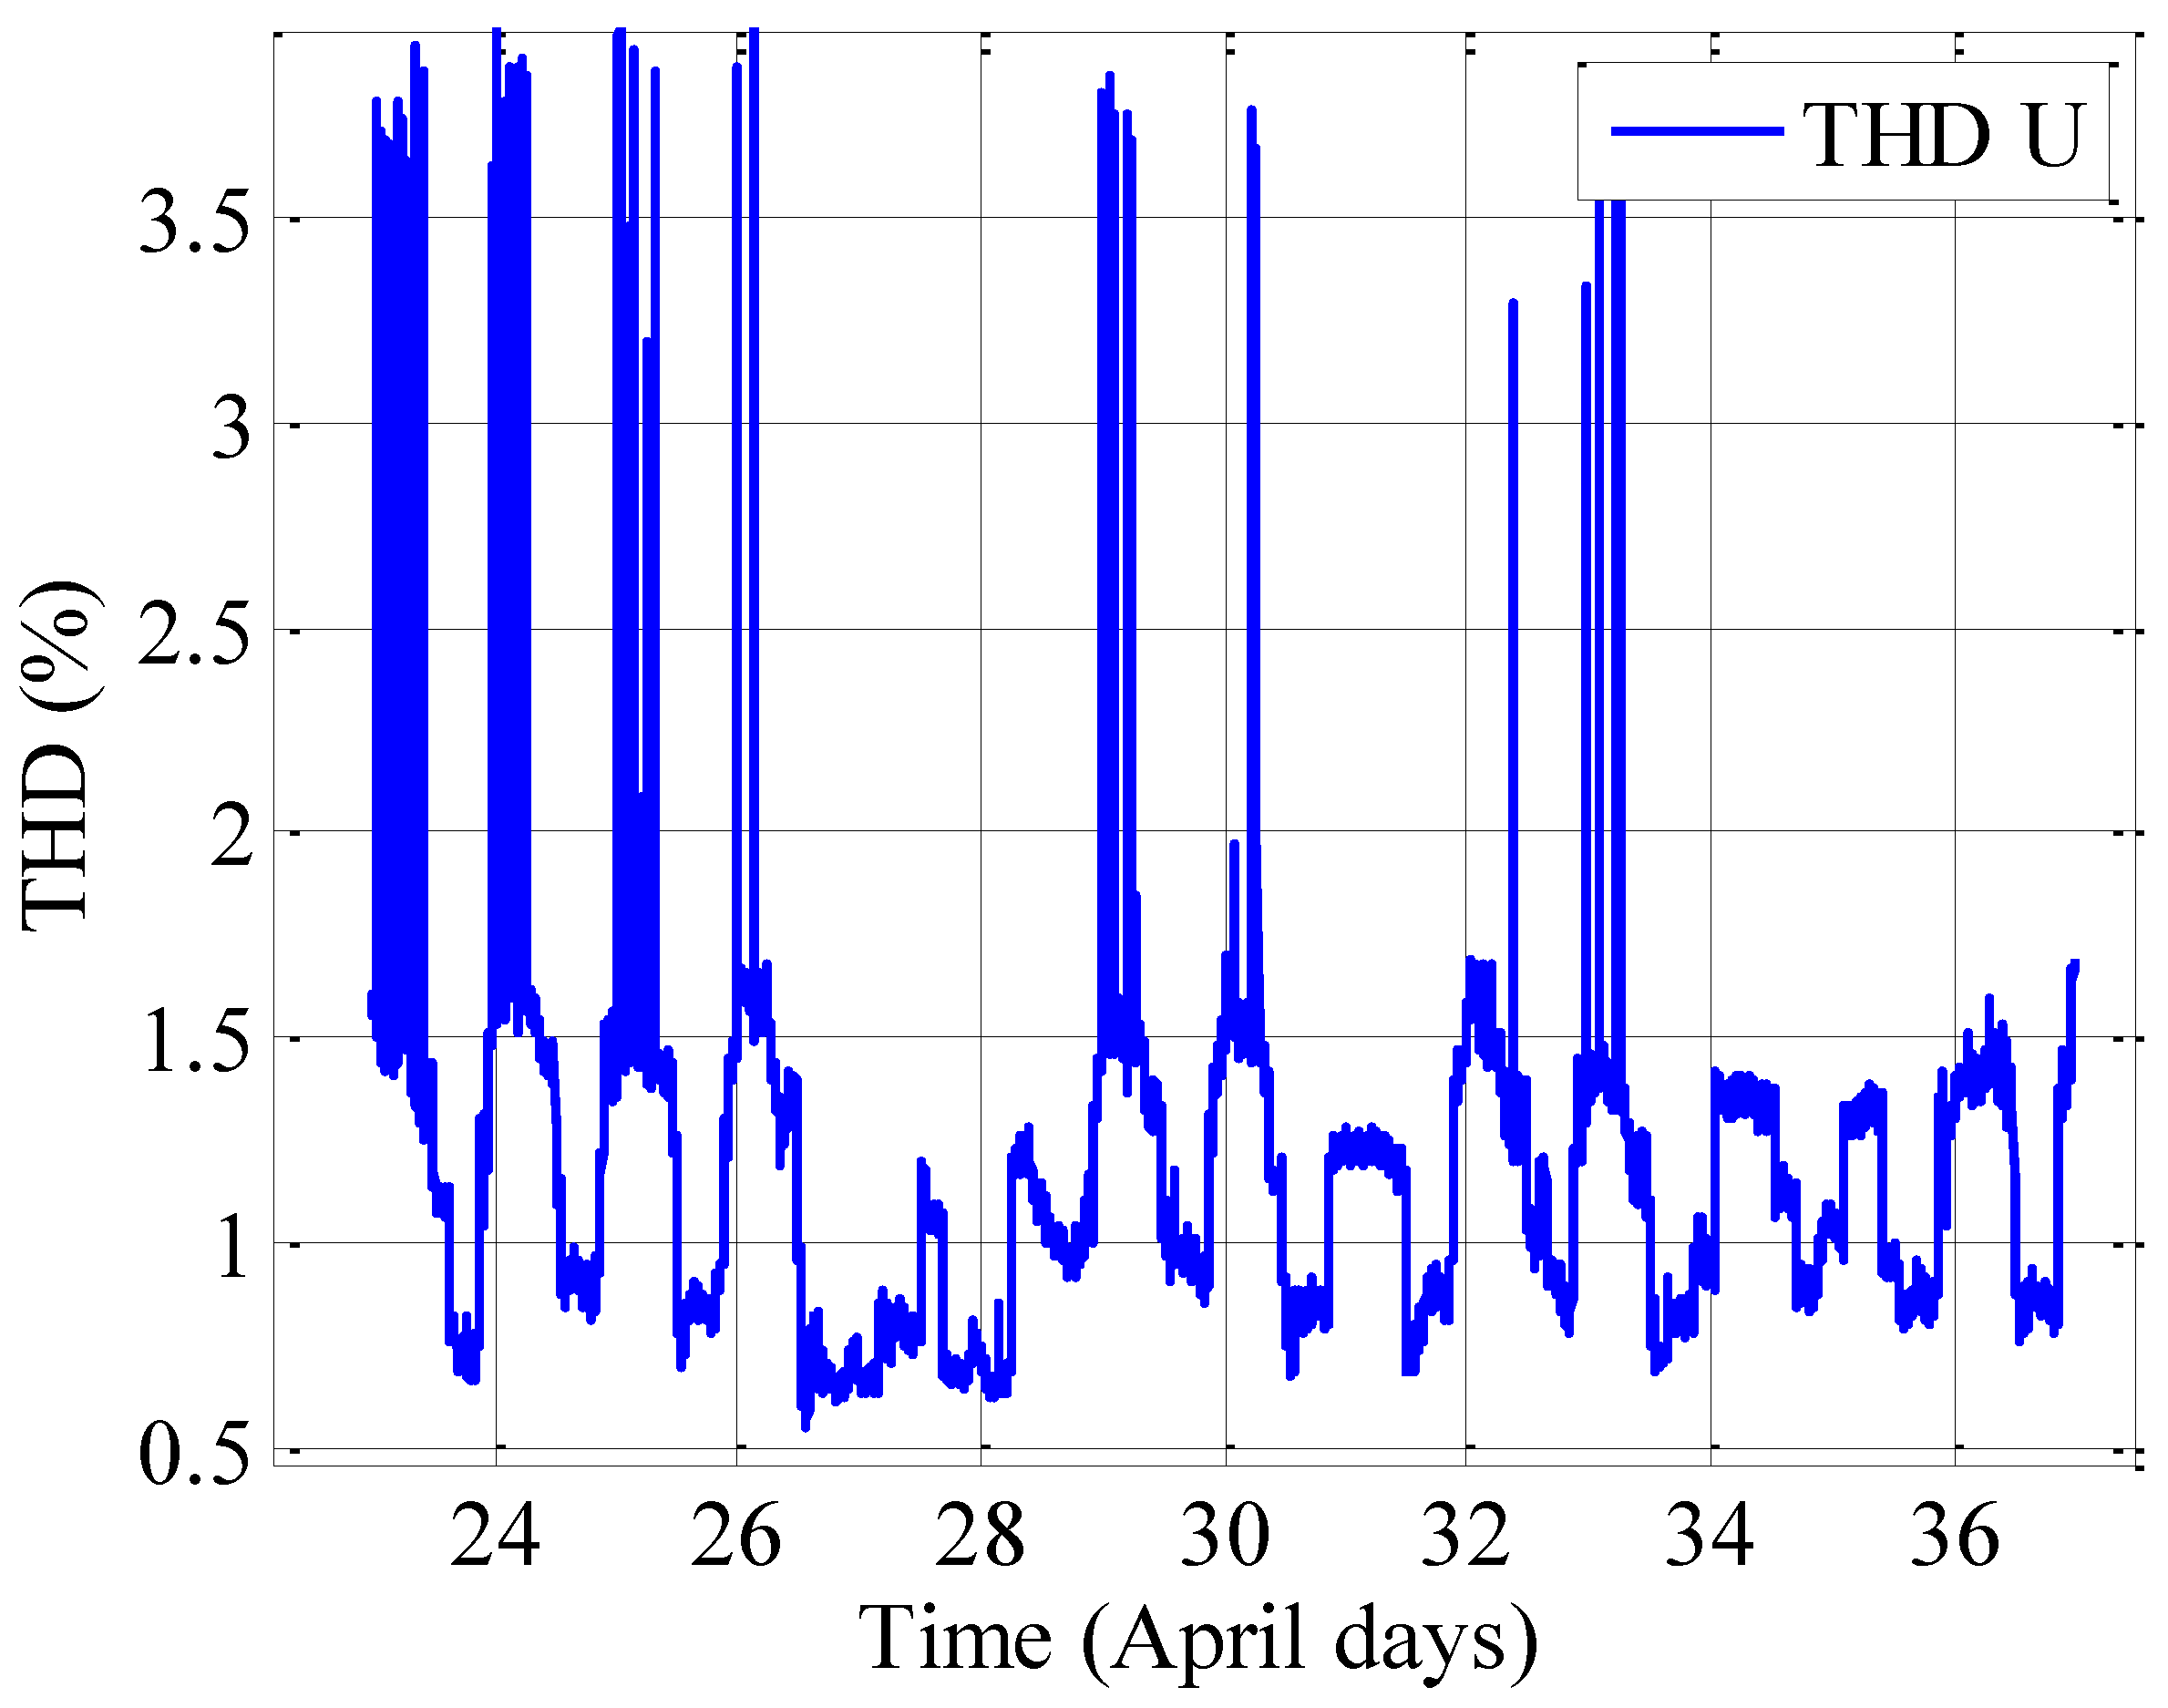
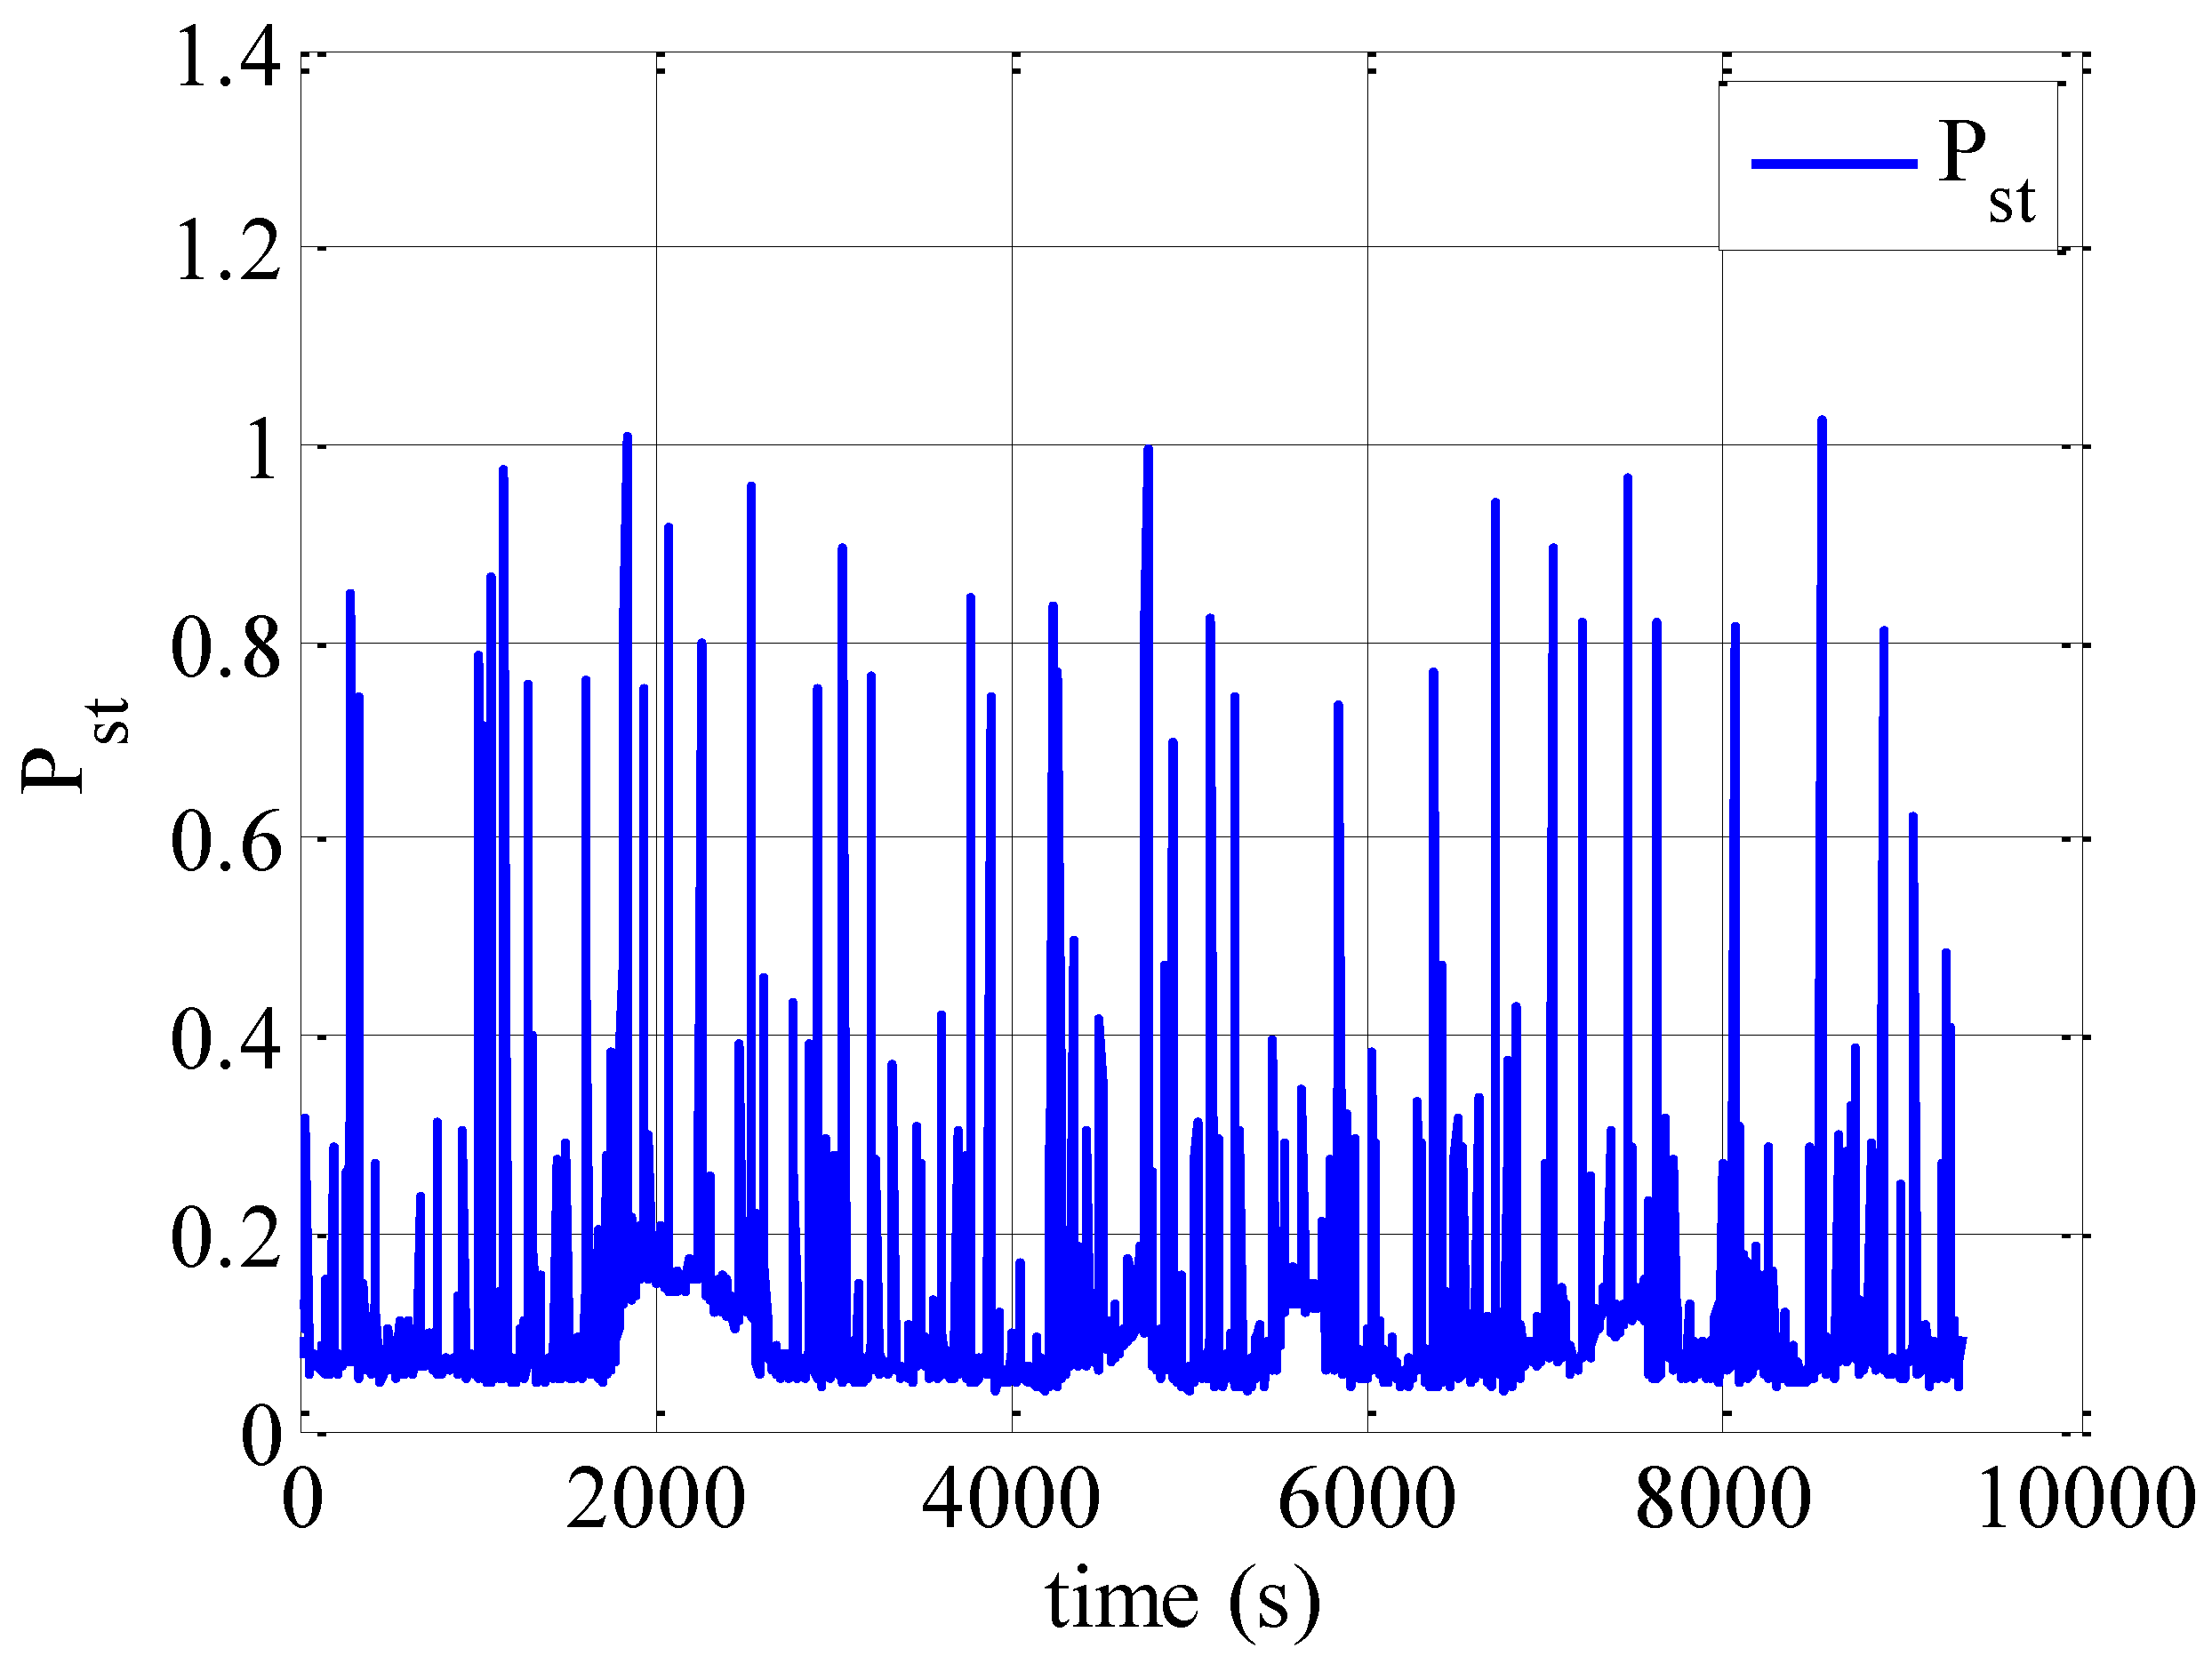
4. The Power Quality Issues

The instantaneous voltage and current waveforms were also recorded, both during charging at the highest recorded level, as presented in Figure 7, as well as when no charging takes place, Figure 8.
Figure 7. Instantaneous voltages and currents during charging.
Batteries 01 00022 g007
Figure 8. Instantaneous voltages and currents when there is no charging.
Batteries 01 00022 g008
The characteristic wave shapes of a diode rectifier are visible in the current in Figure 9. However, if the charger had operated at its full power level, the current waveforms would have been a bit more sinusoidal. Regarding the voltage, it can be seen that the wave shapes during charging are somewhat affected by the distorted current during the charging. In Figure 9, the voltage harmonics can be observed during the 12 April measurements.
Figure 9. Voltage harmonics during the 12 April measurements.
Batteries 01 00022 g009
The total harmonic distortion (THD) is computed using the first 50 harmonics. The calculation procedure can be found in Standard IEC 61000-4-7 [11]. As expected, it is the fifth and seventh harmonic that, during charging, is dominating. When there is no charging, there is considerable amount of the third harmonic, indicating that the phase balancing on this radial is not completely perfect. The resulting voltage THD is presented in Figure 10.
Figure 10. Voltage total harmonic distortion (THD) during the 12 April measurements.
Batteries 01 00022 g010
It is also possible to determine the current THD; see 61000-4-30/FDIS [12]. In Figure 11, the magnitude of each individual current harmonic measured is presented together with the values given by the manufacturer. The reason for the higher values found in the measurements is not the charger itself; instead, it is the fact that the charger cannot operate at full power due to the voltage limitation of the battery. The current waveform is then at this slightly lower maximum current level, slightly more distorted than what it would have been in case that the battery could take the full current capacity of the charger. In Figure 12, the absolute values of the current THD is presented.
Figure 11. Current harmonics, measured, as well as the values given by the manufacturer.
Batteries 01 00022 g011
Figure 12. Current harmonics during the 12 April measurements.
Batteries 01 00022 g012
Finally, in Figure 13, the THD during a 10-day period is displayed. As in the 12 April measurements, it can be seen that the THD reaches 4% when the charger is in operation; otherwise, the THD is about 1.5% during the working time. During nights, the THD goes down, and also, during weekends (27–28 April) and holidays (1 May), the THD is lower.
The THD values are within the limits set by the regulations; however, if a lower level of THD and individual harmonics is desired, filters need to be installed, or the grid interface of the charger should be changed from a diode interface to a transistor interface.
Figure 13. Voltage THD during the 12 April measurements.
Batteries 01 00022 g013
The voltage level is allowed to vary within some certain limits. However, even if the voltage level is within these limits, they might cause a nuisance for the customers. Especially traditional light bulbs, “incandescent light bulbs”, can flicker. About 80 years ago, experiments were made on people of how they perceived this flickering. Based on these experiments, a mathematical derivation was put up that rendered indices, Pst and Plt, the short-term and long-term flicker severity indices [13]. If the value reached one at which people on average could become annoyed and if the indices reached 0.7, some persons could note the flickering. Based on this, utilities put up rules for how unevenly the power a load/source might take/deliver to the network. For instance, wind turbines are only allowed to contribute with an amount of 0.25 to the network.
The flicker emission during the 12 April measurements is presented in Figure 14. It can be noted that the flicker emission continuously varies and often reaches the value of one.
Figure 14. Flicker level during 12 April.
Batteries 01 00022 g014
However, today, other types of illuminations (lead and fluorescent lights) are taking over, so a level of one actually causes no problems for the customers. However, the impact with respect to the charger seems to be small: an increase in the minimum flicker level can be observed during some of the charging instants. The results from 12 April showed a bit higher flicker emission for the longer time period, which is presented in Figure 15.
Figure 15. Flicker emission during the 10-day period.
Batteries 01 00022 g015

5. Conclusions

The main specifications of a more electric transport system based on plug-in buses are presented. The measurement results of the charger unit are presented and analyzed. The results show that there are some harmonic issues towards the utility grid. The main cause of the high harmonic content in the grid side of the charger is utilizing a passive diode rectifier in the front-end of the charger. Active rectification using power electronic switches is recommended to enhance the quality of the charger waveforms.

Acknowledgments

The authors would like to thank Fredrik Persson at Göteborg Energi AB, who was the project leader, for assisting with the measurements and practicalities around the measurements, such as arranging the measuring units. Further, the help from Magnus Ellsén to put up and check the measuring system is gratefully acknowledged.
Moreover, thanks go to Roger Bedell from Opbrid for good discussions, as well as to Tommy Hjelle, Volvo AB, for providing controller area network (CAN) data during charging for verification of the results.
The financial support from Göteborg Energi AB is gratefully acknowledged.

Author Contributions

The first author performed the measurement and analysis. The second author revised the project reports and modified them into the paper format.

Conflicts of Interest

The authors declare no conflict of interest.

References

  1. The Hyper Bus Project: Introducing Plug-in Hybrids in the City of Gothenburg. Available online: http://www.hyperbus.se/download/18.6f0426c148417f553730177/1409928650556/Hyperbus+Rapport_2014_140623.pdf (accessed on 1 November 2015).
  2. Hyper Bus. Facts about Hyper Bus. Available online: http://www.hyperbus.se/engelskwebbplats/hyperbus/abouthyperbus.4.7f30c2451341eef1dc180002873.html (accessed on 1 November 2015).
  3. Fredrik, P. Report in Swedish; Hyperbus Slutrapport: Gothenburg, Sweden, 2015. [Google Scholar]
  4. Hu, X.; Murgovski, N.; Johannesson, L.M.; Egardt, B. Energy efficiency analysis of a series plug-in hybrid electric bus with different energy management strategies and battery sizes. Appl. Energy 2013, 111, 1001–1009. [Google Scholar] [CrossRef]
  5. Lee, S.; Choi, J.; Jeong, K.; Kim, H. A Study of Fuel Economy Improvement in a Plug-in Hybrid Electric Vehicle using Engine on/off and Battery Charging Power Control Based on Driver Characteristics. Energies 2015, 8, 10106–10126. [Google Scholar] [CrossRef]
  6. Peng, J.; Fan, H.; He, H.; Pan, D. A Rule-Based Energy Management Strategy for a Plug-in Hybrid School Bus Based on a Controller Area Network Bus. Energies 2015, 8, 5122–5142. [Google Scholar] [CrossRef]
  7. Chen, Y.; Li, J.; Zhang, S. Design and Analysis of Plug-in Hybrid Electric School Bus. In Proceedings of the 2014 IEEE Conference and Expo Transportation Electrification Asia-Pacific (ITEC Asia-Pacific), Beijing, China, 31 August–3 September 2014; pp. 1–5.
  8. Li, Y.; Zeng, Q.; Wang, C.; Wang, L. Research on Control Strategy for Regenerative Braking of a Plug-in Hybrid Electric City Public Bus. In Proceedings of the Second International Conference on Intelligent Computation Technology and Automation (ICICTA), Changsha, China, 10–11 October 2009; Volume 1, pp. 842–845.
  9. Hu, X.; Murgovski, N.; Johannesson, L.M.; Egardt, B. Optimal Dimensioning and Power Management of a Fuel Cell/Battery Hybrid Bus via Convex Programming. IEEE/ASME Trans. Mechatron. 2014, 20, 457–468. [Google Scholar] [CrossRef]
  10. Hu, X.; Murgovski, N.; Johannesson, L.M.; Egardt, B. Comparison of Three Electrochemical Energy Buffers Applied to a Hybrid Bus Powertrain with Simultaneous Optimal Sizing and Energy Management. IEEE Trans. Intell. Transp. Syst. 2014, 15, 1193–1205. [Google Scholar] [CrossRef]
  11. Electromagnetic Compatibility (EMC)—Part 4-7: Testing and Measurement Techniques—General Guide on Harmonics and Interharmonics Measurements and Instrumentation, for Power Supply Systems and Equipment Connected Thereto; IEC 61000-4-7; International Electrotechnical Commission: Geneva, Switzerland, 2002.
  12. Testing and Measurement Techniques—Power Quality Measurement Methods; IEC 61000-4-30; International Electrotechnical Commission: Geneva, Switzerland, 2003.
  13. Electromagnetic Compatibility (EMC)—Part 4 Testing and Measurement Techniques—Section 15: Flickermeter—Functional and Design Specifications; IEC 61000-4-15; International Electrotechnical Commission: Geneva, Switzerland, 2003.

