Article

Temperature-Dependent Discharge Capability of High-Power LFP Battery Cells for Starter Battery Applications


1
Electrical Energy Storage Technology, Technische Universität Berlin, Einsteinufer 11, 10587 Berlin, Germany
2
Stefan Wätzold Projekt GmbH, Mottlaupfad 15, 13503 Berlin, Germany
3
Data Science, Stuttgart Media University, Nobelstrasse 10, 70569 Stuttgart, Germany
4
Englisches Seminar, Christian-Albrechts-Universität zu Kiel, Leibnizstraße 10, 24118 Kiel, Germany
*
Authors to whom correspondence should be addressed.
Batteries 2026, 12(6), 222; https://doi.org/10.3390/batteries12060222
Submission received: 22 April 2026 / Revised: 8 June 2026 / Accepted: 16 June 2026 / Published: 19 June 2026

Abstract

This study investigates the temperature-dependence performance of high-power lithium iron phosphate (LFP) cells for automotive starter batteries. Temperature effects on high-power LFP cells are contextualised based on pertinent literature in order to compare the typical capacity behaviour of lead–acid batteries with LFP. Experiments were conducted on five cylindrical LFP cell types in a thermal chamber across ambient temperatures from +45 °C to −30 °C using a 9 C discharge regime aligned with automotive standards. Electrical and thermal behaviours were analysed, including energy yield, power output, and surface temperature monitored by sensors and thermal imaging for room temperature. Energy output decreased exponentially with temperature but remained above 70% for most LFP cells at −18 °C, while only one cell type was functional at −30 °C. Thermal analysis at ambient temperature confirmed homogeneous temperature distribution without hotspots and low overall heating (from 2 °C to 14 °C), indicating no need for additional cooling for starter battery applications. A conservative power analysis indicated that 4 kW at −30 °C would require a 28P4S 26650 configuration, representing a lower-bound estimate. We argue that even this conservative figure suggests a potential for weight reduction compared with lead–acid systems. Energy-based Pb-equivalence factors of approximately 1.2 at −18 °C and 3 at −30 °C were derived. A preliminary guideline for cell dimensioning based on measurements at 25 °C is proposed to address discrepancies between data sheet specifications and actual performance for pack configuration based on required power.

Graphical Abstract

1. Introduction

Ensuring adequate capacity and the ability to deliver sufficient current above the minimal voltage threshold is crucial for starter batteries. Cylindrical high-power lithium iron phosphate (LFP) cells, which can deliver up to 96.7% of their available energy in high-power tests [1,2], present a lightweight alternative for use in starter–lighting–ignition batteries [3] which is more durable than lead–acid batteries [4]. The feasibility of replacing lead–acid batteries with these cells depends on factors such as the required cranking power and the ambient temperature conditions. Investigations at Audi indicate that the required minimal capacity necessitates determination by standby current, state of charge, or cold-cranking power at −18 °C [5]. As automobiles are exposed to a range of ambient temperatures, with tests at Porsche conducted at temperatures as low as −30 °C [6], it is crucial to analyse the performance of LFP cells across a variety of ambient temperatures. Modelling the electrochemical reaction of LFP, particularly at low temperatures, is challenging [7]. While no significant capacity reduction was reported until 0 °C [8], one study found that the available capacity decreased by 75% from 20 °C to −10 °C [9]. The ohmic resistance of high-power lithium cells increases exponentially at low temperatures and is threefold higher at −30 °C than at 50 °C [10]. A comparative analysis of lithium titanate and LFP demonstrated lower energy loss for LFP [11] at low temperatures, rendering it a viable option for low-temperature utilisation.
Lithium-based starter–lighting–ignition batteries exhibit a propensity for increased self-heating due to their lower heat capacity and higher internal losses at low temperatures [12], necessitating specific test regimes that differ from established EN standards for cold-cranking pulse profiles [13]. Experiments with a 10 s 9 A/Ah discharging current, 10 s pause, and an unlimited 5.4 A/Ah pulse scheme at low temperatures demonstrated that LFP battery packs could potentially replace traditional lead batteries, exhibiting comparable cold-cranking performance down to −18 °C [14]. Table 1 shows the specifications of the tested lead–acid batteries and LFP packs.
These observations raise questions about the observable effects at the cell level for high-power or low-temperature LFP regarding capacity and power dependency on ambient temperature, which are analysed in this paper.
Research has investigated the correlation between internal cell temperature and cell surface temperature, concluding that a constant surface temperature indicates a uniform temperature within the complete cell [15]. The authors are not aware of any established specification when the cell temperature fully equilibrates with the ambient temperature. According to the Battery Test Manual for 12 Volt batteries, a cooling period ranging from 4 to 16 h is recommended, depending on the battery’s size and mass [13]. Given that only cells are assessed, a cooling duration of 4 h is considered sufficient. To improve the understanding of cell design, thermal behaviours during pulses were examined and analysed using geometric findings from cells in [16]. In this study, the primary focus is on analysing LFP cells from [13], along with three additional cells, to analyse the effect of ambient temperature on the performance of high-power LFP cells. First, this analysis evaluates the capacity, as a lead equivalent, of LFP-substitute batteries for energy-use cases. Second, the power output provided for an internal combustion engine requirement perspective is analysed.

2. Batteries and Temperature Effects

This section investigates the factors influencing the usable capacity of lithium cells under varying operating conditions. Section 2.1 focuses on predicting capacity, examining the dependence on discharge current and temperature, while Section 2.2 reviews the literature on cell temperature evolution during discharge, providing insights into the thermal behaviour that might affect performance and capacity estimation.

2.1. Capacity of Lead Batteries and High-Power LFP over Temperature and C-Rate

When examining pulse loads at low temperatures, it is essential to consider not only the reduced usable energy resulting from slower Li+ and charge transfer, particularly of the electrolyte at low temperatures [17], but also the inverse relationship between discharge rate and available battery capacity. The latter phenomenon has been described by W. Peukert. In 1897, he measured the corresponding discharge durations (t) with varying discharge currents (J). Both variables were brought into an empirical relationship with a correction factor (n): J n · t = c o n s t [18]. The behaviour of lead battery capacities over temperature and the effect of higher discharging currents are shown in Figure 1 on the left-hand side. The data points were taken from cold-cranking experiments [14,19,20]. It must be noted that the data points overlap for LFP. All data points are normalised to the capacity at room temperature. In addition to the Peukert effect of the test results, indicated by the dark purple colour [19], it is observed that the capacity decreases not only with an increase in the C-rate but also with variations in temperature.
A comparison of the two data sources also evidences the technological advancements that have been made since 1986 for lead–acid batteries, represented by the yellow and orange markers. Therefore, these data points were only used to represent the effect of the C-rate but not taken into further consideration. When assuming an exponential progression, the range of the capacity drop as a function of temperature at a 9 C-rate is depicted as a cone. A description of both heuristic references is part of the Appendix A, in Appendix A.1. These expected ranges are represented by dashed lines. It can be concluded that for high-power applications at −18 °C, around 60% of the nominal capacity of lead–acid batteries can be used. If we interpolate to −30 °C, the usable capacity is expected to drop below 20%.
Although the classical Peukert equation can be used to determine the capacities of lead–acid batteries based on discharge current without considering temperature, it has been deemed inadequate for modelling lithium batteries [21]. Predictions using an adjusted Peukert equation concluded that it is only applicable at a constant temperature and discharge current [22]. Further generalisation was conducted to determine whether any discharge current could be predicted [23] when additional empirical constants were incorporated. However, as these constants also require measurements to obtain respective data points, this approach was not suitable for a rapid evaluation.
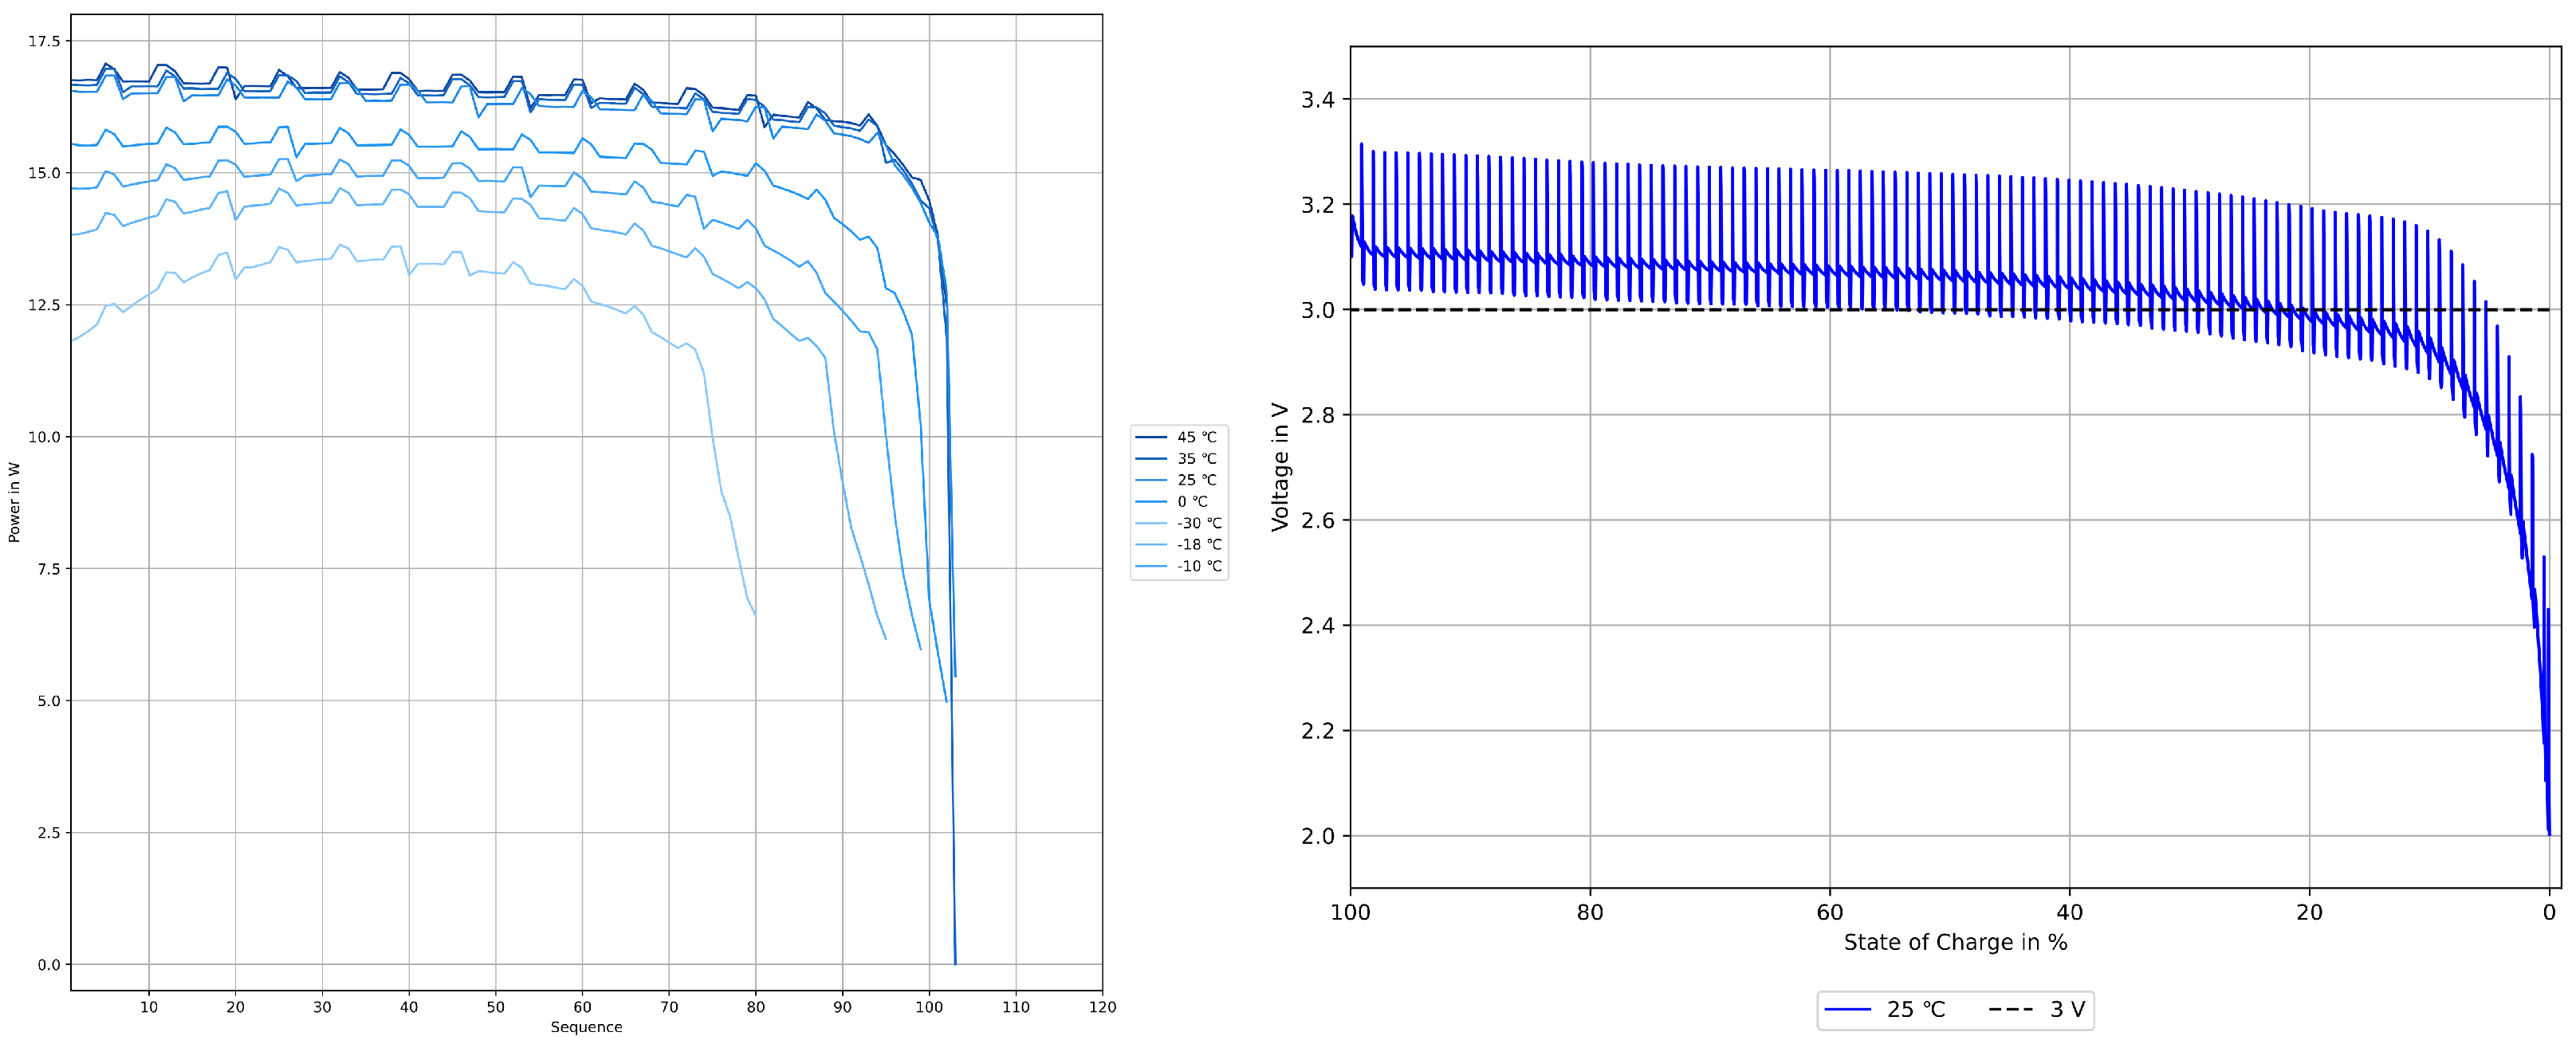
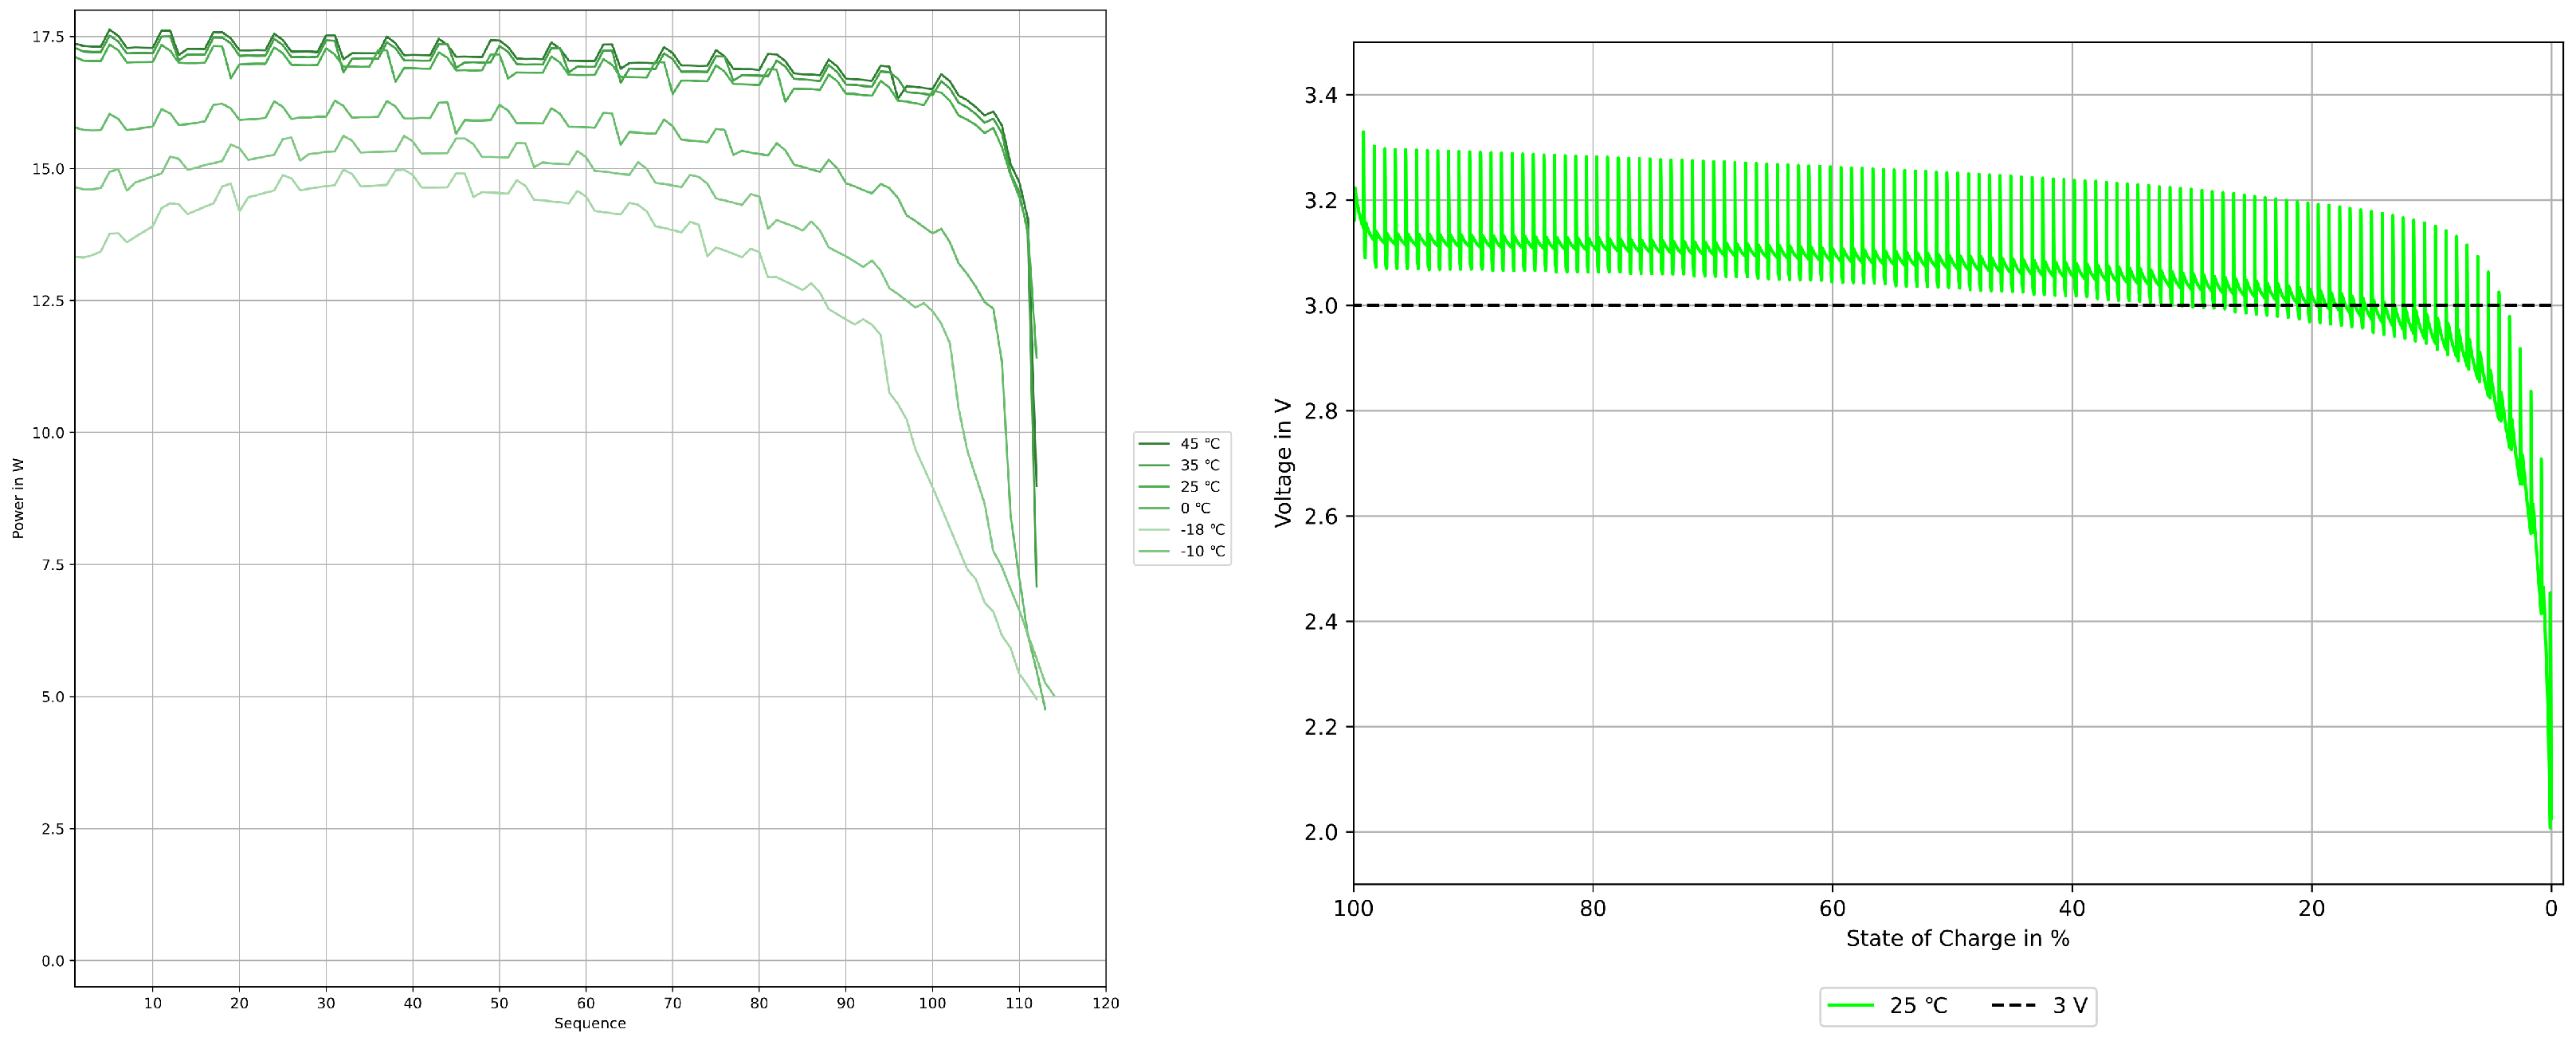
In contrast to the lead–acid data, the effect for high-power LFP cells is shown on the right, with LFP data from [13]. In case of the anticipated relative capacity reduction for LFP, as illustrated on the right side of Figure 1, the estimated capacity is assumed to be 80% at −18 °C and 70% at −30 °C, which is approximately 20 to 50 percentage points higher compared to lead–acid batteries. This capacity benefit might be an effect of the flat discharge curve at similar power for LFP [1]. In comparison to lead–acid batteries, a hyperbolic decrease in the voltage curve is reported, already starting at 70% state of charge for a 3 C load [24]. The stable voltage curve during the discharge sequences for 25 °C is presented as an example in the Appendix A, in Appendix A.6, for the blue and green cell.

2.2. Temperature of Lithium Cells During Discharge

Cylindrical high-power LFP cells show an increased temperature in the centre, and the temperature differential between the internal and external cell regions is primarily influenced by the depth of discharge [25]. This phenomenon is further corroborated by observations that indicate that the heat-generation rate increases beyond a 50% depth of discharge [26] and is elevated at low temperatures [27]. Computational analyses of a 20 Ah cylindrical cell undergoing discharge at a 4 C-rate revealed that the average temperature increase ranged from 15 °C to 35 °C above the initial temperature of 25 °C, dependent on the quantity of tabs present. Notably, tabs, particularly positive current collectors, emerged as primary thermal hotspots in these simulations [28]. An investigation utilising 21,700 cells compared internal, surface, and simulated temperatures over 0.5 C pulses, demonstrating a maximum temperature increase of 4 °C, with the surface temperature being less than 1 °C lower [29]. To control self-heating at low temperatures, it is recommended to use the specific heating rate, performance coefficient, and specific temperature difference.
Cell ageing has been shown to influence thermal effects as well [30]. Additionally, research has demonstrated that the charging process can involve reversible heat absorption, which effectively reduces battery temperature [31]. In terms of cell geometry, investigations have revealed that high-energy cells characterised by thicker anodes experience significantly greater heating during discharge [32].

3. Methods and Materials

This section describes the battery cells and methodology used in the present study. Section 3.1 details the selection of the lithium cells investigated, with reference to prior experiments, while Section 3.2 outlines the experimental approach and setup, including the use of a climate chamber, thermal imaging, and the applied test regimes to evaluate cell behaviour under pulse loads at different ambient temperatures.

3.1. Cell Selection

The cells selected for this investigation are summarised in Table 2 and are each assigned a code for ease of identification throughout the paper. The geometrical data of all five cells are available, and a CT analysis also revealed that no anomalies were observed [16]. Red and green cells were utilised as 4S16P (LFP1), 4S10P (LFP2 and LFP3), and 4S20P (LFP4) cell packs from cold-cranking tests [14].

3.2. Experimental Approach and Setup

The cells were charged at ambient temperature for each discharging sequence. Temperature control was achieved using a thermal chamber (BINDER MK240). To minimise damage, initial tests were conducted at room temperature (25 °C), followed by elevated temperatures of 35 °C and 45 °C, and subsequently at reduced temperatures of 0 °C, −10 °C, −18 °C, and −30 °C, respectively. Ageing of LFP is considered negligible within the limited number of sequences but remains a general limitation. At 25 °C, the cell temperatures were measured using a thermal camera (Optris PI640, Portsmouth, NH 03801 USA), and the data were analysed using the Optris PIX Connect software (Release 3.21.3113.0). Because the heating was homogeneous, as discussed in Section 4.1.2, a single thermal sensor was affixed to the centre of each cell.
In the Battery Test Manual for 12 Volt Start/Stop Vehicles [13], the cold-cranking test profile specifies a discharge power delivery of 6 kW for 0.5 s, followed by 4 kW for 4 s, comprising a total of three 4.5 s pulses at 14.5 s intervals. A 9 C-rate, which is comparable with that in other studies based on the lead standard [14], was selected for the 0.5 s high pulse to ensure comparability with prior pack-level cold-cranking experiments [14]. Because a voltage sag already occurred during these tests under low temperature, this indicates that 9 C is a practically relevant stress level for starter applications. Higher C-rates specified in data sheets were therefore not used in this comparative screening study but are proposed as a follow-up investigation as, for instance, the data sheet of the green cell specifies a 48 C-rate for a 10 s discharge pulse.
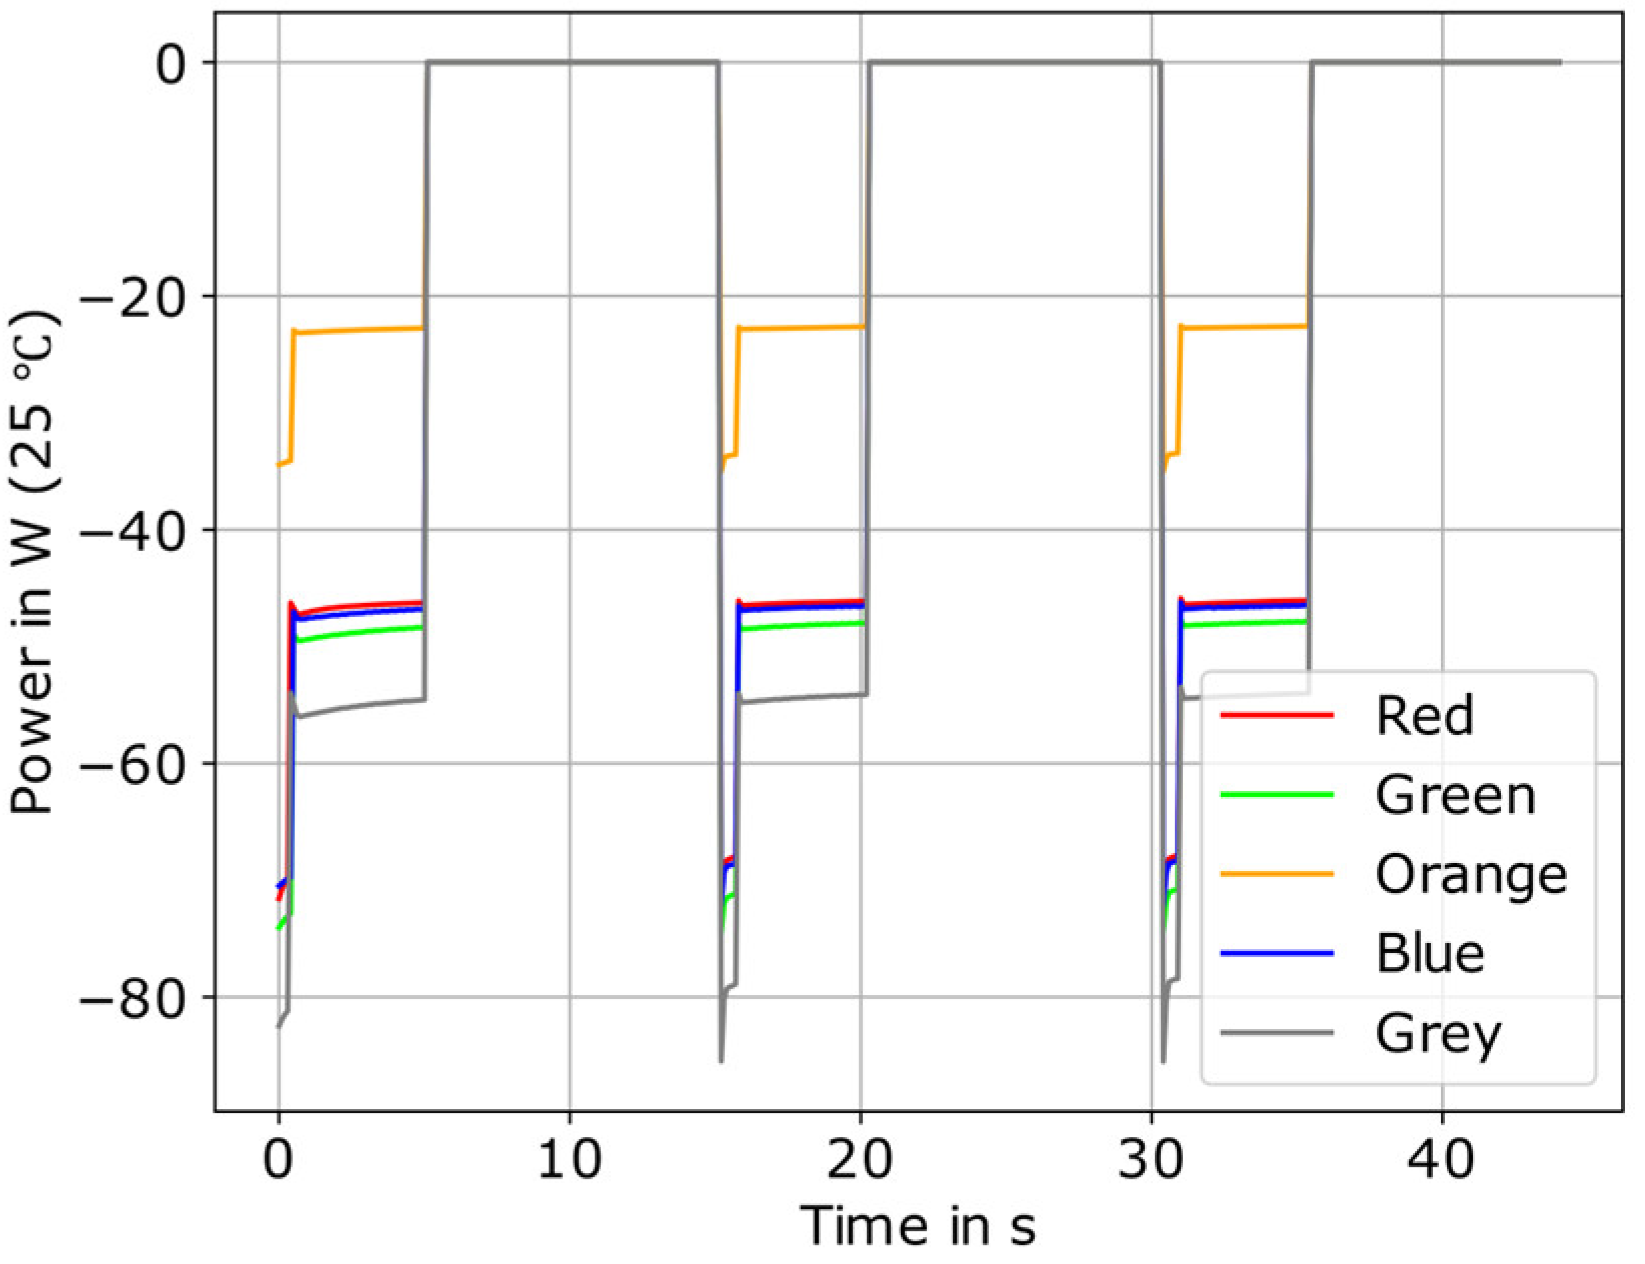
As illustrated in Figure 2, the load profile for the five cells replicated the gradual progression at the cell level, with 0.5 s at 9 C and 5.4 C following for 4 s before a 10 s pause. To meet the overall power requirements outlined in the Battery Test Manual for 12 Volt Start/Stop Vehicles, the number of cells must be adjusted accordingly.
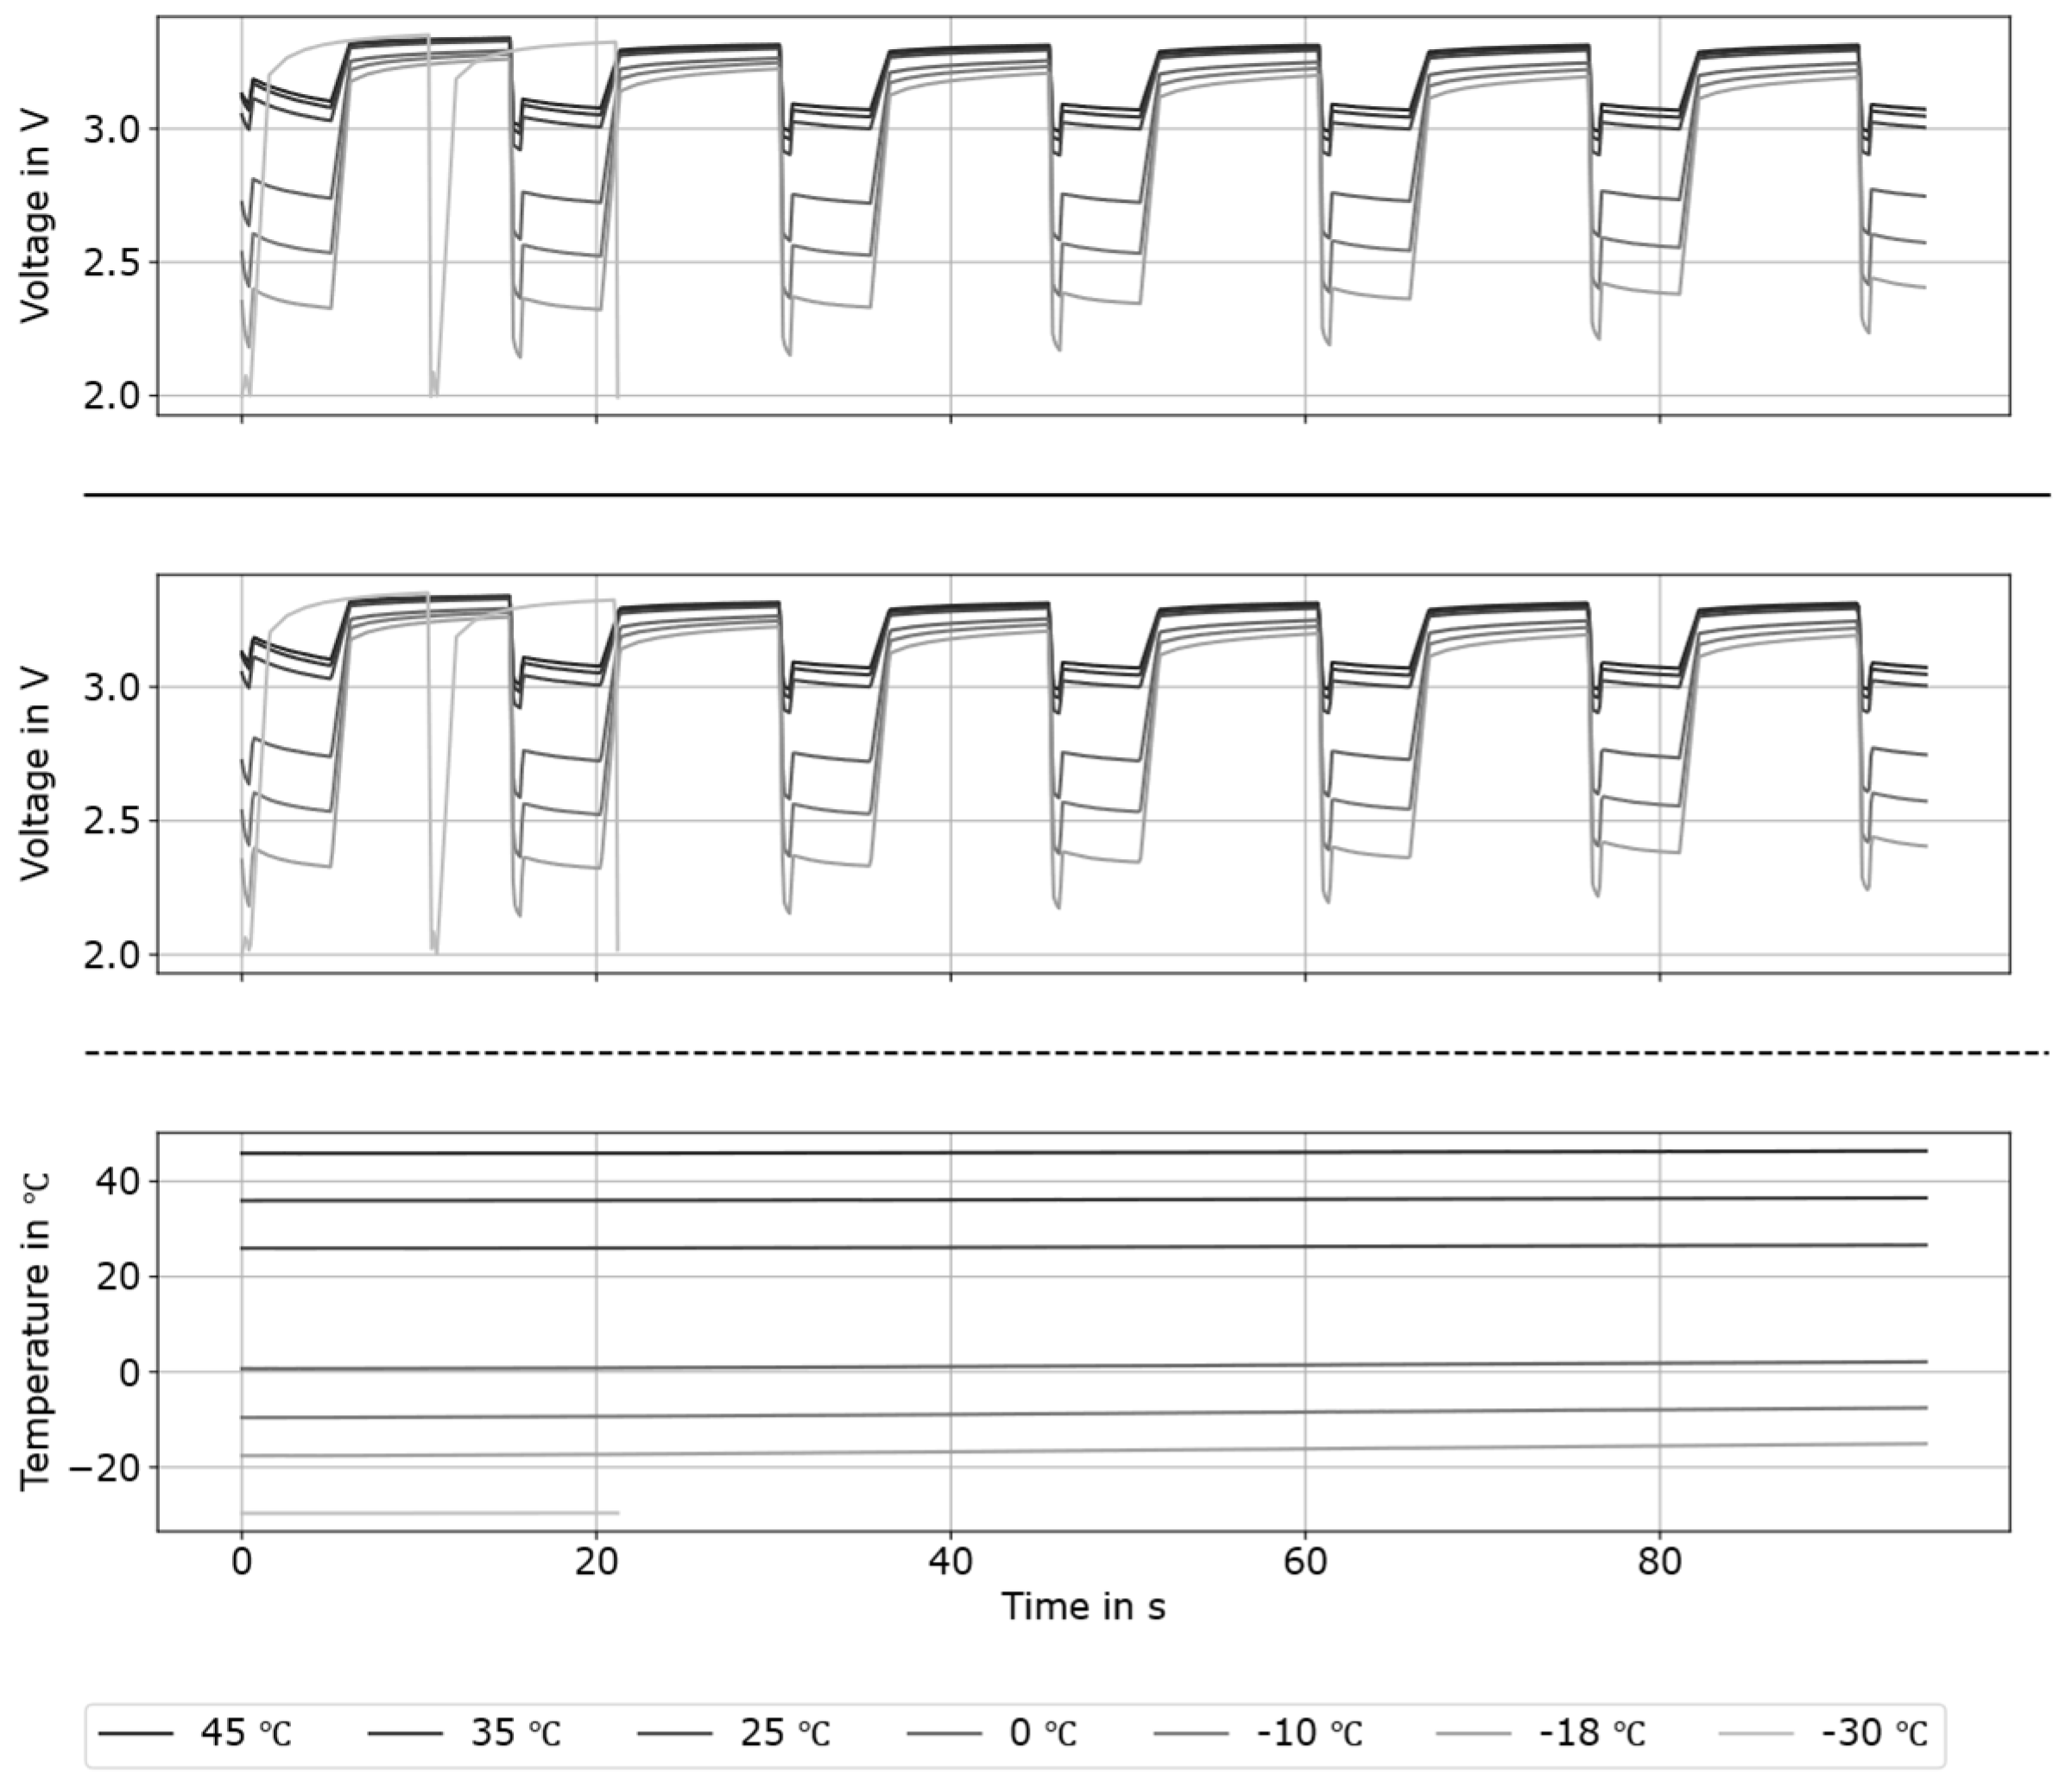
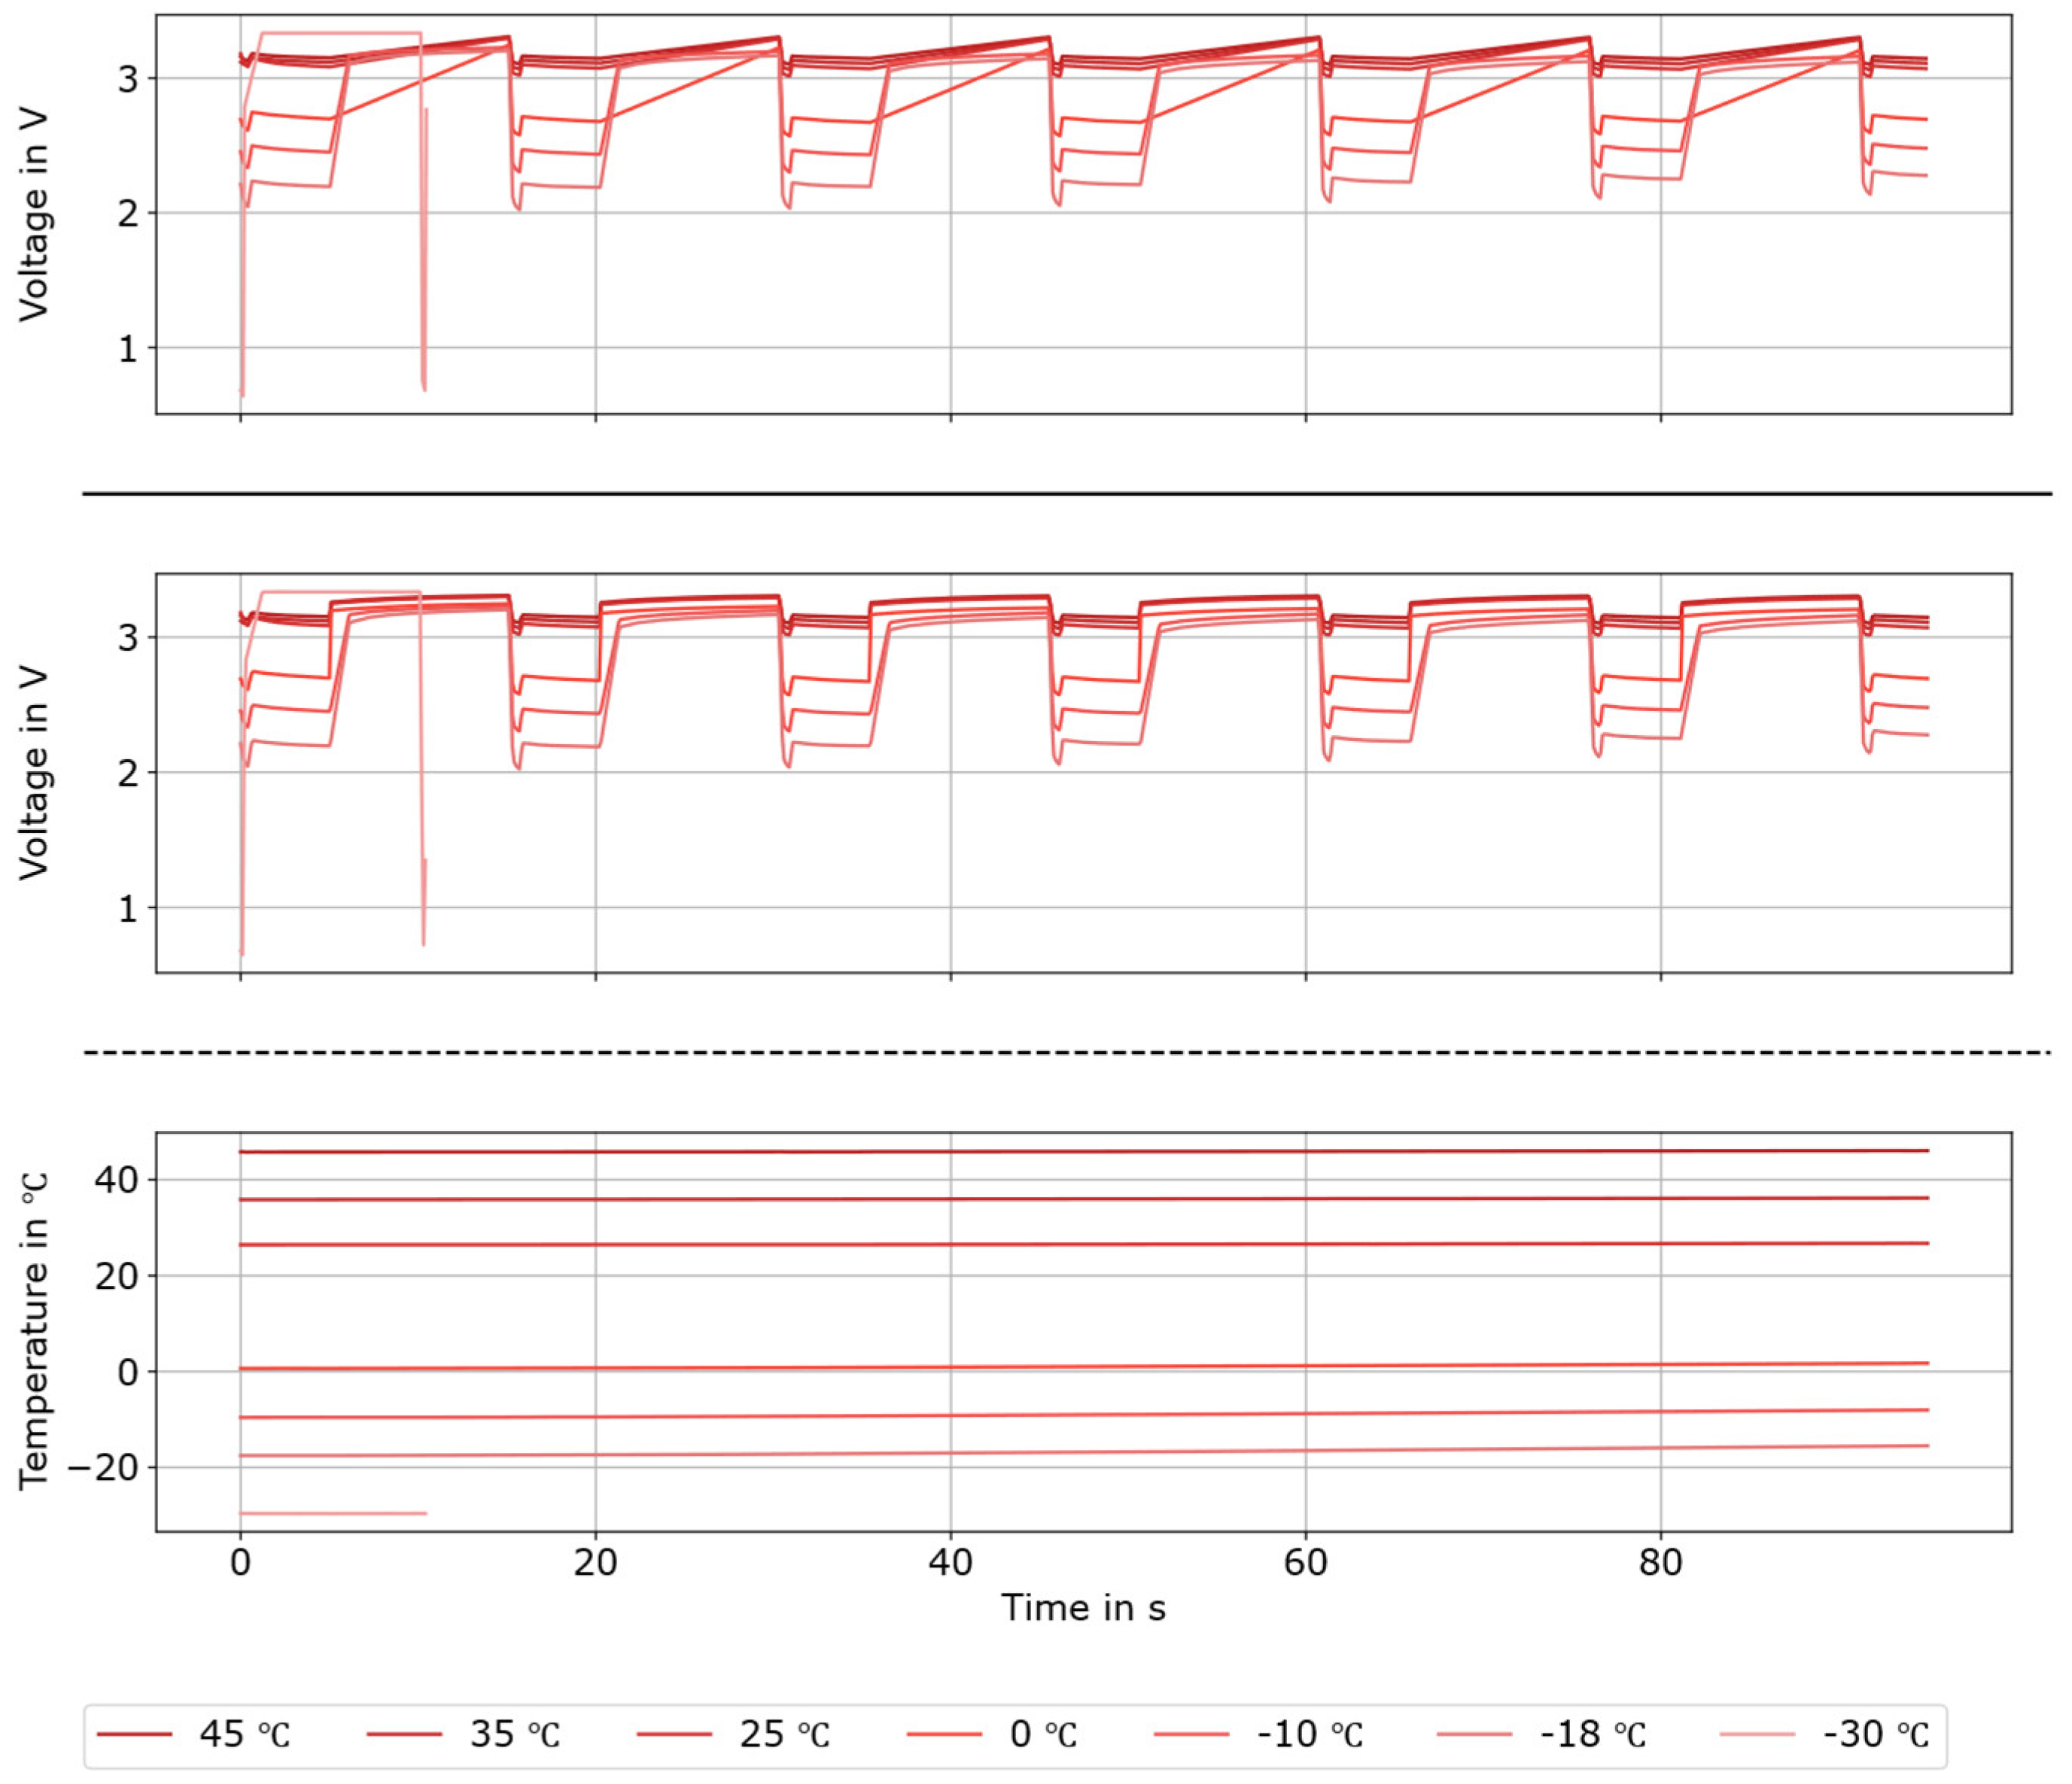
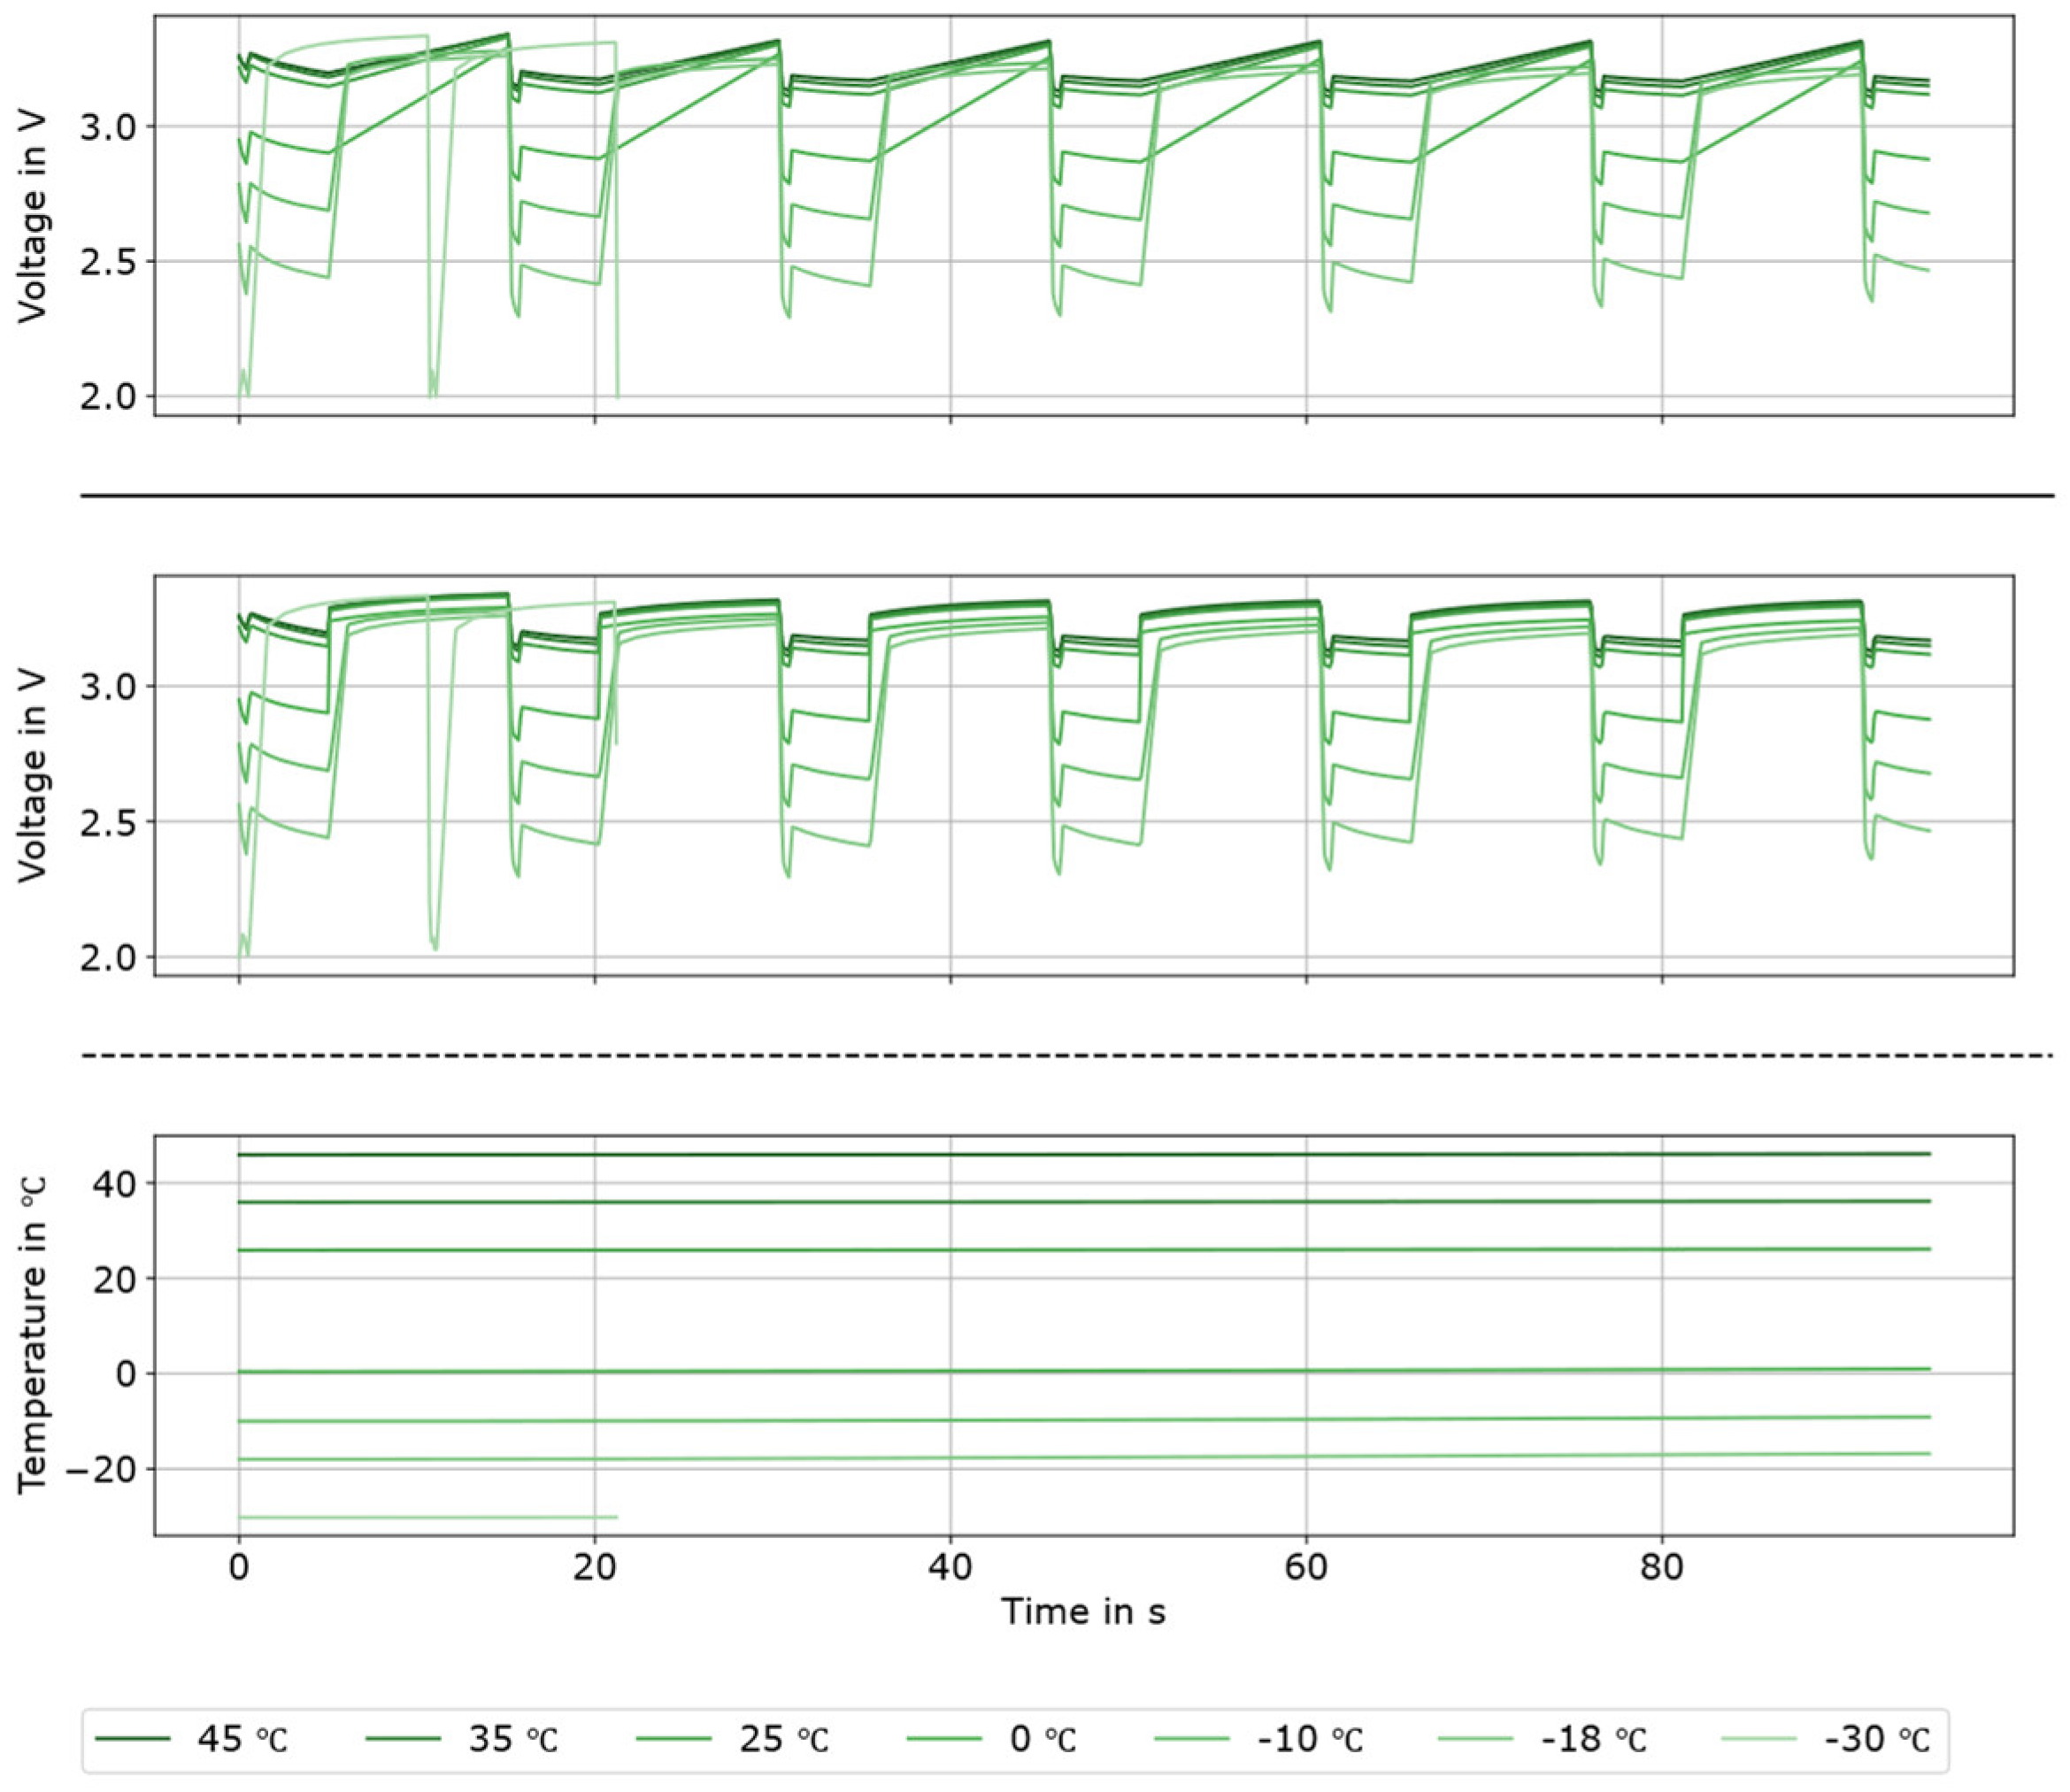
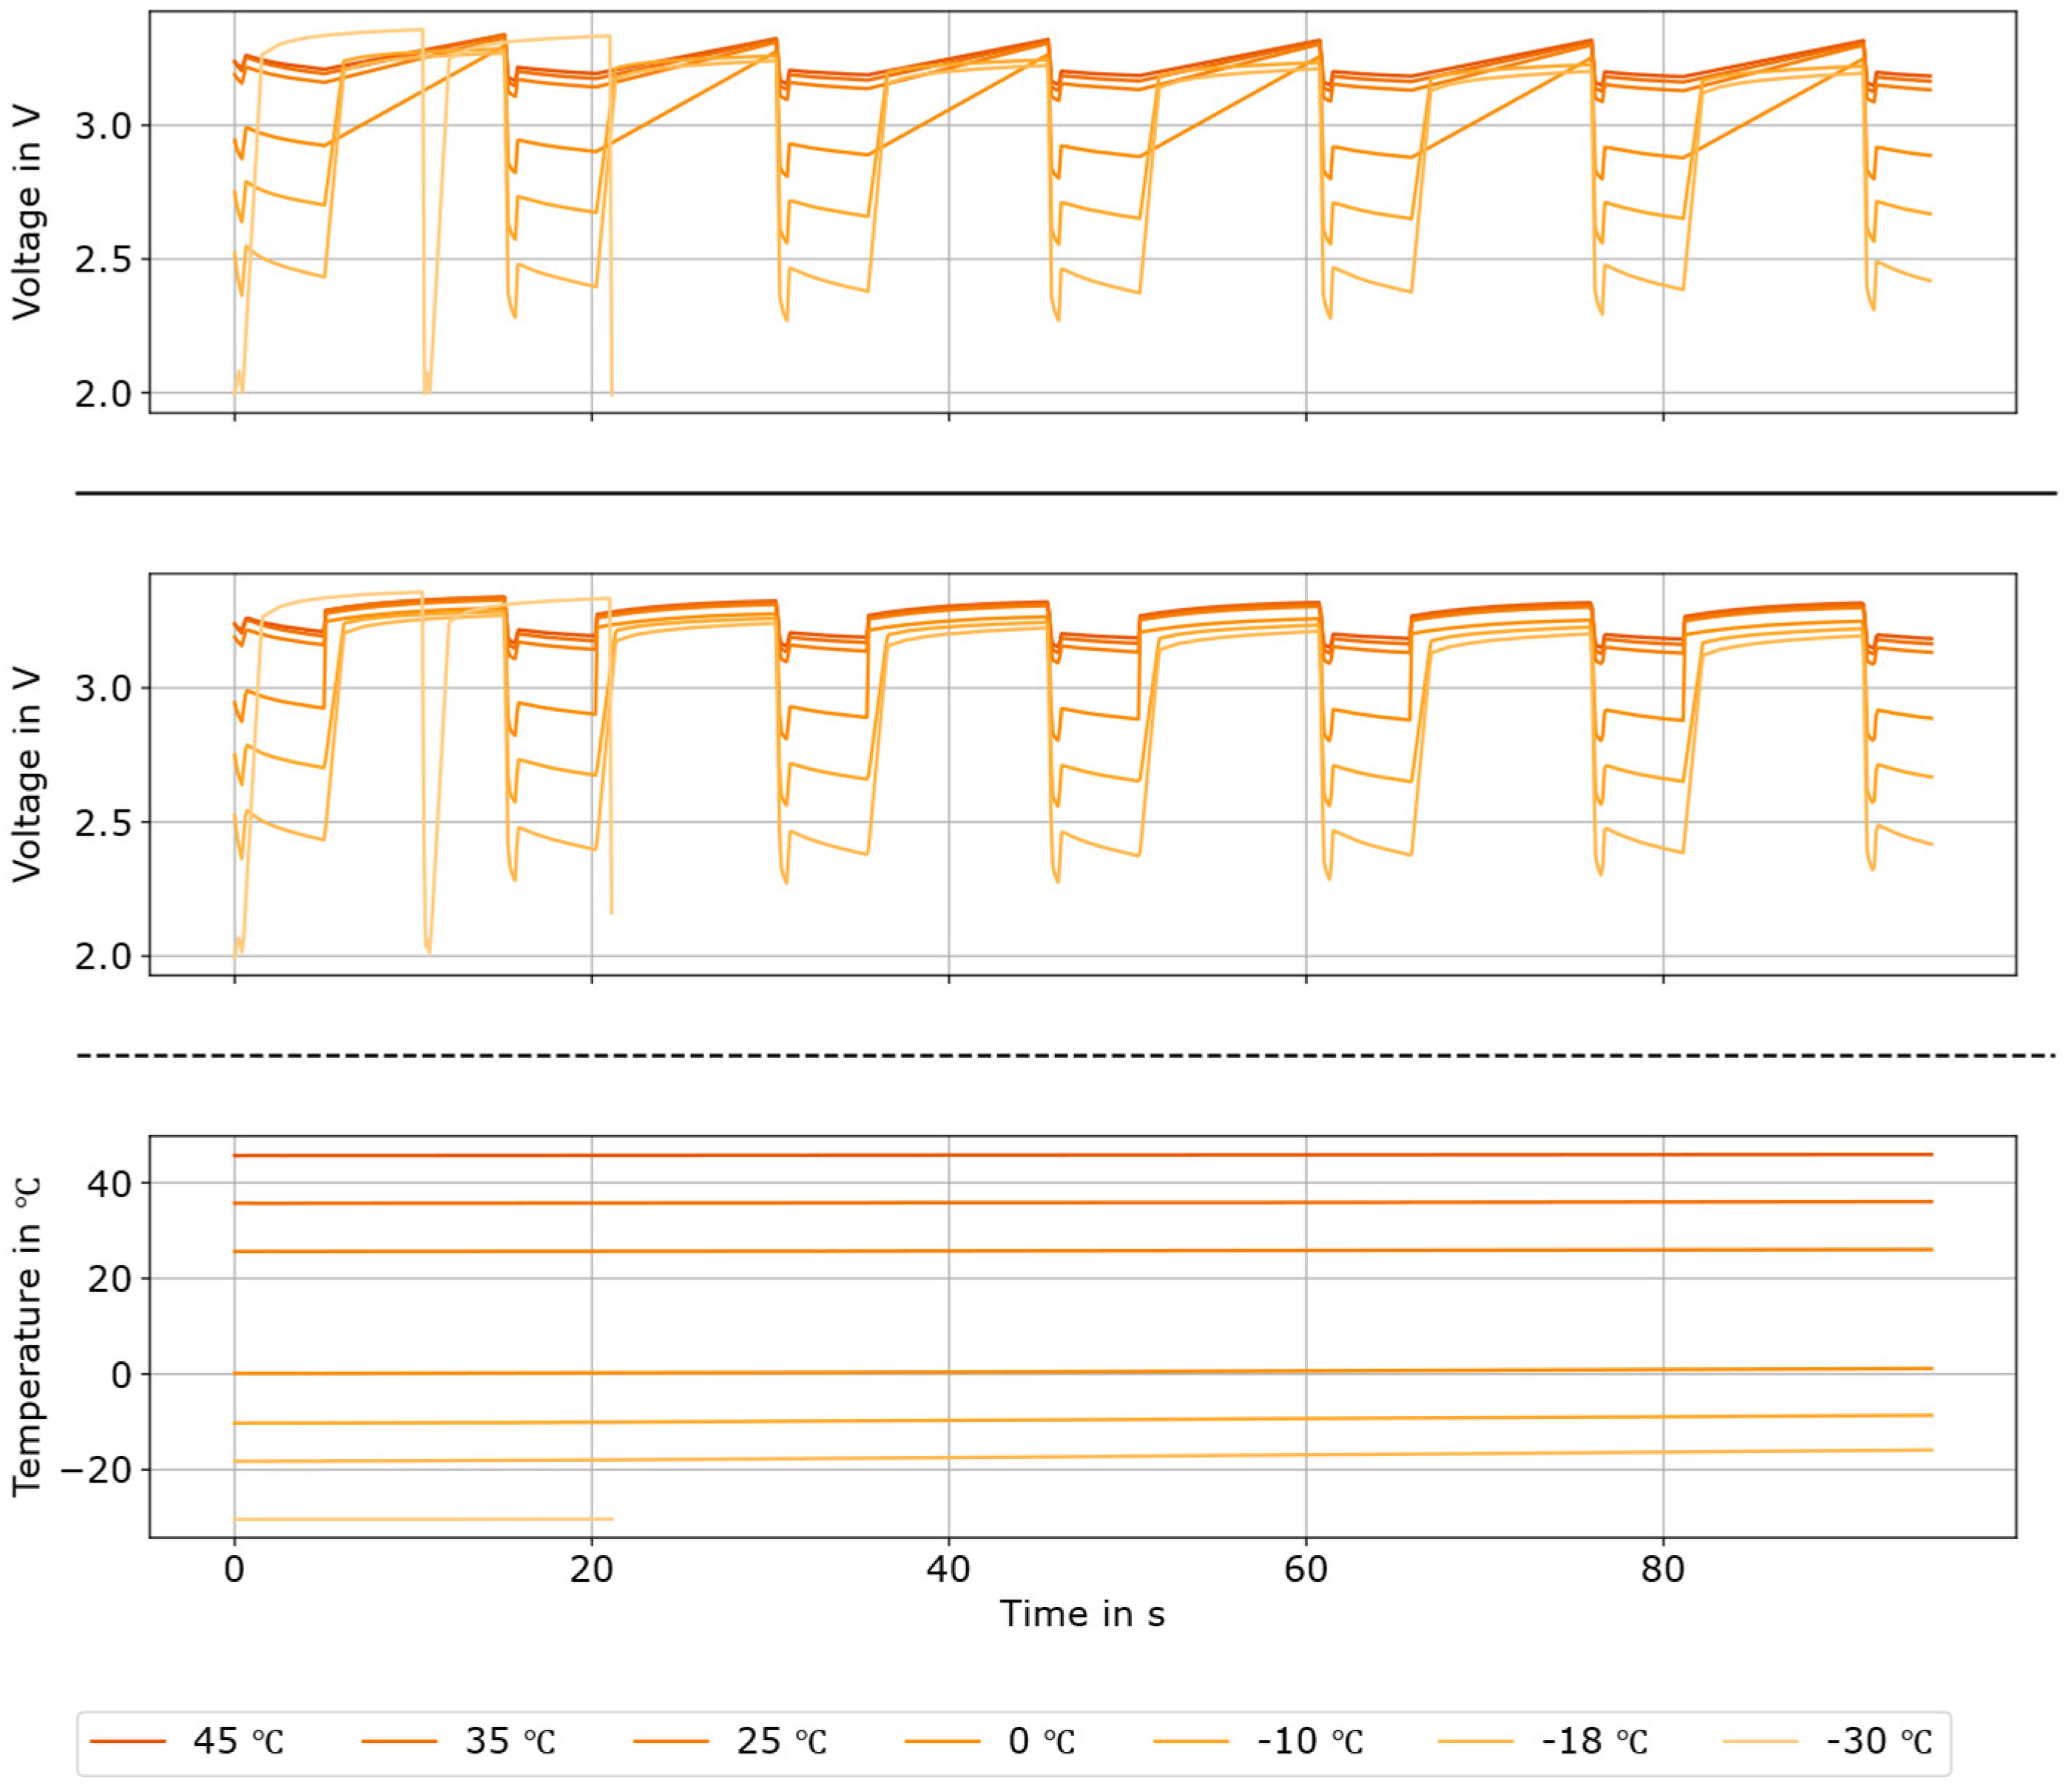
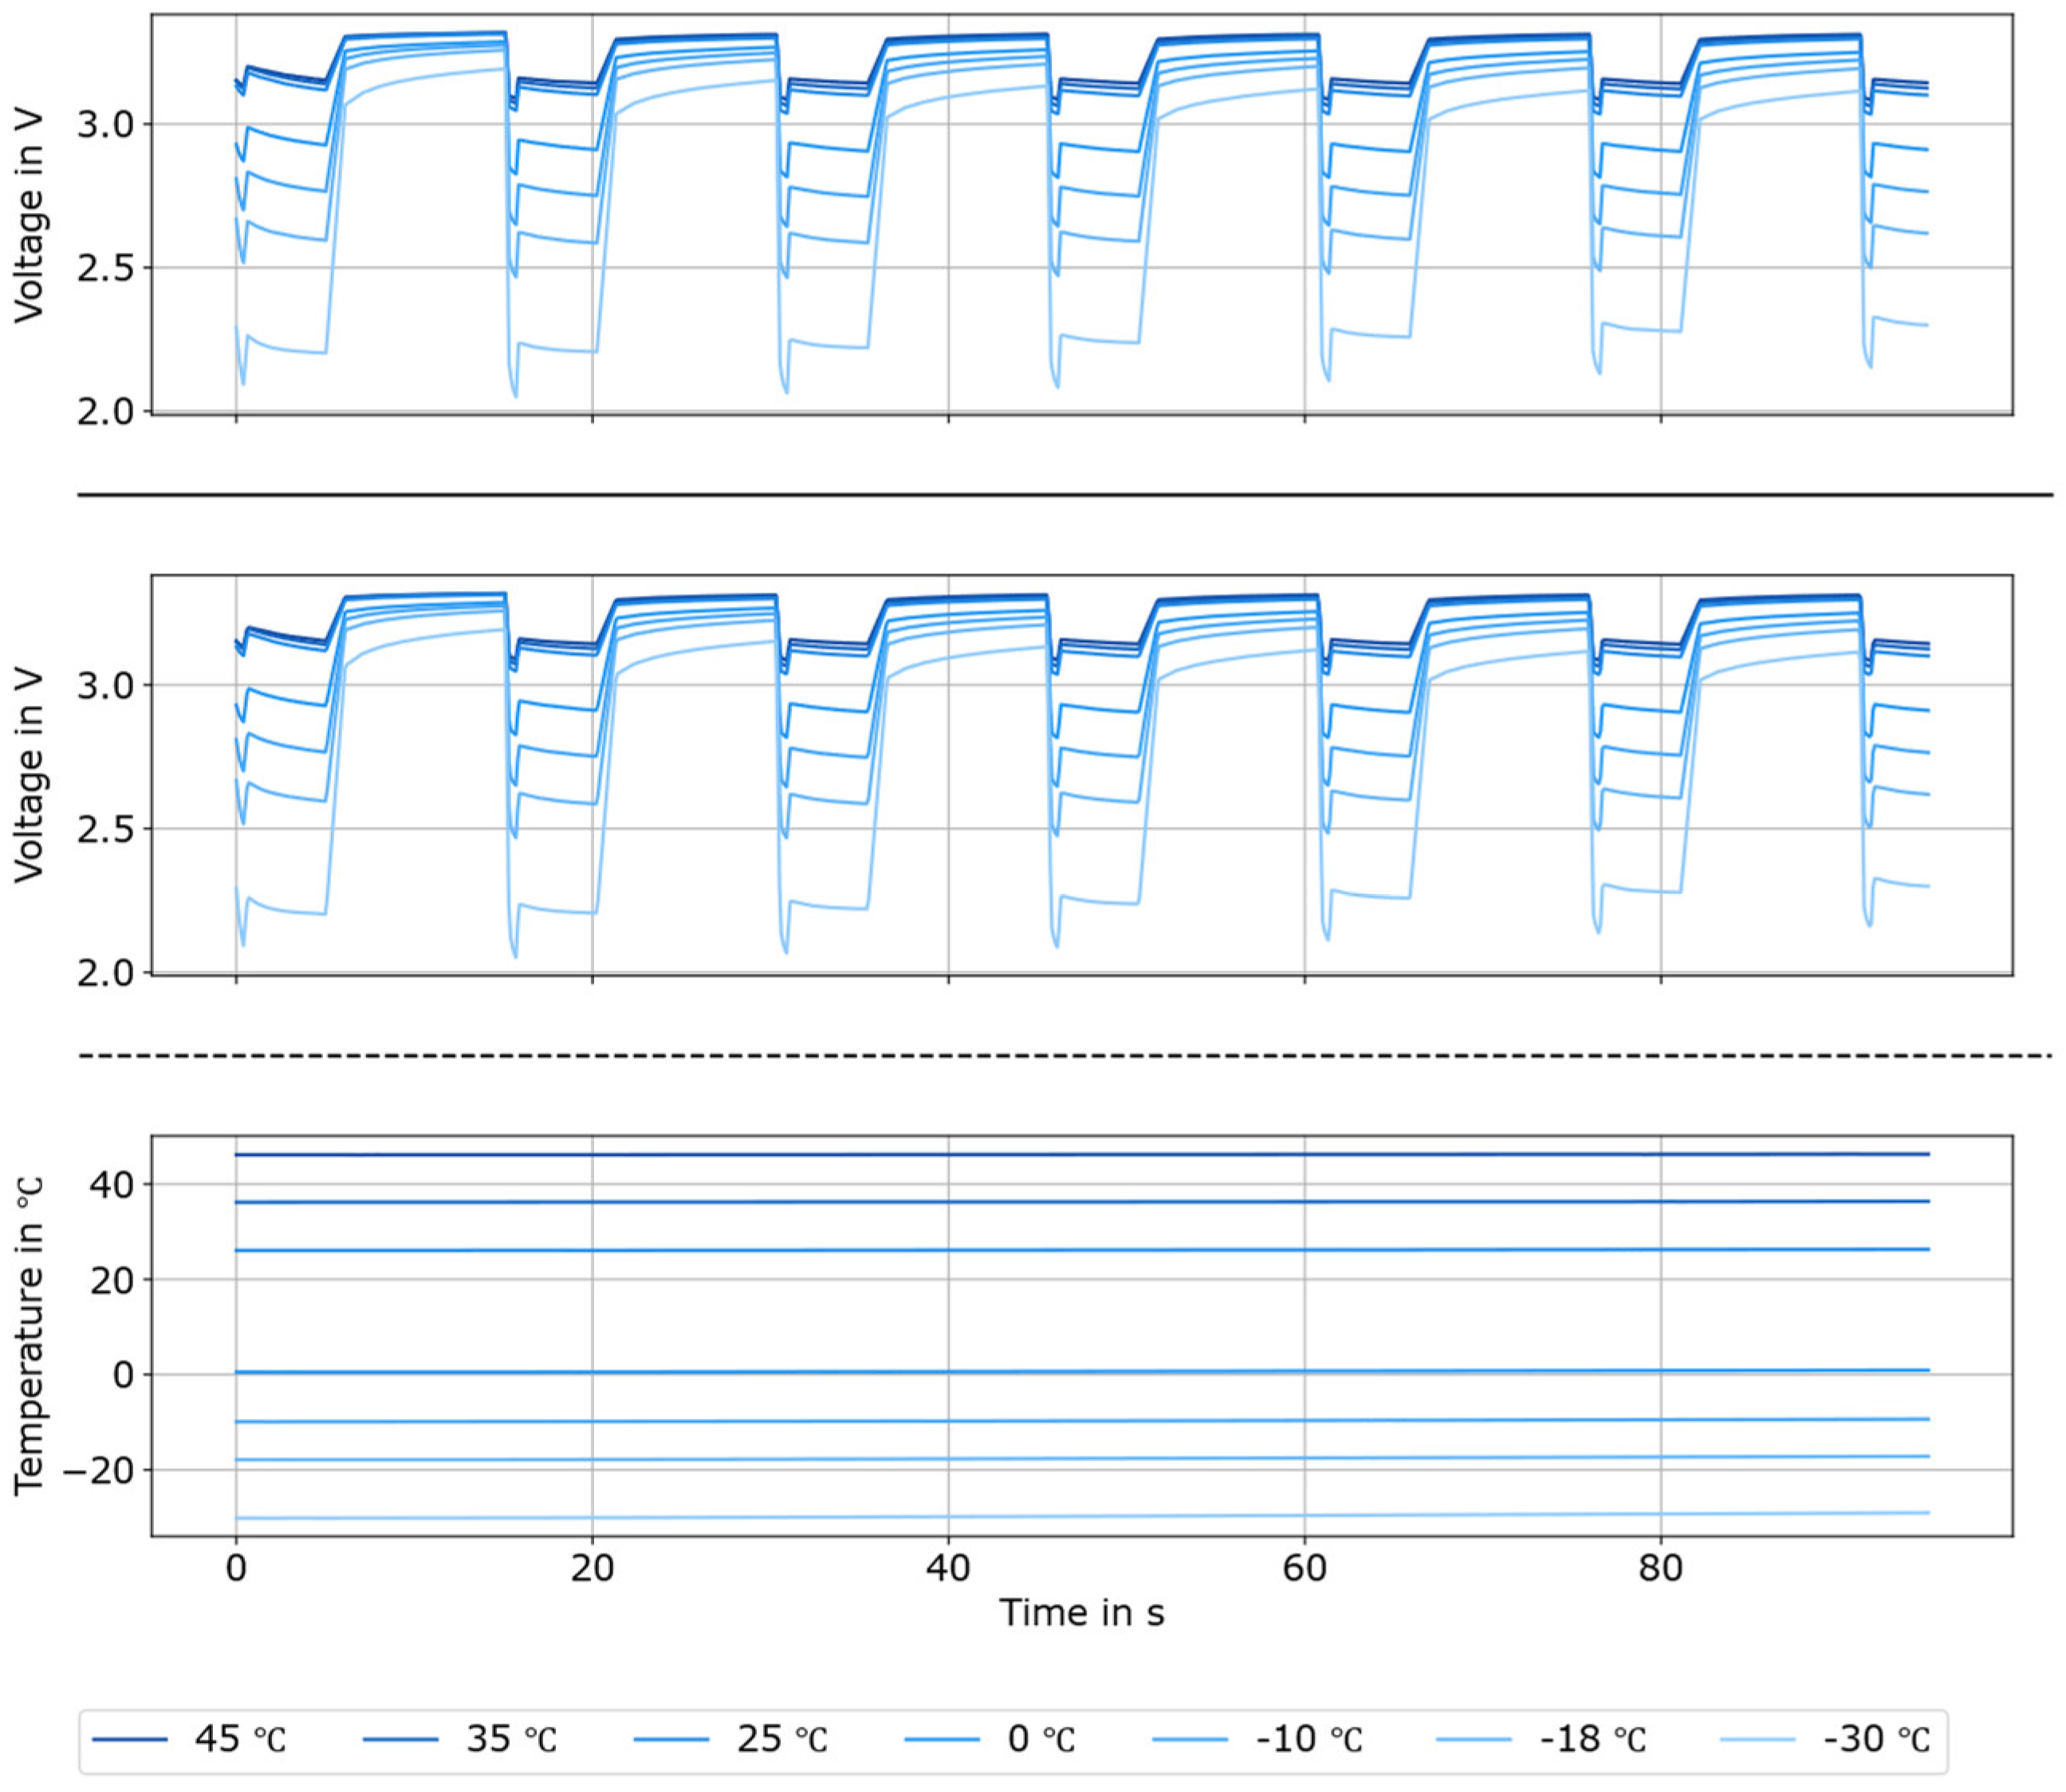
Some data points after the pulse discharge, as presented in the Appendix A, in Appendix A.4, were partially reconstructed with an exponential function due to limited measurement resolution at the onset of the voltage rise during pauses. This affected the red, green, blue, and grey cells at temperatures ≥0 °C and the orange cells at ≥–10 °C. The exponential reconstruction was carried out conservatively and does not compromise the overall methodology. Two types of information were needed for the reconstruction: First, when did the voltage increase? And second, to which level did it increase? Each voltage increase at the end of the pulse is defined by the test sequence and can therefore be distinguished in a timely manner. Also, the subsequent, constant voltage level was measured during the brake. Therefore, all required input was available, and the effect on the calculated energy during the pulse is negligible, ensuring that the reconstructed values accurately reflect actual cell behaviour.

4. Results of Thermal/Electrical Experiments

This section presents the results of the thermal and electrical experiments conducted on the selected lithium cells to verify their functionality and thermal behaviour. Section 4.1.1 addresses the temperature behaviour of the cells relative to ambient conditions, while Section 4.2 examines the electrical performance in terms of energy and power output.

4.1. Temperature of Cells over Ambient Temperature

To examine the development of the cell temperature relative to ambient conditions Section 4.1.1 analyses voltage and surface temperature during charging to verify normal behaviour; Section 4.1.2 evaluates the homogeneity of self-heating, identifying potential hotspots on the cell surface during brief discharge pulses; and Section 4.1.3 investigates the temperature development during discharge, capturing how the cell temperature increases during the discharge pulses.

4.1.1. Temperature and Voltage of Cells During Charging

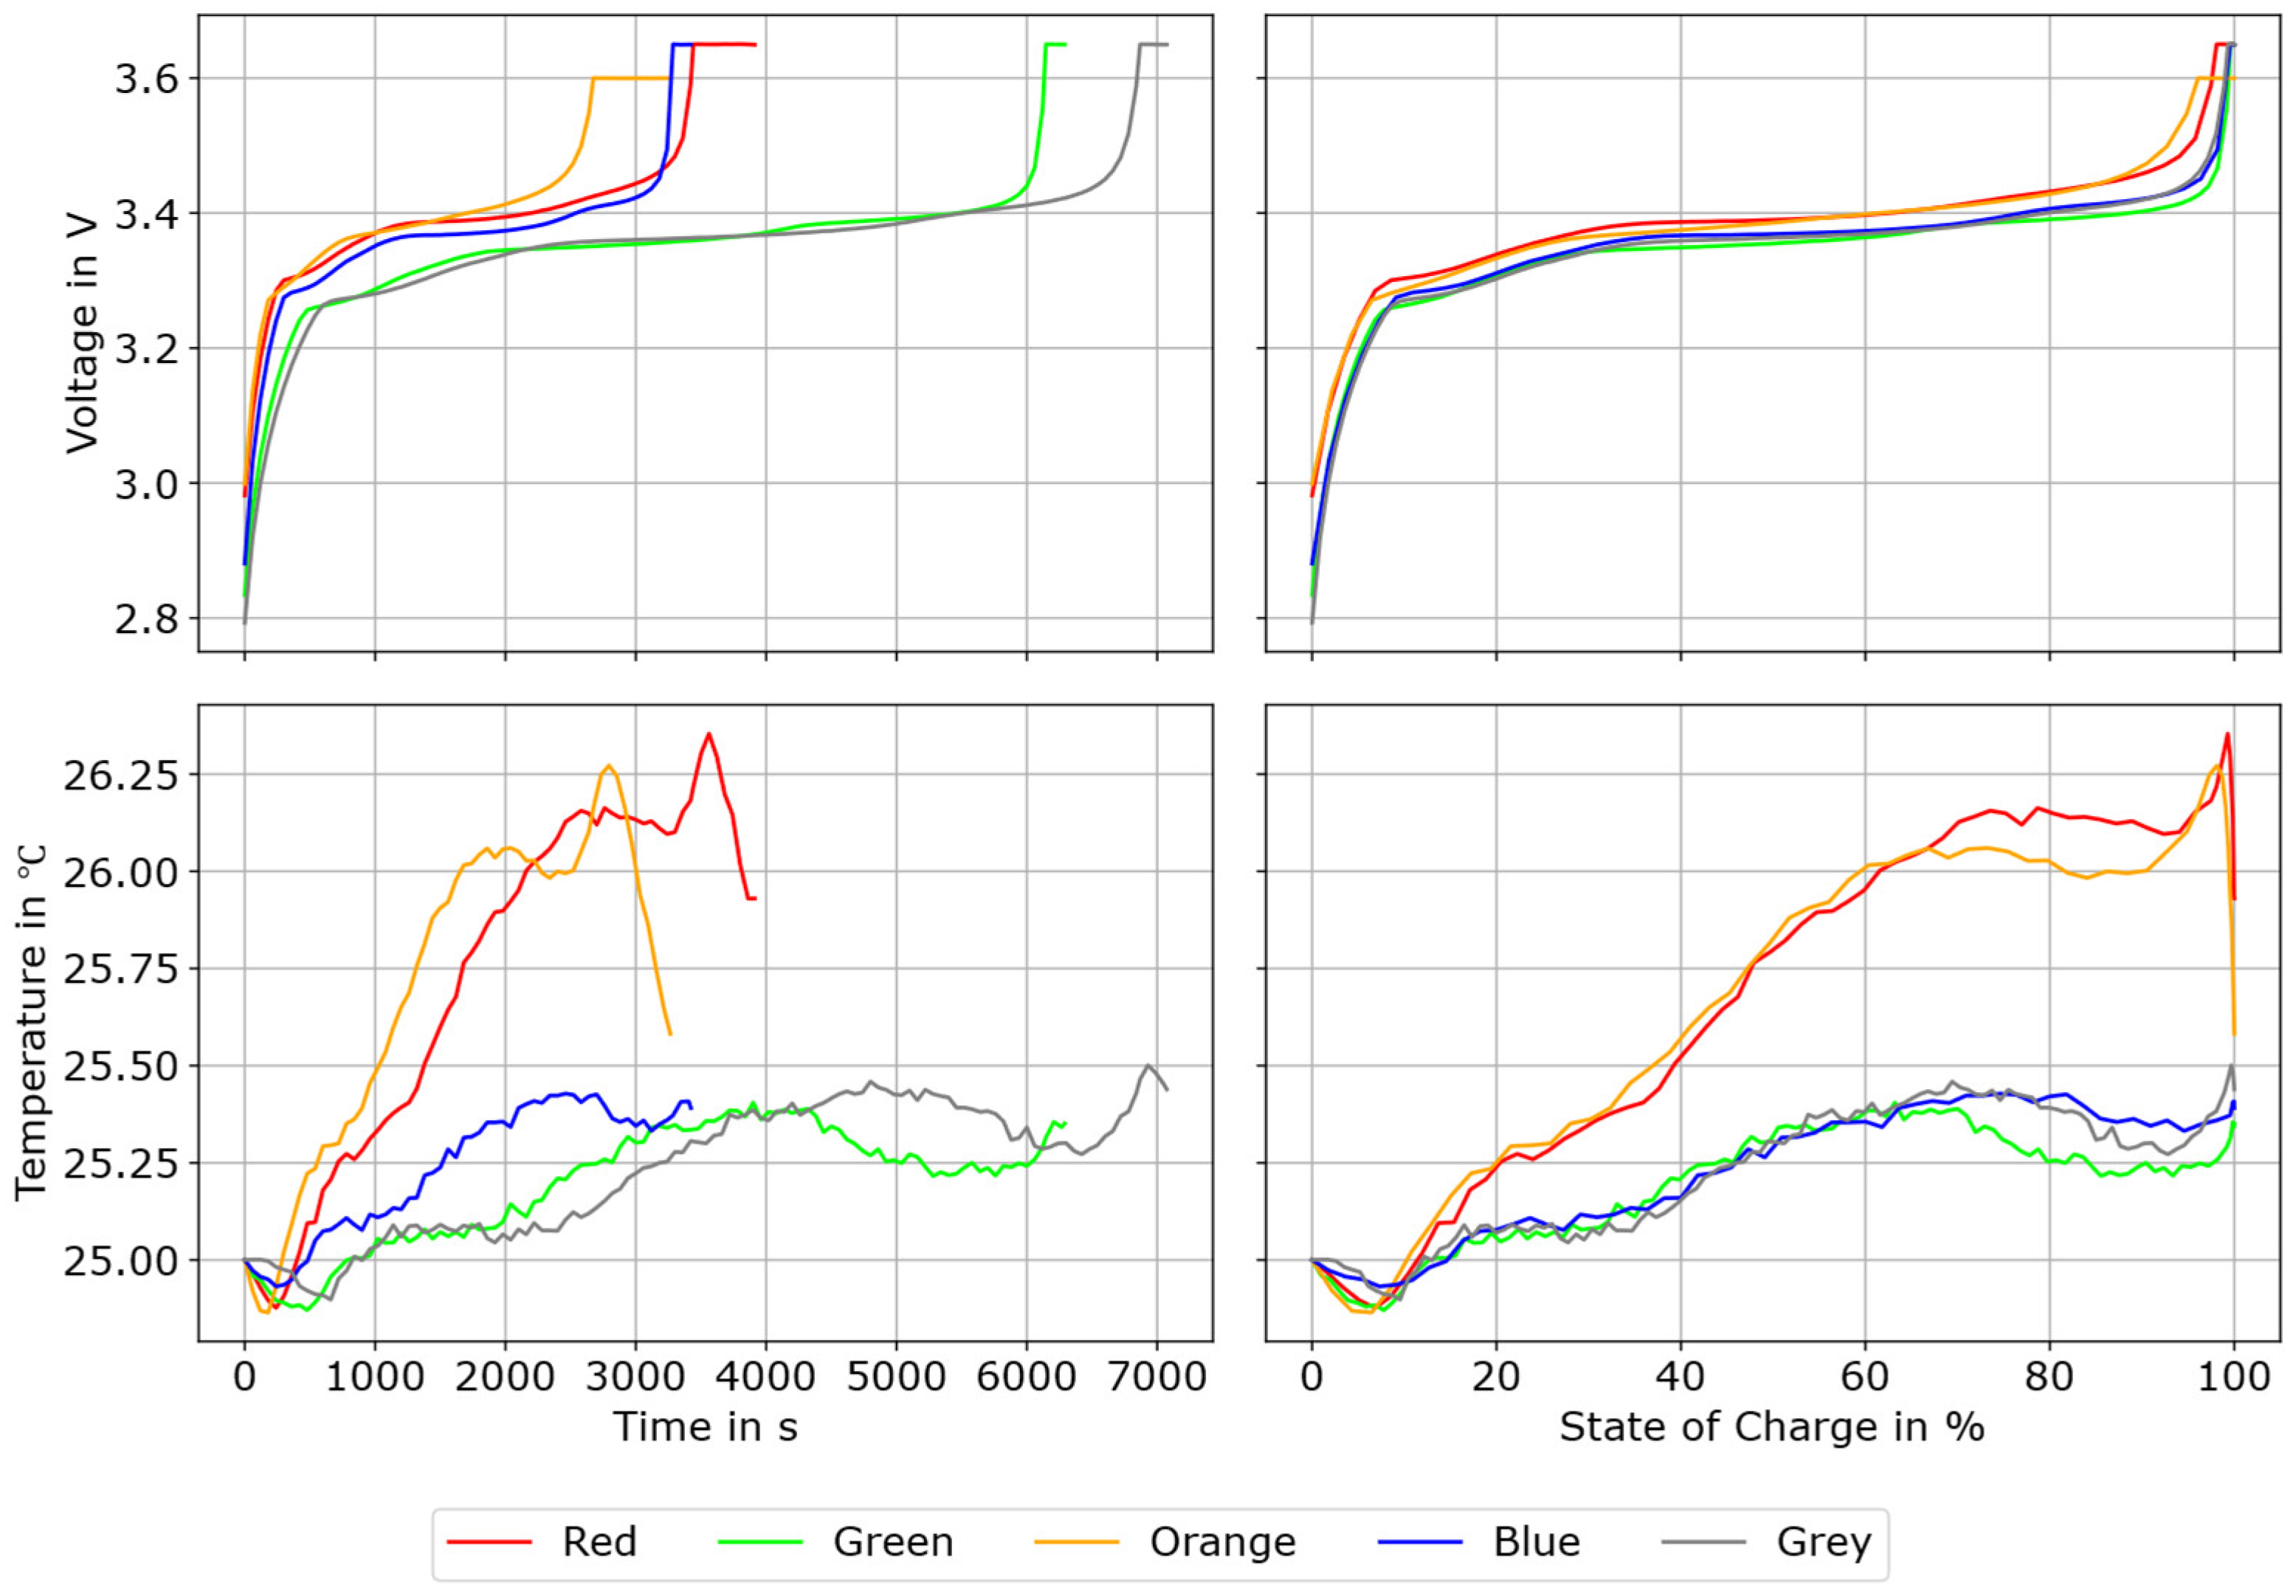
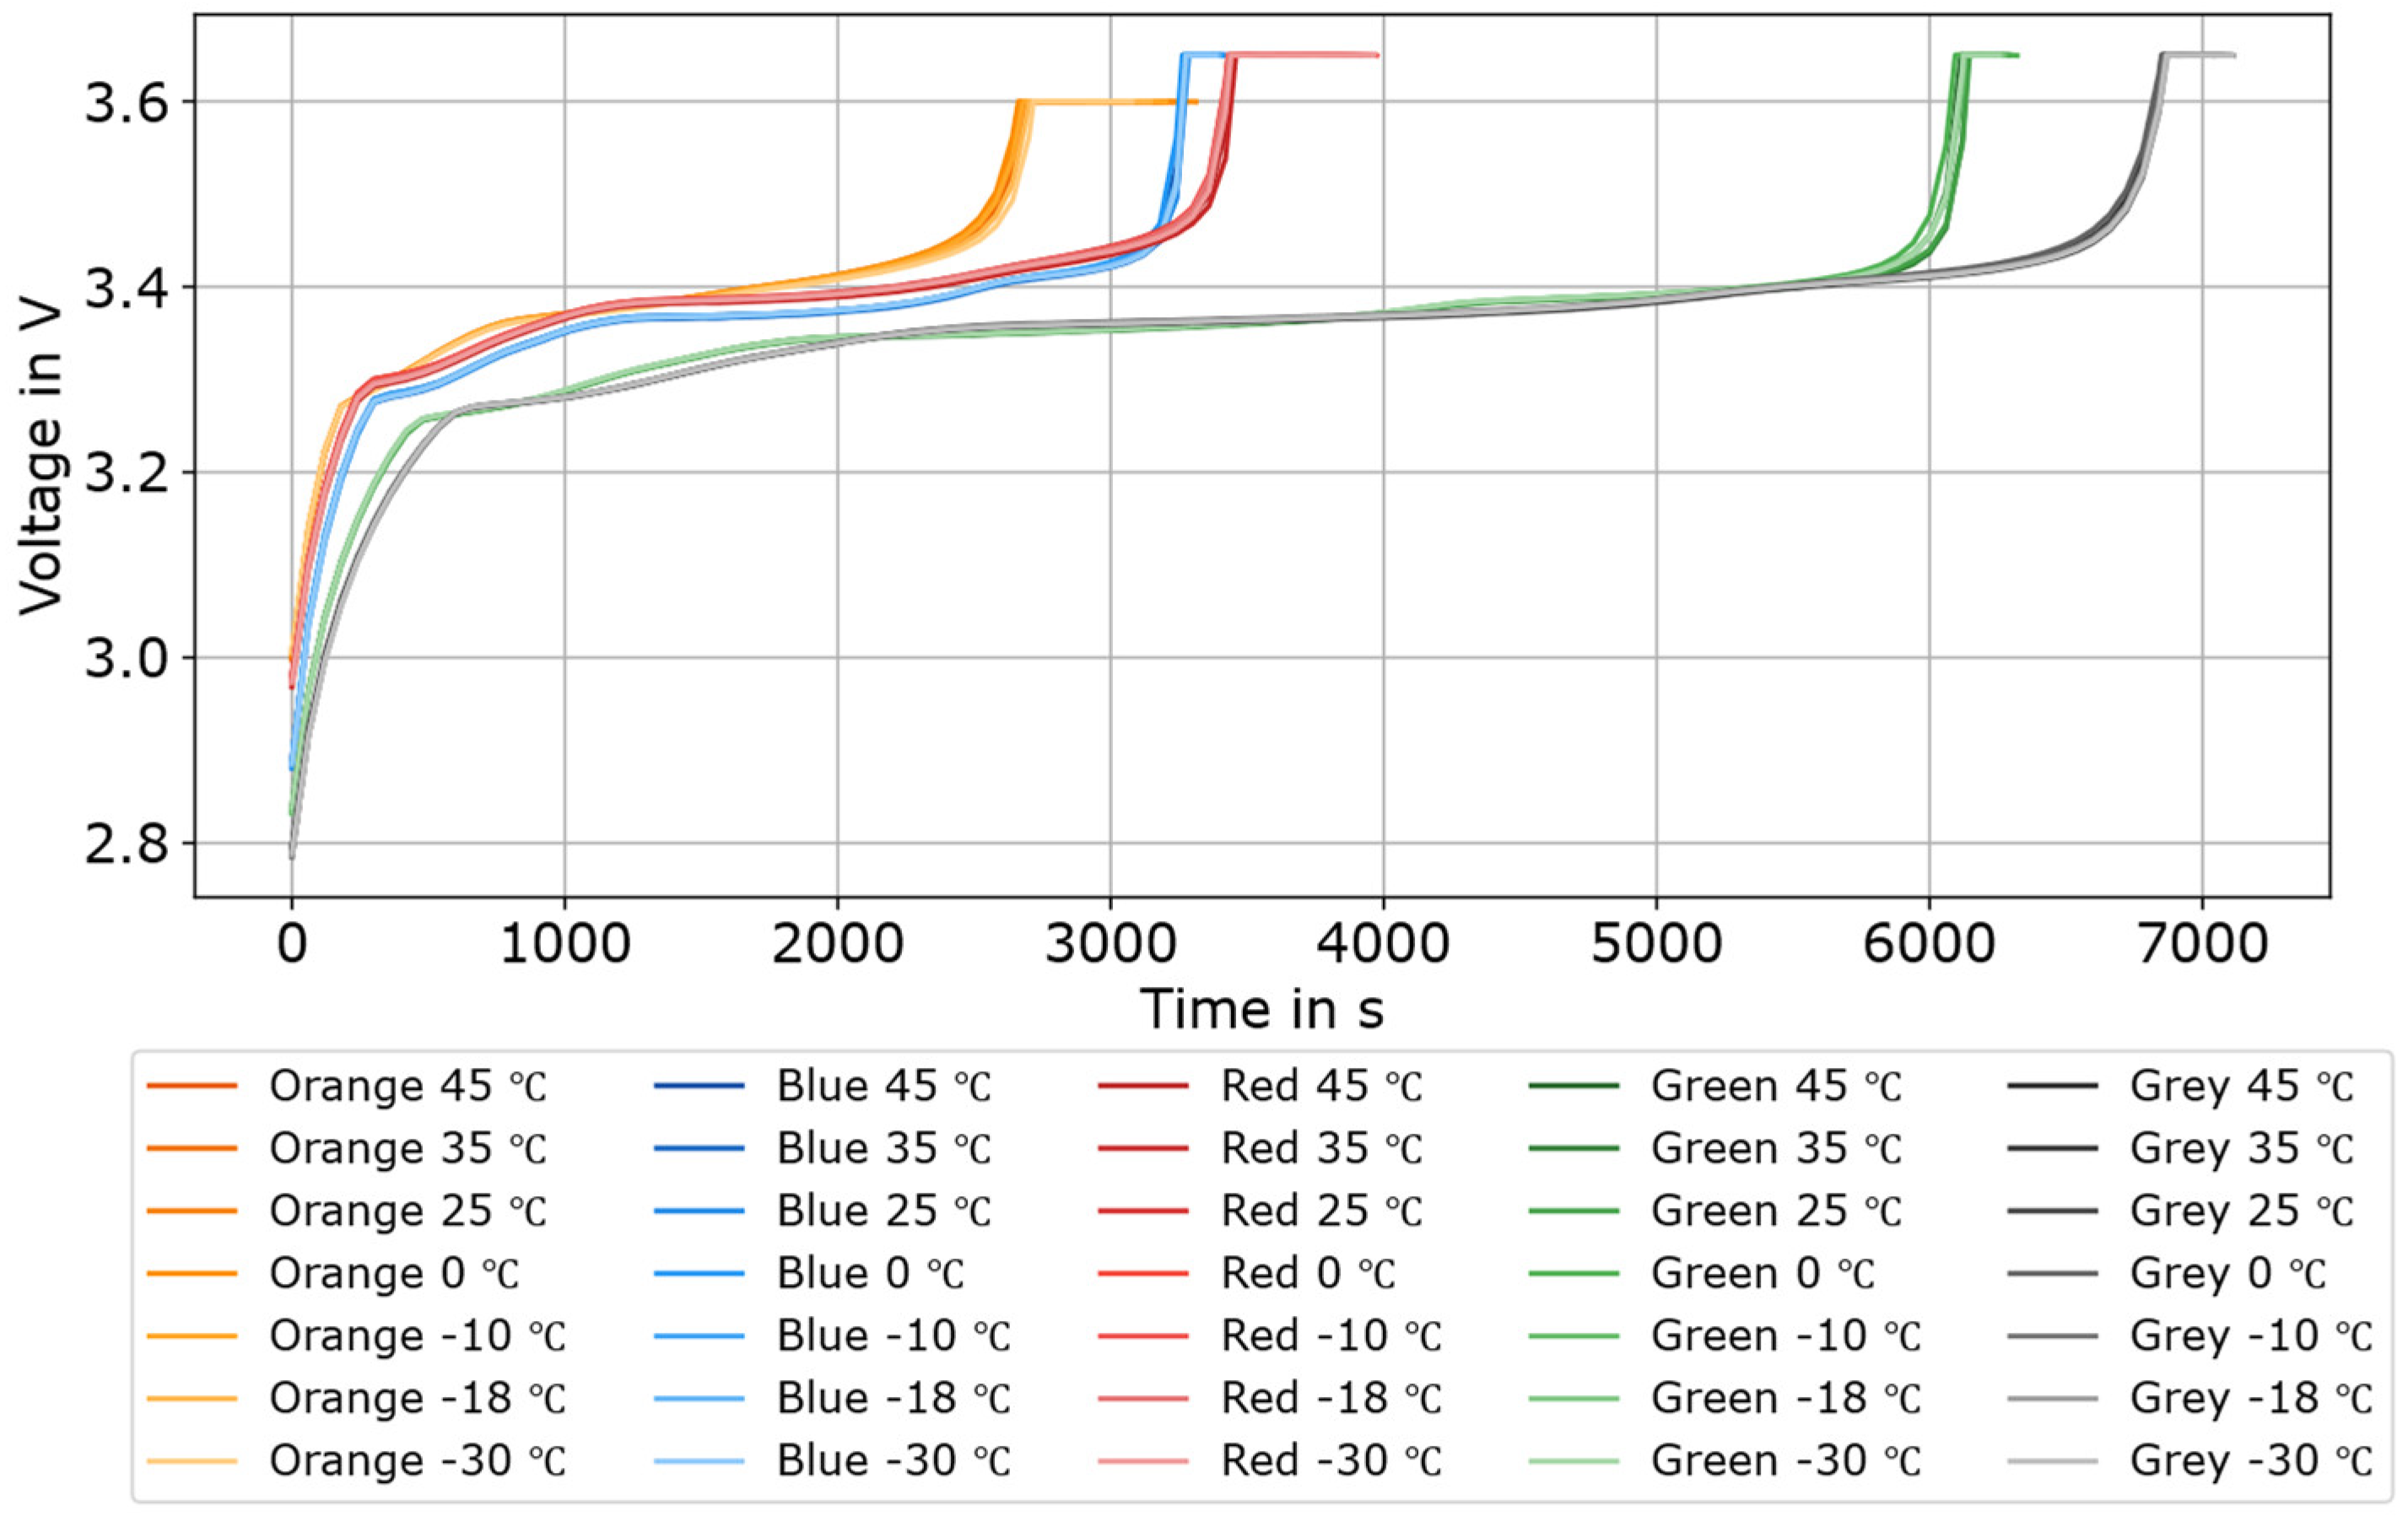
Figure 3 presents the voltage during the charging process and the corresponding surface temperature. No anomalies in the charging behaviour were observed, and CT scans [16] confirmed the absence of defects. The total temperature increase was less than 2 °C in total, with three distinct decreases. The first decrease occurred immediately after the initiation of charging, due to endothermic effects during intercalation. The second decrease manifested prior to the cell reaching 100% SOC and was likely due to increasing resistance. The third decrease was observed once the cells had reached full charge and the energy supply stopped. According to the data sheets, it must also be noted that the maximum permissible continuous charging rate at 25 °C varies by cell type and is 2 C for the red cell, 4 C for the green cell, 3.3 C for the orange cell, 5 C for the blue cell, and 3 C for the grey cell. Furthermore, some data sheets specify that for short-duration pulse charging of 10 s, the allowable C-rate can be further increased, for example, by a factor of 2.5 in the case of the orange cell. As shown in Appendix A.4 in Appendix A, the charge capacity and voltage during charging did not change significantly over the course of the tests, and therefore the cells are assumed to be intact over all discharging sequences, as the reported durability of LFP cells suggests.

4.1.2. Homogeneity of Self-Heating at 25 °C

To gain additional insights, the temperature of the battery cell was monitored at room temperature. As invasive measurement techniques were unsuitable due to the risk of damaging the cell, only its surface temperature could be measured. Consequently, infrared thermography and contact-based temperature sensors were considered for temperature acquisition. To control the ambient temperature during all experiments, the battery cell was operated inside a climatic chamber. At an ambient temperature of 25 °C, thermographic measurements could be conducted from outside the chamber. At other temperature setpoints, opening the chamber would have altered the thermal boundary conditions and compromised the validity of the measurements.
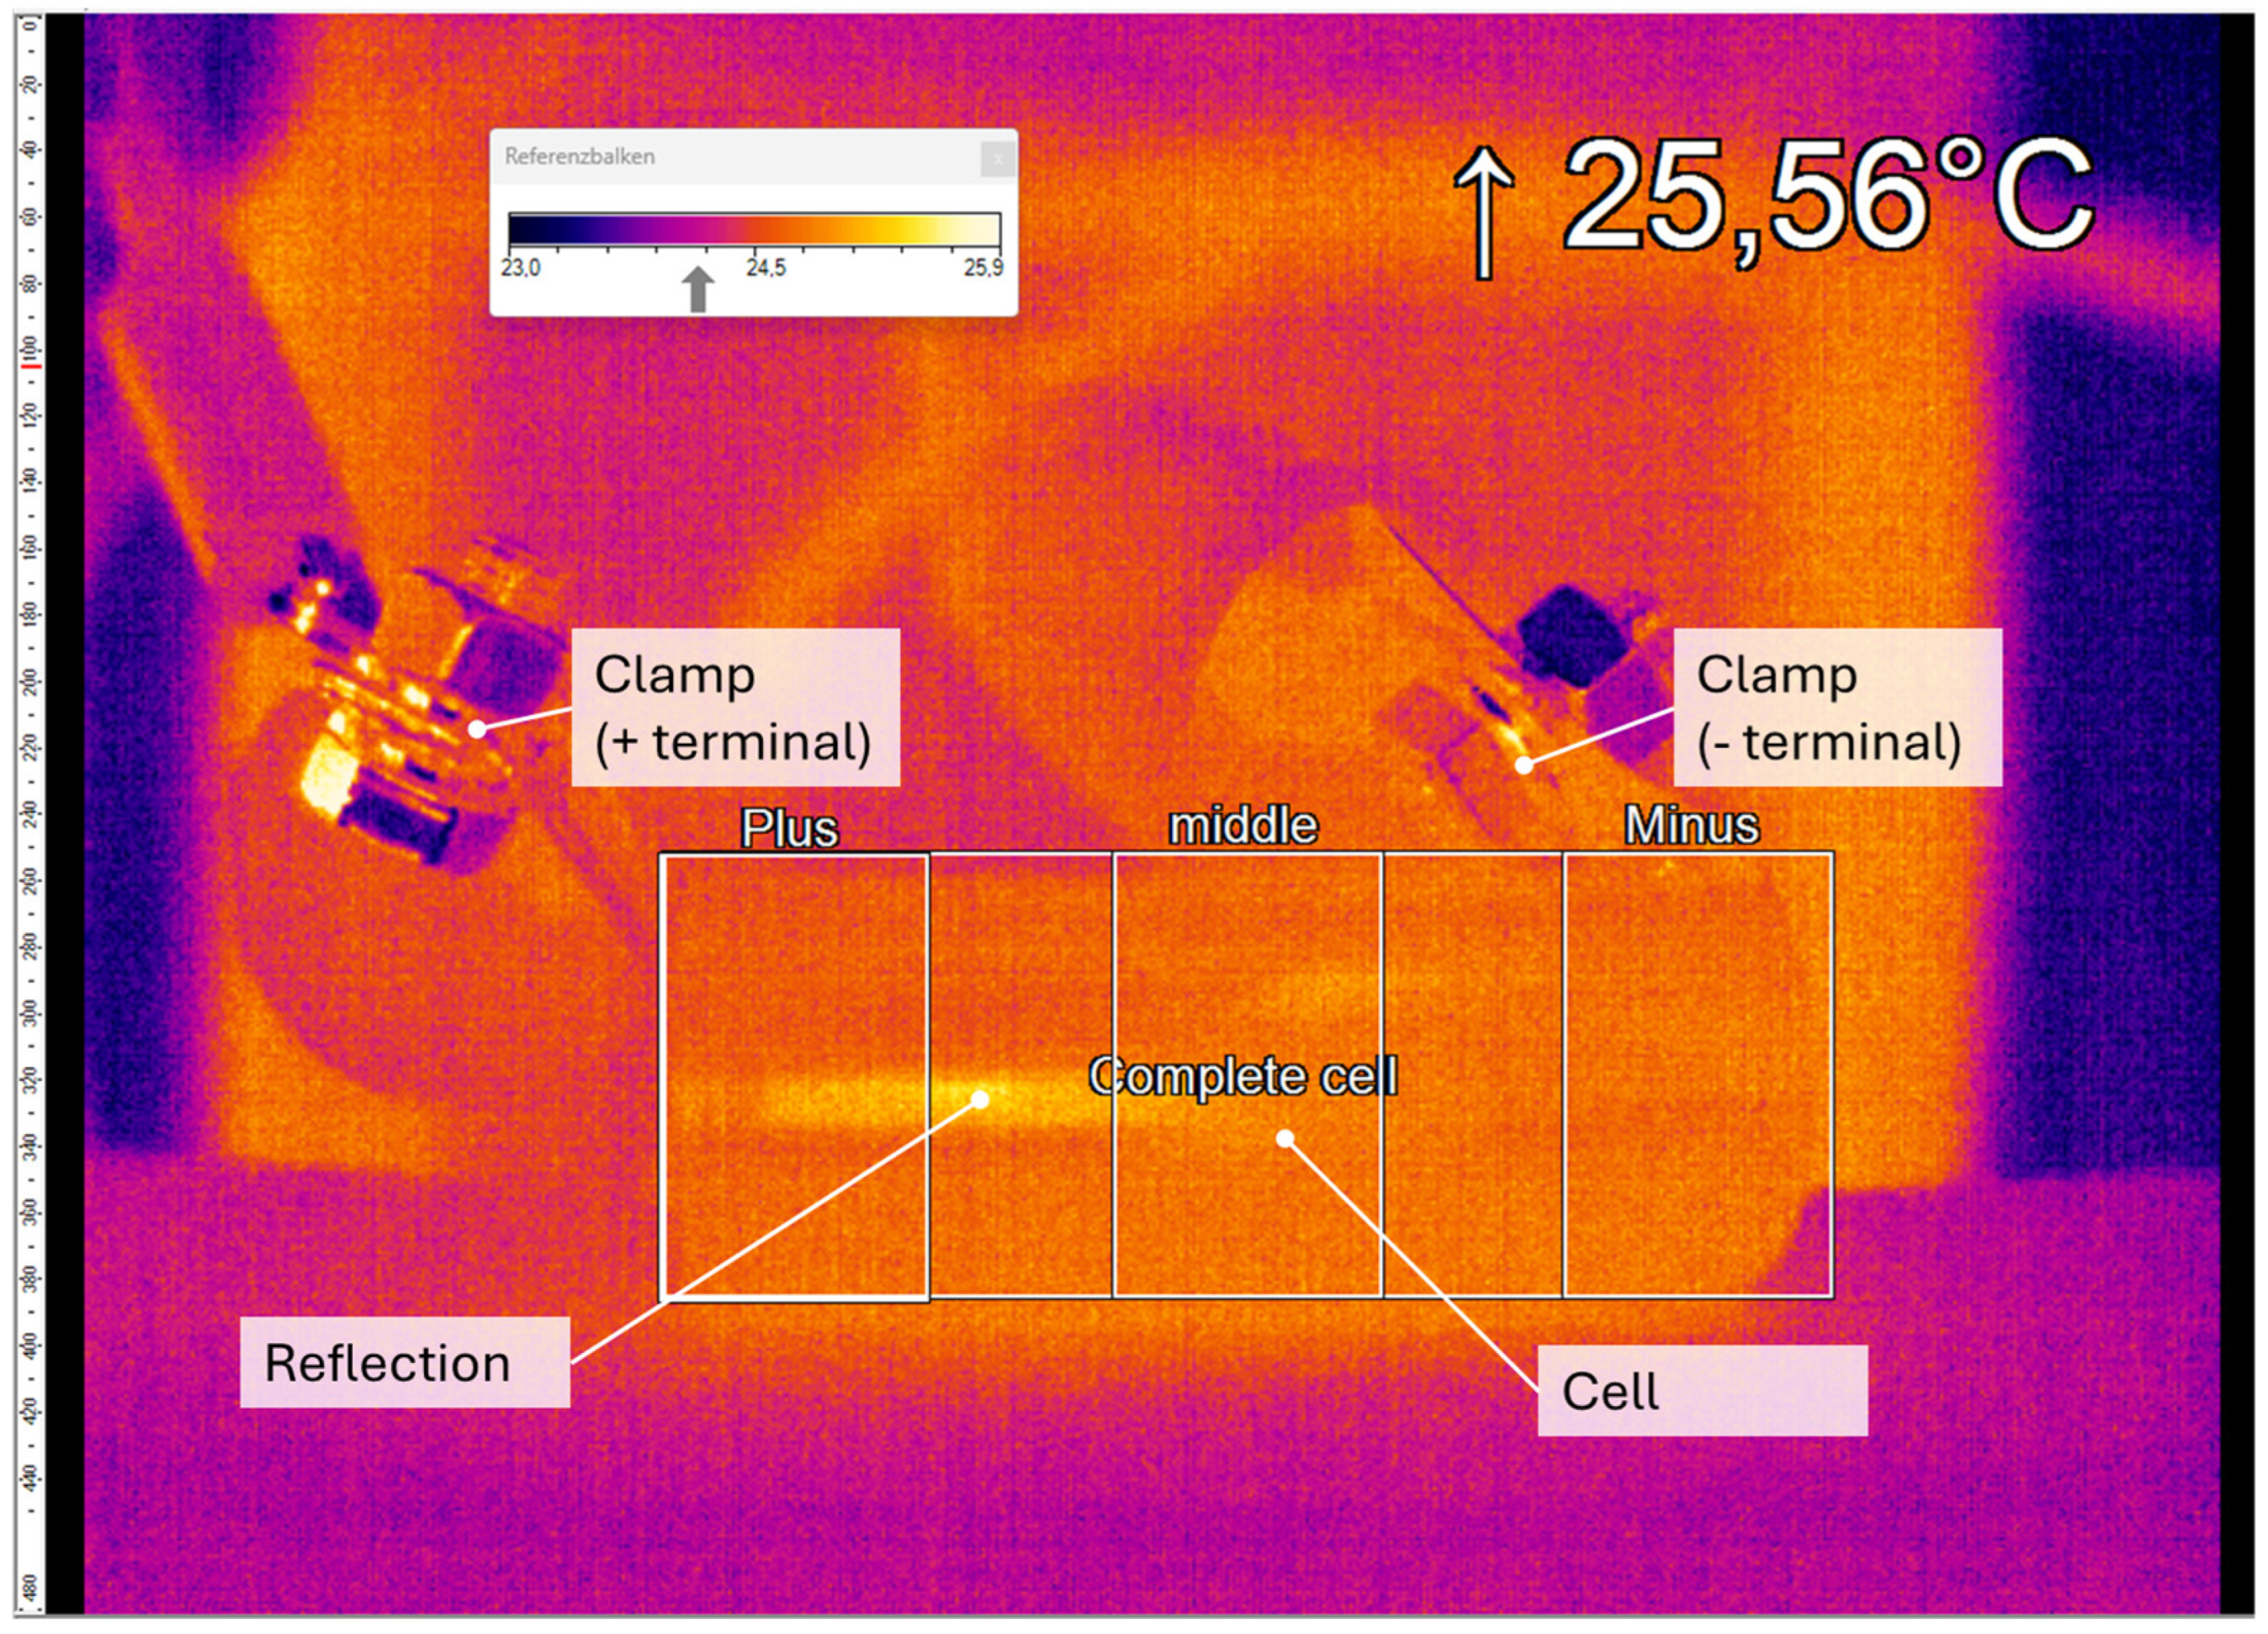
Therefore, thermographic measurements were performed exclusively during the first experiment at 25 °C to evaluate temperature inhomogeneities on the cell surface. An example of the heating process after the first pulses is shown in Figure 4. Despite the presence of a band-shaped reflection artefact (25.5 °C), displayed on the left side, the temperatures at the terminals and in the central area of the cell were homogeneous, reaching circa 24.5 °C, slightly above the ambient temperature (circa 24 °C). As opposed to long discharge no temperature inhomogeneities were observed during the short discharge pulse. Therefore, the results support a single sensor at the centre of the cell for monitoring self-heating.

4.1.3. Temperature Development During Discharge

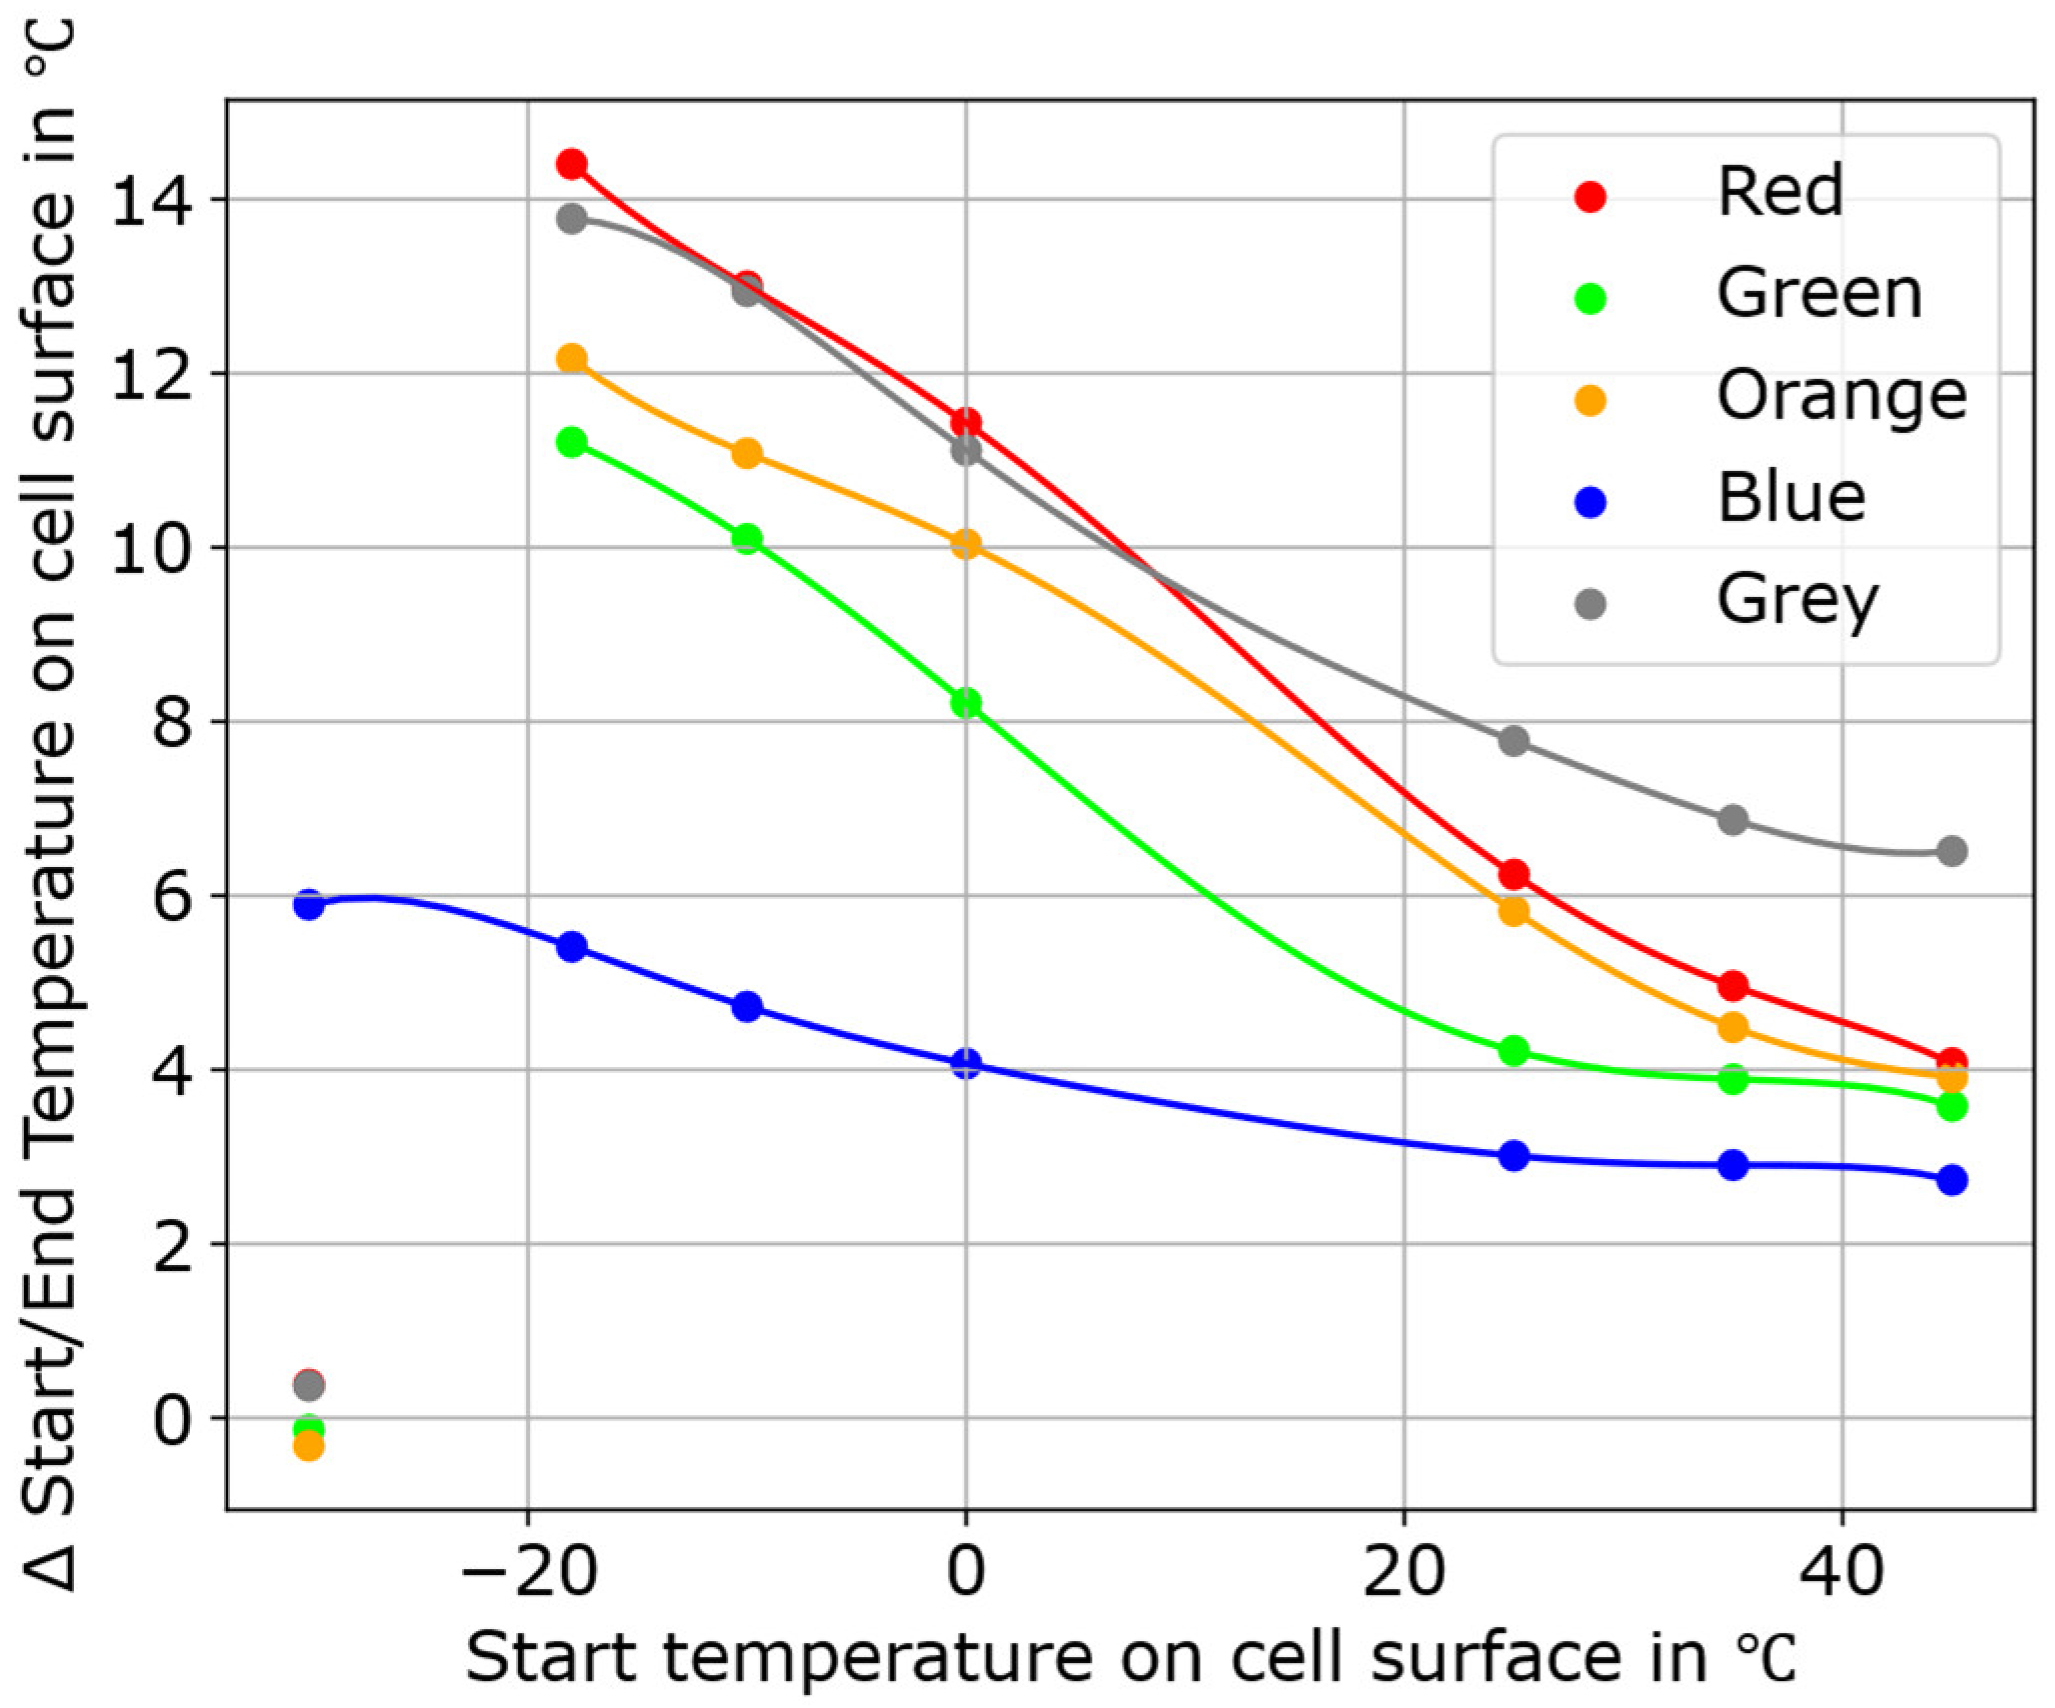
The cells underwent a progressive increase in temperature throughout the pulses when operated in a colder environment, as presented in Figure 5. All cells, except for the blue one, demonstrated similar thermal behaviour during the experiments, exhibiting an approximate fourfold increase in temperature, from 3–5 °C at room temperature to 11–15 °C at −18 °C. By contrast, the temperature of the blue cell only doubled, rising from around 3 °C to 6 °C. The temperature variations in the orange 18650 cell were analogous to those in the 26650 cells, indicating no significant difference between these formats. A minimal temperature rise at elevated ambient temperatures is contrasted with an increase of 12–15 °C recorded at −18 °C. Consequently, the cell surface temperature remained below zero. At −30 °C, the increase in temperature for all cells, apart from the blue cell, was minor. This phenomenon is attributed to the reduced electrical performance, as described in Section 4.2. Notably, the blue cell maintained high efficiency with lower thermal dissipation, even at −30 °C, setting it apart from the other cells. Therefore, it can be concluded that self-heating is not the prime factor influencing cell performance. Electrical performance and self-heating might depend on the cell’s impedance, probably mainly defined by the deployed electrolyte chemistry.

4.2. Energy and Power over Ambient Temperature

To assess the electrical performance of the cells with respect to ambient temperature, Section 4.2.1 evaluates the number of discharging sequences achieved per cell at different temperatures, while Section 4.2.2 analyses the corresponding energy and power output to assess the impact of temperature on energy output over all discharge sequences and the respective power for the first and second pulse. Details of the experiments are presented in the Appendix A, in Appendix A.4 and Appendix A.6, respectively.

4.2.1. Summary of Discharge Sequences

Table 3 presents the number of complete discharge sequences (0.5 s at 9 C, 4 s at 5.4 C and a 10 s pause) until voltage cut-off at each ambient temperature in the sequence of the experiments. Before analysing the results, it is important to note that selecting an appropriate cell requires independent testing, since the specifications provided in the data sheets may be unreliable. For example, despite their purported suitability suggested by the data sheets, the grey and orange cells were non-functional at −30 °C. Between 45 °C and 0 °C, the number of completed pulses fluctuates between +2 and −1. Notably, the blue cell completes four to eleven fewer pulses than the other cells in this temperature range.
At temperatures below 0 °C, the performance remains constant or increases slightly for two pulses until −18 °C for the green variant. In contrast, the performance of the red, orange, blue and grey cells decreases by 23 to six pulses compared to room temperature. Compared to room temperature, the performance of the red, green, orange and grey cells is reduced by 111 to 106 pulses at −30 °C, whereas the blue cell performs 23 pulses (21.9%) fewer than its initial performance. The blue cell has the thinnest anode thickness and largest negative tab area of the cells examined [16]. Apart from chemical reasons, this might explain the low-temperature capability of this cell. In addition to the number of pulses performed, it is essential to evaluate the electrical performance throughout the discharging sequence, as discussed in Section 4.2.

4.2.2. Yield with Respect to Ambient Temperature

The discharge behaviour of all cells was assessed using two different methodologies. First, the energy across the complete discharging sequence at each temperature was evaluated as an efficiency measure. Second, the power of the first pulse at each temperature was analysed to gain insights into the initial pulse capability. These two steps evaluate the cells’ ability to deliver the required capacity and achieve the necessary cold-cranking power.
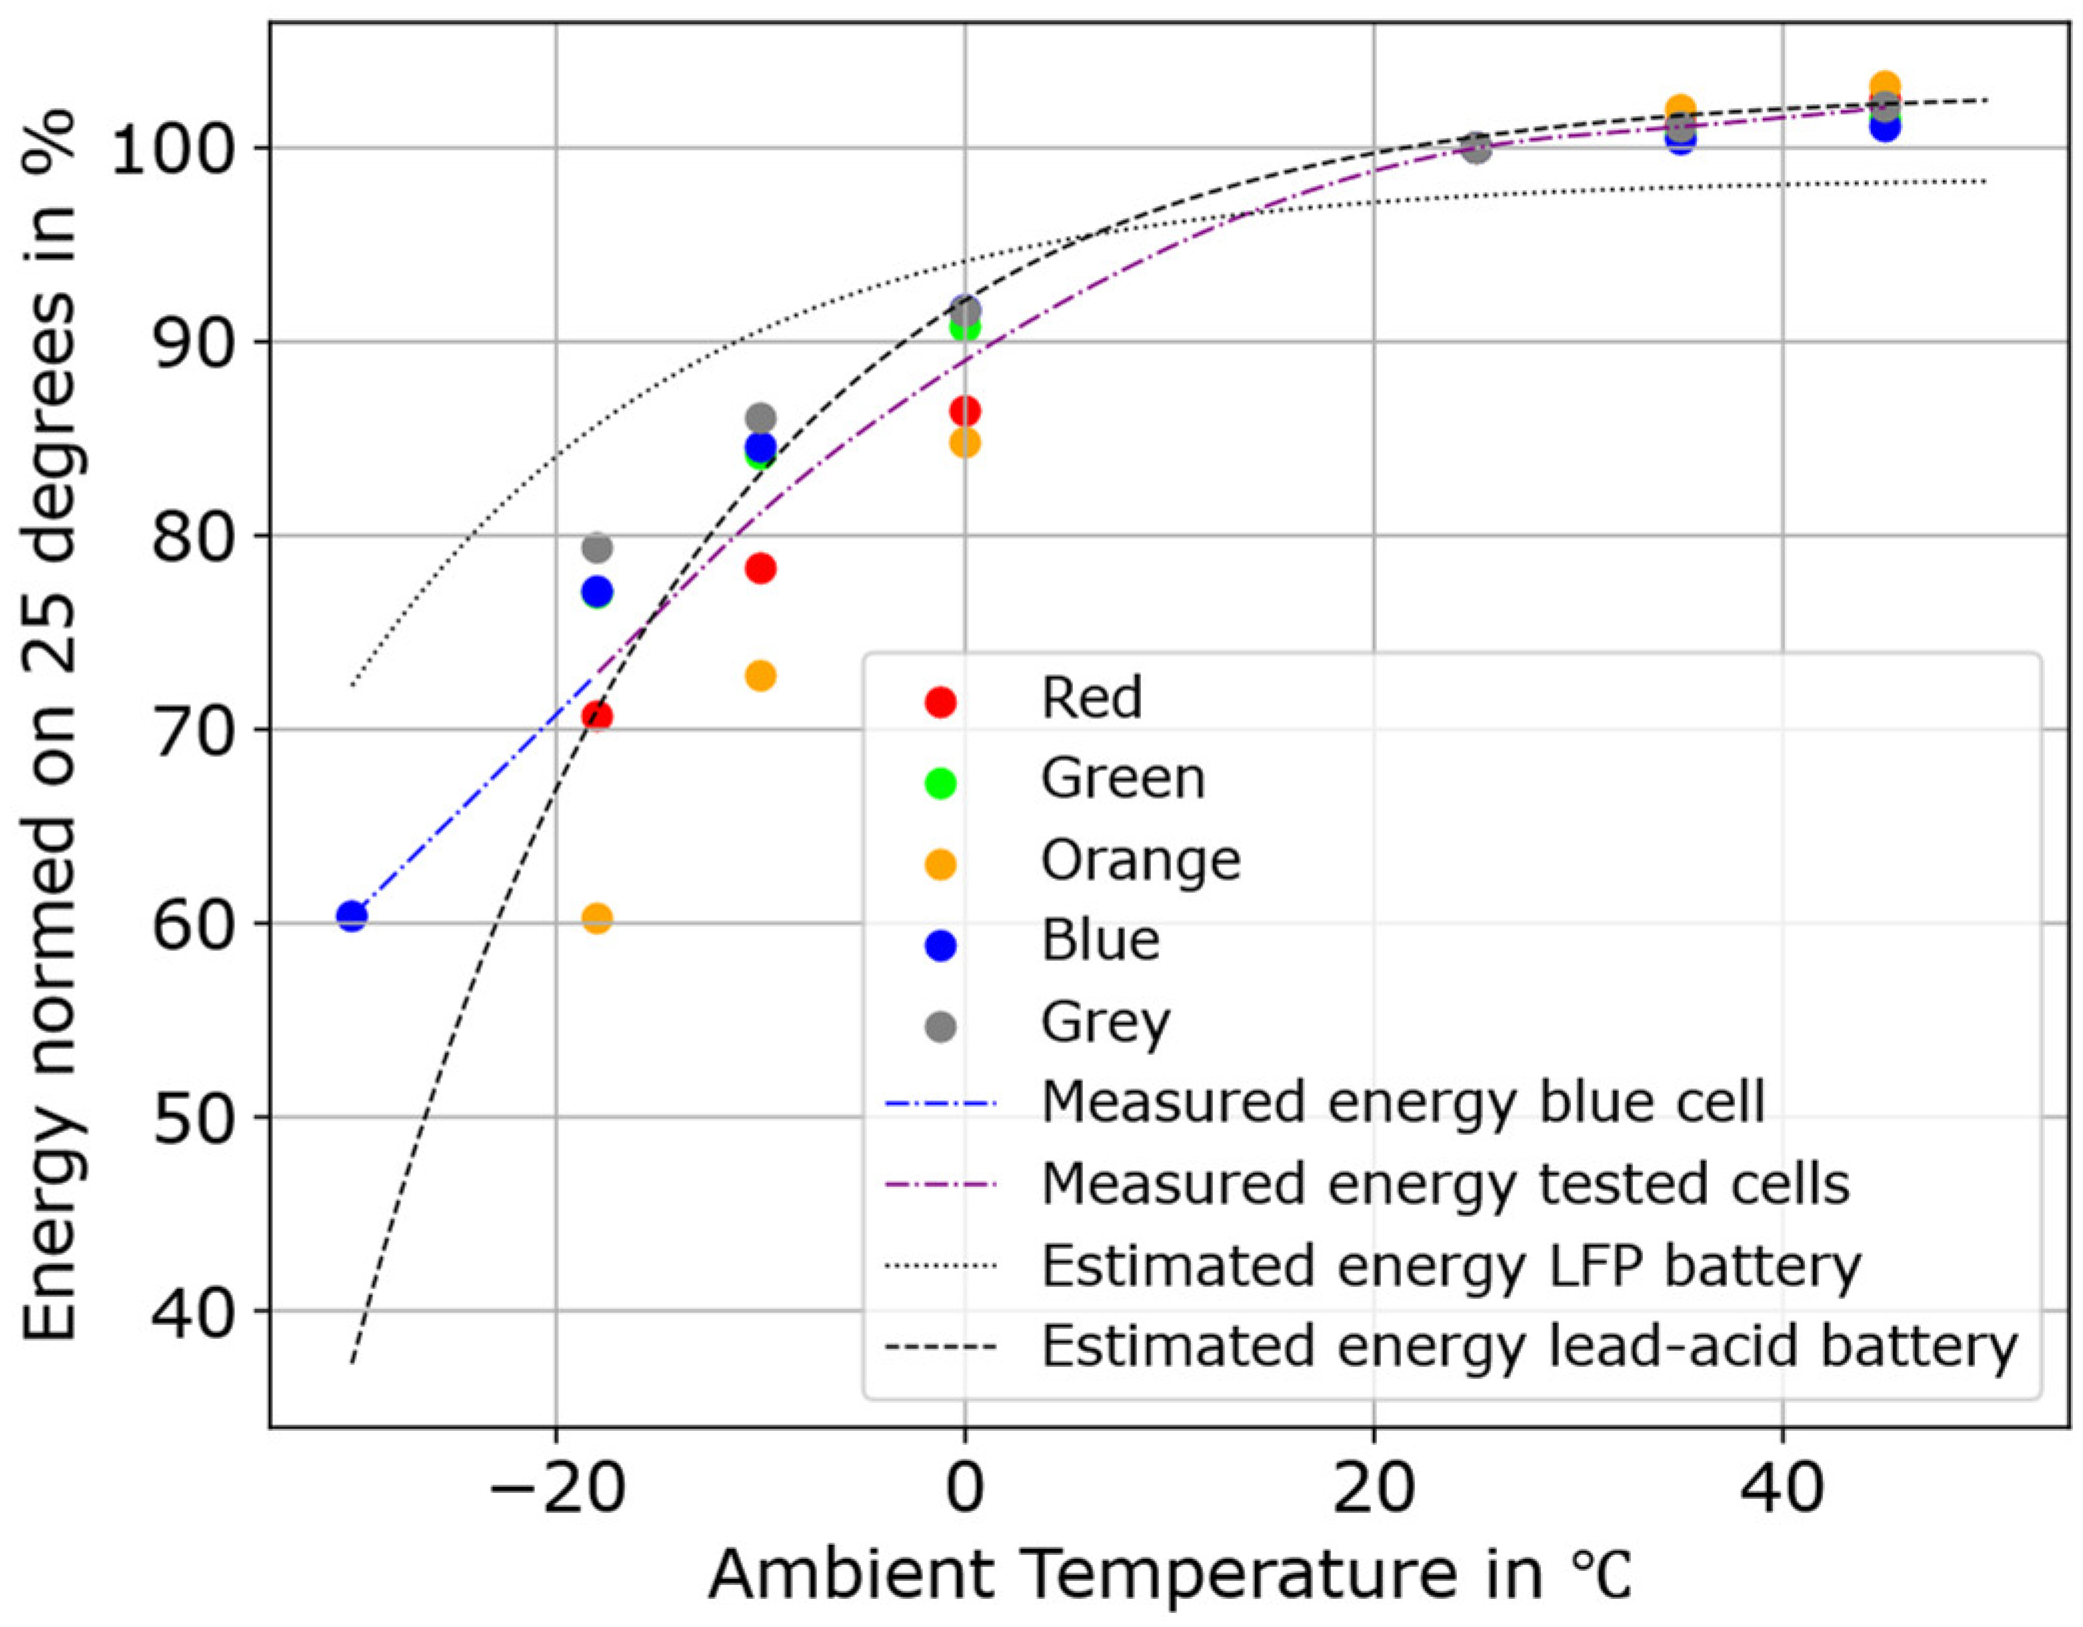
Figure 6 shows the energy output of all cells normalised to their room temperature value. Additionally, the average energy of the experiments is depicted as a purple dash-dot line, which is derived from the results of all cells except for the −30 °C condition, where only the blue cell’s result is utilised (shown as the blue continuation of the dash-dot line). Consequently, it must be noted that the −30 °C data point represents a single cell type and must not be interpreted as a trend. As shown in Appendix A.4 in Appendix A, no significant voltage drops for the first pulses were observed during the short pulses. Therefore, the capacity and energy can be considered equivalent. Consequently, the plot also depicts the anticipated values from Figure 1 for lead–acid and LFP batteries.
The average of the energy provided by the LFP cells decreased stronger than could be expected for temperatures below room temperature. Except for the red and orange cells, LFP provides similar or higher energy output than lead–acid. The measurements reveal that the energy level decreases exponentially to 60.4% at −30 °C, whereas it remains between 70.7% and 79.4% for all 26650 cells at −18 °C. The 18650 cell (orange) has an energy output that decreases faster than the expected lead–acid battery. It maintains at 60.2% until −18 °C and then ceases to function at −30 °C. Obviously, the lower diameter increases the thermal effects of cooling.
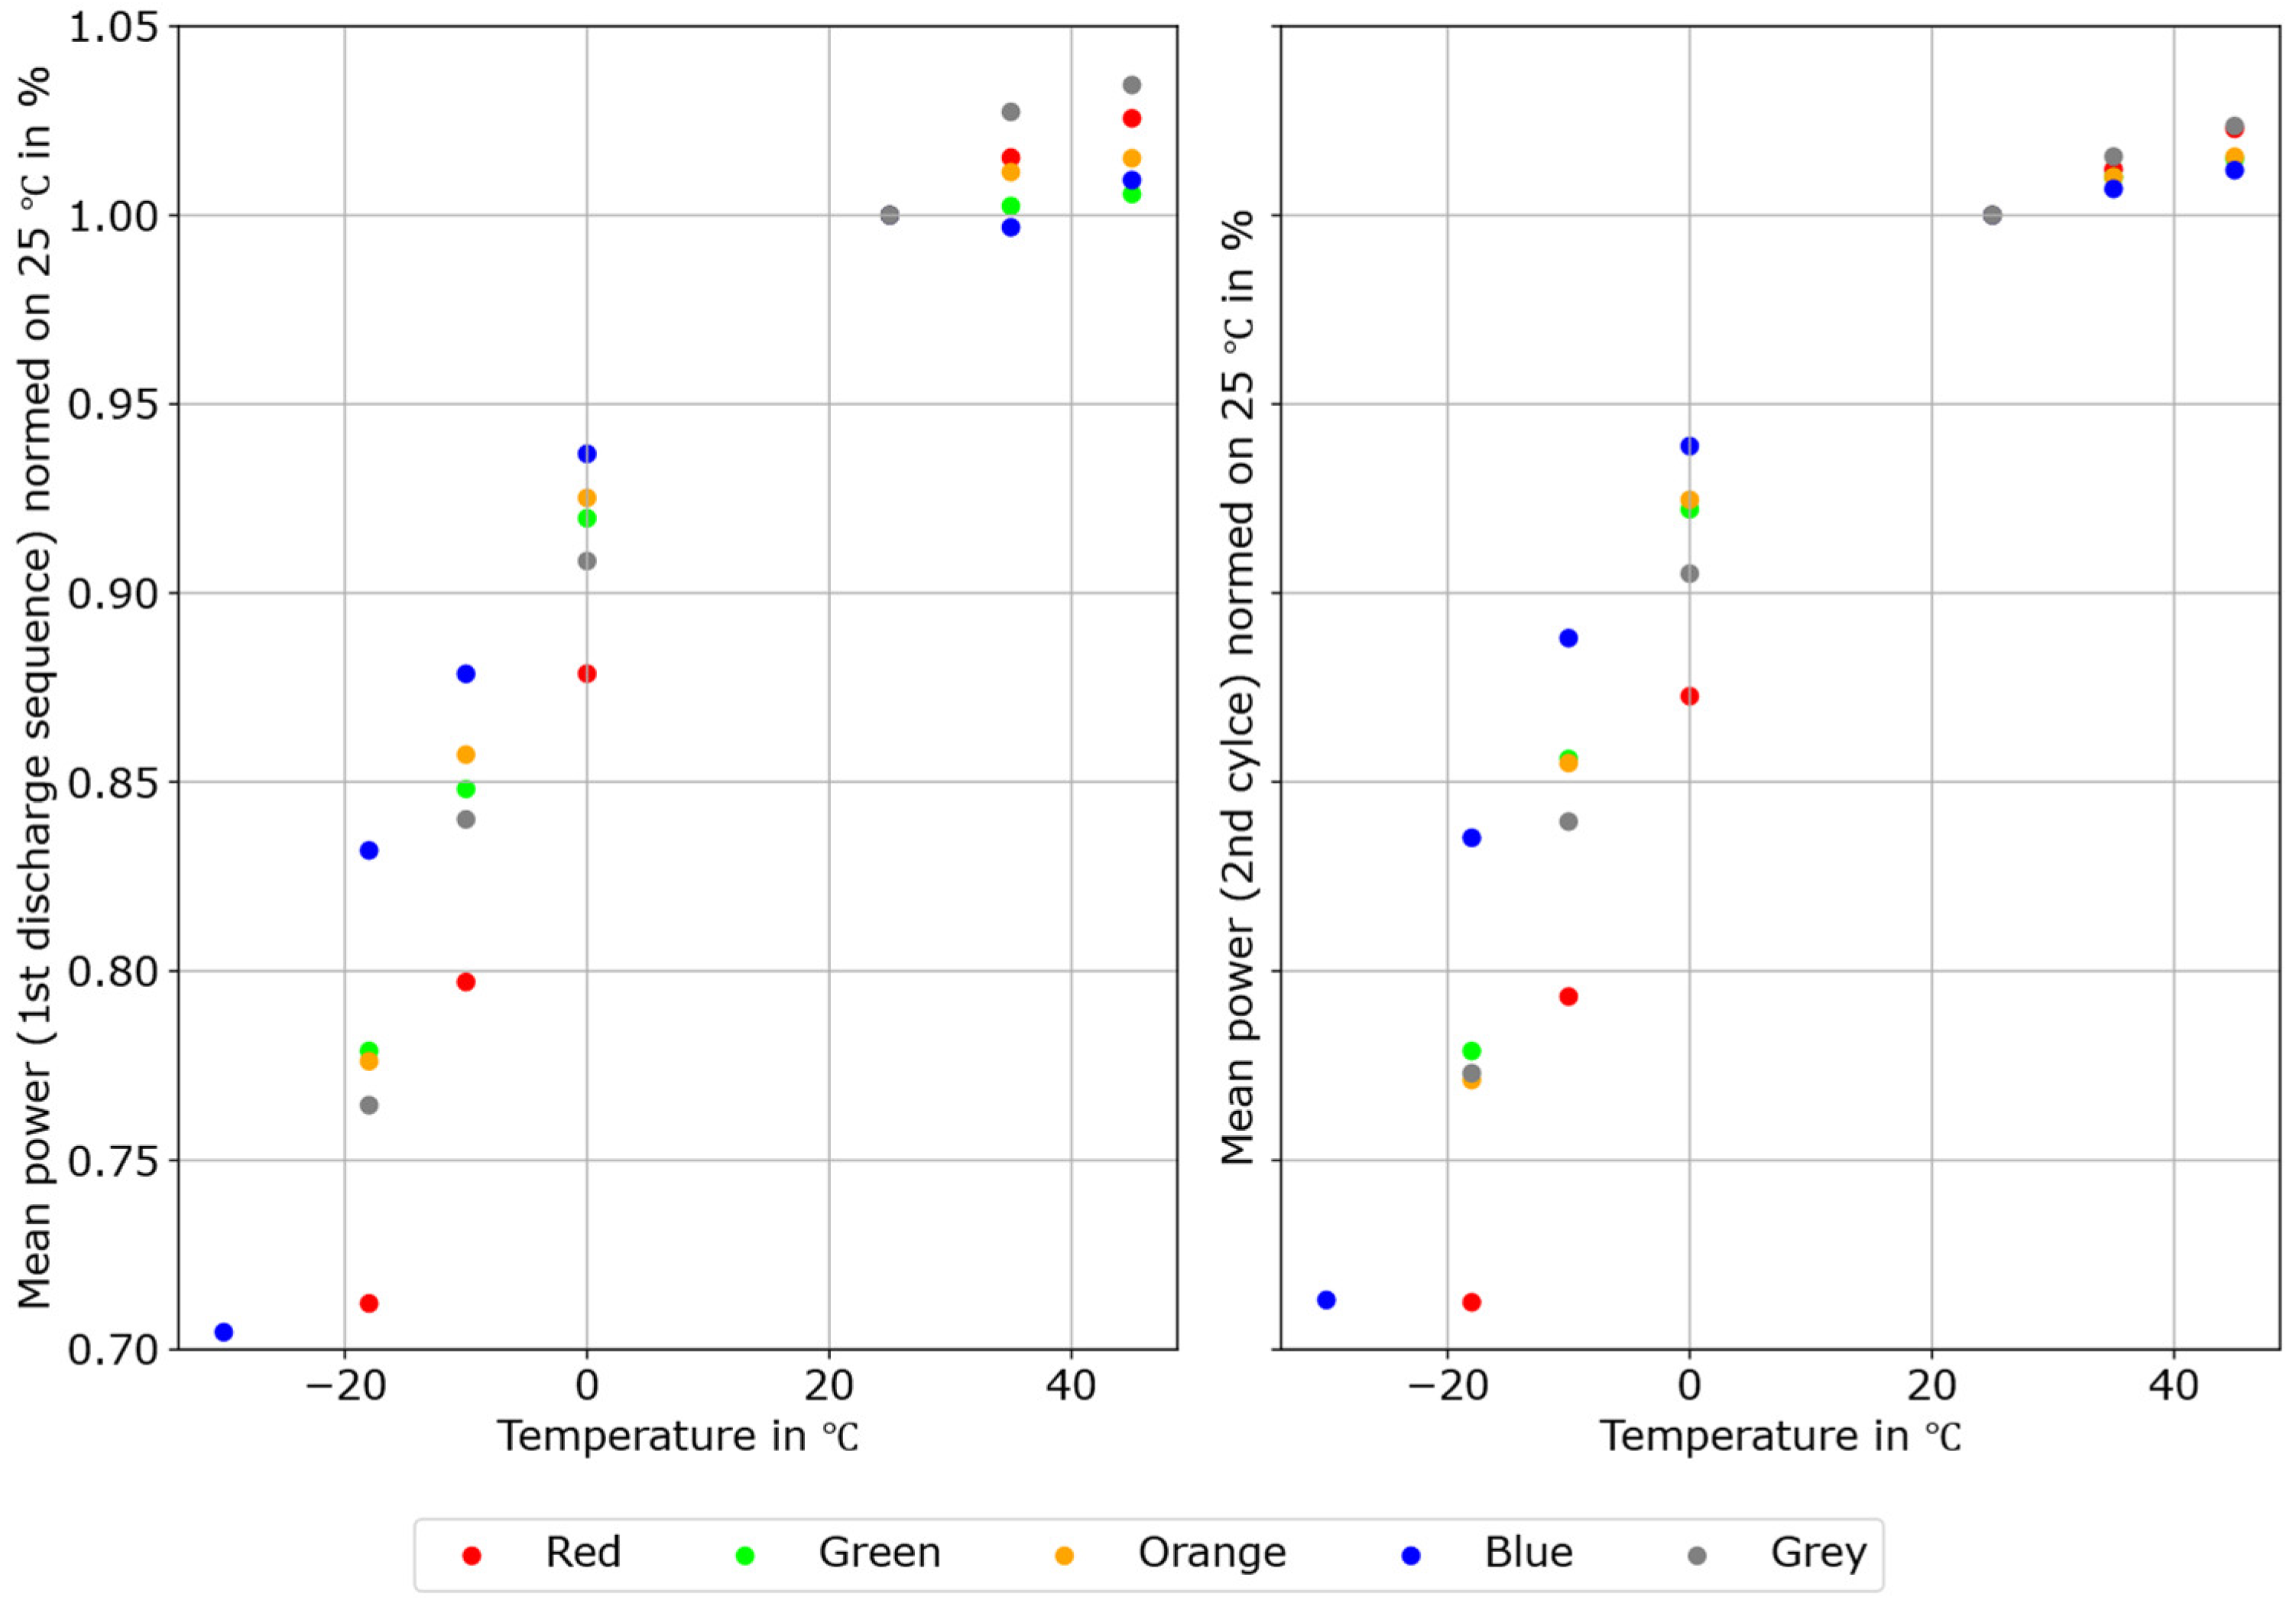
Regarding average power, the normalised power based on room temperature over the 4.5 s pulse (0.5 s plus a 4 s load) is shown in Figure 7. The left-hand side displays the first pulse, while the right-hand side shows the second pulse based on the arithmetic mean of each pulse. Consequently, the average power during the pulse was computed and normalised against the average power at 25 °C. It is observed that there is a slight increase in power when the cell temperature exceeds 25 °C. Conversely, the power output decreases to between 71.2% and 83.2% of the room temperature value at −18 °C, whereas the blue cell maintains a power output of 70.5% even at −30 °C. The analysis of the second pulse indicates that the power increases slightly in the second pulse for negative temperatures for all except for the blue cell. The power output for the blue cell over the discharging sequence is presented in Figure A8 in Appendix A. The blue cell’s power output increases the most (e.g., 0.95% at −10 °C and 0.85% at −30 °C) between the first and the second pulse. Also, the green cell increases by 0.79% at −10 °C, and the grey cell increases by 0.85% at −18 °C. Hence, the grey cell outperforms the orange cell after the first pulse, but it should be noted that despite the lower output, the orange 18650 cell performs similarly in the first and second pulse to the 26650 cells in terms of power provision. The red cell’s performance decreased from the first to the second pulse for low temperatures.

5. Discussion

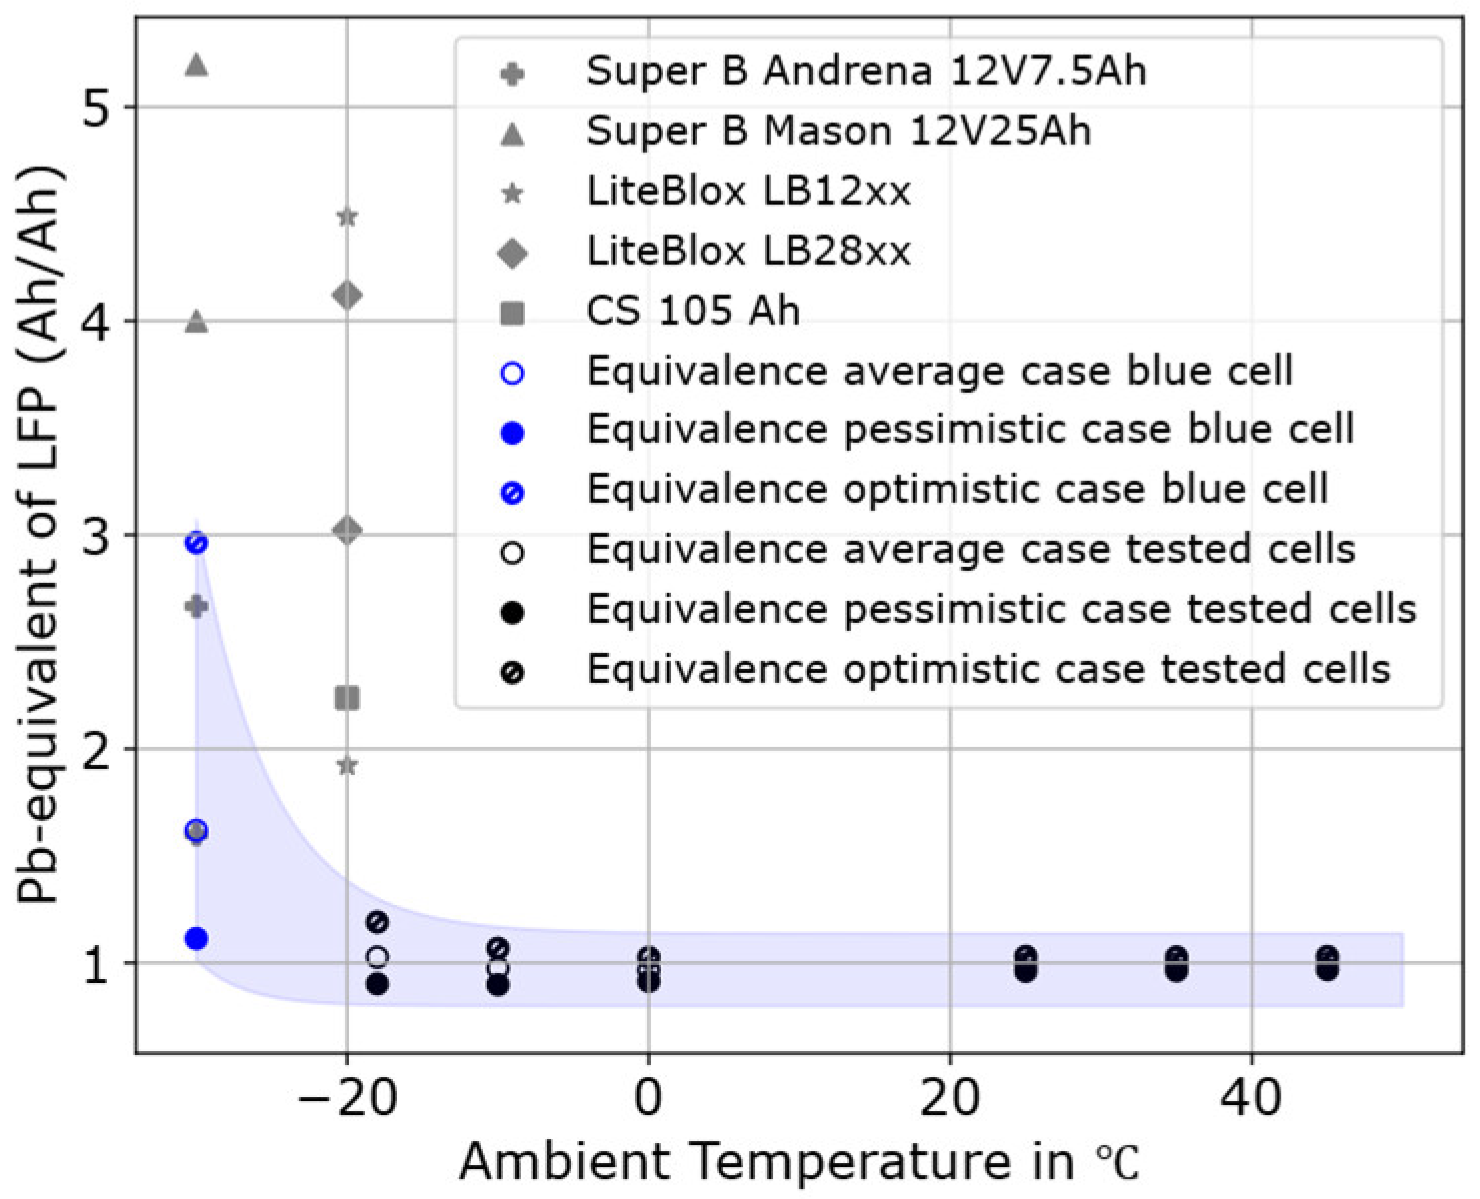
Based on the average energy derived from the experimental results displayed in Figure 6 and the lead–acid threshold range illustrated in Figure 1, a Pb-equivalent (ϕ) as a quotient of the respective average energy quantifies the capacity-related replacement potential, assuming an equal voltage development for lead–acid at each given ambient temperature. This can be described by the following:
ϕ E = E L F P , T · E P b , 25 E L F P , 25 · E P b , T 1 n ( T ) c = 1 n ( T ) t 0 t 1 P L F P , T , c t d t · C P b , 25 · V P b ( 25 ) 1 n ( T ) c = 1 n ( T ) t 0 t 1 P L F P , 25 , c t d t · C P b , T · V P b ( T ) = 1 n ( T ) c = 1 n ( T ) t 0 t 1 P L F P , T , c t d t · C P b , 25 1 n ( T ) c = 1 n ( T ) t 0 t 1 P L F P , 25 , c t d t · C P b , T
The formula is to be read as follows. (T) stands for temperature, n T is the number of tested cells (c) for each temperature. For the respective temperatures, P is the weighted average power from discharge start ( t 0 ) to the end of the discharge sequence ( t 1 ) and cell, while C is the lead–acid capacity, and V describes the voltage.
To take the uncertainty of the lead–acid and LFP capacity into account, a scenario-based approach has been chosen, using the highest, lowest and average capacity and reference values for batteries available on the market. Some manufacturers provide recommendations for which lead–acid starter batteries can be replaced; these data are presented in Table A1 in Appendix A. The estimation is presented in Figure 8, where the expected value is defined by the average results from the conducted LFP experiments. The possible range is shown by a cone.
The starter functionality still requires meeting the power threshold during the initial pulses and will be discussed afterwards. The lead (Pb)-equivalence is nearly identical to lead–acid at temperatures up to −10 °C. However, it increases to circa 1.5 when a lead–acid battery is replaced at −20 °C. By contrast, most manufacturers report equivalence values ranging between 2 and 4.5. Calculations based on the results from the blue cell suggest that at −30 °C, the efficiency advantage of the LFP cells persists despite the low temperature, as the Pb-equivalence reaches 3 in the optimistic scenario. This finding aligns with the manufacturers’ claims. It must be noted that the derived Pb-equivalence at −30 °C is based on the only operational cell at −30 °C and therefore provides only a lower-bound/indicative estimate. Cross-type equivalence conclusions are restricted to −18 °C to +45 °C. The present screening indicates that four out of five tested high-power LFP cell types failed to complete the protocol at −30 °C, while the blue cell remained operational; therefore, low-temperature capability at −30 °C is cell-design-dependent and cannot be generalised across LFP chemistry. For future experiments it is essential to identify the limits of ambient temperature.
Notably, the CS 105 Ah battery is the closest to the cone at −20 °C. Given that the capacity of this battery is 80 Ah higher than that of the next one, it can be inferred that other manufacturers have identified alternative use cases and that their equivalence is not primarily based on capacity. Also, it is not known what dependency between cell temperature and ambient temperature they assume.
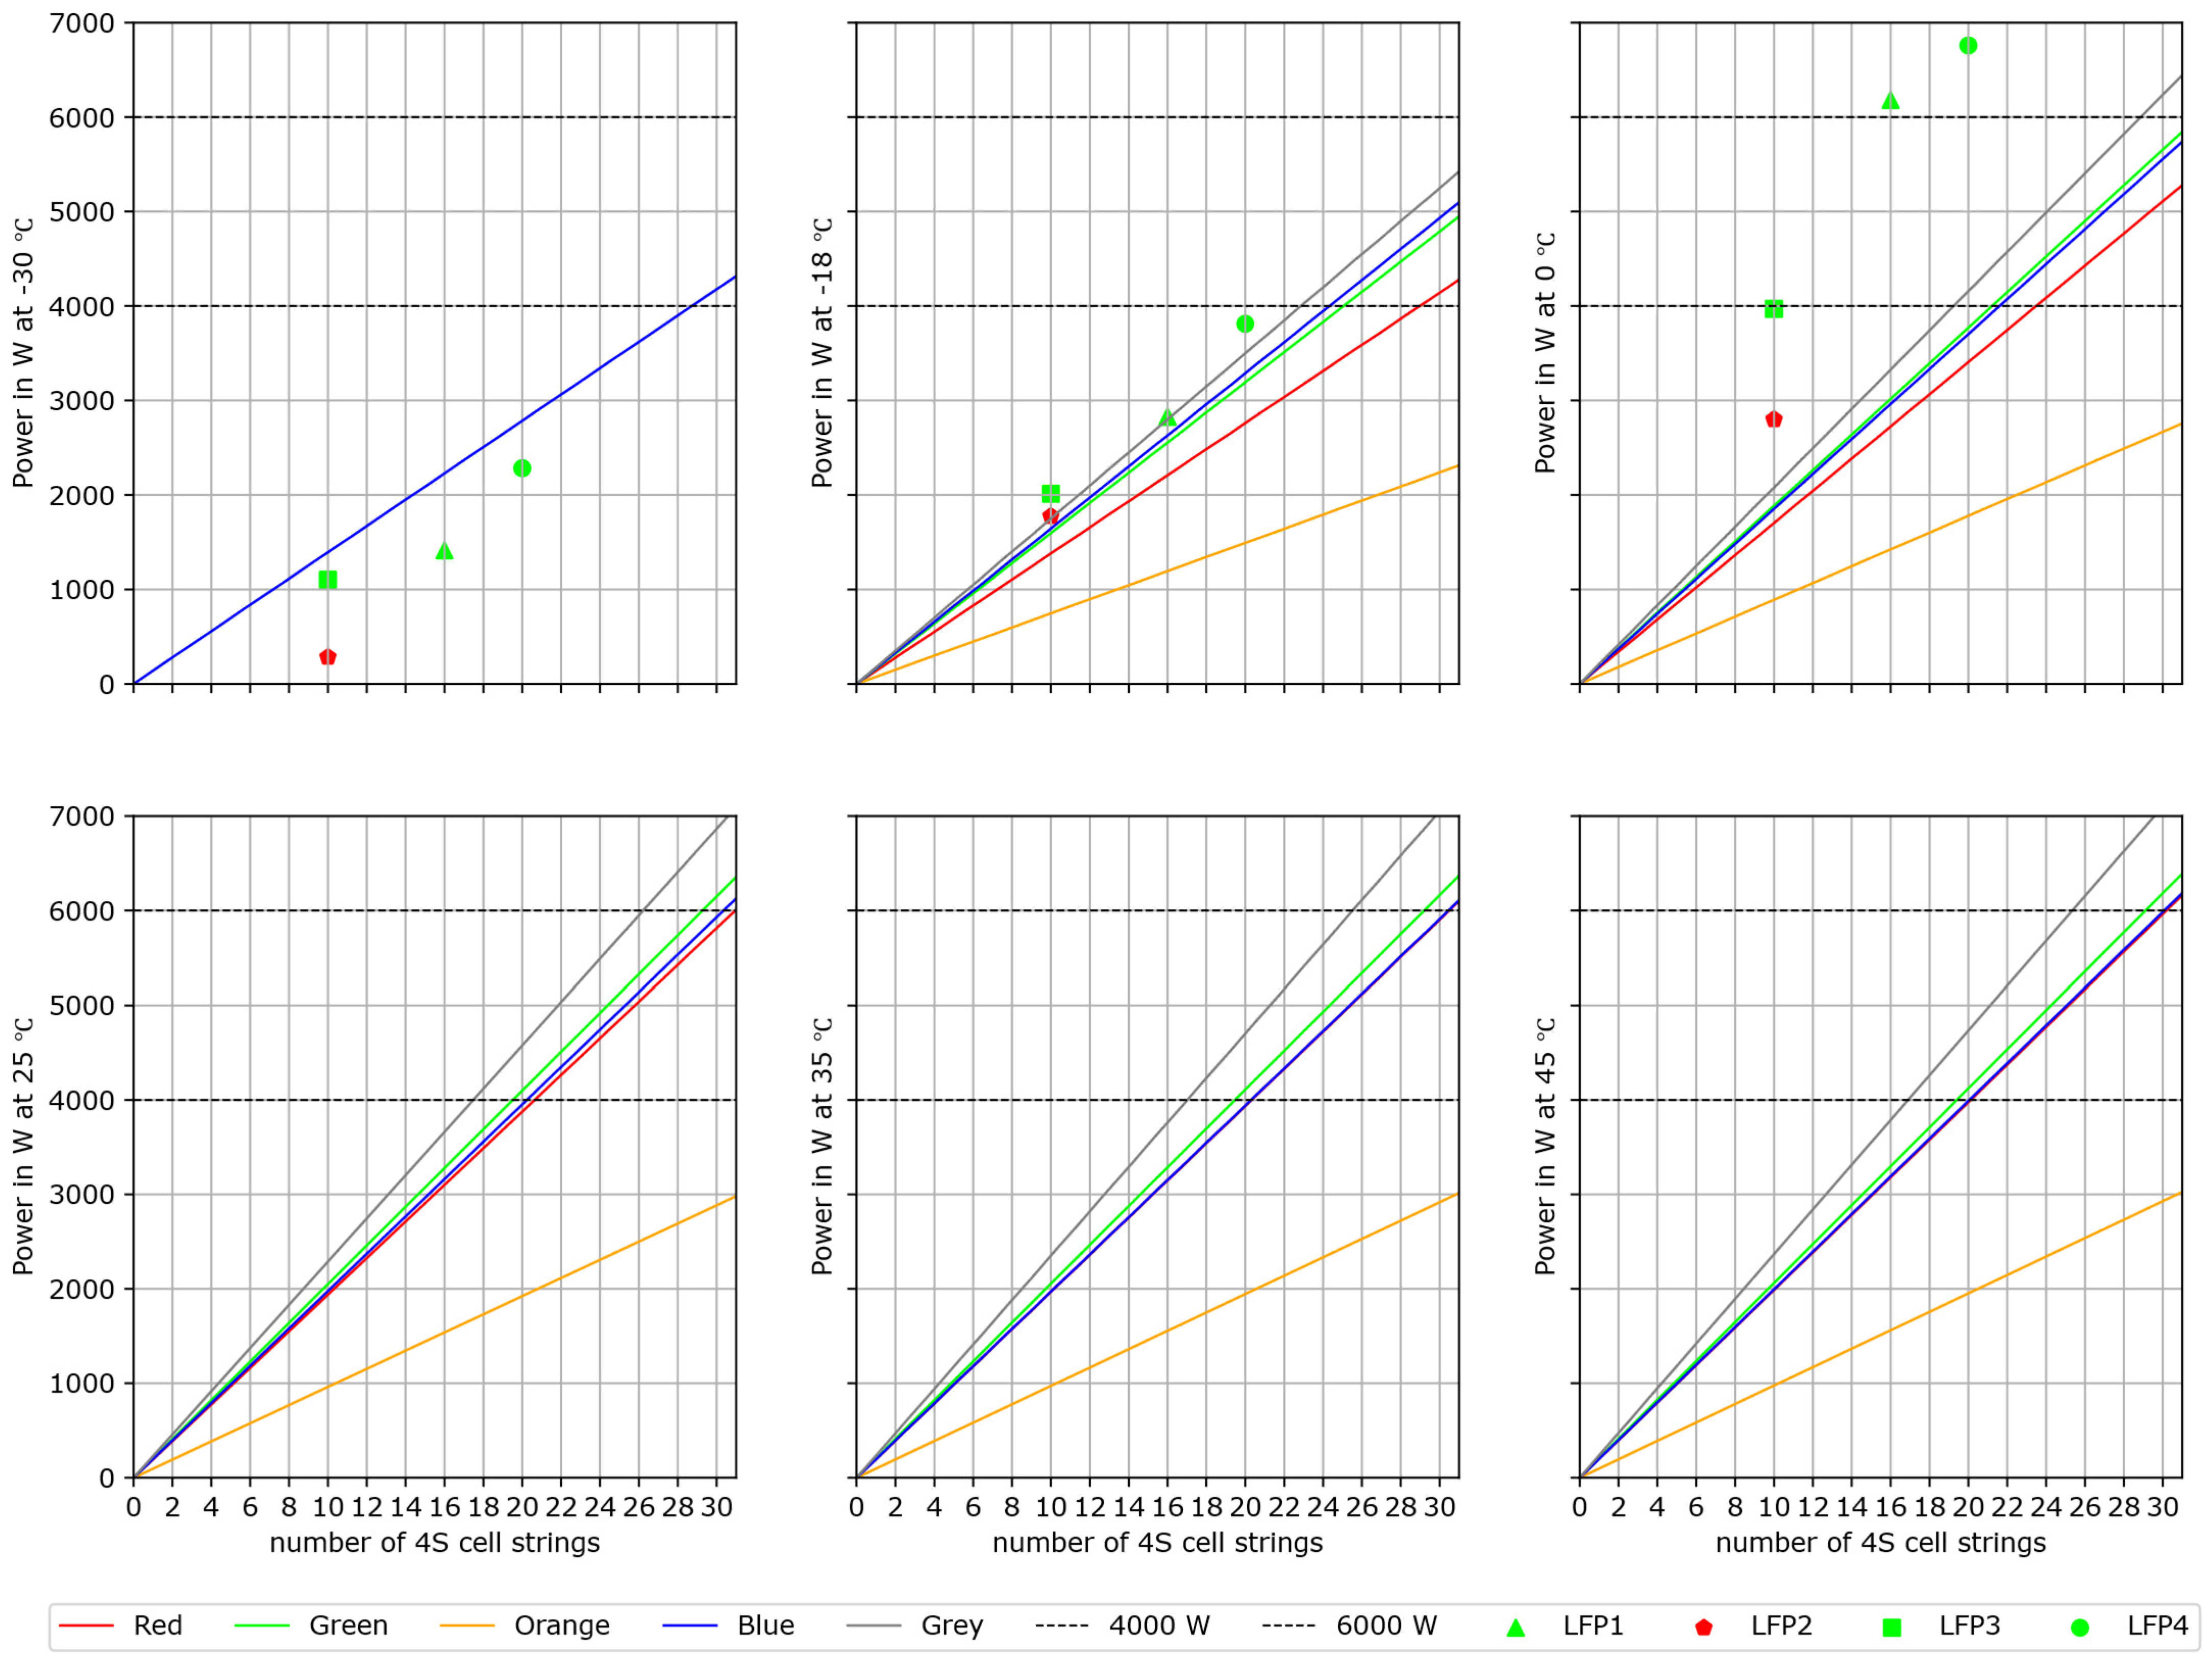
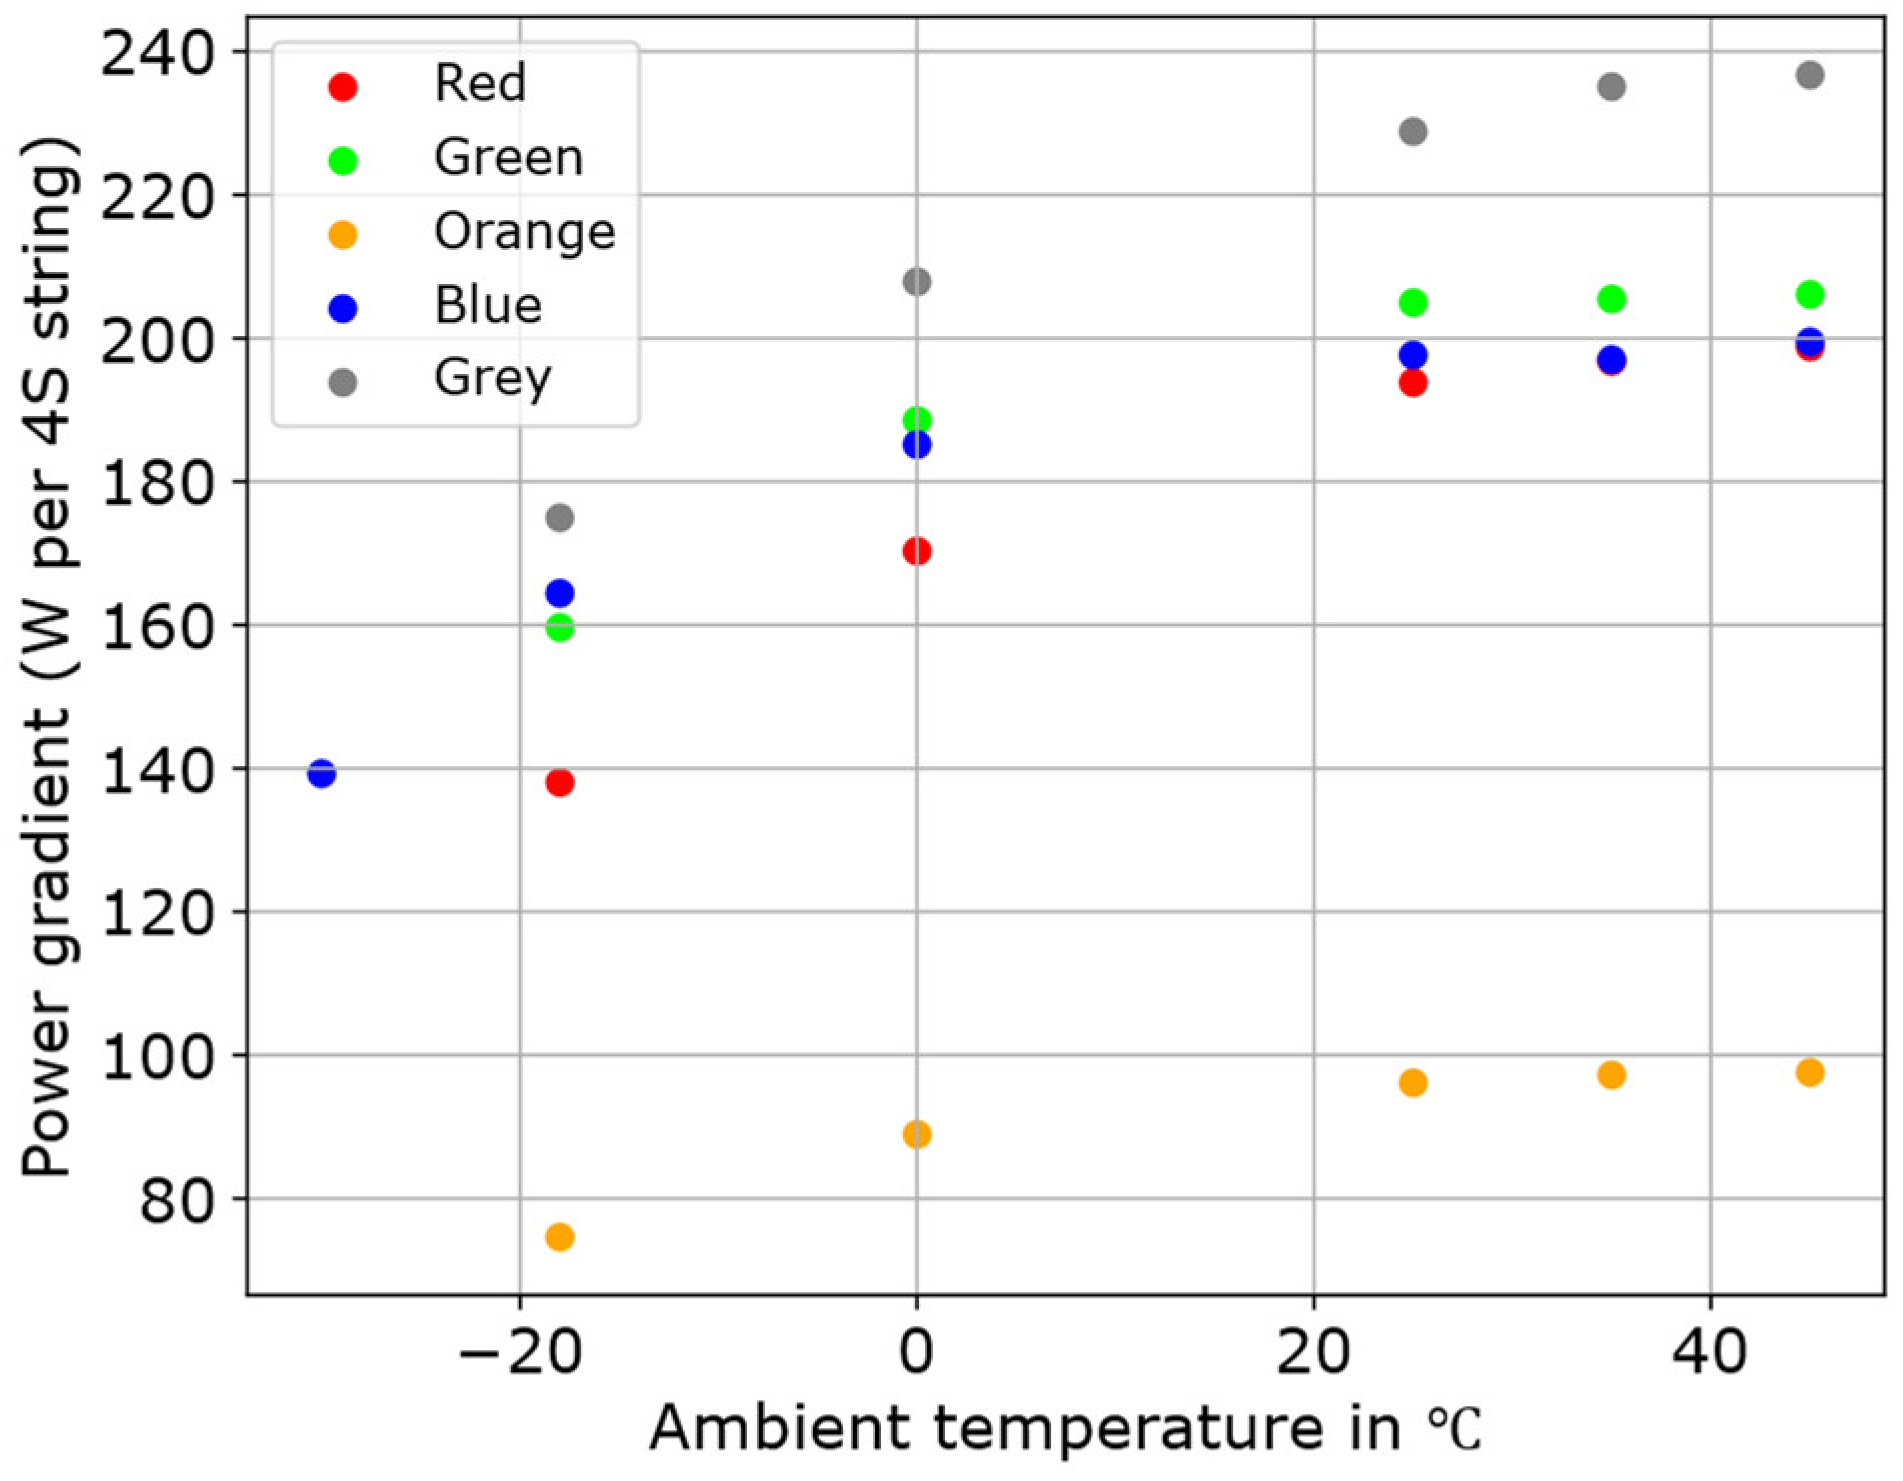
According to the average power output in the first pulse depicted in Figure 7, Figure 9 illustrates the arithmetic mean of the power available at the initial pulse under the assumption of linear power scaling over parallel multiples of four serial cells of each type. Additionally, the power (measured by lead–acid standard) of the cell packs from [14] in the first pulse at temperatures of −30 °C to 45 °C is referenced for single data points. Losses due to interconnection of the cells and similar effects are not considered for this estimation. The target of 4 kW serves as an initial estimate without taking peak performance into account. For a specific application, the requirement profile of the respective vehicle must be applied. In Figure A1 in Appendix A, the gradients of each cell’s curve are presented over ambient temperature.
To achieve the required power of 4 kW (average) in the first pulse at room temperature, it is evident that 20 parallel strings of four serial blue cells are necessary. At −18 °C, the required number of parallel 26650 cells ranges from 22 to 28, whereas at 25 °C, the range is from 17 to 21. For the orange 18650 cell, 41 parallel strings are required to deliver 4 kW at 25 °C. It is important to note that the data are based on a 9 C-rate. Also, it should be considered that the cell temperature may be higher than the ambient temperature, as it can be influenced by pre-heating processes, the behaviour of the cell pack, or thermal insulation provided by the car itself. At 0 °C, it is evident that the battery packs deliver significantly more power than estimated for the individual cells. Comparing the packs and single cells at lower temperatures shows that at –18 °C both behave similarly. At –30 °C, the green and red single cells fail to perform, whereas the packs still provide a reduced but measurable power output. This behaviour may be attributed to the cells within the pack partially compensating for each other, as well as to possible thermal effects that emerge only in the pack configuration.
This overview provides a preliminary guide to determining the required number of cells, based on either the required power at a given temperature or vice versa. It also demonstrates the potential for reducing weight when replacing lead–acid starter batteries. Additionally, the identified power outputs provide a basis for evaluating the lightweight advantages of an LFP-based starter battery. Even under the conservative assumption of a 28P4S configuration (voltage, 12.8 V; capacity, 70 Ah; 112 cells in total), using the blue cell to deliver an initial pulse power of 4 kW at −30 °C would result in a cell mass of 9.632 kg, assuming a cell mass of 86 g. Taking into account a housing mass of 0.7 kg and 0.1 kg for power electronics, as stated in [3], as well as an additional allowance of 0.25 kg for cabling and ancillary components, the total battery mass would be 10.682 kg. By way of comparison, a 90 Ah lead–acid battery capable of starting a BMW F15 in cold conditions has a mass of 26 kg [3].

6. Conclusions

6.1. Limitations and Future Work

The present study uses a fixed 9 C regime for comparability across cell types represented by one cell per type. While the 5 cells can be compared between −18 and +45 °C, the results for −30 °C rely on one cell only. In addition, the specific failure mode and the lowest ambient temperature at which each cell reaches its operational limit should be analysed. Therefore, future work should (i) quantify how far the discharge C-rate can be increased at low temperatures (e.g., −18 °C) while maintaining acceptable voltage stability during the first pulses; (ii) replicate tests, especially that at −30 °C, with additional samples to determine whether the observed failures of the four cell types are systematic or outliers; (iii) identify the operating temperature limit (e.g., for the green cell); and (iv) validate the homogeneity of up-heating with full surface monitoring at −30 °C.

6.2. Data Sheets and Test

The results indicate that the specifications provided in the data sheets need to be verified through experimentation. For example, the blue cell remained operational at −30 °C despite being specified for use only at −20 °C. In contrast, the grey cell, which was rated as operational at −50 °C, failed to perform at −30 °C. Notably, both cells were supplied by the same manufacturer. Therefore, the results were normalised to 25 °C to facilitate the derivation of insights based on single measurements at room temperature. Furthermore, the applied test regime involving a 9 C discharge rate does not fully exploit the cells’ maximum capability at room temperature. This suggests that the performance achievable at ambient temperatures around −18 °C could be increased further. However, the experimental results clearly indicate that even a 9 C discharge rate represents a limiting condition at −30 °C, which confirms that 9 C should be used for these experiments. It must be noted that the best performing cell (blue cell) shows the lowest self-heating, probably driven by its low impedance at −30 °C.

6.3. Findings on Self-Heating by Pulse Loads

Self-heating is noticeable and has a positive effect on discharge performance at low temperatures. However, no hotspots or significant increases are observed in the tested cells. In addition to being transient, the temperature increase during the discharge pulses appears to be homogeneous. The cell temperature should be controlled to improve the discharge performance. However, owing to the low absolute heating during the pulses, there is no need for additional cooling mechanisms for starter battery applications. For heating cells, it might be more efficient to increase the pulse duration.

6.4. Impact of Ambient Temperature on Cell Performance and Respective Lead Equivalent

Above room temperature, no significant impact on discharge performance was observed in comparison with lead–acid. However, the LFP voltage plateau results in a minimal Pb-equivalent of factor 1.2 to 3 for temperatures between −18 °C and −30 °C, based on the energy delivered during the first pulse. The achievable power could be increased further by optimising the interplay of power output and C-rate at low temperatures for each specific cell or by utilising insulation or subsequent pulses (e.g., the 3rd pulse). In addition, ageing effects should be considered for further analysis. It is also necessary to specify the individual power requirements of the vehicle, as higher-than-average power outputs can be achieved with the sequences.
Furthermore, an initial guideline for cell dimensioning for short-term power delivery was derived, which indicates the potential for mass reduction. This might help to estimate a starter battery with four serial cells based on the expected temperature of the cell, the cell type and the required power. For example, a 28P4S pack with blue cells can provide a sufficient cold-cranking power at −30 °C.

Author Contributions

F.W.: Conceptualisation, Methodology, Validation, Formal analysis, Investigation, Resources, Data Curation, Writing—Original Draft, Writing—Review and Editing, Visualisation, Project administration, and Funding acquisition; A.S.: Methodology, Validation, and Data Curation; S.B.: Formal analysis, Data Curation, and Visualisation; D.S.: Writing—Review and Editing; J.K.: Resources, Writing—Review and Editing, Supervision, and Funding acquisition. All authors have read and agreed to the published version of the manuscript.

Funding

This research was funded by the IBB Business Team GmbH and was further supported by the German Research Foundation and the Open Access Publication Fund of TU Berlin.

Institutional Review Board Statement

Not applicable.

Informed Consent Statement

Not applicable.

Data Availability Statement

The raw data supporting the conclusions of this article will be made available by the authors on request.

Acknowledgments

Gratitude is extended to Stefan Wätzold of the Stefan Wätzold Projekt GmbH for providing the data basis and for his invaluable support throughout this project.

Conflicts of Interest

Author Florian Wätzold was employed by the company Stefan Wätzold Projekt GmbH. The remaining authors declare that the research was conducted in the absence of any commercial or financial relationships that could be construed as a potential conflict of interest.

Appendix A

Appendix A.1. Cones for Expected Capacity Values

For deriving the expected capacity range (shown as a cone with an expectation curve in Figure 1) a non-linear least-squares fitting procedure is applied to an exponential model, with the model parameters estimated by minimising the sum of squared residuals between the measured points and the model prediction. The fitted parameters were then manually fine-tuned to show an upper and lower envelope to represent experimental variability. The estimated expectation values are then derived as the average of the upper and lower envelope. For lead–acid batteries, the relative progression can be approximately described by the function (dotted line) C P b = 103 27.5 · e 0.06 x + 31 37.5 · e 0.06 x + 29 . The anticipated relative capacity reduction for LFP, as illustrated on the right side of Figure 1, is described by the function (dotted line) C L F P = 98.5 11 · e 0.06 x + 36 17.5 · e 0.06 x + 29 .

Appendix A.2. Analysis of Available LFP Starter Batteries (*—Data from Data Sheet Incl. Marketing Claims)

Table A1. Data sheet information of lead-equivalence of LFP batteries.
ModelSuper B Andrena 12 V 7.5 AhSuper B Mason 12 V 25 AhLiteBlox LB12 XXLiteBlox LB28xxCS 105 AhCS 20 Ah
Pb-equivalence min12100155523545
Pb-equivalence factor (min)1.60004.00001.92313.02202.23812.2500
Pb-equivalence max20130357523545
Pb-equivalence factor (max)2.66675.20004.48724.12092.23812.2500
Capacity (−20 °C) in Ah//7.818.2105.020.0
Capacity (−30 °C) in Ah7.525.0////
Lowest Operating Temperature in °C−30−30−20−20−20−20
Source[33][34][35][36][37][38]

Appendix A.3. Power Gradient over Ambient Temperature

Figure A1. Power gradient for each cell over temperature.
Batteries 12 00222 g0a1

Appendix A.4. Voltage While Charging over All Experiments

Figure A2. Voltages over time during charging before each test.
Batteries 12 00222 g0a2

Appendix A.5. Voltage and Current First Discharging Pulses

Figure A3. Voltage (top as measured and mid after reconstruction) and temperature over first discharge sequences for red cell.
Batteries 12 00222 g0a3
Figure A4. Voltage (top as measured and mid after reconstruction) and temperature over first discharge sequences for green cell.
Batteries 12 00222 g0a4
Figure A5. Voltage (top as measured and mid after reconstruction) and temperature over first discharge sequences for orange cell.
Batteries 12 00222 g0a5
Figure A6. Voltage (top as measured and mid after reconstruction) and temperature over first discharge sequences for blue cell.
Batteries 12 00222 g0a6
Figure A7. Voltage (top as measured and mid after reconstruction) and temperature over first discharge sequences for grey cell.
Batteries 12 00222 g0a7

Appendix A.6. Power over Discharging Sequences and Voltage over State of Charge for Blue and Green Cells

Figure A8. Power, in W, over discharging sequences (left) and voltage over state of charge (right) for blue cell.
Batteries 12 00222 g0a8
Figure A9. Power, in W, over discharging sequences (left) and voltage over state of charge (right) for green cell.
Batteries 12 00222 g0a9

References

  1. Marracci, M.; Tellini, B.; Liebfried, O.; Brommer, V. On the Use of Lithium Batteries at High Power Pulses Discharge Rates. In Proceedings of the 2016 IEEE 2nd International Forum on Research and Technologies for Society and Industry Leveraging a Better Tomorrow (RTSI); IEEE: Bologna, Italy, 2016; pp. 1–5. [Google Scholar]
  2. Ranom, R.; Muhamad Saripudin, M.S.A.; Jamaludin, I.W.; Habibah, U. Understanding the Discharge Characteristics of Lithium Iron Phosphate and Lithium Cobalt Oxide Cathode Materials. Int. J. Electr. Eng. Appl. Sci. 2024, 7, 59–67. [Google Scholar] [CrossRef]
  3. Wätzold, F.; Dahm, H.-P.; Binder, J.; Standfest, J. Leichtbaubewertung von Starterbatterien auf Lithium-Basis. ATZ Automob. Z. 2021, 123, 60–65. [Google Scholar] [CrossRef]
  4. Ferg, E.E.; Schuldt, F.; Schmidt, J. The Challenges of a Li-Ion Starter Lighting and Ignition Battery: A Review from Cradle to Grave. J. Power Sources 2019, 423, 380–403. [Google Scholar] [CrossRef]
  5. Vergossen, D. Differenzierte Betrachtung und Bewertung von 12-Volt-Lithium-Ionen-Starterbatterien in PKW-Bordnetzen; Cuvillier Verlag: Göttingen, Germany, 2018. [Google Scholar]
  6. How the Climatic Wind Tunnel in Weissach Works. Available online: https://newsroom.porsche.com/en/2024/innovation/porsche-simulating-climate-conditions-climatic-wind-tunnel-weissach-36348.html (accessed on 20 October 2024).
  7. Wang, Y.; Li, J.; Zhang, J.; Pecht, M. Lithium-iron-Phosphate Battery Electrochemical Modelling under a Wide Range of Ambient Temperatures. J. Electroanal. Chem. 2021, 882, 115041. [Google Scholar] [CrossRef]
  8. Kopczyński, A.; Liu, Z.; Krawczyk, P. Parametric Analysis of Li-Ion Battery Based on Laboratory Tests. E3S Web Conf. 2018, 44, 00074. [Google Scholar] [CrossRef]
  9. Feng, F.; Lu, R.; Wei, G.; Zhu, C. Identification and Analysis of Model Parameters Used for LiFePO4 Cells Series Battery Pack at Various Ambient Temperature. IET Electr. Syst. Transp. 2016, 6, 50–55. [Google Scholar] [CrossRef]
  10. Andre, D.; Meiler, M.; Steiner, K.; Wimmer, C.; Soczka-Guth, T.; Sauer, D.U. Characterization of High-Power Lithium-Ion Batteries by Electrochemical Impedance Spectroscopy. I. Experimental Investigation. J. Power Sources 2011, 196, 5334–5341. [Google Scholar] [CrossRef]
  11. Yue, Y.; Li, S.; Cheng, X.; Wei, J.; Zeng, F.; Zhou, X.; Yang, J. Effects of Temperature on the Ohmic Internal Resistance and Energy Loss of Lithium-Ion Batteries under Millisecond Pulse Discharge. J. Phys. Conf. Ser. 2022, 2301, 012014. [Google Scholar] [CrossRef]
  12. Moseley, P.T.; Rand, D.A.J.; Garche, J. Lead–Acid Batteries for Future Automobiles. In Lead-Acid Batteries for Future Automobiles; Elsevier: Amsterdam, The Netherlands, 2017; pp. 601–618. [Google Scholar]
  13. Belt, J. Battery Test Manual for 12 Volt Start/Stop Vehicles. 2015. Available online: https://www.google.com/goto?url=CAESYgHuR6pNSdYcHoA3rCMfgaaXiJD441ewesEHPtlWTcROZA-vAbfg4MRpv-t4k7o9KqSTr-2-OmF_YqMduYsjJ6PR3t2K81TincYW22Rys9x7YoKbWLygckVyv9aKkRKAeCXI (accessed on 12 July 2025).
  14. Bauknecht, S.; Wätzold, F.; Schlösser, A.; Kowal, J. Comparing the Cold-Cranking Performance of Lead-Acid and Lithium Iron Phosphate Batteries at Temperatures below 0 °C. Batteries 2023, 9, 176. [Google Scholar] [CrossRef]
  15. Kowal, J.; Arzberger, A.; Blanke, H.; Sauer, D.U. How to Determine the Time for Temperature Equalisation in Batteries and Supercaps for Reliable Laboratory Measurements. J. Energy Storage 2015, 4, 113–120. [Google Scholar] [CrossRef]
  16. Wätzold, F.; Schlösser, A.; Leistikow, M.; Kowal, J. Design Analysis of 26650 and 18650 LFP Cells for High Power and Low Temperature Use Cases. Batteries 2025, 11, 38. [Google Scholar] [CrossRef]
  17. Li, Z.; Yao, Y.; Sun, S.; Jin, C.; Yao, N.; Yan, C.; Zhang, Q. 40 Years of Low-Temperature Electrolytes for Rechargeable Lithium Batteries. Angew. Chem. Int. Ed. 2023, 62, e202303888. [Google Scholar] [CrossRef] [PubMed]
  18. Peukert, W. Elektrotechnische Zeitschrift; Springer: Berlin/Heidelberg, Germany, 1897; pp. 90–91. [Google Scholar]
  19. Berndt, D.; Gann, W. Bleiakkumulatoren, 11th ed.; Berndt, D., VARTA-Batterie-Aktiengesellschaft, Eds.; VDI-Verlag: Düsseldorf, Germany, 1986. [Google Scholar]
  20. Křivík, P.; Baca, P.; Kazelle, J. Influence of Temperature on Impedance Changes of Lead-Acid Battery Cell. ECS Trans. 2020, 99, 105–115. [Google Scholar] [CrossRef]
  21. Tran, M.; Ertugrul, N.; Miller, T. The Use of Peukert Equation in Lead Acid vs Lithium Ion Battery. World Appl. Sci. J. 2017, 35, 1561–1567. [Google Scholar]
  22. Doerffel, D.; Sharkh, S.A. A Critical Review of Using the Peukert Equation for Determining the Remaining Capacity of Lead-Acid and Lithium-Ion Batteries. J. Power Sources 2006, 155, 395–400. [Google Scholar] [CrossRef]
  23. Galushkin, N.E.; Yazvinskaya, N.N.; Galushkin, D.N. A Critical Study of Using the Peukert Equation and Its Generalizations for Determining the Remaining Capacity of Lithium-Ion Batteries. Appl. Sci. 2020, 10, 5518. [Google Scholar] [CrossRef]
  24. Coleman, M.; Lee, C.K.; Zhu, C.; Hurley, W.G. State-of-Charge Determination From EMF Voltage Estimation: Using Impedance, Terminal Voltage, and Current for Lead-Acid and Lithium-Ion Batteries. IEEE Trans. Ind. Electron. 2007, 54, 2550–2557. [Google Scholar] [CrossRef]
  25. Capron, O.; Samba, A.; Omar, N.; Van Den Bossche, P.; Van Mierlo, J. Thermal Behaviour Investigation of a Large and High Power Lithium Iron Phosphate Cylindrical Cell. Energies 2015, 8, 10017–10042. [Google Scholar] [CrossRef]
  26. Jindal, P.; Katiyar, R.; Bhattacharya, J. Evaluation of Accuracy for Bernardi Equation in Estimating Heat Generation Rate for Continuous and Pulse-Discharge Protocols in LFP and NMC Based Li-Ion Batteries. Appl. Therm. Eng. 2022, 201, 117794. [Google Scholar] [CrossRef]
  27. Klein, M.P.; Park, J.W. Current Distribution Measurements in Parallel-Connected Lithium-Ion Cylindrical Cells under Non-Uniform Temperature Conditions. J. Electrochem. Soc. 2017, 164, A1893–A1906. [Google Scholar] [CrossRef]
  28. Lee, K.-J.; Smith, K.; Pesaran, A.; Kim, G.-H. Three Dimensional Thermal-, Electrical-, and Electrochemical-Coupled Model for Cylindrical Wound Large Format Lithium-Ion Batteries. J. Power Sources 2013, 241, 20–32. [Google Scholar] [CrossRef]
  29. Li, S.; Kirkaldy, N.; Zhang, C.; Gopalakrishnan, K.; Amietszajew, T.; Diaz, L.B.; Barreras, J.V.; Shams, M.; Hua, X.; Patel, Y.; et al. Optimal Cell Tab Design and Cooling Strategy for Cylindrical Lithium-Ion Batteries. J. Power Sources 2021, 492, 229594. [Google Scholar] [CrossRef]
  30. Marongiu, A.; Pavanarit, T.; Sauer, D.U. Influence of Current and Temperature Variation on a LiFePO4 Battery Total Capacity. In Proceedings of the 2013 World Electric Vehicle Symposium and Exhibition (EVS27); IEEE: New York, NY, USA, 2013; pp. 1–11. [Google Scholar]
  31. Cheng, Z.; Ji, X.; Cahill, D.G. Battery Absorbs Heat during Charging Uncovered by Ultra-Sensitive Thermometry. J. Power Sources 2022, 518, 230762. [Google Scholar] [CrossRef]
  32. Quinn, J.B.; Waldmann, T.; Richter, K.; Kasper, M.; Wohlfahrt-Mehrens, M. Energy Density of Cylindrical Li-Ion Cells: A Comparison of Commercial 18650 to the 21700 Cells. J. Electrochem. Soc. 2018, 165, A3284–A3291. [Google Scholar] [CrossRef]
  33. ANDRENA 12V7.5AH. Available online: https://shop.super-b.com/en-de/products/super-b-andrena-12v7-5ah (accessed on 12 July 2025).
  34. Super B Mason 12V25Ah. Available online: https://shop.super-b.com/products/super-b-mason-12v25ah (accessed on 12 July 2025).
  35. LITE↯BLOX LB12XX Lightweight Battery for Performance and Motorsport. Available online: https://liteblox.de/en/lb12xx-lifepo4-car-battery/ (accessed on 12 July 2025).
  36. LITE↯BLOX LB28XX Lightweight Battery for Performance and Motorsport. Available online: https://liteblox.de/en/lb28xx-lifepo4-car-battery/ (accessed on 12 July 2025).
  37. 105Ah|12,8V|2200A|Lithium Starter Batterie|Integriertes Multi Dynamic BMS. Available online: https://cs-batteries.de/105Ah-128V-2200A-Lithium-Starter-Batterie-integriertes-Multi-Dynamic-BMS (accessed on 12 July 2025).
  38. 20Ah|12,8V|600A|Lithium Starter Batterie|Integriertes Multi Dynamic BMS. Available online: https://cs-batteries.de/20Ah-128V-600A-Lithium-Starter-Batterie-integriertes-Multi-Dynamic-BMS (accessed on 12 July 2025).
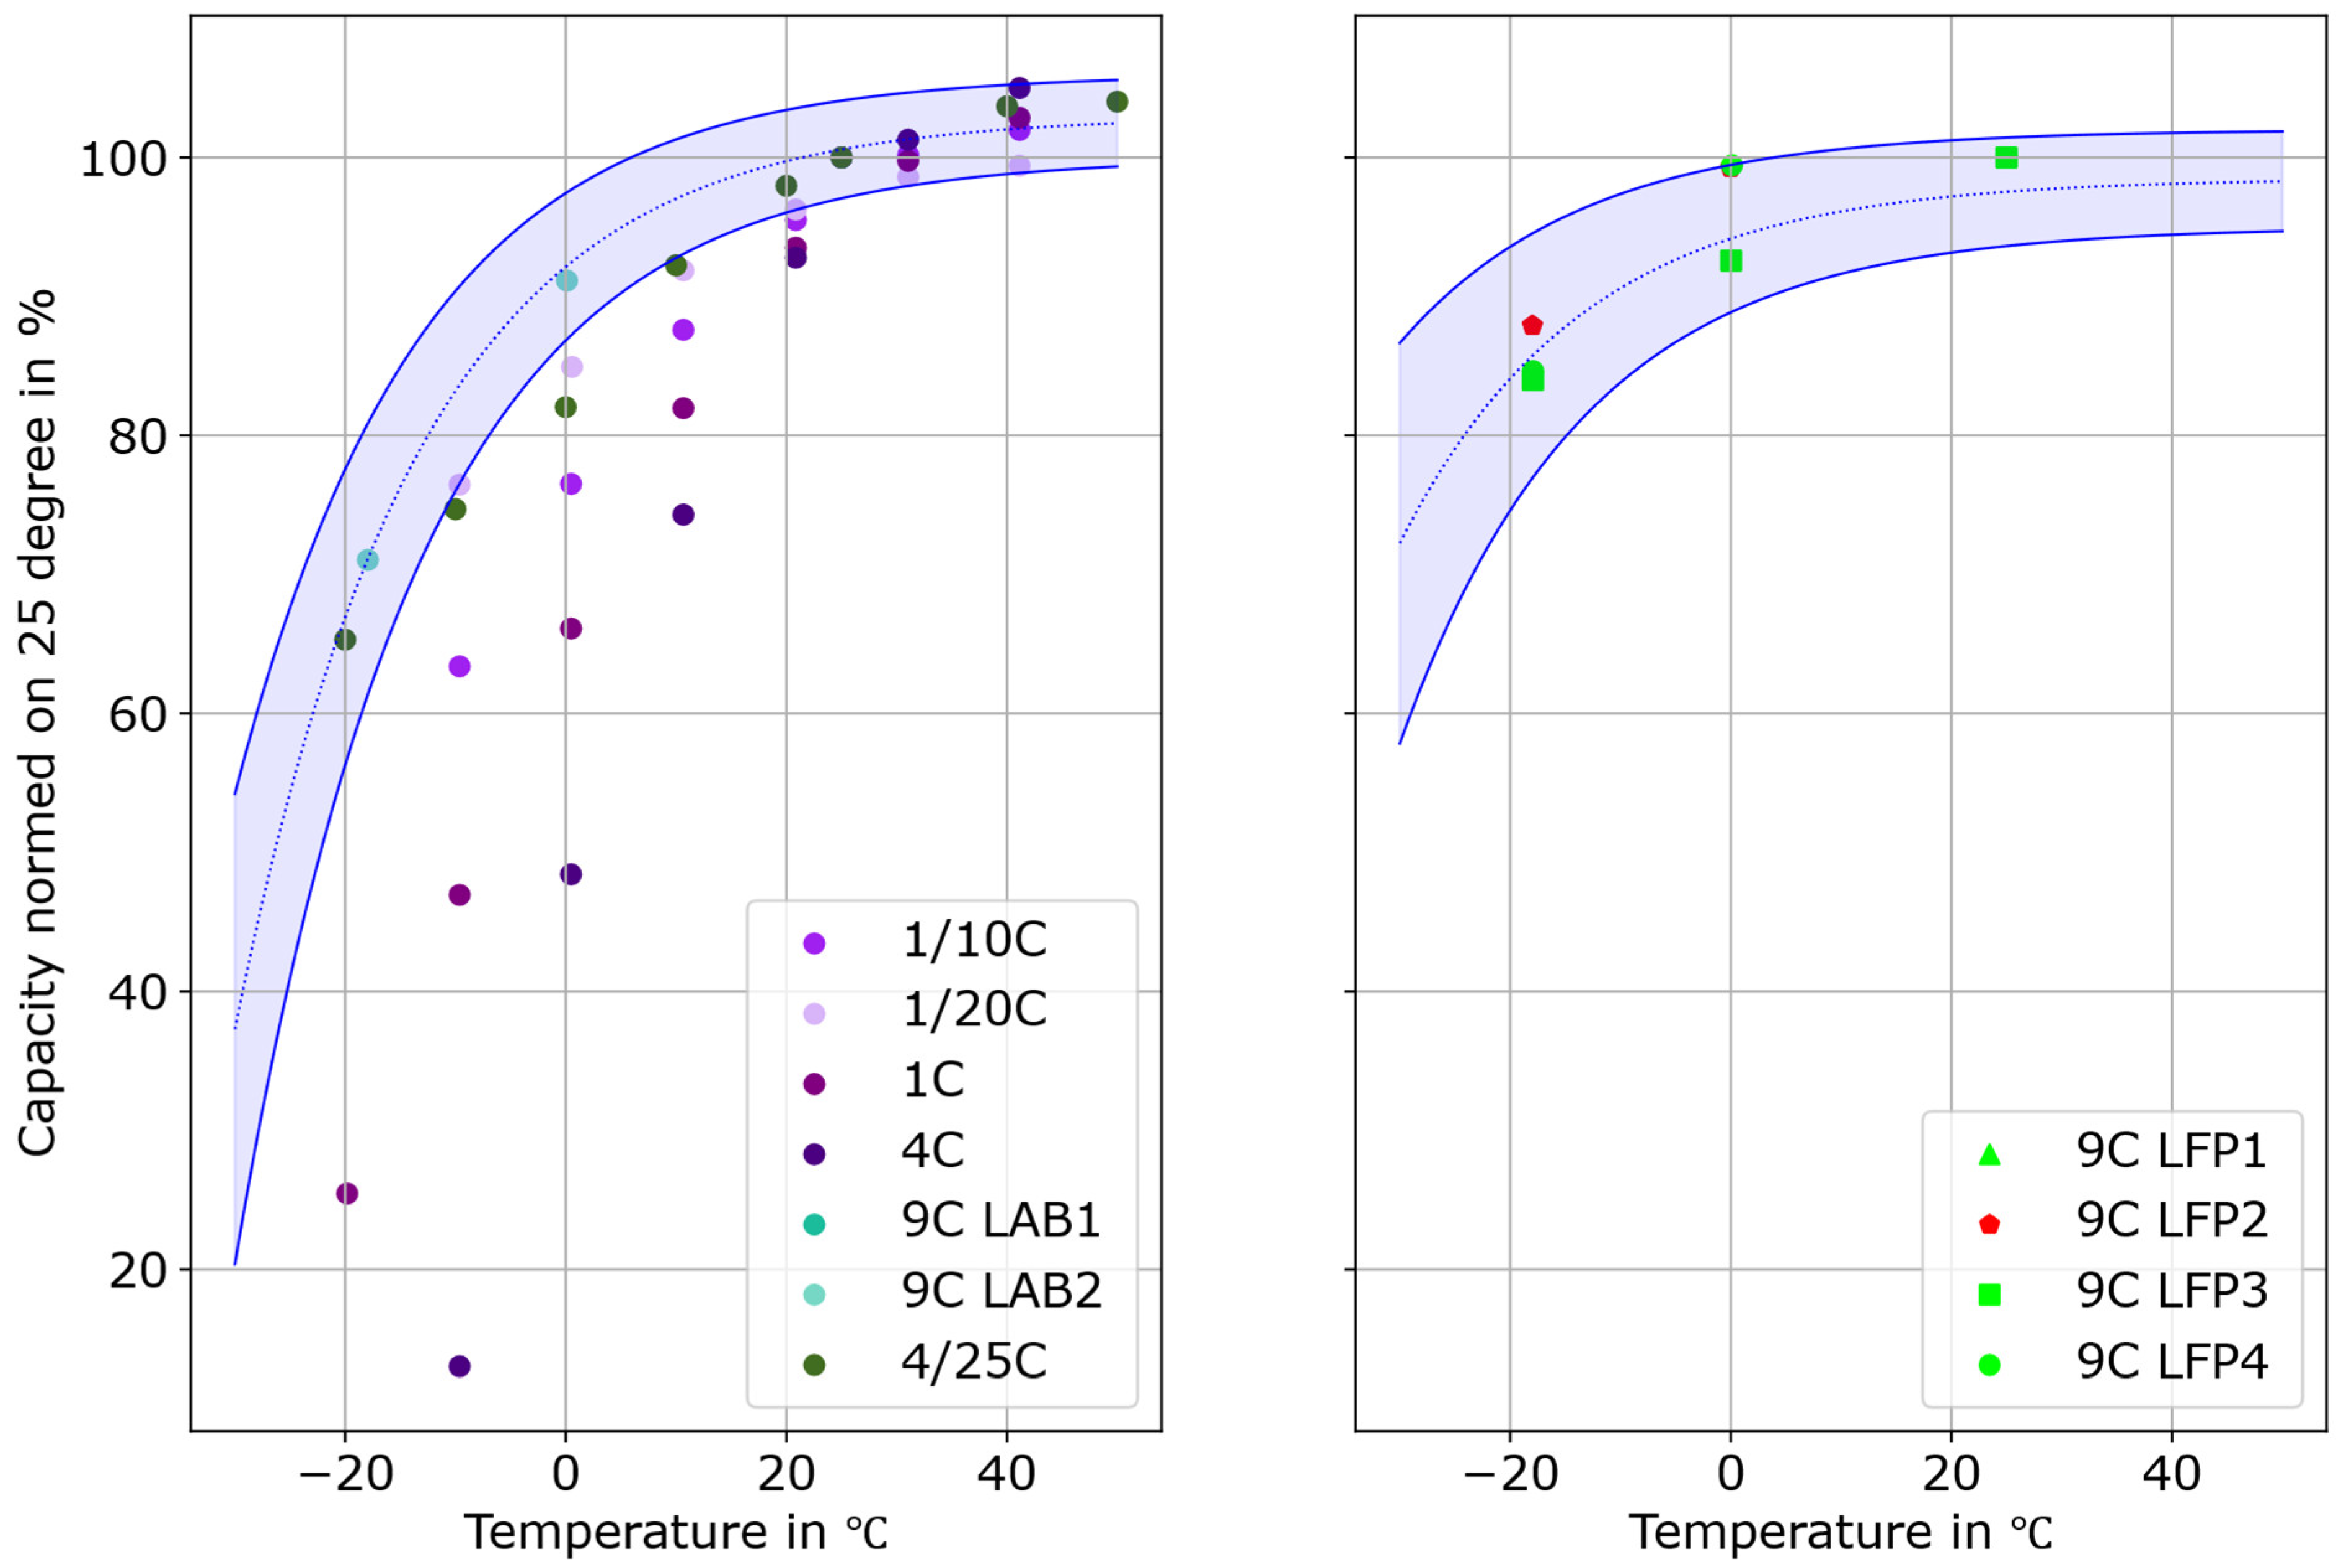
Figure 1. The effect of temperature on capacity of lead–acid batteries and LFP cells. Data used are from [14,19,20] and shown as data points, cone show expected values.
Batteries 12 00222 g001
Figure 2. Exemplary discharge sequences (3 complete pulses shown) analogous to the Battery Test Manual for 12 Volt Start/Stop Vehicles with three power levels.
Batteries 12 00222 g002
Figure 3. Evaluation of voltage during charging and respective surface temperature over time (left) and state of charge (right).
Batteries 12 00222 g003
Figure 4. Thermal evaluation in Optris PIX Connect of grey cell during discharge pulse.
Batteries 12 00222 g004
Figure 5. Surface temperature increase of battery cells depending on the start ambient temperature.
Batteries 12 00222 g005
Figure 6. Normalised energy yield of cells across discharging sequence over temperature (only the blue LFP cell is operational at −30 °C).
Batteries 12 00222 g006
Figure 7. Normalised power yield for first pulse (left) and second pulse (right) of cells over temperature (only the blue LFP cell is operational at −30 °C).
Batteries 12 00222 g007
Figure 8. Energy-based Pb-equivalent of high-power LFP cells.
Batteries 12 00222 g008
Figure 9. Available power during first pulse per row of four serial LFP cells based on measurements.
Batteries 12 00222 g009
Table 1. Key specifications of selected lead–acid batteries and LFP packs from [14].
Cells UsedCodeCapacity
in Ah
Voltage
in V
Max Pulse Discharge Current in ATemperature Range in °C
/(Banner P50 03)LAB15012(850 cold-cranking amps)−40 to 55
/(Banner P59201)LAB29212(450 cold-cranking amps)−40 to 55
ANR26650M1BLFP14014.2800−20 to 80
IFR26650-25BLFP22512.81250−20 to 60
ANR26650M1BLFP32514.21200−30 to 60
ANR26650M1BLFP45014.22400−30 to 60
Table 2. Key specifications of selected LFP cells (from data sheets).
CellCodeMass in gCapacity
in Ah
Voltage in VImpedance at 1 kHz in mΩMax Pulse Discharge Current in ATemperature Range in °C
IFR26650-25Bred862.52–3.65675−20 to +70
ANR26650M1Bgreen772.563.36120−20 to +60
APR18650M1Borange40.51.23.312.650−40 to +60
IFR26650P2.5Ahblue862.53.2775−20 to +60
IFR26650LT3.0Ahgrey8533.2930 (≥−20 °C)/
21 (<−20 °C)
−50 to 60
Table 3. Performed complete pulses per cell in order of experiments (highest values are marked red, lowest values are marked blue).
CellPerformed Pulses at
45 °C35 °C25 °C0 °C−10 °C−18 °C−30 °C
Red1121121131151121062
Green1141141141151161143
Orange112111112111102893
Blue1041041051041019782
Grey1091091091081071033
Disclaimer/Publisher’s Note: The statements, opinions and data contained in all publications are solely those of the individual author(s) and contributor(s) and not of MDPI and/or the editor(s). MDPI and/or the editor(s) disclaim responsibility for any injury to people or property resulting from any ideas, methods, instructions or products referred to in the content.