Article

A Multiphysics Aging Model for SiOx–Graphite Lithium-Ion Batteries Considering Electrochemical–Thermal–Mechanical–Gaseous Interactions

1
Energy and Transportation Domain, Beijing Institute of Technology, Zhuhai 519088, China
2
Shenzhen Automotive Research Institute, Beijing Institute of Technology, Shenzhen 518118, China
3
National Engineering Research Center of Electric Vehicles, School of Mechanical Engineering, Beijing Institute of Technology, Beijing 100081, China
4
China Automotive New Energy Technology Co., Ltd., Tianjin 300450, China
*
Authors to whom correspondence should be addressed.
These authors contributed equally to this work.
Lead contact.
Batteries 2026, 12(1), 30; https://doi.org/10.3390/batteries12010030
Submission received: 3 December 2025 / Revised: 29 December 2025 / Accepted: 15 January 2026 / Published: 16 January 2026

Abstract

Silicon oxide/graphite (SiOx/Gr) anodes are promising candidates for high energy-density lithium-ion batteries. However, their complex multiphysics degradation mechanisms pose challenges for accurately interpreting and predicting capacity fade behavior. In particular, existing multiphysics models typically treat gas generation and solid electrolyte interphase (SEI) growth as independent or unidirectionally coupled processes, neglecting their bidirectional interactions. Here, we develop an electro–thermal–mechanical–gaseous coupled model to capture the dominant degradation processes in SiOx/Gr anodes, including SEI growth, gas generation, SEI formation on cracks, and particle fracture. Model validation shows that the proposed framework can accurately reproduce voltage responses under various currents and temperatures, as well as capacity fade under different thermal and mechanical conditions. Based on this validated model, a mechanistic analysis reveals two key findings: (1) Gas generation and SEI growth are bidirectionally coupled. SEI growth induces gas release, while accumulated gas in turn regulates subsequent SEI evolution by promoting SEI formation through hindered mass transfer and suppressing it through reduced active surface area. (2) Crack propagation within particles is jointly governed by the magnitude and duration of stress. High-rate discharges produce large but transient stresses that restrict crack growth, while prolonged stresses at low rates promote crack propagation and more severe structural degradation. This study provides new insights into the coupled degradation mechanisms of SiOx/Gr anodes, offering guidance for performance optimization and structural design to extend battery cycle life.

1. Introduction

In recent years, the rapid growth of consumer electronics, unmanned aerial systems, and electric transportation has significantly increased the demand for lithium-ion batteries (LiBs) with higher energy densities, thereby accelerating the development of high-capacity anode materials. Among various candidates, silicon (Si) has emerged as one of the most promising options owing to its exceptionally high theoretical specific capacity of 3579 mAh/g [1,2,3]. However, Si undergoes substantial volume changes of up to ~300% during lithiation and delithiation [4,5], which induce severe mechanical degradation, including particle pulverization [6,7], loss of electrical contact [8,9,10], and repeated fracture and reformation of the solid electrolyte interphase (SEI) [11,12,13]. These coupled mechanical–electrochemical failure processes significantly impair cycling stability and remain a major barrier to the practical implementation of Si-based anodes.
Compared with pure Si, silicon oxide (SiOx) anodes exhibit a lower volume expansion (~118%) while retaining a relatively high theoretical capacity of 2680 mAh/g for SiO [14], offering a more balanced trade-off between energy density and mechanical stability. Despite these advantages, SiOx suffers from low initial coulombic efficiency [15,16] and complex reaction pathways, which continue to impede its large-scale commercial deployment. To overcome these limitations, current industrial applications predominantly employ SiOx/graphite (SiOx/Gr) composite anodes, which combine the high capacity of SiOx with the structural stability and high electrical conductivity of graphite [17,18]. This composite architecture achieves a balance among energy density, cycle life, and manufacturability, positioning SiOx/Gr anodes as one of the most promising technologies for next-generation high-energy-density lithium-ion batteries.
However, SiOx/Gr anodes still suffer from multiple aging mechanisms that limit their performance and lifespan in practical applications. These mechanisms primarily include: (1) continuous SEI thickening and repeated fracture-regeneration, which consume both electrolyte and active lithium, leading to capacity fading and power loss; (2) gas generation [19,20], which blocks electrode pores, impedes ion transport and disrupts electronic conduction pathways, leading to the isolation of active materials; and (3) diffusion-induced stress within particles, which triggers crack initiation and propagation; in severe cases, it causes particle pulverization, further aggravating active material loss [21,22]. The complex interplay among these degradation pathways accelerates capacity fade and impedance rise, ultimately constraining the large-scale commercialization of SiOx/Gr batteries. Therefore, developing an accurate and comprehensive aging model capable of elucidating these coupled degradation mechanisms is essential for guiding electrode design and improving the long-term durability of SiOx/Gr anodes.
Previous studies have developed various models to uncover the complex mechanisms in Si-based batteries. For instance, Ai et al. [23] proposed an electrochemical model for Si/Gr composite anodes, showing that due to the potential balance between Si and graphite, the current density is dominated by graphite at high state-of-charge (SoC) and by Si at low SoC. At high discharge rates, lithium concentration and potential gradients form across the electrode thickness, causing non-uniform current distribution. Specifically, they found that the peak current for graphite appears near the separator, whereas that for Si appears near the current collector, which provides valuable insights for optimizing composite electrode design and improving battery performance. Shao et al. [24] developed an electrochemical-thermal coupled model for Si/Gr composite electrodes, which separately described the electrochemical and thermal behaviors of each active material. Their results showed that, under the same discharge rate, higher Si content leads to higher current and more pronounced temperature rise in the electrode. Furthermore, Gao et al. [25] focused on the poor cycling stability of SiOx/Gr anodes, which is primarily caused by significant stress and strain within the particles. They built an electrochemical-mechanical coupled model to study the effects of SiOx content, particle location, and size on battery performance. Their study revealed that SiOx content of 8–10 wt% achieves a balance between energy density and capacity fade, while placing SiOx particles near the separator promotes full lithiation and reduces lithium plating. Moreover, smaller SiOx particles enhance Li+ diffusion and relieve compressive stress on surrounding graphite, thereby reducing overall deformation. M.P. Bonkile et al. [26] developed an electrochemical-thermal-mechanical coupled model and found that Si stress rises sharply when the depth of discharge (DoD) exceeds 80%. Moreover, high charge–discharge rates were found to reduce Si utilization due to early voltage cut-off, leading to a lower peak stress within the electrode.
These studies provide valuable insights into the electrochemical, thermal, and mechanical behaviors of Si-based batteries, offering a theoretical foundation for understanding the working mechanisms of composite electrodes and optimizing designs. However, most existing models mainly focus on the initial performance and ignore irreversible degradation as well as the combined effects of multiple aging mechanisms during long-term cycling. Therefore, there remains a critical need to develop models that can describe aging processes and track performance evolutions over the entire battery lifetime.
M.P. Bonkile et al. [27] developed an electrochemical-mechanical coupled model for Si/Gr composite electrodes that incorporates multiple aging mechanisms, including SEI growth, particle cracking, SEI formation on cracks, and particle fracture. Using this framework, the authors systematically investigated the effects of DoD, discharge rate, and Si content on battery degradation. Their results showed that low discharge rates and high DoD increase Si utilization but simultaneously accelerate degradation, whereas a reduction in Si utilization during cycling leads to stress relief and a self-limiting capacity loss. Furthermore, the study evaluated the practical contribution of Si under different usage conditions, revealing that Si capacity declines rapidly under long-term high-DoD cycling, while in low-SoC standby scenarios, the long cycle life of graphite can partially compensate for the fading of Si.
However, the above studies largely overlooked the impact of gas generation in the degradation of Si-based batteries. Gas generation arises from the volume expansion of Si materials coupled with electrolyte decomposition reactions, which is a key factor limiting both the lifespan and safety of Si-based batteries, particularly those with high Si content. Most existing studies on gas generation focus on identifying the associated chemical reactions or examining gas accumulation under extreme conditions such as thermal runaway. In contrast, there has been limited research on modeling how gas generation influences key cell internal parameters and, in turn, affects overall performance.
To address these research gaps, this study aims to develop a multiphysics coupled aging model for SiOx/graphite batteries that incorporates multiple degradation mechanisms to systematically elucidate their complex aging behaviors. The model integrates electrochemical, thermal, mechanical, and gaseous fields into a unified framework, enabling it to simultaneously capture the dynamic growth of the SEI, gas generation, stress accumulation leading to particle cracking, SEI formation on cracks, and particle fracture. To validate the model’s accuracy, we constructed a cycling aging dataset under varying temperature, discharge rate, and preload conditions, which is used to calibrate model parameters and reveal the unique degradation pathways of SiOx/graphite composite electrodes. Based on the validated model, this study further explores the impact of gas generation on cell performance and the bidirectional coupling between gas generation and SEI growth. By analyzing concentration gradients, we examine how stress concentration and particle cracking exacerbate SEI growth, triggering a series of aging processes that may, in severe cases, lead to particle fracture. This research provides a deeper understanding of the multiphysics interactions that drive aging in SiOx/graphite composite electrodes, offering critical insights into battery aging behavior and providing theoretical foundations for designing high-performance, long-lifetime, high-energy-density batteries.
The remainder of this paper is organized as follows: Section 2 provides a detailed description of the multiphysics coupled model, which integrates the electrochemical model, thermal and aging models (include SEI growth, gas generation, SEI regeneration on cracks, and particle fracture). Section 3 outlines the experimental methods, including the battery specifications and the cycling aging test protocols. Section 4 presents the results and discussion, starting with the validation of the model against experimental data under different current, temperature, and preload conditions. The validated model is then used to investigate the role of gas generation and its bidirectional coupling with SEI growth, followed by an in-depth analysis of stress evolution and particle-level aging mechanisms. Finally, Section 5 summarizes the key findings and conclusions of this work.

2. Model Description

2.1. Electrochemical Model

For lithium-ion batteries with composite anodes, we adopt the modeling approach proposed by Ai et al. [23] This approach uses a composite structure consisting of two spherical particles, with the radial diffusion equations for each solid particle described as follows:
c S i O x t = D S i O x e f f r 2 r S i O x ( r S i O x 2 c S i O x r S i O x )
c G r t = D G r e f f r 2 r G r ( r G r 2 c G r r G r )
Here, the subscripts SiOx and Gr represent the SiOx and graphite particles, respectively. c is the solid-phase lithium concentrations in the particles, Deff denotes the effective solid-phase diffusion coefficients, r is the radial coordinate, and t is the time. The boundary conditions for these two equations are as follows:
c S i O x r S i O x r S i O x = 0 = 0               D S i O x e f f c S i O x r S i O x r S i O x = R S i O x = j S i O x , int a S i O x F
c G r r G r r G r = 0 = 0               D G r e f f c G r r G r r G r = R G r = j G r , int a G r F
where R is the particle radius, F is the Faraday constant, and jint represents the volumetric current densities. a is the specific surface areas with the expressions given as follows:
a S i O x = 3 ε s , S i O x / R S i O x
a G r = 3 ε s , G r / R G r
where εs denotes the volume fraction of the active material. The volumetric current densities of SiOx and graphite are given by:
j S i O x , int = 2 a S i O x i S i O x , 0 sinh 0.5 F R T Φ s Φ e Φ S i O x , O C P
j G r , int = 2 a G r i G r , 0 sinh 0.5 F R T Φ s Φ e Φ G r , O C P
where R is the gas constant, T is the temperature, Φs is the solid-phase potential, and Φe is the liquid-phase potential. The exchange current densities for SiOx iSiOx,0 and graphite iGr,0 are expressed as follows:
i S i O x , 0 = m n c e c S i O x , s u r f c S i O x , max c S i O x , s u r f
i G r , 0 = m n c e c G r , s u r f c G r , max c G r , s u r f
where mn is the reaction rate constant of the negative electrode, cmax and csurf represent the maximum lithium concentration and the lithium concentration at the particle surface, respectively. At the electrode level, the total current density in the SiOx/Gr composite electrode is distributed between the two materials:
j int = j S i O x , int + j G r , int
The electrochemical processes in the electrolyte are consistent with those in the conventional pseudo-two-dimensional (P2D) model. The charge conservation equation in the electrolyte is given by:
· κ e e f f Φ e + · κ D e f f ln c e = j int
where κeeff is the effective ionic conductivity of the electrolyte, and κDeff is the effective diffusional conductivity. The mass conservation equation in the electrolyte is expressed as follows:
ε c e t = · D e e f f c e + 1 t + F j int
where ε is the volume fraction of the electrolyte, Deeff is the effective diffusion coefficient in the liquid phase, and t+ is the transference number of lithium ions.

2.2. Thermal Model

The heat generation in the cell can be calculated using the following equation:
q = j T U e q T + j Φ s Φ e U e q + σ s e f f Φ s · Φ s + σ e e f f Φ e · Φ e + σ e e f f ln c e · Φ e
The first term represents the reversible heat, the second term denotes the kinetic heat, and the remaining three terms collectively form the ohmic heat. Based on the heat generation, the cell temperature T can be calculated. This temperature T can serve as an input to other models:
m c p d T d t = Q + h A T a m b T
where m, A and cp are the mass, surface area, and specific heat capacity of the cell, respectively; Q is the total heat generation rate; and h is the convective heat transfer coefficient.

2.3. Aging Models

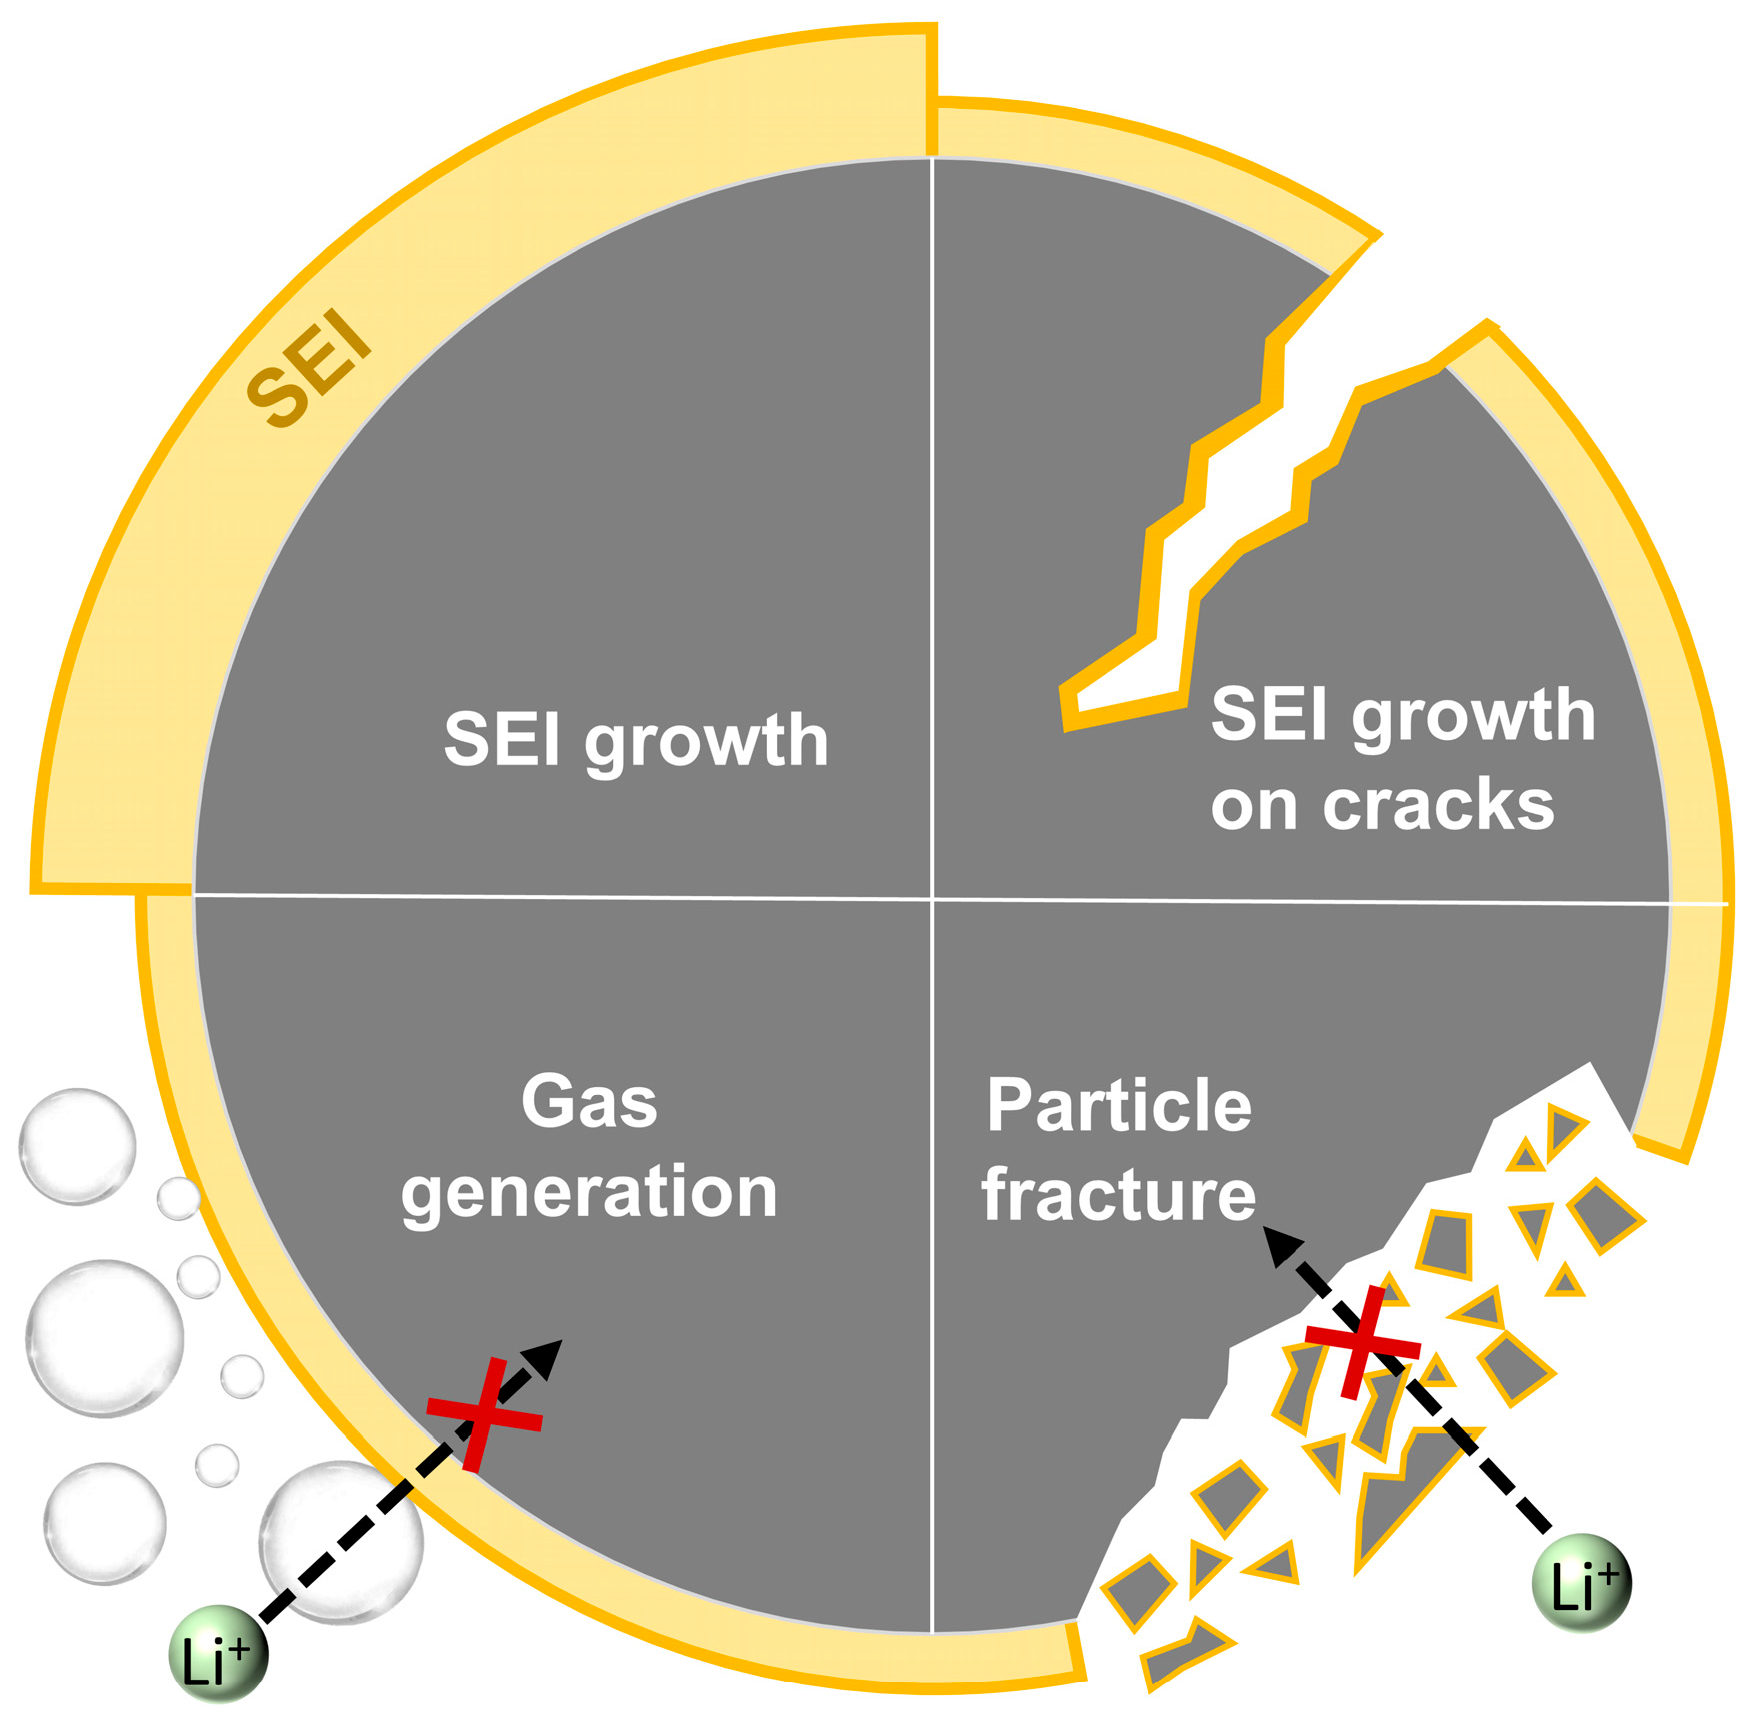
The models described above capture the electrochemical and thermal behavior of batteries with SiOx/Gr anodes. The following section introduces an aging model that couples multiple degradation mechanisms, including SEI growth, gas generation, SEI growth on cracks, and particle fracture, as shown in Figure 1.

2.3.1. SEI Growth

SEI growth consumes active lithium and electrolyte, leading to capacity fade and cell aging. This study adopts the SEI growth model proposed by Yang et al. [28]. The reaction equation for SEI growth is as follows:
2 C 2 H 4 CO 3 + 2 e + 2 Li + CH 2 OCO 2 Li 2 + C 2 H 4
The SEI growth occurs on the surface of the anode particles. Therefore, the total volumetric current density can be expressed as follows:
j t o t = j int + j S E I
The current density of the SEI growth is calculated using the cathodic Tafel equation:
j S E I = a F k 0 , S E I c E C s exp α c , S E I F R T Φ s Φ e j t o t a R f i l m U S E I
where k0,SEI is the reaction rate constant, USEI is the equilibrium potential of the SEI reaction, and cECs represents the EC concentration at the surface of the anode particles, which can be derived from the overall mass conservation of EC:
D E C c E C s c E C 0 δ f i l m = j S E I F
where DEC is the diffusion coefficient of EC. The SEI concentration is directly influenced by the reaction current density and can be described by the following mass balance equation:
c S E I t = j S E I 2 F
An equivalent film thickness is derived by calculating the total volume generated by SEI, normalized by the specific surface area of the anode particles. The expression is given as follows:
δ f i l m = 1 a c S E I · M S E I ρ S E I
where MSEI is the molar masses of SEI, and ρSEI denotes the density of SEI. The film resistance is attributed to the SEI layer:
R f i l m = δ f i l m κ S E I
where κSEI the ionic conductivity of the SEI layer. As SEI is generated, the resulting surface film covers the anode particle surfaces, reducing the porosity of the anode. The relationship between porosity and the equivalent film thickness can be described by:
d ε d t = a d δ f i l m d t

2.3.2. Gas Generation

Gas generation is assumed to occur exclusively through the SEI growth, as represented by Equation (16). The generated gas occupies cell pores, leading to loss of active material. This process can be quantitatively described using the concepts of activity and saturation. The activity is defined as follows [29]:
a = ε a c t ε a c t + ε i n a c t
where εact is the volume fraction of active material, εinact is the volume fraction of inactive material. The volume fraction of active material depends on the proportion of pore volume occupied by the electrolyte, which can be expressed by the saturation:
s = ε e l y t ε e l y t + ε g a s
where εelyt denotes the total pore volume of all components (positive electrode, negative electrode, and separator) normalized by the total jellyroll volume, and εgas represents the volume fraction of gas-filled pores relative to the total jellyroll volume. These are calculated as follows:
ε e l y t = V p r o e , p + V p o r e , n + V p r o e , s V p + V n + V s
ε g a s = V g a s V p + V n + V s · k g a p
Here, kgap is a proportionality coefficient used to account for the effect of the gap between the aluminum-plastic film and the jellyroll on gas storage. The total gas volume is calculated using the ideal gas law:
V g a s = n R T P
where P is the gas pressure. The gas generated within the cell is in series with the jellyroll, and the gas pressure is equal to the pressure applied on the jellyroll.

2.3.3. SEI Growth on Cracks

A key feature of SiOx/Gr anodes is the large volume change during electrochemical reactions. Stresses from repeated lithiation and delithiation can induce cracks in the active material particles, exposing fresh surfaces to the electrolyte and triggering additional SEI formation, which consumes more lithium. This study follows the modeling approach of O’Kane et al. [30] to describe SEI growth on these newly formed crack surfaces.
The radial stress σr and tangential stress σt in the particles are expressed as follows:
σ r = 2 Ω E 1 υ c a v g R i c a v g r
σ t = Ω E 1 υ 2 c a v g R i + c a v g r c ¯ / 3
where Ω is the partial molar volume, E is Young’s modulus, and v is Poisson’s ratio. cavg(r) denotes the average lithium concentration within the range from 0 to r, given by:
c a v g r = 1 3 r 3 0 r c ¯ r 2 d r
The propagation of the crack length lcr during cycling follows Paris’ law:
d l c r d N = k c r t 0 σ t b c r π l c r m c r             σ t > 0
where N is the number of cycles, t0 is the duration of a single cycle, bcr is a correction factor for the stress intensity factor, and kcr and mcr are experimentally determined constants. The instantaneous rate of change in crack area can be calculated as follows:
d a c r d t = a ± ρ c r w c r t 0 · d l c r d t = a ± ρ c r w c r t 0 · k c r σ t b c r π l c r m c r             σ t > 0
As cracks propagate, additional SEI forms on the newly exposed surfaces. However, since cracks initiate at different times, the SEI thickness on each crack surface is non-uniform. For simplicity, the model presented in this study assumes a uniform crack length and calculates the average SEI film thickness using:
L S E I , c r t = c s o l , 0 D s o l T V ¯ S E I 2 L S E I , c r + l c r t L S E I , c r 0 L S E I , c r l c r

2.3.4. Particle Fracture

The rate of active material loss due to particle fracture can be estimated as follows [31]:
ε a t = β t 0 σ h , max σ h , min σ c m 2             σ h , min > 0
where β and m2 are experimentally fitted constants, σc is a critical stress threshold, and σh denotes the hydrostatic stress; σh,max and σh,min represent the maximum and minimum values of hydrostatic stress, respectively.
In this study, the parameters used in the aforementioned electrochemical model, thermal model, and four aging models (SEI growth, gas generation, SEI growth on cracks and particle fracture) are summarized in Table 1.

3. Experiment

The Li-ion pouch cells used for model validation have a nominal capacity of 2.6 Ah and an energy density of 250 Wh/kg, which can be further increased to 291 Wh/kg when scaled to a 50 Ah format. The cell uses SiOx/Gr (14 wt%/86 wt%) as the anode, LiNi0.9Co0.05Al0.05O2 (NCA) as the cathode, and 1 M of LiPF6 dissolved in ethylene carbonate/ethyl methyl carbonate (EC/EMC, 3:7 by weight) supplemented with 10 wt% fluoroethylene carbonate (FEC) as electrolyte. Detailed design information of the cell is given in Table 1.
To validate the proposed model, two types of experiments were conducted: initial performance tests and cycling aging tests. The initial performance tests were designed to evaluate the cell behavior under different charge/discharge rates and temperatures, while the cycling aging tests provided degradation data under various mechanical and thermal conditions.
The rate performance tests were performed at room temperature. For charge rate capability tests, the cell was charged under a constant-current (CC) protocol at 0.3 C, 1 C, 2 C, and 3 C to 4.25 V, followed by a constant-voltage (CV) step at 4.25 V until the current decreased to C/20. After a 30 min rest, the cell was discharged at 0.3 C to 2.5 V, followed by another 30 min rest. In discharge rate capability tests, the cell was charged at 0.3 C (CCCV, cutoff C/20), rested for 30 min, and discharged at 0.1 C, 0.3 C, 1 C, and 3 C to 2.5 V, with 30 min rest intervals between steps. Temperature-dependent tests were performed by first charging the cell at 0.3 C (CCCV, cutoff C/20) at room temperature, then equilibrating it at −20 °C, −10 °C, 0 °C, and 25 °C before discharging at 0.3 C to 2.5 V. Each charge/discharge step included a 30 min relaxation period to ensure sufficient electrochemical stabilization.
Cycling aging tests were performed under controlled temperature (25 °C or 60 °C) and preload pressure (0.1 MPa or 0.5 MPa) to investigate the coupled thermo-mechanical effects on cell degradation. Each cycle consisted of a 1 C CC charge to 4.25 V, followed by a CV hold until the current decreased to C/20, and a subsequent discharge at 1 C or 3 C to 2.5 V. At regular intervals, reference performance tests (RPTs) were carried out using a 0.3 C CCCV protocol (voltage range 2.5–4.25 V, cutoff C/20) to assess capacity evolution and to validate the model predictions during the aging process.

4. Results and Discussion

4.1. Model Validation

To ensure the physical fidelity and predictive capability of the proposed model, a systematic comparison with experimental data is needed. In this work, the electrochemical–thermal–mechanical–gaseous coupled model is validated through two aspects: initial and aging performance validation. The former assesses the model’s ability to reproduce short-term electrochemical responses, while the latter evaluates its accuracy in predicting long-term degradation.
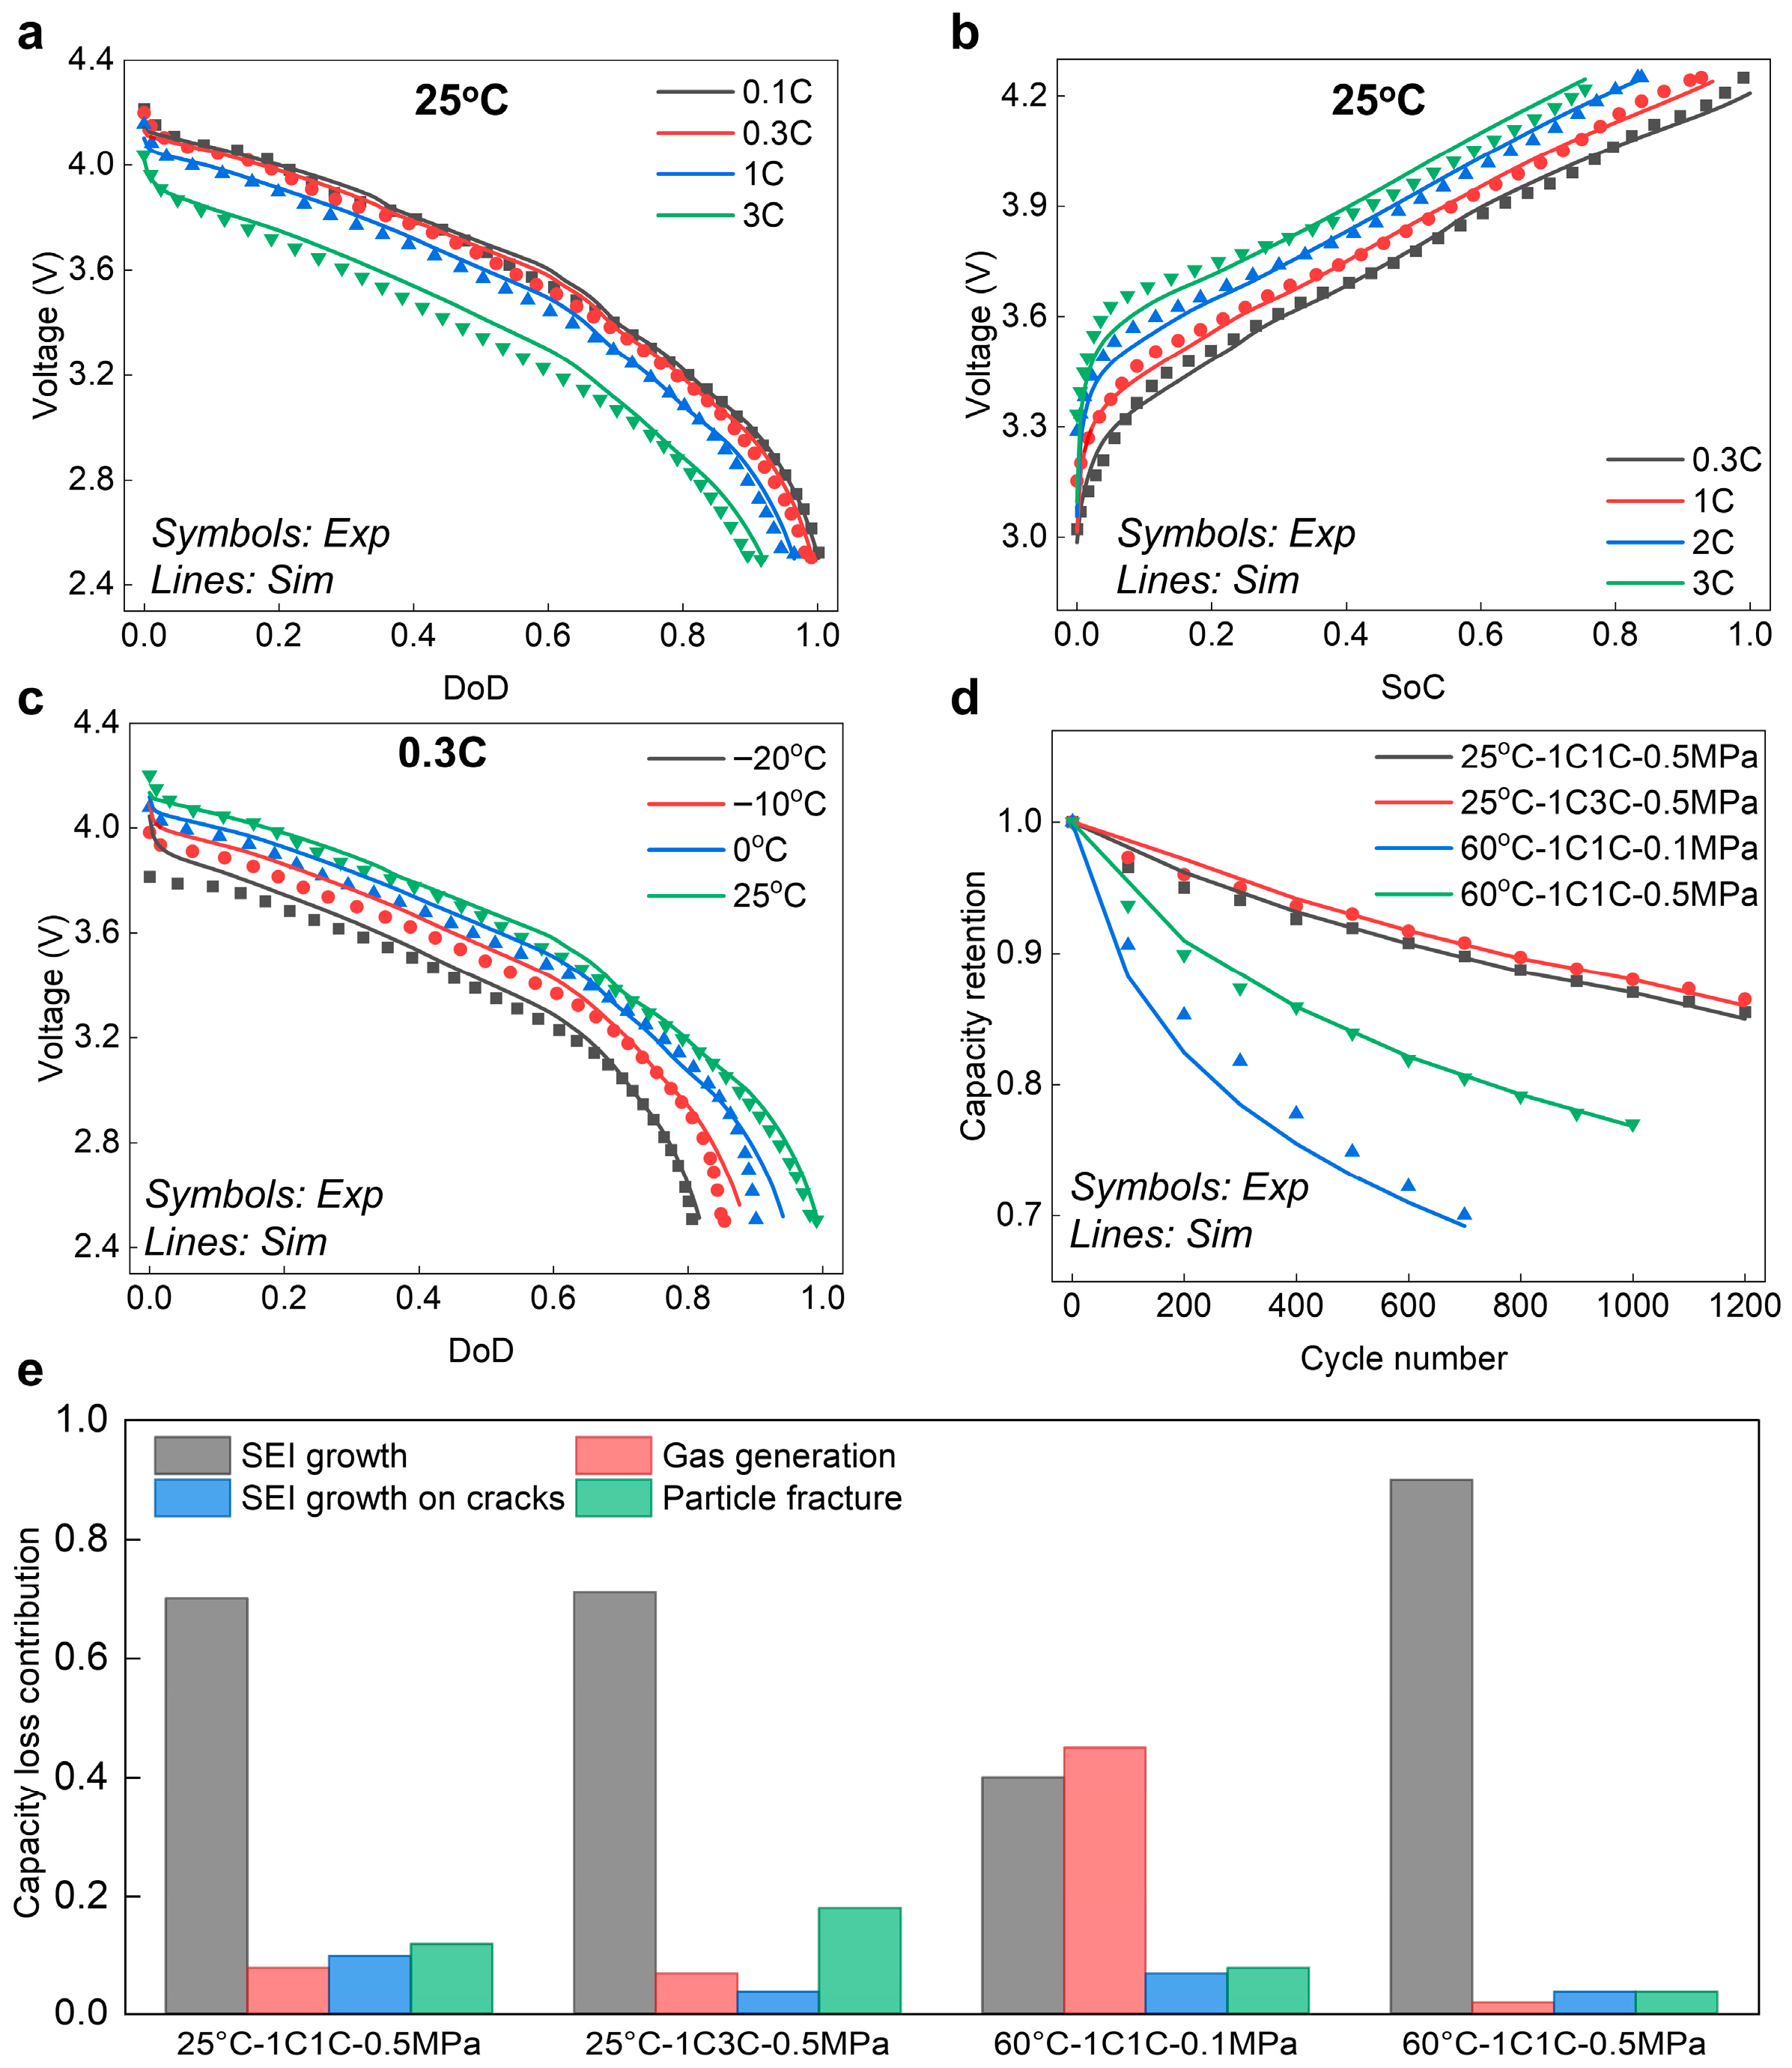
Initial performance validation: This validation aims to calibrate the key physicochemical parameters in the electrochemical-thermal sub-model of the coupled framework, ensuring the model can accurately reproduce the multi-scale phenomena such as solid-state diffusion within active particles, ionic transport in electrolyte, and charge-transfer reactions at the electrode–electrolyte interface. Two sets of experiments were conducted to validate the model: (1) multi-rate charge–discharge tests at room temperature, including discharge rates of 0.1 C, 0.3 C, 1 C, and 3 C, and charge rates of 0.3 C, 1 C, 2 C, and 3 C, and (2) temperature-dependent tests performed at −20 °C, −10 °C, 0 °C, and 25 °C. As shown in Figure 2a–c, the simulated voltage curves show excellent agreement with the experimental data under all tested conditions. The root mean square error (RMSE) between simulation and experiment remained below 51 mV, demonstrating the accuracy of the electrochemical-thermal sub-model.
Aging performance validation: This validation aims to reproduce the capacity fade behavior by calibrating the key parameters governing the degradation mechanisms of SiOx/Gr batteries, including SEI growth, gas generation, SEI growth on cracks, and particle fracture. Three experimental sets were conducted to validate the aging model: (1) During battery testing, the amount of gas generated inside the cell under applied pressure cannot be directly measured. To indirectly and physically meaningfully assess the impact of gas generation on cell performance, we introduced different preloading pressures based on previous study showing that mechanical constraint suppresses gas evolution and prolongs battery lifetime [32]. Specifically, pressures of 0.1 MPa and 0.5 MPa were chosen to represent low and high mechanical constraints, allowing for a systematic evaluation of how pressure-mediated gas suppression affects long-term cell behavior. (2) The temperatures of 25 °C and 60 °C were chosen to validate the SEI growth model, as SEI formation and evolution are strongly temperature-dependent. Room temperature (25 °C) represents typical operating conditions, while elevated temperature (60 °C) accelerates SEI growth and related degradation processes. By comparing model predictions and the experimental results at these two temperatures, the validity of the temperature-dependent SEI growth model can be effectively assessed. (3) To examine the influence of cycling rate on degradation driven by crack propagation and particle fracture, comparative cycling tests were conducted at room temperature under discharge rates of 1 C and 3 C.
As shown in Figure 2d, the simulated capacity fade curves closely match the experimental measurements across all tested conditions, with a RMSE below 0.03. This strong consistency verifies the model’s ability to accurately capture the multi-mechanism coupled degradation behavior of SiOx/Gr batteries. Beyond reproducing overall capacity fade, the model also enables a mechanistic decomposition of capacity loss, allowing us to quantify the relative contributions of each degradation mechanism under different operating conditions. Specifically, under the 60 °C, 1C cycling condition with 0.1 MPa preloading pressure, gas generation is found to contribute the most to capacity loss, whereas under other cycling conditions, SEI growth dominates the capacity loss.

4.2. Gas Generation and SEI Growth Interactions

During cycling, the periodic mechanical stress induced by lithiation and delithiation causes repeated cracking and reformation of the SEI layer, which continuously consumes active lithium and electrolyte, and simultaneously triggering gas-generation side reactions. The accumulated gases can block electrode pores and hinder ion transport, further accelerating the deterioration of electrochemical performance. Therefore, understanding the influence of gas generation on the internal electrochemical and physical parameters of the cell—particularly its coupling with SEI growth—is essential for revealing the complex aging pathways of SiOx/Gr batteries.

4.2.1. Impact of Gas Generation on Cell Performance

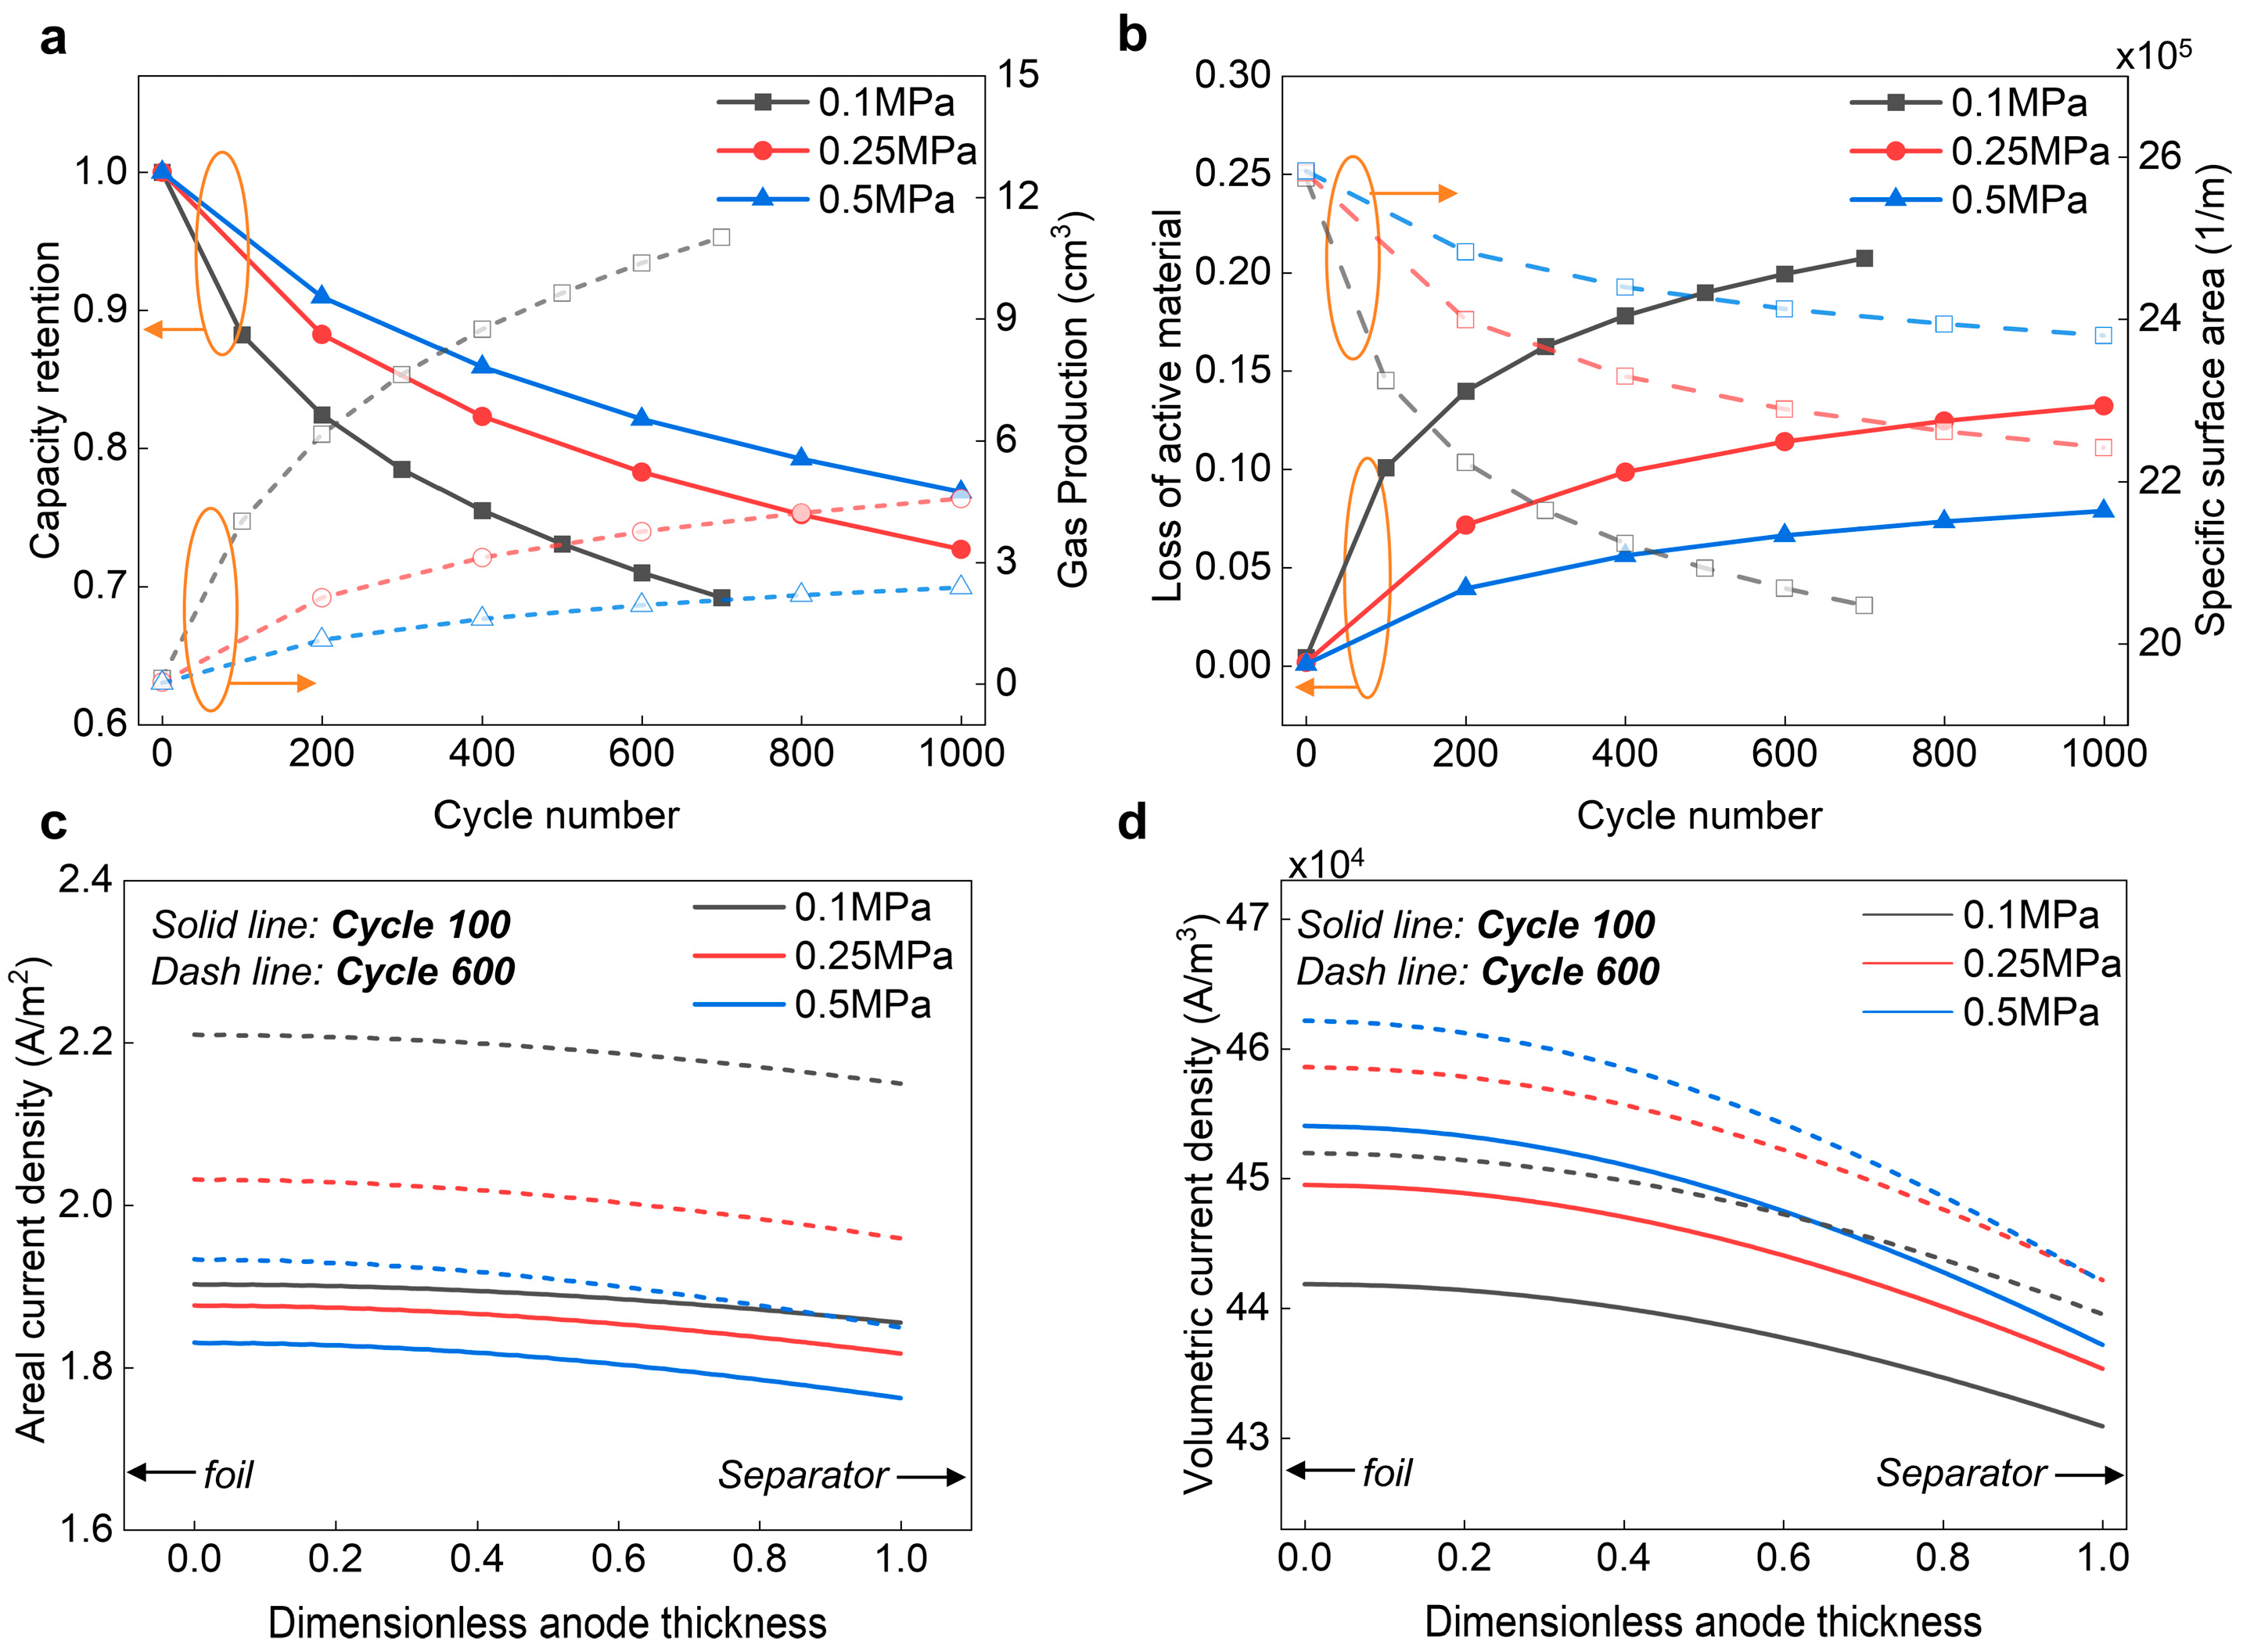
To examine the effect of gas generation, the cell was systematically evaluated at 60 °C under three preload conditions: 0.1, 0.25, and 0.5 MPa. As shown in Figure 3a, the cell subjected to a low preload (0.1 MPa) exhibited accelerated capacity fading accompanied by pronounced gas generation. Under such insufficient preload, gases tend to accumulate and block the electrode pores, impeding electrolyte transport, exacerbating local concentration gradients and electrode polarization, and ultimately accelerating performance degradation. In contrast, cells under higher preload exhibited reduced gas generation and improved capacity retention. A higher preload constrains gas accumulation within the pore and maintains electrolyte wetting, thereby mitigating the detrimental impact of gas generation on cell’s available capacity.
Moreover, gas generation also affects the lithiation kinetics of the electrode. As shown in Figure 3b, under the preload of 0.1 MPa, the active material loss increases markedly during cycling, reducing the electrode’s effective reaction surface area and, consequently, limiting its electrochemical activity.
Gas generation also influences the reaction current density within the electrode. Figure 3c compares the local areal current density at the end of discharge for the 100th and 600th cycles under three preload conditions. During the early stage of cycling (100th cycle), the differences in areal current density among the preload levels are minimal, and the overall values remain low. After prolonged cycling (600th cycle), severe gas generation under low preload (0.1 MPa) causes substantial active material loss, resulting in a pronounced increase in areal current density. In contrast, under higher preload (0.5 MPa), the increase in areal current density over cycling is much smaller, indicating that stronger mechanical constraint effectively suppresses gas generation and active material loss, thereby preserving interfacial stability and promoting a more uniform current distribution.
It should be noted that the volumetric current density is determined by both the areal current density and the specific surface area. Gas generation impacts electrode reactions through two competing mechanisms: first, the reduction in active material volume fraction decreases the specific surface area; second, the loss of active material increases the areal current density. These two effects therefore exert opposite influences on the volumetric current density. As shown in Figure 3d, under the conditions of this study, the decrease in specific surface area dominates; so, despite higher areal current density under low preload, the volumetric current density is actually lower. This finding indicates that in SiOx/Gr batteries, gas generation is not merely a byproduct of side reactions but also indirectly modulate electrode reaction kinetics by altering the reactive interface, thereby influencing the overall aging pathways and performance evolution of the cell.

4.2.2. Interaction Between Gas Generation and SEI Growth

To further clarify the coupling between gas generation and SEI growth, we compared model simulations with and without gas-generation effects under the condition that induces the most severe gas evolution (60 °C, 0.1 MPa preload).
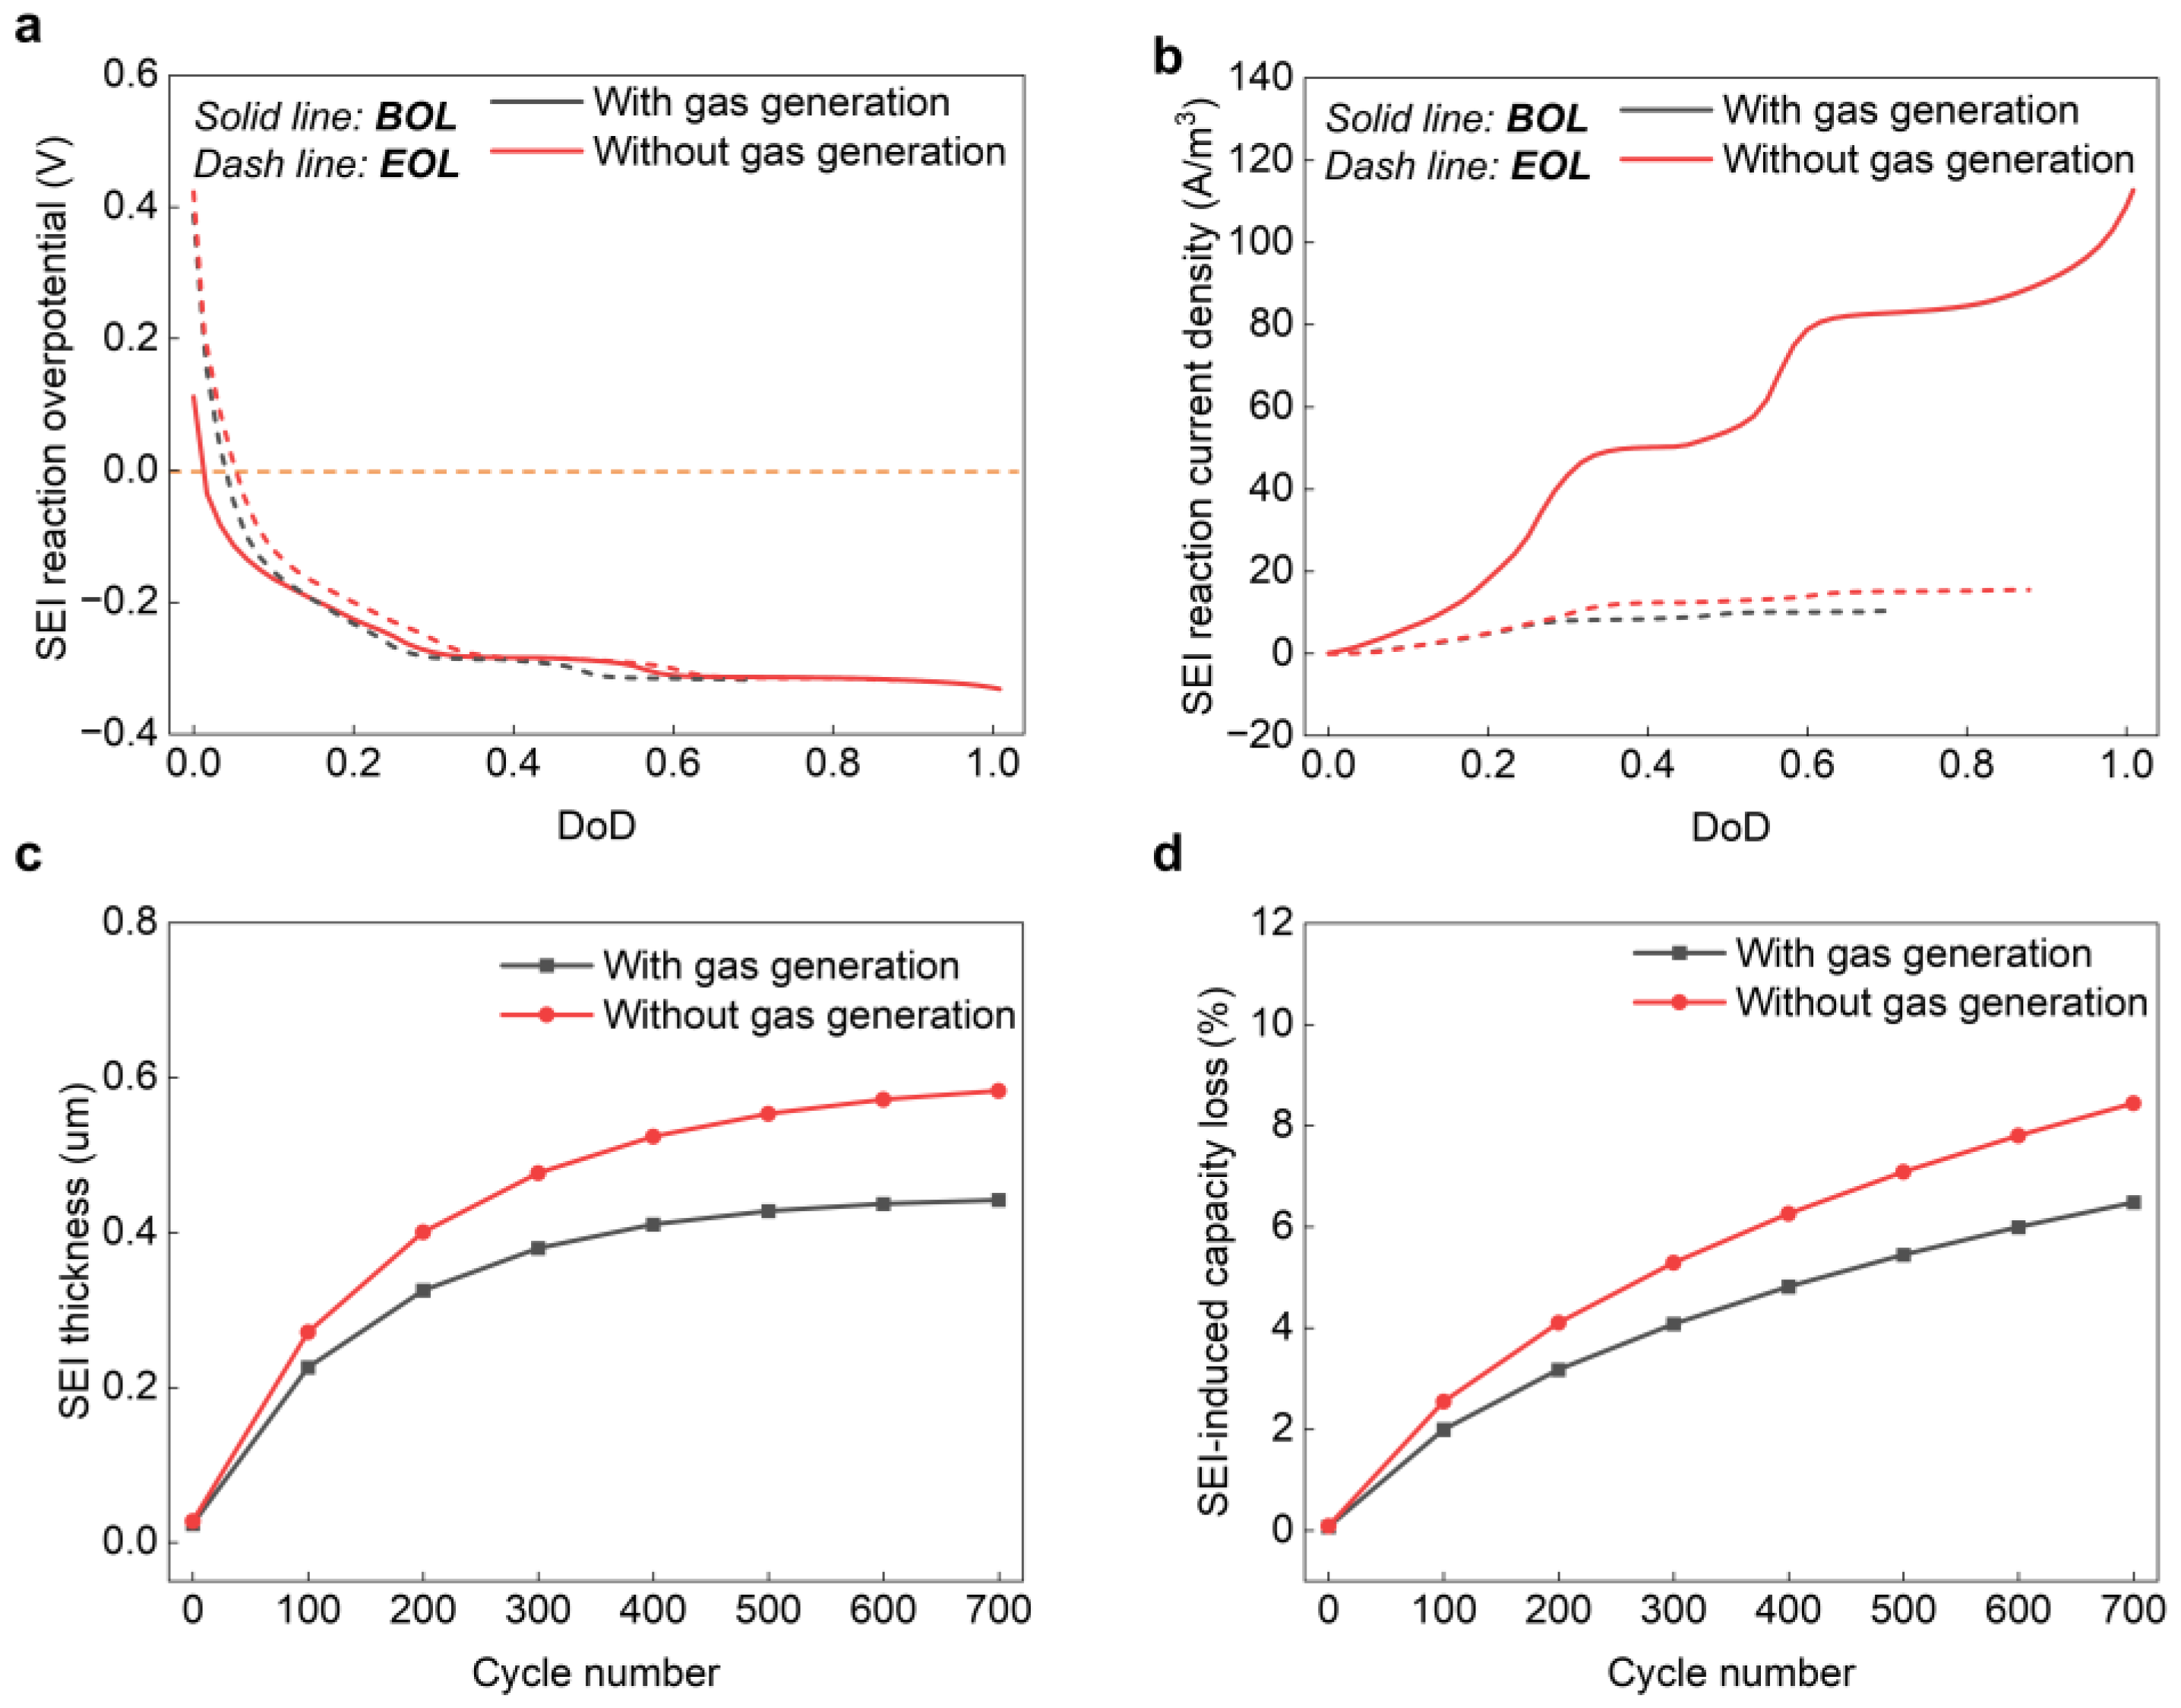
As shown in Figure 4a, at the beginning of life (BOL), gas accumulation is minimal and its influence on the SEI reaction overpotential is negligible. By contrast, at the end of life (EOL), substantial gas accumulates within the electrode pores and severely hinders liquid-phase mass transport. Consequently, when gas generation is included in the model, the SEI reaction overpotential decreases markedly, thereby making it easier for SEI side reactions to occur.
Figure 4b presents the evolution of SEI reaction current density under both conditions. At the BOL, the influence of gas generation remains negligible. At the EOL, the SEI reaction current density in both cases is significantly lower than its initial value, reflecting the inherently self-limiting nature of SEI growth. Notably, although gas generation reduces the SEI reaction overpotential and would theoretically promote the side reactions, the accumulated gas simultaneously decreases the electrode’s specific surface area and limits the available reaction interface. Under the conditions of this study, the decrease in specific surface area dominates, leading to a decrease in SEI reaction current density and ultimately suppressing SEI growth.
The resulting SEI thickness and the associated capacity loss are shown in Figure 4c,d. When gas generation is incorporated into the model, both SEI thickness and the corresponding capacity loss are reduced, further confirming the suppressive effect of gas generation on SEI growth.
In summary, gas generation and SEI growth are coupled through a bidirectional interaction, as illustrated in Figure 5. During cycling, the formation and thickening of the SEI consume active lithium and electrolyte while producing gaseous by-products, making SEI growth a major contributor to gas evolution within the cell. Conversely, the accumulated gas influences subsequent SEI growth through two competing mechanisms:
(1)
Promoting effect: Gas accumulation within the electrode pores hinders liquid-phase ion transport, increasing local polarization. This reduction in SEI reaction overpotential facilitates the occurrence of SEI side reactions and thus promotes SEI growth.
(2)
Inhibiting effect: Gas generation lowers the volume fraction of active materials and reduces the available reaction surface area, thereby restricting the progression of SEI formation.
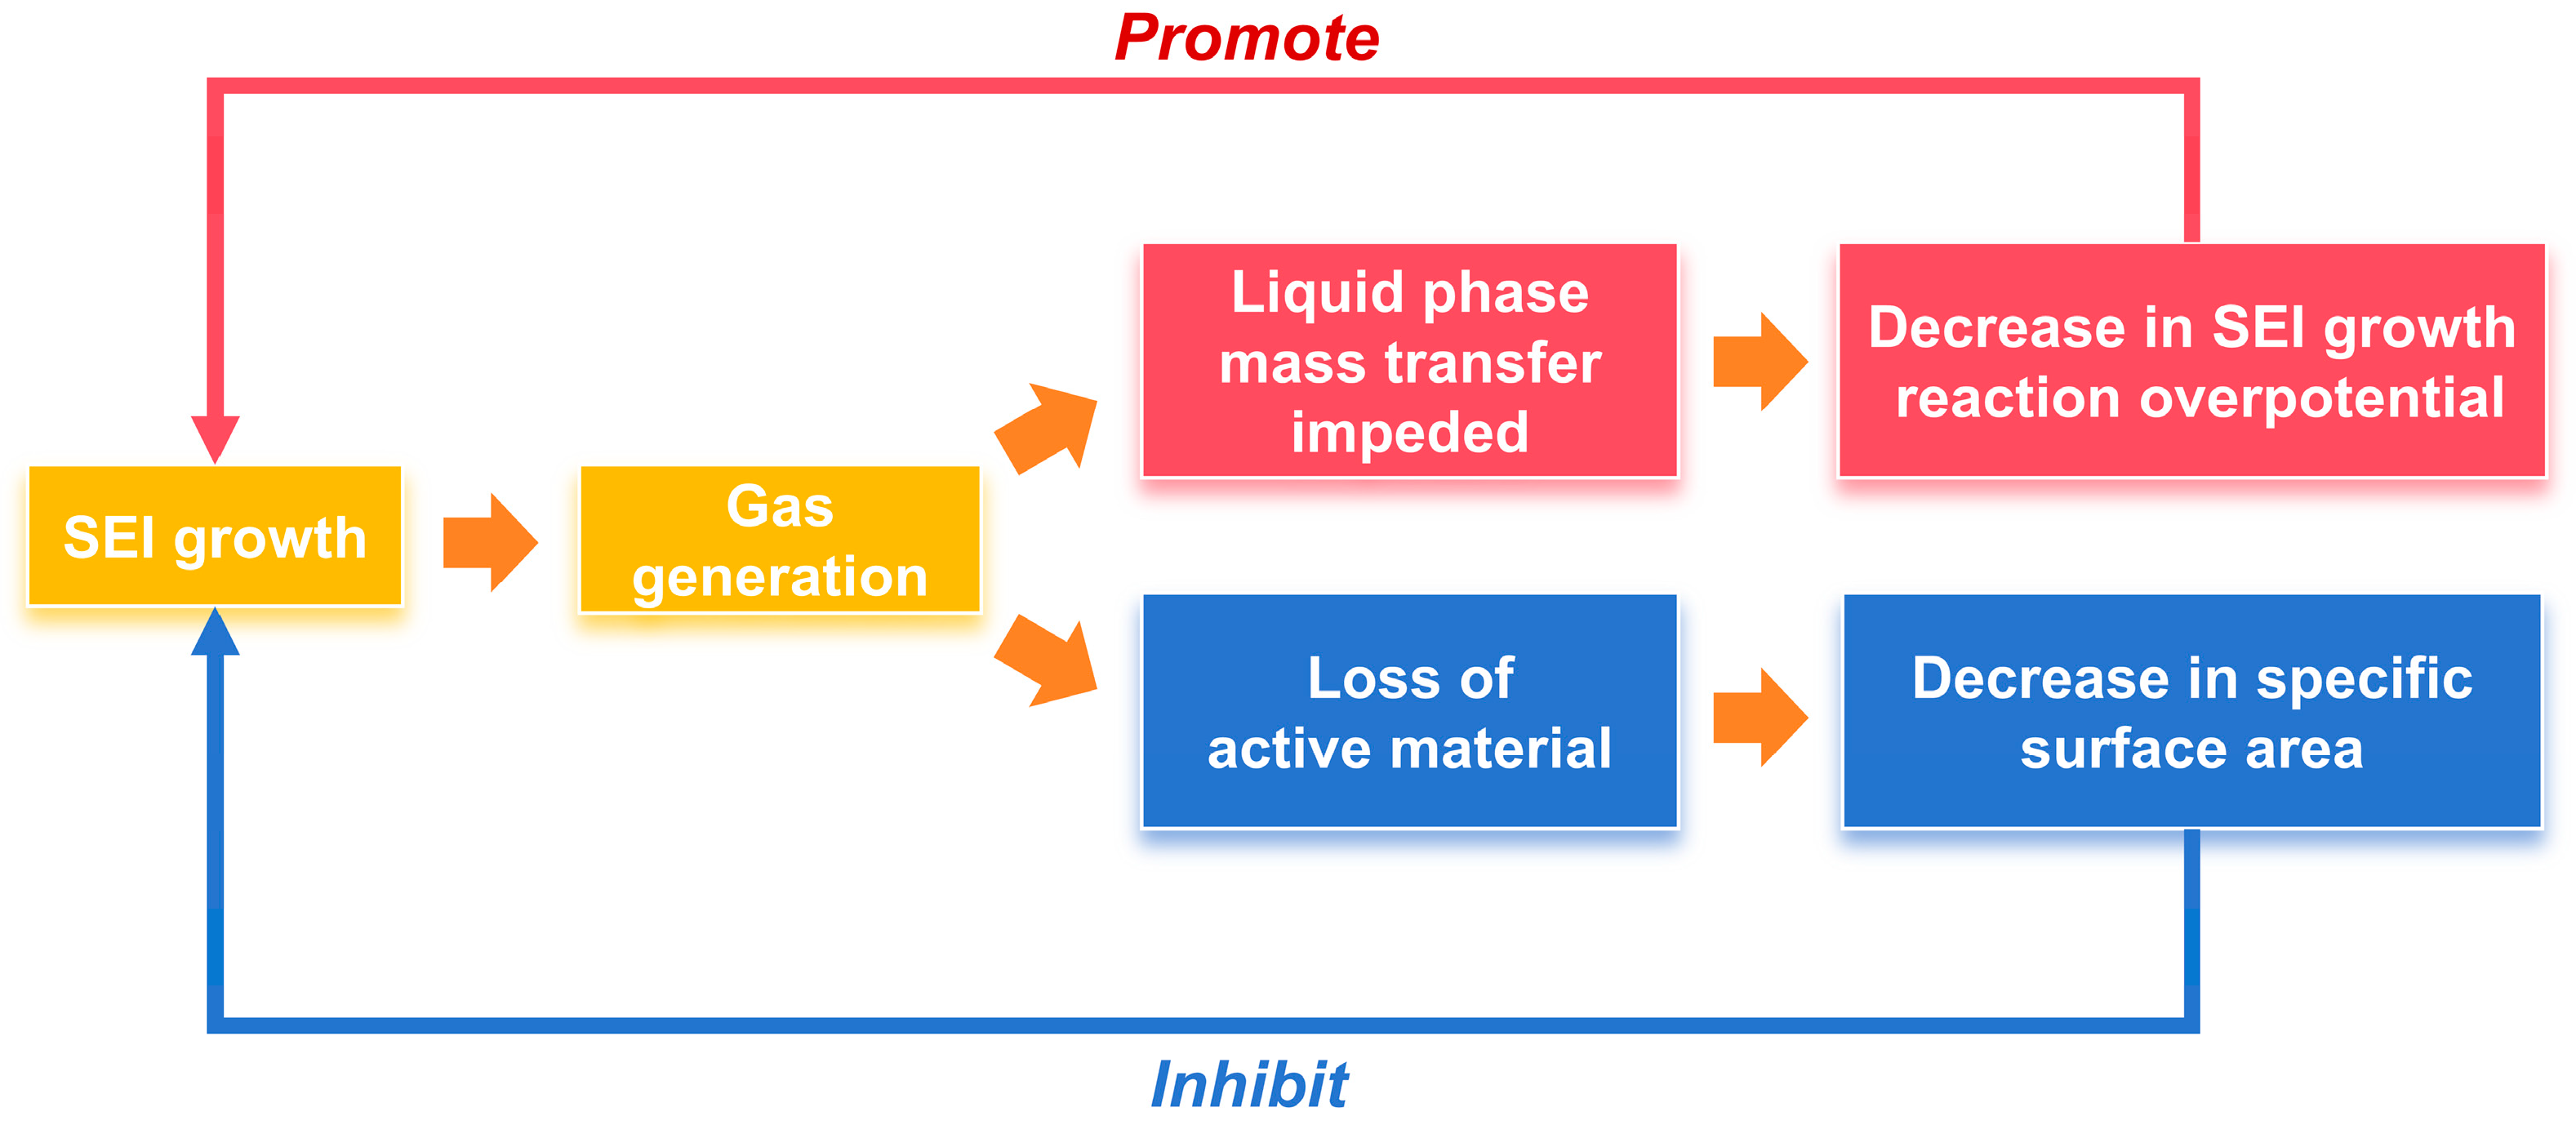
Figure 5. Interaction between gas generation and SEI growth.
Batteries 12 00030 g005
Ultimately, the net impact of gas generation on SEI growth is determined by the competition between “mass-transport-induced promotion” and “surface-area-driven inhibition”. In this study, the loss of reactive surface area is dominant, making gas evolution an overall inhibitory factor for SEI growth. This finding not only deepens the understanding of degradation mechanisms in SiOx/Gr batteries but also provides guidance for the rational design of mechanical constraints and electrolyte formulations.

4.3. Evolution of Particle Stress and Associated Aging Mechanisms

SiOx anodes undergo substantial volume changes during lithiation and delithiation, generating mechanical stresses that can induce microcracks within the particles. The formation of these cracks exposes fresh surfaces to the electrolyte, accelerating SEI formation and thickening; in more severe cases, crack propagation leads to particle fracture, resulting in rapid capacity degradation. To further investigate these mechanically driven failure pathways, this work employs an electrochemical–mechanical coupled model capable of resolving particle-level behavior, which allows us to analyze the underlying causes of crack propagation and particle fracture, and to evaluate how different operating conditions influence these degradation mechanisms.
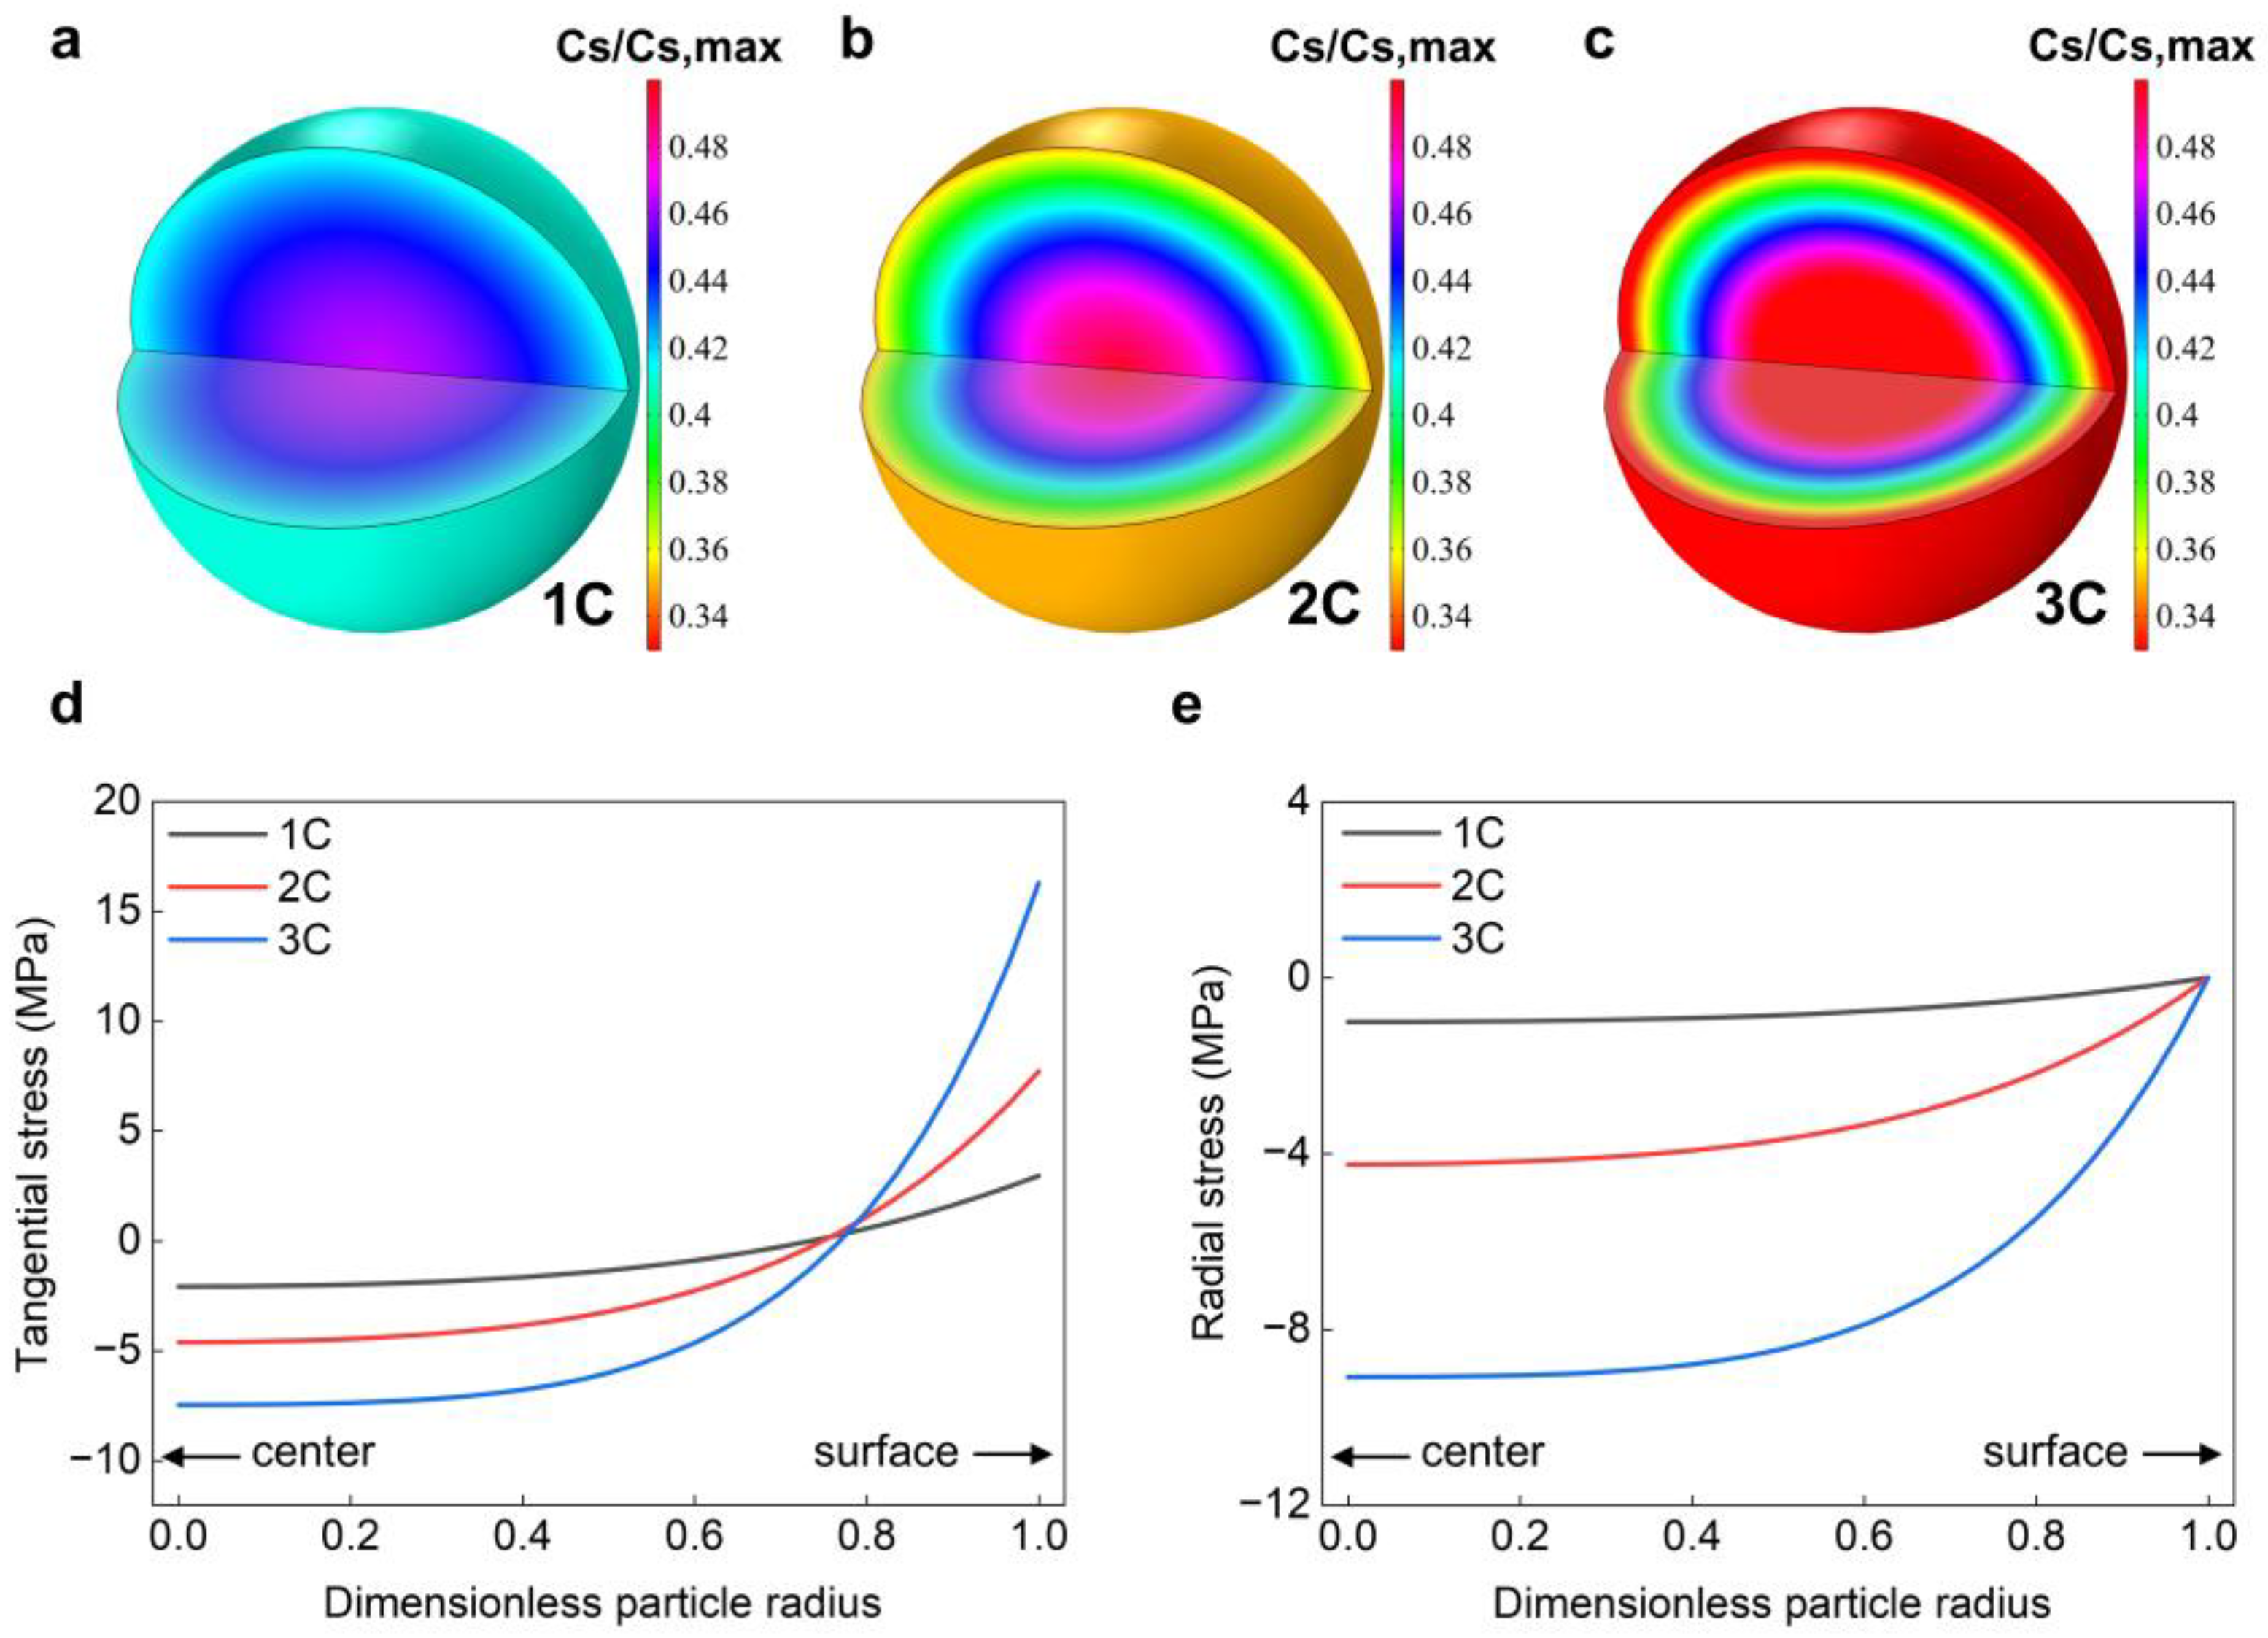
To reveal the origins of particle stress, we simulate the particle response under different discharge rates (1 C, 2 C, and 3 C) with a fixed 1C charge rate. According to diffusion-induced stress theory, internal stresses are closely related to particle size and the internal lithium-ion concentration gradient. At 50% state of discharge, the lithium-ion concentration distribution within the particles near the separator is shown in Figure 6a–c. The results indicate that as the discharge rate increases, the lithium-ion concentration gradient between the particle center and surface increases significantly due to the mismatch between the electrochemical reaction rate and solid-phase ion diffusion rate. The particle stress simulation results, shown in Figure 6d,e, indicate that both tangential and radial stresses at a 3 C discharge rate are consistently higher than those at 1 C and 2 C. This demonstrates that the increased concentration gradient at higher discharge rates directly elevates internal particle stress, which in turn promotes microcrack formation, mechanical pulverization, and ultimately capacity degradation.
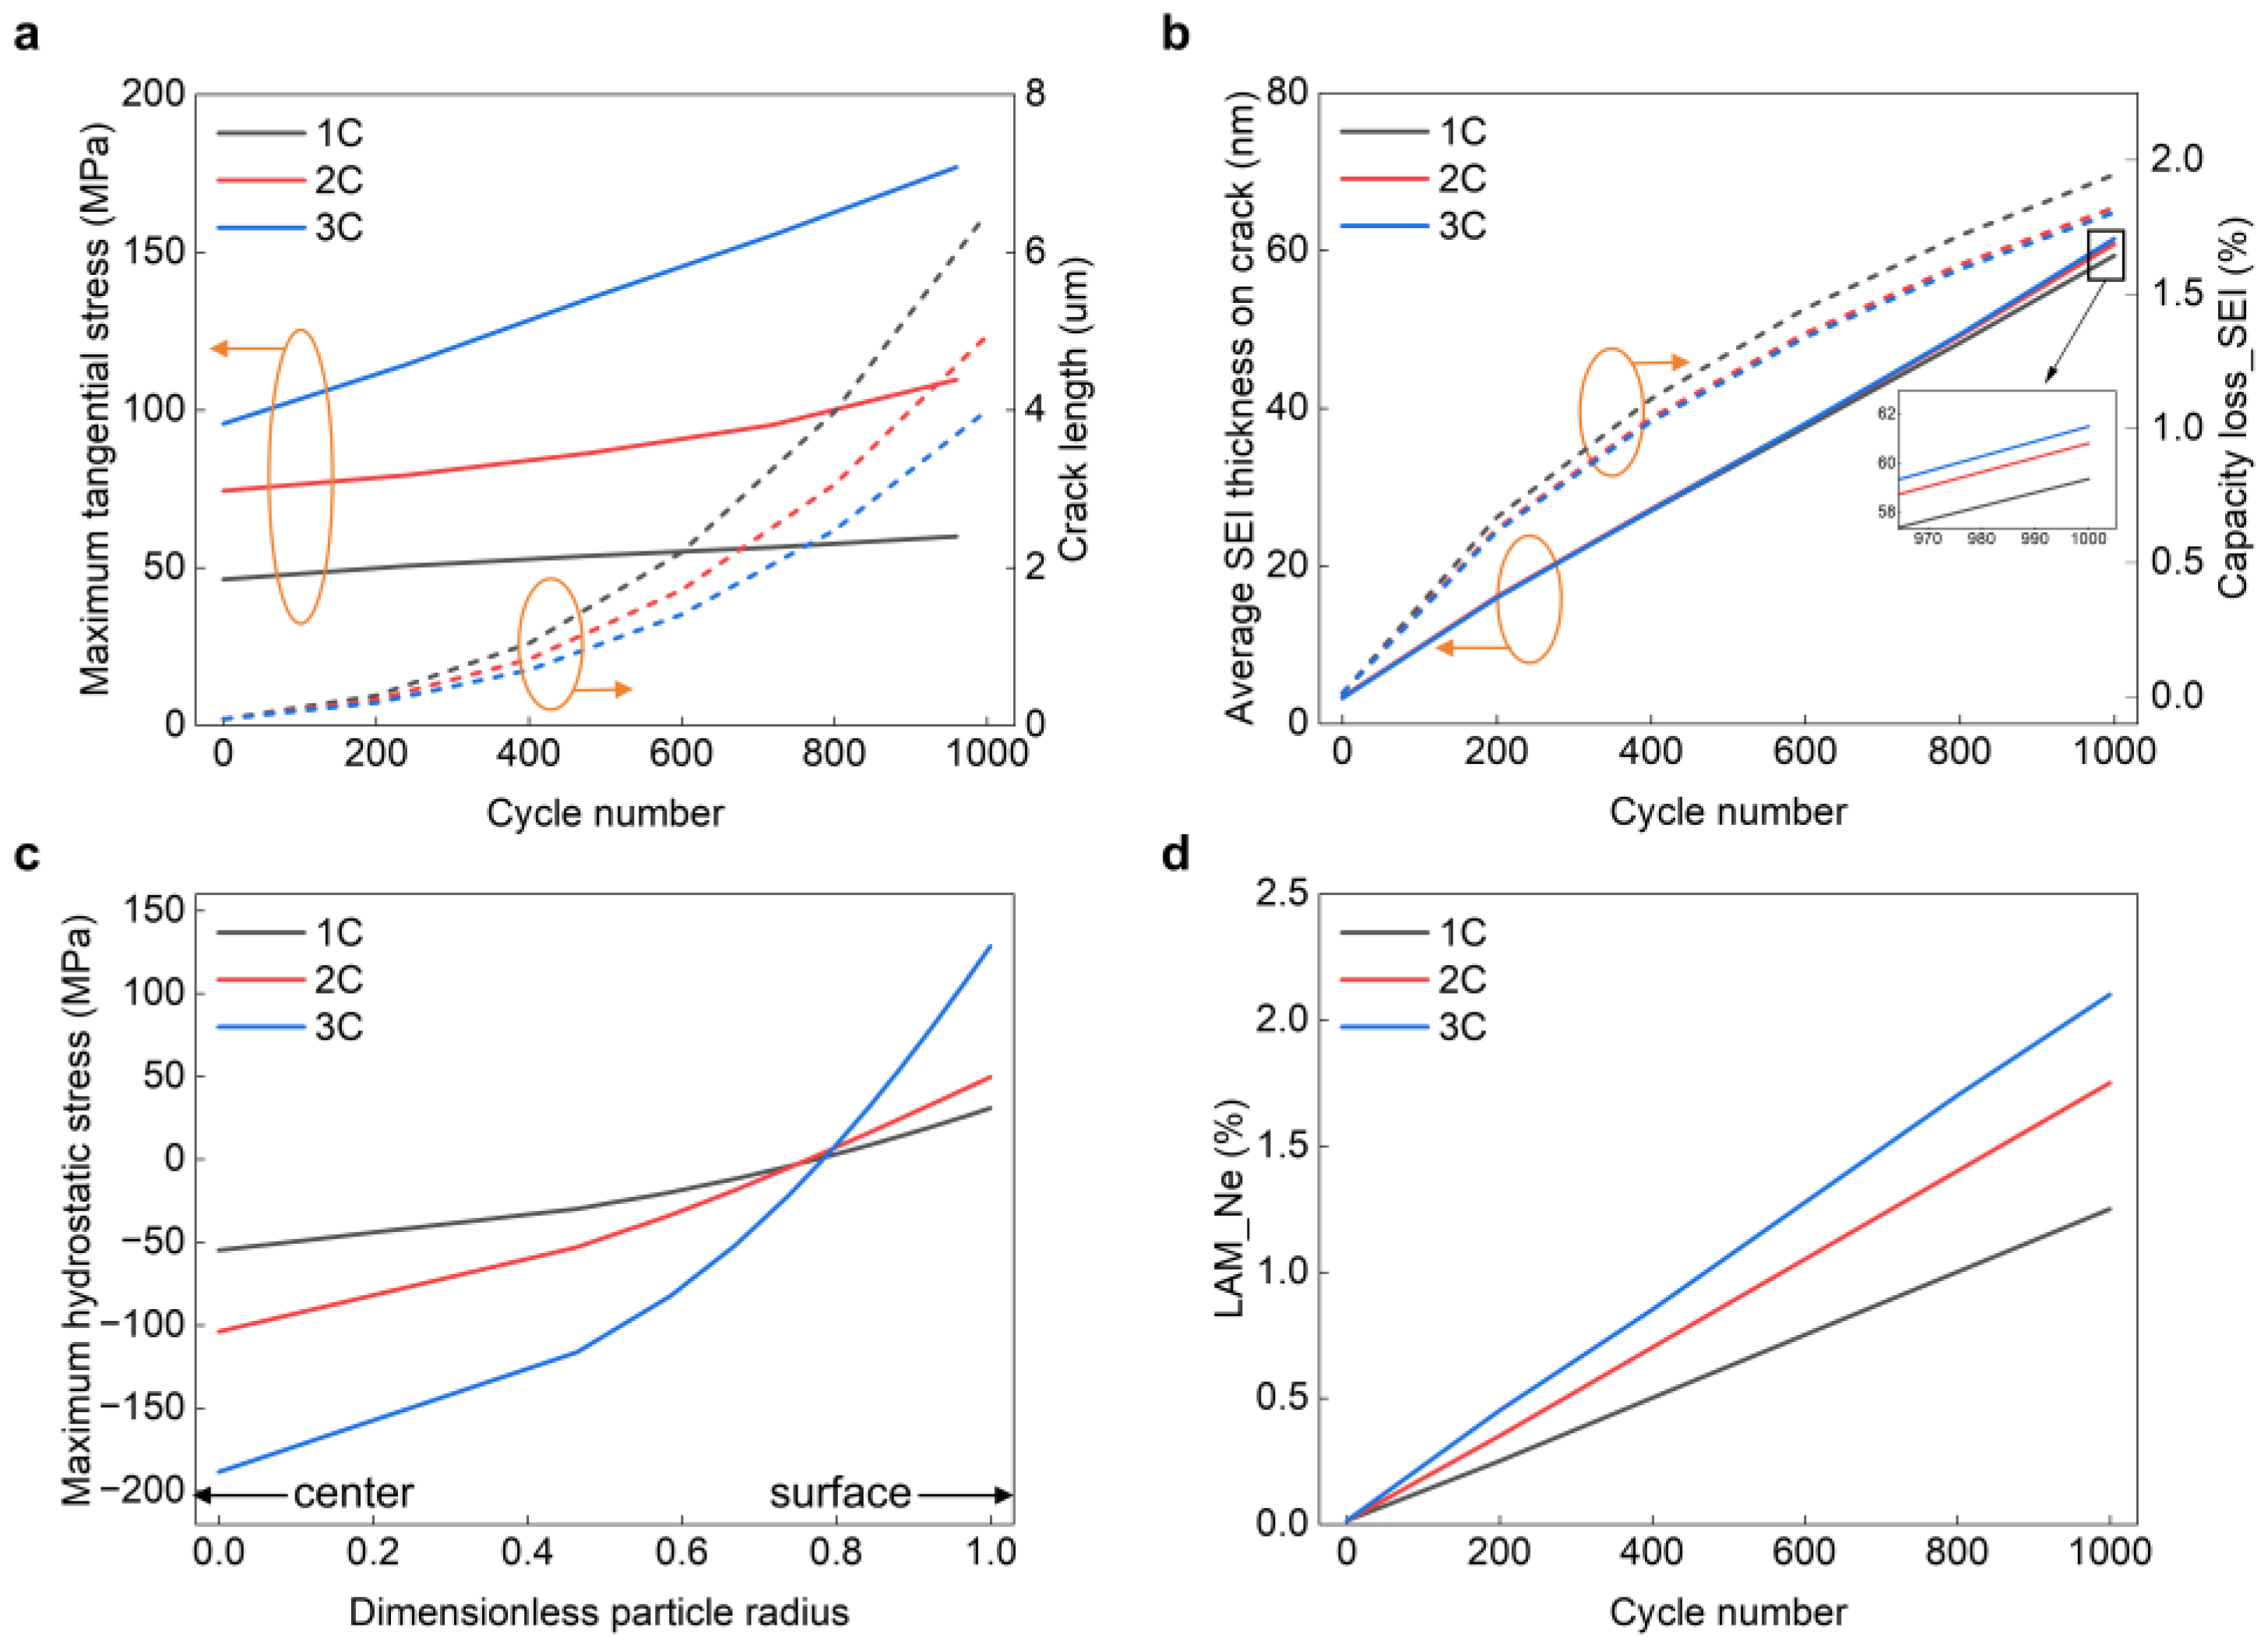
To further examine the evolution of internal stresses and the associated degradation mechanisms, aging simulations were performed under the same charge–discharge conditions described above. As shown in Figure 7a, the maximum tangential surface stress of anode particles near the separator increases with cycling, and higher discharge rates result in larger tangential stress values at the same cycle number, as higher discharge rates exacerbate ion diffusion polarization. Regarding the crack length in the particles, the total crack length at 1 C discharge is the longest after the same cycle number. This outcome is determined by both the magnitude of the tangential stress and the duration of stress exposure. Although 3 C discharge generates the highest instantaneous tangential stress, the discharge time is short, limiting the accumulated stress over each cycle. In contrast, 1 C discharge generates lower stress but over a longer period, resulting in a greater time-integrated stress. Therefore, during long-term cycling, the duration of stress exposure becomes a key factor governing crack propagation.
Crack propagation exposes fresh particle surfaces to electrolyte, leading to the formation of new SEI. Because this newly formed SEI grows on newly generated surfaces, its average thickness on the crack surfaces is lower. As shown in Figure 7b, the shortest crack length under the 3 C discharge condition yields the largest average SEI thickness. In contrast, the 1 C discharge condition produces the longest cumulative crack length, exposing the greatest amount of fresh surface area to the electrolyte and resulting in the largest consumption of active lithium for SEI regeneration.
The above results focus solely on crack propagation due to tangential stress. To investigate the impact of particle fracture on cell performance, it is necessary to consider the hydrostatic stress, which reflects the combined effects of radial and tangential stresses. Figure 7c shows the maximum hydrostatic stress distribution along the particle radius during the discharge process at the end of the cycle.
Under the 3 C discharge condition, the hydrostatic stress exhibits the largest gradient and most significant variation along the particle radius. These large stress fluctuations create intense alternating loads and stress concentrations within the particle.
Under the 3 C discharge condition, the hydrostatic stress exhibits the largest radial gradient, generating strong alternating loads and local stress concentrations. When the local stress exceeds the material’s fatigue limit, it ultimately initiates particle fracture and may even lead to complete pulverization. As shown in Figure 7d, although lithium loss due to SEI growth on the cracks is greatest under 1 C discharge, the most severe loss of anode active material occurs under 3 C discharge, where particle fracture causes direct material loss. This suggests that high discharge rates lead to more direct and severe mechanical degradation of the electrode structure.

5. Conclusions

Owing to their high specific capacity, SiOx/Gr composite anodes are considered key materials for enhancing the energy density of lithium-ion batteries. However, the interplay of multiple degradation mechanisms makes conventional aging models insufficient for capturing their long-term behavior. To address this limitation, this work proposes a coupled electro-thermal-mechanical-gaseous model that incorporates key degradation mechanisms, including SEI growth, gas generation, SEI growth on cracks, and particle fracture, providing a comprehensive analysis of the effects of these mechanisms and their interactions.
Model validation demonstrates that the proposed framework can accurately reproduce voltage responses under various currents and temperatures, as well as capacity fade under different thermal and mechanical conditions. Based on this, the following key conclusions can be drawn:
  • Bidirectional coupling between gas generation and SEI growth: SEI growth is a primary source of gas generation, while gas accumulation, in turn, influences the subsequent evolution of SEI. The effect of gas accumulation on SEI growth occurs through two competing mechanisms: (1) Promoting effect: gas buildup within electrode pores hinders ion transport, reduces the overpotential for SEI side reactions, and accelerates SEI growth. (2) Inhibiting effect: Gas accumulation decreases the reactive surface area, thereby limiting the SEI reaction rate. Ultimately, the net influence of gas generation on SEI growth depends on the compete between the “ promoting effect due to mass transfer limitations” and the “inhibiting effect due to reduced reactive surface area.”
  • Particle crack propagation mechanism: Higher tangential stress in particles accelerates crack propagation, but the final crack length depends on both the stress magnitude and its duration. High-rate discharge generates higher instantaneous stress peaks, but its shorter discharge period limits overall crack growth. In contrast, low-rate discharge generates lower stress levels but applies stress for a longer duration, resulting in a greater crack length over time. This highlights that the duration of stress exposure is a key factor in long-term aging, particularly in aging mechanisms dominated by crack propagation.
Overall, the proposed coupled modeling framework provides mechanistic insights into the relative importance of different degradation mechanisms under varied operating conditions, offering guidance for the design and optimization of long-life, high-performance SiOx/Gr anode batteries.

Author Contributions

Conceptualization, X.L., J.J. and X.-G.Y.; Data curation, X.-Y.M., J.S., X.F. (Xingcun Fan), Z.C. and X.F. (Xiaolong Feng); Formal analysis, X.-Y.M.; Funding acquisition, X.-G.Y.; Investigation, X.-Y.M., M.-R.K., J.S., X.F. (Xingcun Fan), Z.C. and X.F. (Xiaolong Feng); Methodology, X.-Y.M., X.L., J.J. and X.-G.Y.; Project administration, X.-G.Y.; Resources, X.L., J.S., X.F. (Xingcun Fan), Z.C. and X.F. (Xiaolong Feng); Software, X.-Y.M.; Supervision, X.-G.Y.; Validation, X.-Y.M. and M.-R.K.; Visualization, X.-Y.M.; Writing—original draft, X.-Y.M. and M.-R.K.; Writing—review and editing, X.L., J.J. and X.-G.Y. All authors have read and agreed to the published version of the manuscript.

Funding

Financial support from the National Natural Science Foundation of China (No. 52277212), the Guangdong Basic and Applied Basic Research Foundation (No. 2025A1515010387), and the Shenzhen Science and Technology Program (No. JCYJ20230807153607017) are greatly acknowledged.

Data Availability Statement

The data that support the plots within this paper and other findings of this study are available from the corresponding author on reasonable request.

Conflicts of Interest

Author Xue Li, Jintao Shi, Xingcun Fan, Zifeng Cong and Xiaolong Feng were employed by the company China Automotive New Energy Technology Co., Ltd. The remaining authors declare that the research was conducted in the absence of any commercial or financial relationships that could be construed as a potential conflict of interest.

References

  1. Ren, Y.; Xiang, L.; Yin, X.; Xiao, R.; Zuo, P.; Gao, Y.; Yin, G.; Du, C. Ultrathin Si Nanosheets Dispersed in Graphene Matrix Enable Stable Interface and High Rate Capability of Anode for Lithium-ion Batteries. Adv. Funct. Mater. 2022, 32, 2110046. [Google Scholar] [CrossRef]
  2. Sun, K.; Li, X.; Fu, K.; Zhang, Z.; Wang, A.; He, X.; Gong, L.; Tan, P. Li+ Crosstalk-Driven Calendar Aging in Si/C Composite Anodes. EES Batter. 2025, 1, 250–259. [Google Scholar] [CrossRef]
  3. Zhang, Y.; Li, X.; Sivonxay, E.; Wen, J.; Persson, K.A.; Vaughey, J.T.; Key, B.; Dogan, F. Silicon Anodes with Improved Calendar Life Enabled By Multivalent Additives. Adv. Energy Mater. 2021, 11, 2101820. [Google Scholar] [CrossRef]
  4. Shang, Y.; Li, H.; Ma, T.; Yang, Y.; Jiang, Y.; Yu, W. Suppression Strategies for Si Anode Volume Expansion in Li-Ion Batteries Based on Structure Design and Modification: A Review. ACS Appl. Mater. Interfaces 2025, 17, 31730–31753. [Google Scholar] [CrossRef]
  5. Wu, S.; He, L.; Lu, Y.; Zheng, J.; Li, L.; Geng, X.; Sun, C.; Zhao, H.; Jiang, G.; Di, F.; et al. Volumetric Stress Managements on Silicon Anode of Lithium-Ion Batteries by a Self-Adaptable Binder. Energy Environ. Mater. 2025, 8, e12859. [Google Scholar] [CrossRef]
  6. Seo, J.-Y.; Kim, S.; Kim, J.-H.; Lee, Y.-H.; Shin, J.-Y.; Jeong, S.; Sung, D.-W.; Lee, Y.M.; Lee, S.-Y. Mechanical Shutdown of Battery Separators: Silicon Anode Failure. Nat. Commun. 2024, 15, 10134. [Google Scholar] [CrossRef] [PubMed]
  7. Hapuarachchi, S.N.S.; Jones, M.W.M.; Wasalathilake, K.C.; Marriam, I.; Nerkar, J.Y.; Kirby, N.; Siriwardena, D.P.; Fernando, J.F.; Golberg, D.V.; O’MUllane, A.P.; et al. Operando Investigation of Silicon Anodes During Electrochemical Cycling in Li-ion Batteries. Small Methods 2024, 8, 2301199. [Google Scholar] [CrossRef]
  8. Matsumoto, M.; Sakka, Y.; Zhong, C.; Shimoda, K.; Okazaki, K.-I.; Yamashige, H.; Ozeki, T.; Matsui, T.; Takeuchi, A.; Uesugi, M.; et al. Operando Micro- and Nano-Computed Tomography Reveals Silicon–Electrolyte Interface Dynamics and Anisotropic Contact Loss in All-Solid-State Batteries. ACS Nano 2025, 19, 36527–36535. [Google Scholar] [CrossRef]
  9. Song, Y.; Cho, S.; Kim, S.; Shin, Y.; Na, I.; Lim, J.; Lee, Y.M.; Park, S. Comprehensive Si Anode Design for Sulfide-Based all-Solid-State Batteries: Insights into Si-Electrolyte Synergy for Mitigating Contact Loss. Adv. Funct. Mater. 2025, 35, 2504739. [Google Scholar] [CrossRef]
  10. Nam, J.; Lee, H.; Chae, O.B. Overcoming Challenges in Silicon Anodes: The Role of Electrolyte Additives and Solid-State Electrolytes. Micromachines 2025, 16, 800. [Google Scholar] [CrossRef] [PubMed]
  11. Guo, K.; Kumar, R.; Xiao, X.; Sheldon, B.W.; Gao, H. Failure Progression in the Solid Electrolyte Interphase (SEI) on Silicon Electrodes. Nano Energy 2020, 68, 104257. [Google Scholar] [CrossRef]
  12. von Kolzenberg, L.G.; Latz, A.; Horstmann, B. Chemo-Mechanical Model of SEI Growth on Silicon Electrode Particles. Batter. Supercaps 2022, 5, e202100216. [Google Scholar] [CrossRef]
  13. YaYang, G.; Frisco, S.; Tao, R.; Philip, N.; Bennett, T.H.; Stetson, C.; Zhang, J.-G.; Han, S.-D.; Teeter, G.; Harvey, S.P.; et al. Robust Solid/Electrolyte Interphase (SEI) Formation on Si Anodes Using Glyme-Based Electrolytes. ACS Energy Lett. 2021, 6, 1684–1693. [Google Scholar] [CrossRef]
  14. Qian, G.; Li, Y.; Chen, H.; Xie, L.; Liu, T.; Yang, N.; Song, Y.; Lin, C.; Cheng, J.; Nakashima, N.; et al. Revealing the Aging Process of Solid Electrolyte Interphase on SiOx Anode. Nat. Commun. 2023, 14, 6048. [Google Scholar] [CrossRef]
  15. Yang, Z.; Zhang, H.; Jiang, R.; Cheng, X.; Jing, C.; Luo, J.; Jia, P.; Yang, J. Recent Progress on Boosting Initial Coulombic Efficiency of SiOx-Based Anode Materials for Lithium-Ion Batteries. J. Energy Storage 2025, 135, 118400. [Google Scholar] [CrossRef]
  16. Wu, J.; Dong, Q.; Zhang, Q.; Xu, Y.; Zeng, X.; Yuan, Y.; Lu, J. Fundamental Understanding of the Low Initial Coulombic Efficiency in SiO x Anode for Lithium-Ion Batteries: Mechanisms and Solutions. Adv. Mater. 2024, 36, 2405751. [Google Scholar] [CrossRef]
  17. Xiong, Y.; Xing, H.; Fan, Y.; Wei, Y.; Shang, J.; Chen, Y.; Yan, J. SiOx-Based Graphite Composite Anode and Efficient Binders: Practical Applications in Lithium-Ion Batteries. RSC Adv. 2021, 11, 7801–7807. [Google Scholar] [CrossRef]
  18. Zhang, H.; Qian, Y.; Shi, B.; Zhao, P.; Zhang, H.; Qi, X.; Wang, J.; Lu, S. Unveiling the (de)Lithiation Heterogeneity of SiO/Graphite Composite Anodes in a 150 Ah High-Energy-Density Li-Ion Prismatic Cell. J. Power Sources 2024, 611, 234754. [Google Scholar] [CrossRef]
  19. Seitzinger, C.L.; Sacci, R.L.; Coyle, J.E.; Apblett, C.A.; Hays, K.A.; Armstrong, R.R.; Rogers, A.M.; Armstrong, B.L.; Bennet, T.H.; Neale, N.R.; et al. Intrinsic Chemical Reactivity of Silicon Electrode Materials: Gas Evolution. Chem. Mater. 2020, 32, 3199–3210. [Google Scholar] [CrossRef]
  20. Jin, D.; Kim, J.-M.; Yi, R.; Engelhard, M.; Xu, Y.; Baar, K.; Wang, P.; Wang, C.; Zhang, J.-G. Performance Porous Si Anode Enabled by an Organic-Solvent Assisted Etching Process. J. Power Sources 2025, 649, 237440. [Google Scholar] [CrossRef]
  21. Zhu, X.; Chen, Y.; Chen, H.; Luan, W. The Diffusion Induced Stress and Cracking Behaviour of Primary Particle for Li-Ion Battery Electrode. Int. J. Mech. Sci. 2020, 178, 105608. [Google Scholar] [CrossRef]
  22. Cao, J.; Zhang, Y. Analysis and Investigation of Diffusion-Induced Stress in Lithium-Ion Particle Through Elastic-Viscoplastic Model of Binder. Batteries 2025, 11, 132. [Google Scholar] [CrossRef]
  23. Ai, W.; Kirkaldy, N.; Jiang, Y.; Offer, G.; Wang, H.; Wu, B. A Composite Electrode Model for Lithium-Ion Batteries with Silicon/Graphite Negative Electrodes. J. Power Sources 2022, 527, 231142. [Google Scholar] [CrossRef]
  24. Shao, Z.; Jiang, Y.; Offer, G.; Wang, H. Modeling of the Thermal Behaviors of Silicon/Graphite Composite Electrodes for Lithium-Ion Batteries. Energy Proc. 2022, 26, 2965. [Google Scholar] [CrossRef]
  25. Gao, X.; Li, S.; Xue, J.; Hu, D.; Xu, J. A Mechanistic and Quantitative Understanding of the Interactions between SiO and Graphite Particles. Adv. Energy Mater. 2023, 13, 2202584. [Google Scholar] [CrossRef]
  26. Bonkile, M.P.; Jiang, Y.; Kirkaldy, N.; Sulzer, V.; Timms, R.; Wang, H.; Offer, G.; Wu, B. Coupled Electrochemical-Thermal-Mechanical Stress Modelling in Composite Silicon/Graphite Lithium-Ion Battery Electrodes. J. Energy Storage 2023, 73, 108609. [Google Scholar] [CrossRef]
  27. Bonkile, M.P.; Jiang, Y.; Kirkaldy, N.; Sulzer, V.; Timms, R.; Wang, H.; Offer, G.; Wu, B. Is Silicon Worth It? Modelling Degradation in Composite Silicon–Graphite Lithium-Ion Battery Electrodes. J. Power Sources 2024, 606, 234256. [Google Scholar] [CrossRef]
  28. Yang, X.-G.; Leng, Y.; Zhang, G.; Ge, S.; Wang, C.-Y. Modeling of Lithium Plating Induced Aging of Lithium-Ion Batteries: Transition from Linear to Nonlinear Aging. J. Power Sources 2017, 360, 28–40. [Google Scholar] [CrossRef]
  29. Kupper, C.; Weißhar, B.; Rißmann, S.; Bessler, W.G. End-of-Life Prediction of a Lithium-Ion Battery Cell Based on Mechanistic Aging Models of the Graphite Electrode. J. Electrochem. Soc. 2018, 165, A3468–A3480. [Google Scholar] [CrossRef]
  30. O’Kane, S.E.J.; Ai, W.; Madabattula, G.; Alonso-Alvarez, D.; Timms, R.; Sulzer, V.; Edge, J.S.; Wu, B.; Offer, G.J.; Marinescu, M. Lithium-Ion Battery Degradation: How to Model It. Phys. Chem. Chem. Phys. 2022, 24, 7909–7922. [Google Scholar] [CrossRef]
  31. Reniers, J.M.; Mulder, G.; Howey, D.A. Review and Performance Comparison of Mechanical-Chemical Degradation Models for Lithium-Ion Batteries. J. Electrochem. Soc. 2019, 166, A3189–A3200. [Google Scholar] [CrossRef]
  32. Ihuaenyi, R.C.; Fang, R.; Ashok, A.S.; Condon, A.; Jiao, J.; Attia, P.M.; Li, W.; Zhu, J. Lifetime extension of aged Li-ion prismatic batteries via mechanical constraints. Cell Rep. Phys. Sci. 2025, 6, 102685. [Google Scholar] [CrossRef]
Figure 1. Schematic of the degradation mechanisms included in the aging model.
Batteries 12 00030 g001
Figure 2. Simulated vs. experimental results and contributions of different aging mechanisms to capacity loss under various cycling conditions. (a) Voltage profiles at various discharge rates as a function of DoD at room temperature. (b) Voltage profiles at different charge rates as a function of SoC at room temperature. (c) Voltage profiles during 0.3C discharge at different temperatures. (d) Capacity retention versus cycle number under multi-factor aging conditions, including temperature, C-rate, and preload. (e) Contributions of different aging mechanisms to capacity loss under various cycling conditions.
Batteries 12 00030 g002
Figure 3. Effects of gas evolution on cell performance under different preloads. (a) Evolution of capacity retention and gas volume as a function of cycle number. (b) Loss of active material in the anode and the corresponding change in specific surface area versus cycle number. Distribution of (c) local areal current density and (d) local volumetric current density across the anode thickness at the end of discharge for the 100th and 600th cycles.
Batteries 12 00030 g003
Figure 4. Influence of gas generation on SEI growth by comparing models with and without gas-generation effects. (a) SEI reaction overpotential (when the overpotential is less than 0, it indicates that the reaction occurs.) and (b) SEI reaction current density as a function of DoD near the separator-side anode at both BOL and EOL. Evolution of (c) SEI thickness and (d) capacity loss due to SEI growth as a function of cycle number.
Batteries 12 00030 g004
Figure 6. Lithium concentration (normalized) and stress distributions within anode particles under different discharge rates. (ac) Normalized lithium concentration distributions along the particle radius at discharge rates of 1 C, 2 C, and 3 C, respectively. (d) Tangential and (e) radial stress distributions along the particle radius under different discharge rates.
Batteries 12 00030 g006
Figure 7. Mechanical evolution of anode particles and related degradation mechanisms during aging. (a) Maximum tangential stress and crack length as functions of cycle number during cycling. (b) Average SEI thickness on crack surfaces and corresponding capacity loss due to SEI growth on cracks as functions of cycle number. (c) Distribution of maximum hydrostatic stress along the particle radius during discharge at the end of life. (d) Active material loss in the anode due to particle fracture as a function of cycle number.
Batteries 12 00030 g007
Table 1. Cell design information and model parameters.
Cell Design Information
ParameterUnitCathodeSeparatorAnode
Thickness (L)um741380
Size (A)mm57 × 74/60 × 77
Areal Loadingmg/cm224/11.59
Electrolyte concentration (Ce)mol/L/1.0/
Electrochemical model parameters
ParameterUnitCathodeSeparatorAnode (Graphite)Anode
(SiOx)
Particle radius (R)um6/63
Active material fraction (εs)/0.68/0.570.03
Porosity (ε)/0.280.430.33
Bruggeman’s coefficient (b)/2.15 ad2.6 ad2.5 ad
Maximum concentration (Cs,max)mol/m348,158/30,944181,500
Stoichiometric coefficients (0% SOC)/0.88/0.010.13
Stoichiometric coefficients (100% SOC)/0.26/0.850.803
Lumped thermal model parameters
ParameterUnitCell
Mass (m) g43.5
Specific heat capacity (Cp)J · kg−1 K−11126
Heat transfer coefficient (h) W · m−2 K−121
SEI growth model parameters
ParameterUnitAnode (Graphite)Anode (SiOx)
Molar mass of the SEI (MSEI)Kg/mol0.162 [28]0.162 [28]
Density of the SEI (ρSEI)Kg/m31690 [28]1690 [28]
Reaction rate constant of the SEI (kSEI)m/s1 × 10−16 ad1 × 10−15 ad
Diffusion coefficient of EC (DEC)m2/s2 × 10−19 ad1 × 10−18 ad
Gas generation model parameters
ParameterUnitCell
proportionality coefficient (kgap)/0.1 ad
SEI growth on cracks and particle fracture model parameters [27]
ParameterUnitCathodeAnode
(Graphite)
Anode
(SiOx)
Young’s modulus (E)Pa3.75 × 10111.5 × 10105 × 1010
Poisson’s ratio (ν)/0.20.30.22
Partial molar volume (Ω)m3/mol1.25 × 10−63.1 × 10−61.2 × 10−5
Initial crack length (lcr,0)m2 × 10−82 × 10−82 × 10−8
Stress intensity factor (bcr)/1.121.121.12
Pari’s law cracking rate (kcr)/3.9 × 10−203.9 × 10−203.9 × 10⁻²⁰
Pari’s law exponential term (mcr)/2.22.22.2
Critical stress for particle fracture (σc)Pa3.75 × 1086 × 1077.2 × 108
ad Adjusted.
Disclaimer/Publisher’s Note: The statements, opinions and data contained in all publications are solely those of the individual author(s) and contributor(s) and not of MDPI and/or the editor(s). MDPI and/or the editor(s) disclaim responsibility for any injury to people or property resulting from any ideas, methods, instructions or products referred to in the content.