Article

A Circuital Equivalent for Supercapacitors Accurate Simulation in Power Electronics Systems

by
Catalina Rus-Casas
1,*,
Carlos Andrés Ramos-Paja
2,
Sergio Ignacio Serna-Garcés
3,
Carlos Gilabert-Torres
1 and
Juan Domingo Aguilar-Peña
1
1
Electronic Engineering and Automatic Department, University of Jaén, Las Lagunillas Campus, A3 Building, 23071 Jaén, Spain
2
Facultad de Minas, Universidad Nacional de Colombia, Medellín 050041, Colombia
3
Departamento de Electrónica y Telecomunicaciones, Instituto Tecnológico Metropolitano, Medellín 050013, Colombia
*
Author to whom correspondence should be addressed.
Batteries 2025, 11(8), 307; https://doi.org/10.3390/batteries11080307
Submission received: 1 July 2025 / Revised: 31 July 2025 / Accepted: 7 August 2025 / Published: 9 August 2025

Abstract

The effective integration of energy storage systems is paramount for the widespread deployment of renewable energy technologies. Selection of a specific storage system is typically dictated by the primary challenge it aims to mitigate, such as intermittency, grid stability, or power quality. The optimization of overall system efficiency and longevity is increasingly achieved through hybrid storage systems that integrate supercapacitors into their designs. This research introduces a novel circuital equivalent for a commercial supercapacitor, optimized for precise simulations within the frequency range of power electronics applications. A key distinction of this circuital equivalent lies in its rigorous foundation: its comprehensive characterization across a broad frequency spectrum, specifically from 0.01 Hz to 300 kHz, employing a commercial frequency response analyzer. This precise circuital representation offers substantial utility in simulation, analysis, and design of high-frequency circuits, particularly for switched-power converter design and control. It enables the anticipation of undesirable phenomena, such as significant voltage ripple and operational instability. This predictive capability is crucial for experimental preparation, facilitating the proactive integration of necessary filters and protective measures within sensing circuits, thereby underscoring its value prior to physical implementation. In addition, the developed circuital equivalent exhibits broad compatibility, allowing seamless implementation within commercial circuit simulators. Finally, the proposed methodology was illustrated with a commercial supercapacitor, but it can be applied to other supercapacitor types or manufacturers.

1. Introduction

In the current context of energy transition and decarbonization of the electricity matrix, systems based on renewable energy sources, such as solar photovoltaic and wind power, have acquired unprecedented prominence [1,2]. However, these sources’ intermittent and non-dispatchable nature imposes significant challenges regarding stability, reliability, and quality of electricity supply [3,4,5,6]. In this scenario, energy and power storage are essential to ensure modern power systems’ efficient and safe operation. Its importance lies in its ability to store surplus energy for later use and its responsiveness to load and generation variations, thus stabilizing the grid over multiple time scales [7,8].
Several storage technologies have been developed and successfully applied, including electrochemical batteries, thermal storage systems, flywheels, compressed air systems, and supercapacitors (SCs) [9,10,11,12].
SCs are electrochemical energy storage devices that lie between traditional dielectric capacitors and batteries in terms of energy and power density. This technology bridges the gap between the two extremes. On one side are traditional capacitors that offer high power density (fast energy delivery and absorption) but very low energy density (low energy storage). On the other side are batteries that provide high energy density (store a lot of energy) but low power density (slower response) [13,14,15].
SCs combine the best of both worlds: these devices have a very high power density comparable to, or higher than, traditional capacitors and a significantly higher energy density than conventional capacitors, but still lower than batteries. These characteristics have proven to be highly effective solutions for applications that require fast charge and discharge cycles, high efficiency, and long life, such as regenerative braking systems, power backup, voltage stabilization, and hybrid storage systems [16,17,18,19]. Table 1 shows the main characteristics of SCs, lithium-ion batteries, and traditional dielectric capacitors. Table 2 presents examples of commercial devices, including both their energy density (ED) and power density (PD). Similarly, Figure 1 shows the Ragone diagram of elements of Table 2, which puts into evidence the intermediate role played by SCs concerning the other technologies in terms of energy density and power.
Although traditional capacitors provide higher power densities than SCs, a higher number of life cycles, and shorter charge/discharge times, they are practically useless as energy storage devices. Compared to SCs, traditional capacitors can operate at much higher frequencies, withstand much higher voltages, lose minimal charge over time, maintain stability over wider temperature ranges, and are compact and cost-effective. Therefore, traditional capacitors are unsurpassed by SCs in high-frequency and high-voltage electronics and applications requiring precision and long-term stability. SCs, on the other hand, excel in rapid and repetitive energy storage.

1.1. The Need for SC Equivalent Circuits

In recent years, hybrid storage systems, which combine different technologies to exploit their strengths and mitigate their limitations, have gained particular prominence. In this context, the role of SCs is particularly superior when integrated with batteries or fuel cells, acting as a dynamic buffer that smoothes load transitions and protects the most sensitive devices from current spikes [43,44,45,46,47,48]. This synergy allows for optimizing both energy efficiency and the overall durability of the system. However, for effective integration and optimal energy management, it is essential to have accurate and adequate representations of SCs’ dynamic behavior.
In this regard, it is crucial to recognize that modeling requirements vary significantly by application. Simplified models that capture the overall device behavior can be employed for power management strategies where slow dynamics are predominant. In contrast, more detailed representations are required to design and control switched-mode converters, where fast dynamics and high frequencies are important. In the latter case, of particular relevance is the unwanted inductive effect of SCs, a feature that, although often ignored in low-frequency models, can significantly impact the system stability and performance when operating at high frequencies. This phenomenon must be carefully considered to avoid resonances, over oscillations, and other adverse effects on the power electronics system.
Accurate modeling of SCs is, therefore, a critical need in developing advanced energy storage systems. First, adequate models allow correct device sizing based on the application’s specific requirements. The above makes modeling essential to avoid oversizing, which unnecessarily increases costs and system volume, and undersizing, which can compromise performance and operational safety.
In addition, accurate representations are essential at the system simulation stage. Before physically implementing a system integrating with SCs, it is necessary to be able to predict its behavior in different operating scenarios. Reliable simulation allows evaluation of energy performance, dynamic response, and interaction with other system components, significantly reducing development costs and the time required for experimental validation.
Detailed modeling of SCs is equally crucial in the control design field. Power converters that manage SCs’ charging and discharging require control algorithms capable of adapting to their dynamic and nonlinear behavior. An inadequate model can lead to inefficient or unstable control strategies, negatively affecting power transfer and overall system stability. In contrast, a well-calibrated model allows the development of robust controllers that optimize energy flow, improve overall efficiency, and extend device lifetime.
Additionally, from the perspective of stability analysis, accurate models are indispensable to evaluate how SCs affect the dynamics of the converters and the microgrid in which they are integrated. Since the behavior of SCs is highly frequency dependent, especially in the high-frequency range where unwanted inductive effects emerge, it is necessary to incorporate these phenomena into the models to ensure a faithful representation of the system. Ignoring these dynamics can lead to erroneous conclusions about system stability and potentially serious consequences in critical applications such as smart grids, electric transportation, or aerospace systems.
Therefore, although SCs offer enormous potential as an energy storage technology, their effective integration into real systems depends largely on the quality of the models used to represent them. These models must capture not only their static behavior but also their complex time- and frequency-dependent dynamics, which is a significant technical challenge necessary for modern energy systems’ design, simulation, control, and analysis.

1.2. Motivation and Literature Review

In this work, the motivation arises from the experimental analysis of the frequency response of a commercial SC, where the Bode impedance diagram reveals three distinctive regions: a capacitive behavior at low frequencies; a resistive response at medium frequencies; and an inductive effect at high frequencies. These observations indicate that the traditional equivalent circuit, based solely on a series R-C connection, cannot capture all the device dynamics.
Although the SC behaves predominantly as a capacitive element, it also exhibits inductive effects, which are mainly due to the geometry and dimensions of its plates, as well as its connection terminals [49,50]. However, the inductance introduced by the connection leads of frequency response analyzers during the measurement is considered negligible due to the configuration used for the tests, since those devices are designed to extract frequency responses up to 20 MHz in the case of the Venable 6320 used in this work. In particular, commercial frequency response analyzers use a four-terminal arrangement, with separate wire pairs for current injection and voltage measurement [51]. This technique minimizes the influence of the impedance of the current leads since the voltage is measured directly at the SC terminals.
The main objective of this work is to develop a more accurate equivalent circuit incorporating the R-L-C elements and their possible variants, allowing an adequate reproduction of the SC behavior over the frequency range important for analysis and simulation of switched power converters. Since SCs are often interfaced with those switched converters, this equivalent circuit will facilitate the design of more efficient power systems, improve the simulation of transient behavior, and optimize the integration of SCs in real applications. This research seeks to close the gap between experimental data and theoretical representations, providing a valuable tool for the scientific community and industry.
During the literature review, multiple equivalent circuits proposed to represent the behavior of SCs were identified. Those models vary in complexity, ranging from simple representations with few passive elements to more elaborate configurations incorporating multiple R-C branches, nonlinear elements, or voltage and temperature dependencies. The selection of some of these models is supported by solid theoretical justifications and detailed experimental validations, which gives them greater credibility and applicability in specific contexts, such as simulations of energy storage systems or transient response analysis in switched-mode converters. Other models do not provide a clear selection criteria or empirical validation, which limits their practical usefulness and makes it difficult to compare with other proposals.
The diversity of approaches reflects both the evolution of knowledge in the area and the need to adapt models to different applications, time scales, and required levels of accuracy. In this context, Table 3 summarizes some of the most representative equivalent circuits found in the review, highlighting their main characteristics, such as the number of elements, the presence of nonlinear components, the ability to model load absorption phenomena, or the implementation complexity in simulation environments. This compilation allows for visualization of the predominant trends in SC modeling and serves as a starting point to select or develop a suitable equivalent circuit according to this study’s objectives.
The simple R-C (Resistance–Capacitance) equivalent circuit, often called the first-order model, represents the most fundamental approach to describing the electrical behavior of an SC. Although simplified, it is the conceptual basis on which more complex representations are built and is often the starting point for initial analyses and demonstrations of operating principles. ESR represents the sum of all ohmic resistances within the SC. This includes the resistance of the electrodes, electrolytes, current collectors, and connections. ESR is primarily responsible for instantaneous power losses and voltage drops during charging and discharging. C represents the energy storage capacity of the SC. Unlike an ideal dielectric capacitor, the capacitance of a SC arises from charge accumulation at the electrode–electrolyte interface (electrical double layer) and, in some cases, from surface faradaic reactions (pseudocapacitance). In this simple model, it is assumed to be a constant and ideal value. Generally, the ESR and C components are configured in series. This arrangement reflects that current must flow through an inherent resistance before charging or discharging the main capacitive element. This model assumes that ESR and capacitance are constant and independent of the operating frequency, temperature, state of charge (SoC), or current. This idealization greatly simplifies the mathematical analysis. This model can simulate the SC’s fundamental transient response, such as the initial voltage drop due to ESR when an abrupt charge or discharge is applied and the subsequent slower voltage variation as the capacitive element is charged or discharged [53,54,55,57,58,59].
Due to its characteristics, the R-C model is the simplest to implement mathematically and computationally. Its differential equations are of the first order and are easy to solve. It requires a minimum number of parameters (only two: ESR and C), which simplifies its experimental identification. It is very fast to simulate, which makes it useful for large-scale system simulations where the fine details of each SC are not critical or fast performance estimations are not needed. Moreover, this representation is suitable for embedded control hardware with limited resources, where low-complexity models are required. It helps estimate overall SC efficiency (ESR energy losses) in slow cycles or for initial system sizing, where high-frequency dynamics or diffusion effects are not predominant. Its structure corresponds to basic concepts of electrical circuits, which facilitates understanding the fundamental principles of operation of a supercapacitor. It is ideal for pedagogical purposes and to introduce the idea of SC modeling.
Regarding the equivalent circuit’s accuracy, in a real SC, the capacitance and resistance can vary with the frequency. The simple R-C model assumes constant values, which leads to large inaccuracies in applications with fast dynamics (e.g., switched converters) or where it is required to analyze the behavior over a broad frequency spectrum. Also, SCs exhibit ion diffusion phenomena within the porous structure of the electrodes, especially at low frequencies. The simple R-C model cannot capture these “delay” or “relaxation” dynamics. Finally, the parameters of a real SC (ESR, C) can vary with the state of charge, operating temperature, and current magnitude, which the simple R-C model ignores.
For stability and control analysis, the lack of accuracy in frequency response makes this model unreliable for the design and validation of power converter control algorithms, where the interaction of impedances at different frequencies is critical to the stability of the control loop. Furthermore, SC terminal voltage predictions are inaccurate in fast transients or under complex load patterns.
In conclusion, the simple R-C model of the supercapacitor provides a comprehensive and computationally efficient foundation, but its inherent simplicity severely limits its ability to capture the complex frequency-dependent phenomenology and diffusion effects crucial for accurate analysis, design, and simulation in demanding power electronics applications. Its value lies primarily in its utility for preliminary analysis and its role as a stepping stone to more complex and accurate circuital equivalents. Despite the above, the most widely used model for SC in power electronics applications is undoubtedly the simple R-C model, and some authors try to fit it to experimental data [49].
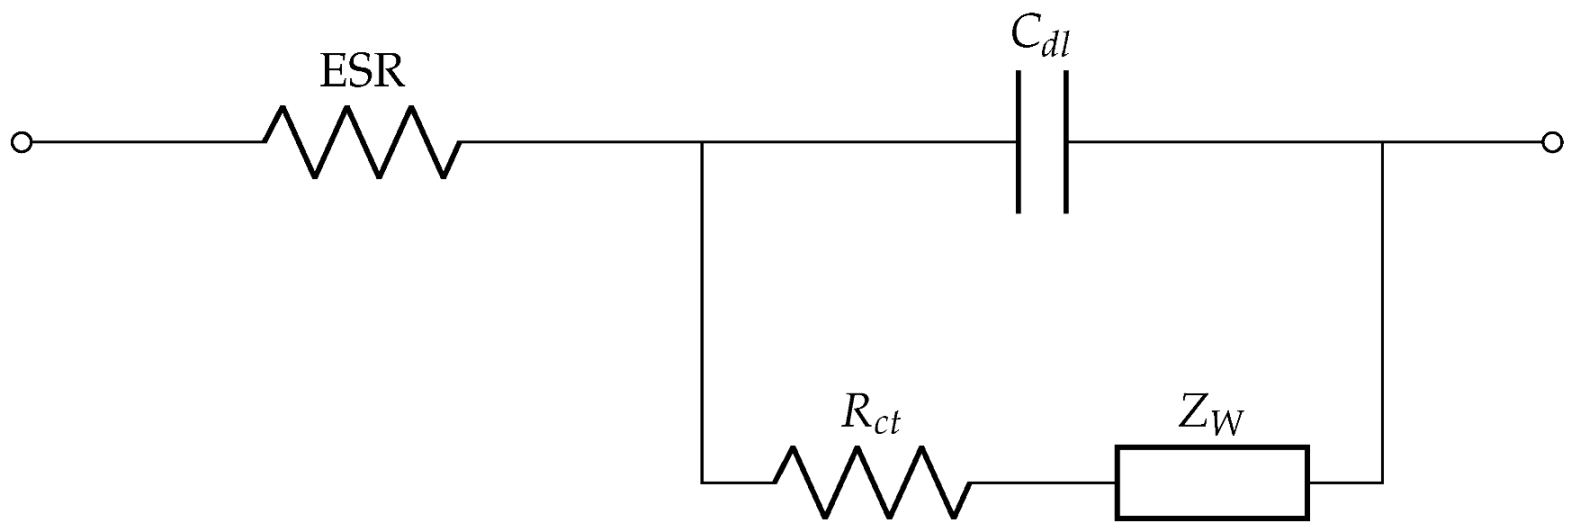
Unlike the simple R-C model for SC, the Randles model is fundamental in electrochemistry, especially for Electrochemical Impedance Spectroscopy (EIS). This model typically consists of a series resistor, similar to the ESR of the simple R-C model, representing the ohmic resistance of the electrolyte and contacts (ESR); a double-layer capacitance element ( C d l ), often represented by a constant phase element to model the non-ideal capacitance and its dispersion with frequency; a charge transfer resistance ( R c t ), representing the resistance to charge transfer at the electrode–electrolyte interface (related to faradaic or pseudocapacitive processes if present); and a Warburg element ( Z W ) modeling ion diffusion phenomena within the porous structure or through the electrolyte, especially relevant at low frequencies (f), since its behavior is proportional to 1 f [60,61,62,63].
This model can more accurately reproduce the frequency response of the SC and capture capacitive dispersion and diffusion effects, which makes it more accurate for modeling the real behavior of an SC. Because its Warburg element is mainly used in electrochemical impedance spectroscopy, it offers a better understanding of the underlying physicochemical phenomena, and it provides better results in frequency-domain simulations. Its main disadvantages are its higher complexity, higher computational cost, difficulty in parameter determination, and non-dependence on SoC and temperature.
The Ladder R-C model is based on the representation of the supercapacitor as a distributed structure of resistors and capacitances, which more accurately reflects the porous geometry and distributed nature of charge storage and ionic transport within the electrodes. Instead of lumped components, the Ladder R-C model consists of multiple identical or variable R-C cells connected in series, forming a “ladder”. Each cell typically includes a series resistance (representing the electrolyte resistance within a pore segment) and a parallel capacitance (representing the double-layer capacitance within that segment). This model seeks to simulate the physical phenomenon of gradual penetration of ions into the porous structure of electrodes. As the current frequency decreases, the ions have more time to diffuse into deeper pores, increasing the effective capacitance and distributed resistive losses. By distributing the resistance and capacitance, the Ladder R-C model can reproduce with high accuracy the behavior of the complex impedance of the supercapacitor over a wide frequency range. In addition, the reproduction of the supercapacitor behavior in fast and slow transients is better than in previous models, which is crucial for power converter design and stability analysis.
The accuracy of the Ladder R-C model increases with the number of cells in the ladder. More cells allow a better approximation of the distributed behavior but increase the complexity as sophisticated algorithms are needed to identify the multiple model parameters from EIS data. Finally, the parameters of each cell do not always have a direct and unique correlation with specific physicochemical properties at the microscopic level, unlike some elements of the Randles model.
A variant of the R-C ladder is presented in [64,65], where the SC is divided into three sections: access resistor, transmission line (n branches), and two complementary branches. It is based on experimental data, but the determination of the multiple parameters is quite intricate. There is only validation against experimental data, and no analysis is performed for a switched environment.
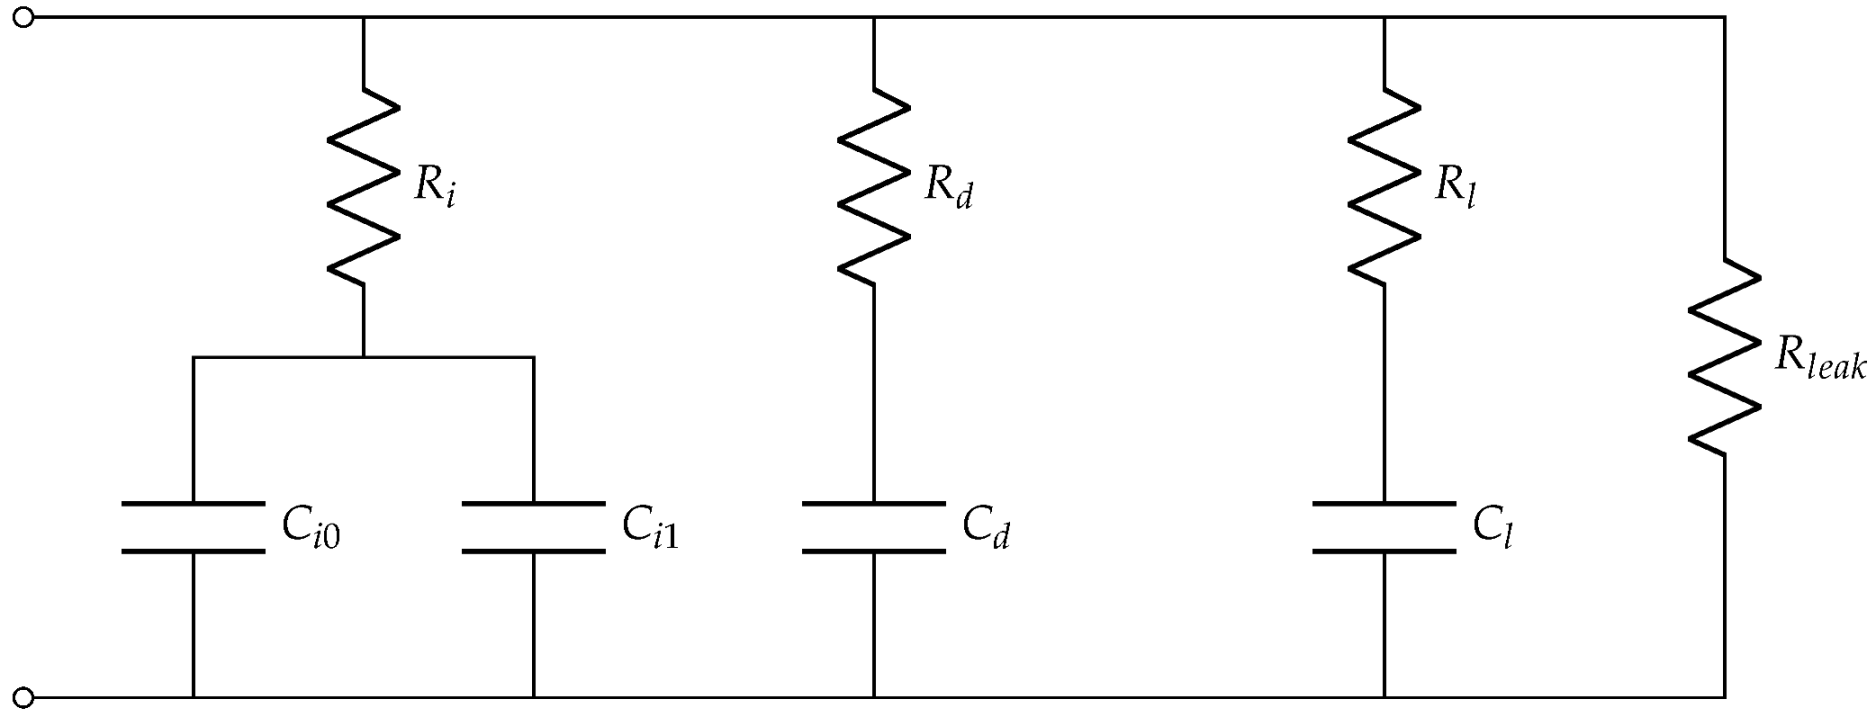
The Zubieta Model is a particular supercapacitor equivalent circuit proposal that stands out for its ability to model a crucial phenomenon: the internal charge redistribution that occurs in supercapacitors after a current pulse or during quiescent periods. This model significantly differentiates it from the simple R-C and Randles models and places it in a category more comparable to the Ladder R-C model in terms of complexity and fidelity, albeit with a different conceptual approach.
Unlike the series–cell structure of the Ladder R-C model, the Zubieta model consists of several parallel R-C branches, where each branch is designed to have significantly different time constants ( τ = R · C ). The model proposes three branches for reasonable accuracy for up to 30 min. The first branch, the immediate branch, dominates the SC behavior on the order of seconds using a voltage-dependent capacitance, representing the interaction between the SC capacitance and the low resistance of the electrolyte. The second branch, or delayed branch, deals with the SC behavior in the order of minutes and, finally, the long-time branch determines the SC behavior beyond 10 min. These last branches model the diffusion and charge/discharge processes of the deeper regions that are slower. Self-discharge is modeled using the R l e a k resistor.
A distinctive feature of the Zubieta model is its ability to represent internal charge redistribution by multiple time constants. When the external current ceases, the charge stored in the fast-response branches is gradually transferred to the slower-response branches, resulting in a slow recovery or drop in voltage at the supercapacitor terminals. This phenomenon representation ensures voltage accuracy and reliable operation in dynamic cycling applications.
The charge redistribution, a phenomenon crucial for long-term operation, can also be captured by the Ladder model due to its distributed nature, while the Zubieta model does so through a lumped component structure with different time constants, which can be more straightforward for analyzing specific transient responses. In contrast, the simple R-C representation is too simplistic, and Randles, while excellent for EIS and diffusion phenomena, was not primarily designed for the post-pulse charge redistribution dynamics that Zubieta sought to model. Some of its disadvantages are its higher complexity in comparison with the simple R-C and Randles models; moreover, it does not capture all of the very high-frequency dynamics [61,66].
In [67], the Zubieta model is used to design, in an integrated way, a photovoltaic system with storage using SC; the idea presented is only the interaction between one source, the photovoltaic panel, and the equivalent circuit of the SC, but without power electronics devices such as the converter. Simplified versions of Zubieta’s model are presented in [57,68], in which the SC is modeled no longer with three branches but with two, which sacrifices the accuracy of the diffusion process but reduces the number of necessary parameters to be calculated. There is no validation of its operation with a switched converter.
The Transmission Line Model (TLM) for supercapacitors is one of the most advanced and physically intuitive equivalent circuit representations. Unlike simplified models, the TLM attempts to capture the distributed nature of resistance and capacitance within the porous structure of the supercapacitor electrode. It is an evolution of the Ladder R-C model. It represents, using parameters per one of length or volume, the resistance of the electrolyte inside the pores and the double-layer capacitance formed on the walls of those same pores. In this way, it results in a complex impedance that faithfully reflects the frequency behavior of the SC. The TLM accurately predicts the impedance of the supercapacitor over a broad frequency spectrum, although there are different variants of the model.
Its advantages lie in the high fidelity of the model, the excellent representation of the impedance as a function of frequency, and superior performance in the simulation of the SC response under highly dynamic conditions. And, of course, the complexity, high computational cost, and difficulty in obtaining the parameters are its main disadvantages [54,61].
A variant to the previous equivalent circuits is presented in [69], where the experimental data of an SC in the frequency domain are validated. That equivalent circuit is quite complex, and it includes two inductive elements that are not considered in most of the reviewed models. All the equivalent circuit parameters are voltage-dependent, but as in the other works, the model’s behavior is not validated during the operation of a switched converter. On the other hand, a series R-L-Zp model is evaluated in [49,70], where Zp is an approximation to the experimental data of N R-C-type circuits. The work focuses on determining the parameters that best fit the frequency response data without validating it in a switched circuit.
The previous analysis of the literature shows that most works focus on techniques and methodologies to determine the parameters of equivalent circuits using experimental data in the frequency and time domains. These models, which include simple R-C, multi-branch R-C, or fractional order models, are validated using optimization or least squares algorithms on commercial SCs.
However, a significant limitation is observed: there is no evidence of the use of these models beyond the basic R-C [52,56], or the R-C circuit with voltage-dependent capacitance [71], in practical applications of electrical power conversion using high-frequency switched converters. Although advanced models offer higher accuracy in the dynamic characterization of SCs, their implementation in circuital simulators for designs of energy storage systems with DC–DC converters or inverters is scarce. This SC–Converter integration suggests a gap between the theoretical development of models and their actual application in power electronics, where high-frequency effects require more sophisticated approaches.

1.3. Contributions

Developing accurate circuital equivalents for supercapacitors is essential for their efficient integration into energy storage and conversion systems. Despite several proposed representations, many present limitations regarding their ability to faithfully reproduce the dynamic behavior experimentally observed, especially under real operating conditions. The present research proposes an equivalent circuit based on experimental data obtained through a frequency response analyzer to capture the device’s electrical characteristics for a wide frequency range.
The fundamental contribution of this paper lies in the proposal of an equivalent circuit for a commercial supercapacitor designed exclusively for analysis and simulation purposes in power electronics systems. It is crucial to emphasize that this equivalent circuit seeks to accurately replicate the external electrical behavior of the device for a wide frequency range without pretending at any time to represent its intrinsic electrochemical characteristics. Consequently, the parameters comprising this equivalent circuit have been optimized for the fidelity of dynamic response in the electrical domain, thus not providing a direct correspondence or physical interpretation with the internal electrochemical or physicochemical processes within the supercapacitor. The methodology proposed to parameterize the circuital equivalent is applied to a particular commercial supercapacitor used for power electronics applications, but it can be applied to other supercapacitor types or manufacturers.
This article is structured to guide the reader through the development and validation of the SC equivalent circuit. Following this introduction, Section 2 details the experimental methodology, describing the acquisition of SC characterization data in the frequency domain. In that section, the proposed equivalent circuit with R-L-C topology, which explicitly incorporates Warburg elements, is presented. Moreover, the description of these elements, their polynomial approximations with different orders of accuracy, and the synthesis of the Warburg elements as ladder R-C circuits are discussed. Subsequently, Section 3 validates the equivalent circuit by reporting its frequency response and comparing it with the experimental data. Additionally, this section not only validates the model but also illustrates the instability of a system integrating a bidirectional Zeta converter and the SC when the design of a classical voltage PI controller is based on a simplified R-C model of the SC. This comparison highlights the fundamental relevance of the R-L-C model with Warburg elements proposed in this paper, demonstrating its ability to capture the dynamics essential for system stability. Finally, the Conclusions summarize the key findings and implications of this research.

2. Materials and Methods

2.1. Characterization Data of Commercial Supercapcitors in Wide Frequency Range

The supercapacitor BMOD0058-E016-B02 from Maxwell Technologies (San Diego, CA, USA) was selected to illustrate the circuital equivalent methodology since it has been used as an auxiliary storage device in power electronics applications [72], but any other supercapacitor can be adopted. For this supercapacitor, the manufacturers’ datasheet reports a capacitance of 58 F and a parasitic series resistance (ESR) of 22 m Ω at 25 °C, respectively [73]. Moreover, this supercapacitor has a rated voltage of 16 V and an average mass equal to 0.63 kg. Based on those parameters, the usable specific power of the supercapacitor is 2.2 kW/kg, which is calculated as defined in the standard IEC 62391-2 [74]. Finally, the maximum stored energy is 7.4 kJ (2.1 Wh), and the maximum specific energy is 11.8 kJ/kg (3.3 Wh/kg). The manufacturers’ datasheet shows that both the capacitance and ESR have consistent values for positive temperatures; Figure 2 reports such data, where the supercapacitors have temperatures between 0 °C and 65 °C. From the data it is calculated the the average deviation of the capacitance is equal to 0.76%, and the average deviation of the ESR is equal to 0.51%, both relative deviations with respect to the values at 25 °C.
The characterization of the supercapacitor is performed from 0.01 Hz to 300 kHz using the Frequency Response Analyzer (FRA) Venable 6320 from Venable Instruments (Austin, USA), which has a measurement accuracy of ±0.03 dB + 0.1 dB/MHz and ±0.4 deg + 1 deg/MHz [51]. Figure 3 shows the experimental setup for the supercapacitor characterization, where a computer with the Venable software is used to configure the FRA and store the experimental data. The FRA has an oscillator to perturb the device under characterization, which in this case is the supercapacitor C s . An additional resistor must be connected in series with the FRA to enable the current measurement, in this experimental system the current sensing resistor is the HS100-110R-J from Arcol (Bella Vista, AR, USA) with a nominal value of 110 Ω and a tolerance of ± 5 % ; since such a value must be introduced into the Venable software (version 6.5), its real resistance was measured using a multimeter UT-108 from UNI-T (Bellingham, WA, USA) with resolution of 0.1 Ω and ± 1 % accuracy, resulting in 111.9 Ω . The FRA has two sensing channels, the first one (CH1) is connected in parallel with the resistor to measure the current, and the second one (CH2) is connected in parallel with the supercapacitor to measure the voltage. Finally, the experiments were conducted in a power electronics laboratory with a controlled temperature set to 25 °C.
Two BMOD0058-E016-B02 supercapacitors with similar operation time were characterized. Figure 4 reports the experimental frequency response of both BMOD0058-E016-B02 supercapacitors from 0.01 Hz to 300 kHz, where three frequency zones are identified: a low-frequency range (0.01 Hz to 0.1 Hz) describing a capacitive behavior, a medium-frequency range (0.1 Hz to 3 kHz) describing a resistive behavior, and a high-frequency range (3 kHz to 300 kHz) describing an inductive behavior. Since those three behaviors are present in both supercapacitors at similar frequencies, it is expected that other BMOD0058-E016-B02 supercapacitors will also exhibit similar behaviors. Those experiments were conducted with the supercapacitors charged at half of the maximum supported voltage (8 V), which is a condition usually adopted in power electronics applications.
The experimental data of Figure 4 shows that both BMOD0058-E016-B02 supercapacitors have the same capacitive behavior but different magnitudes in both resistive and inductive behaviors. Therefore, the first supercapacitor data is selected to parameterize the circuital equivalent because its parasitic series resistance is close to the data reported by the manufacturer.

2.2. Selection of the Main Components for the Equivalent Circuit

The classical circuital equivalent used in power electronics analyses to represent supercapacitors is formed by a capacitance C and a parasitic series resistance (ESR) R as it is depicted in Figure 5 (blue section). In fact, those parameters are provided by the manufacturer; for the BMOD0058-E016-B02 supercapacitor the reported parameters are 58 F and 22 m Ω, respectively [73].
However, since the experimental frequency response of the BMOD0058-E016-B02 supercapacitors reported in Figure 4 also exhibit an inductive behavior, the model in Figure 5 includes an inductor L (red section) to reproduce the supercapacitor behavior in the high-frequency range. The identification of C is performed by the impedance at low frequency, which results in C = 58.4 F ; the identification of L is performed by the impedance at high frequency resulting in L = 585 nH (first supecapacitor); finally, the resistance is identified in the mid-frequency range as an average value R = 18.5 m Ω (first supecapacitor). Figure 6 shows the frequency response of the R-L-C circuit depicted in a Bode diagram, which reports an acceptable agreement with the experimental data of the first supercapacitor used to parameterize the R-L-C circuit.
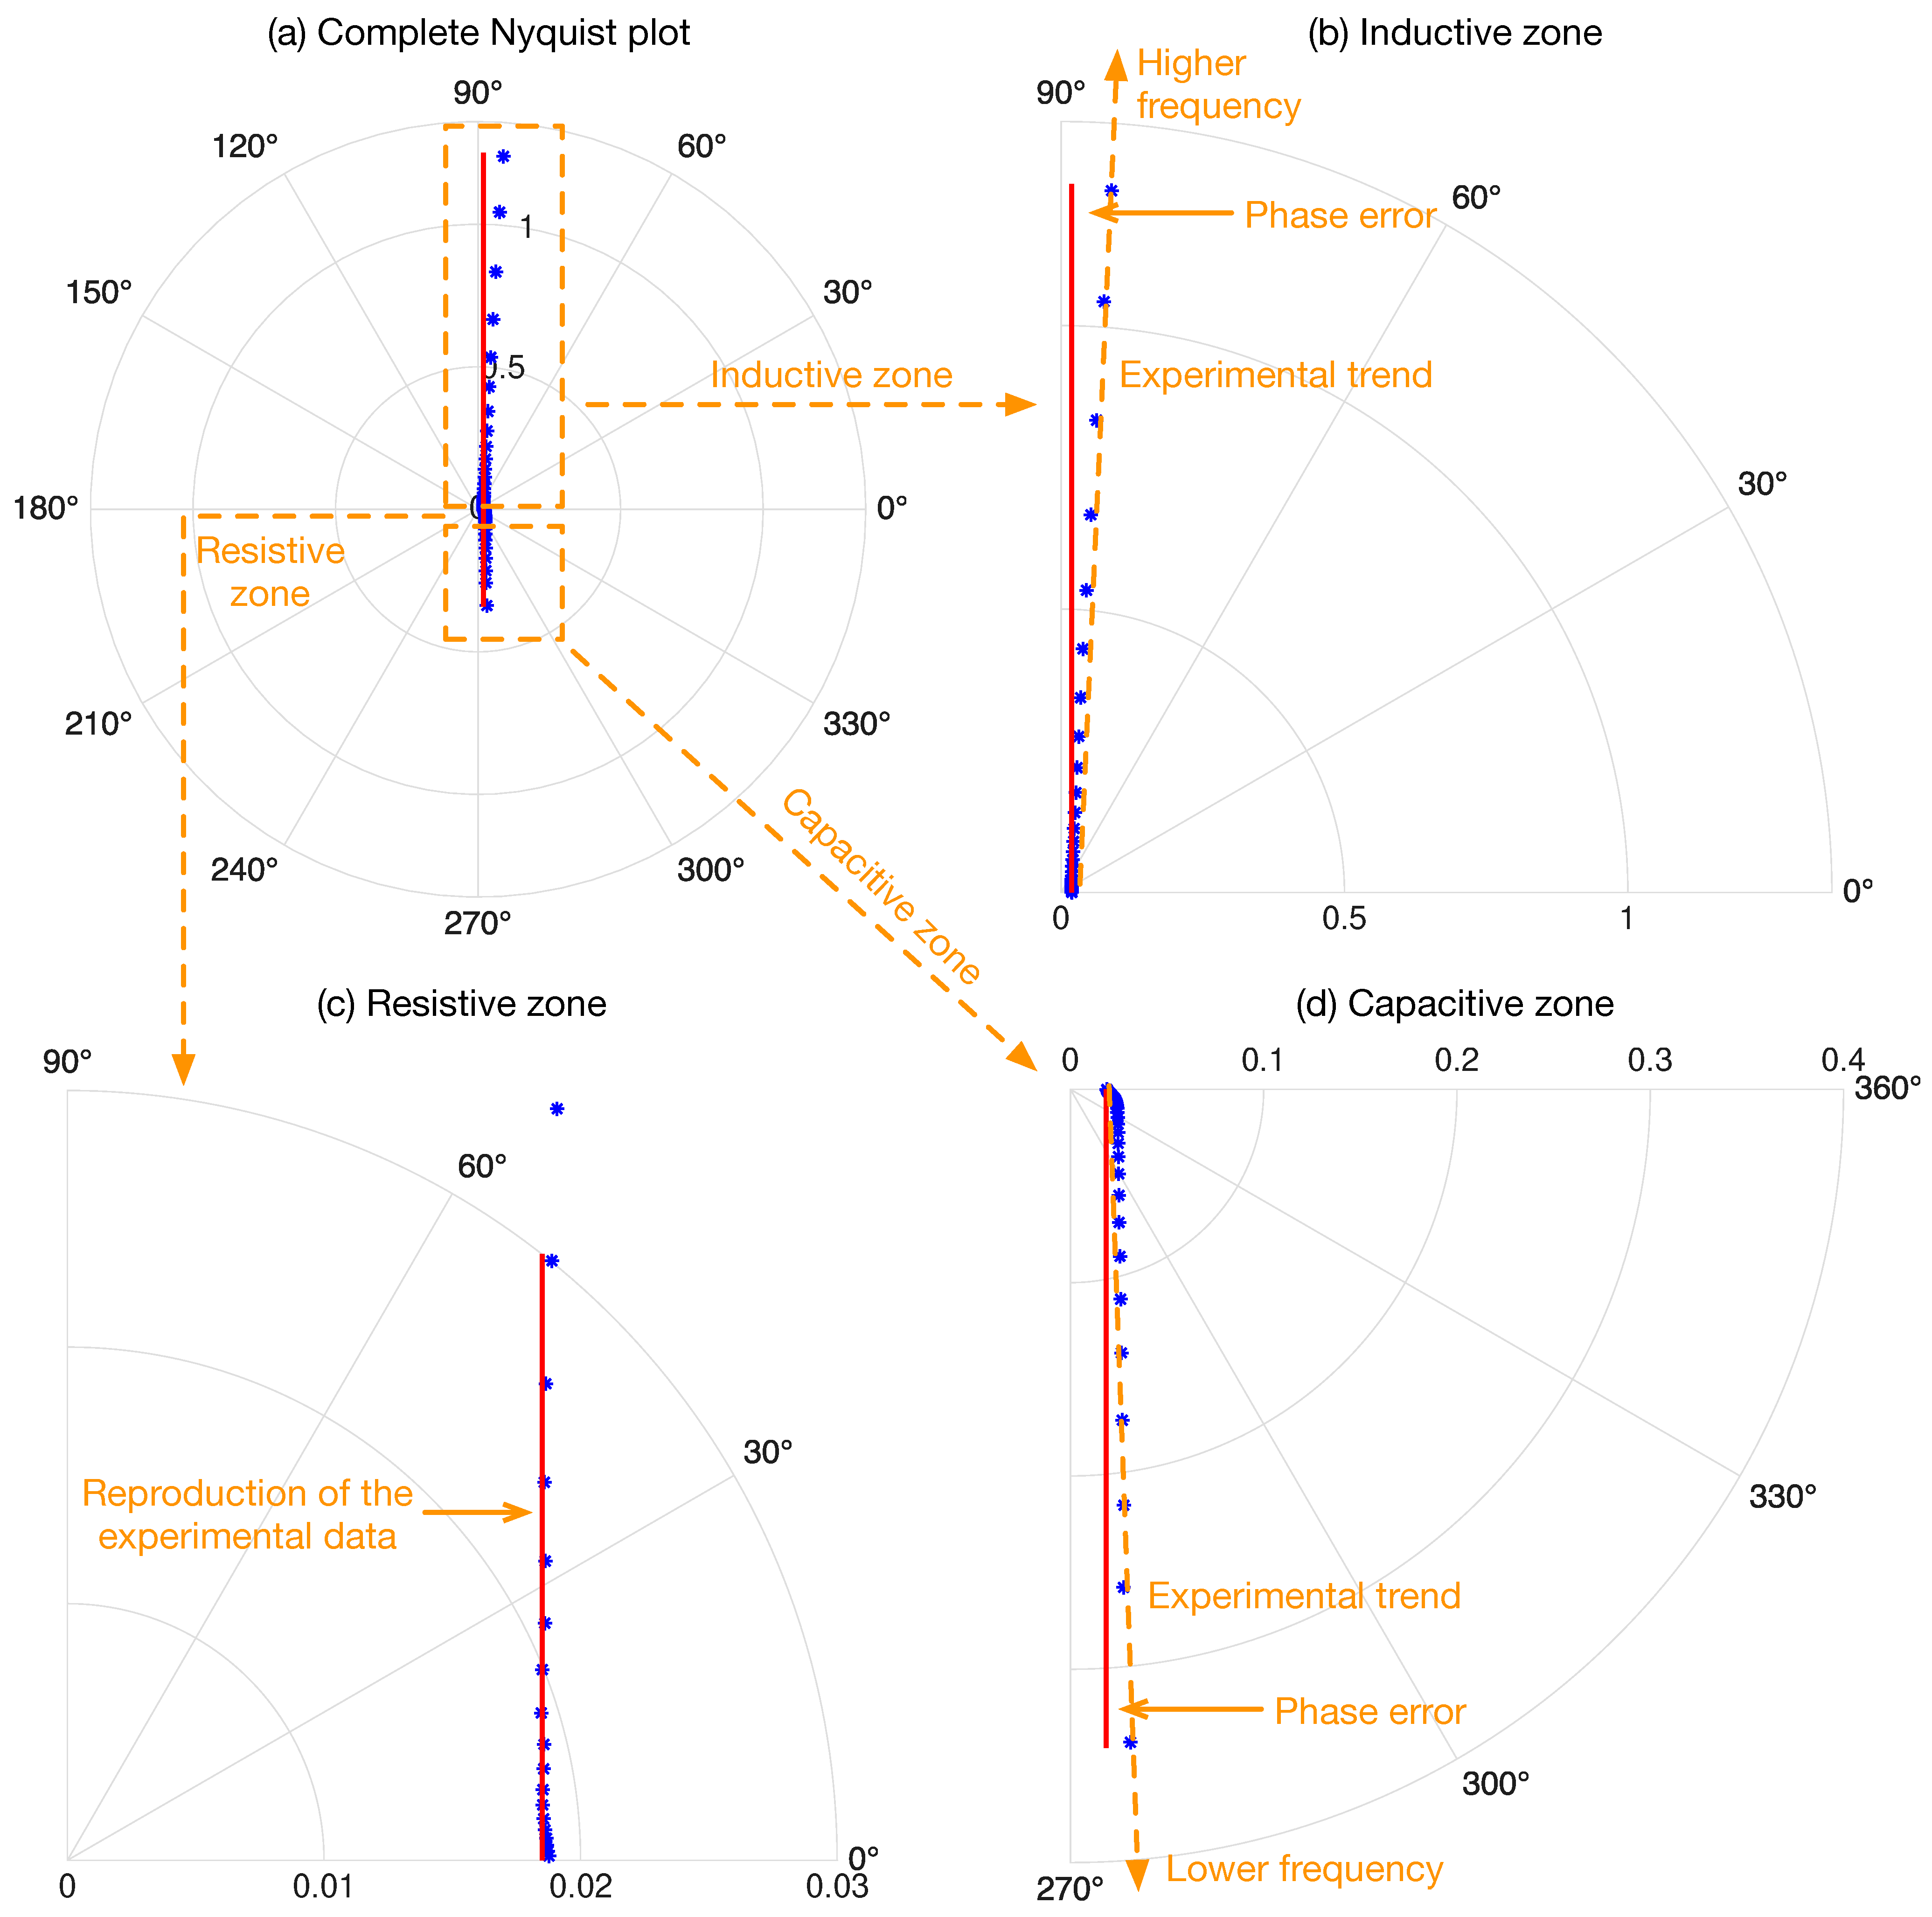
Nevertheless, a polar Nyquist plot shows the magnitude/phase relation, which is also used to identify circuital equivalents from frequency response data [75]. In a polar Nyquist plot the capacitive behavior corresponds to a vertical line at 90 ° , the inductive behavior corresponds to a vertical line at 90°, and the resistive behavior defines the magnitude at 0°. Figure 7 shows the polar Nyquist plot of both the R-L-C circuit and experimental data, where Figure 7a reports the complete 360° plot. In order to visualize in more detail the circuit behavior, Figure 7b focuses on the inductive zone (0° to 90°), where the R-L-C circuit shows an increment in the phase error when the frequency increases. Figure 7c focuses on the resistive zone (near 0°), where the selected resistance 18.5 m Ω accurately reproduces the experimental data. The capacitive zone ( 90 ° to 360°) is observed in Figure 7d, where the R-L-C circuit also shows phase errors, but in this case the error increases when the frequency decreases.
The phase errors observed in Figure 7 put into evidence that additional components must be introduced into the circuital equivalent to ensure an accurate reproduction of the experimental data. In the specialized literature about impedance spectroscopy, such a progressive change on the Nyquist plot phase is reproduced by using a Warburg element [75], which is discussed in the following section.

2.3. Warburg Element

The Warburg element models the impact of electrochemical diffusion on the device’s impedance (battery, fuel cell, supercapacitor, among others). This element is frequently used in circuital equivalents to fit the phase change occurring at different frequencies, and in polar Nyquist plots it exhibits a straight line at 45 ° [75].
The impedance of the semi-infinite diffusion Warburg element Z W is described by Equation (1), where A W is the Warburg coefficient that must be estimated. It is observed that expression (1) describes a non-linear element, where impedance depends on the square root of the frequency; thus, implementing such a non-linear impedance in circuital simulators is not a simple task. Therefore, the following subsection analyzes the accuracy of circuital approximations to such an impedance.
Z W = A W j · ω

2.3.1. Circuital Approximation of the Warburg Element

The work reported in [60] uses a polynomial expansion to approximate the Warburg impedance as given in (2); the coefficients of such an expressions for different orders are reported in Table 4. Since expression (2) can be described as a traditional transfer function, such an approximation is a linearization of the Warburg element.
Z W A W · x = 0 n a x · j · ω x x = 0 n b x · j · ω x
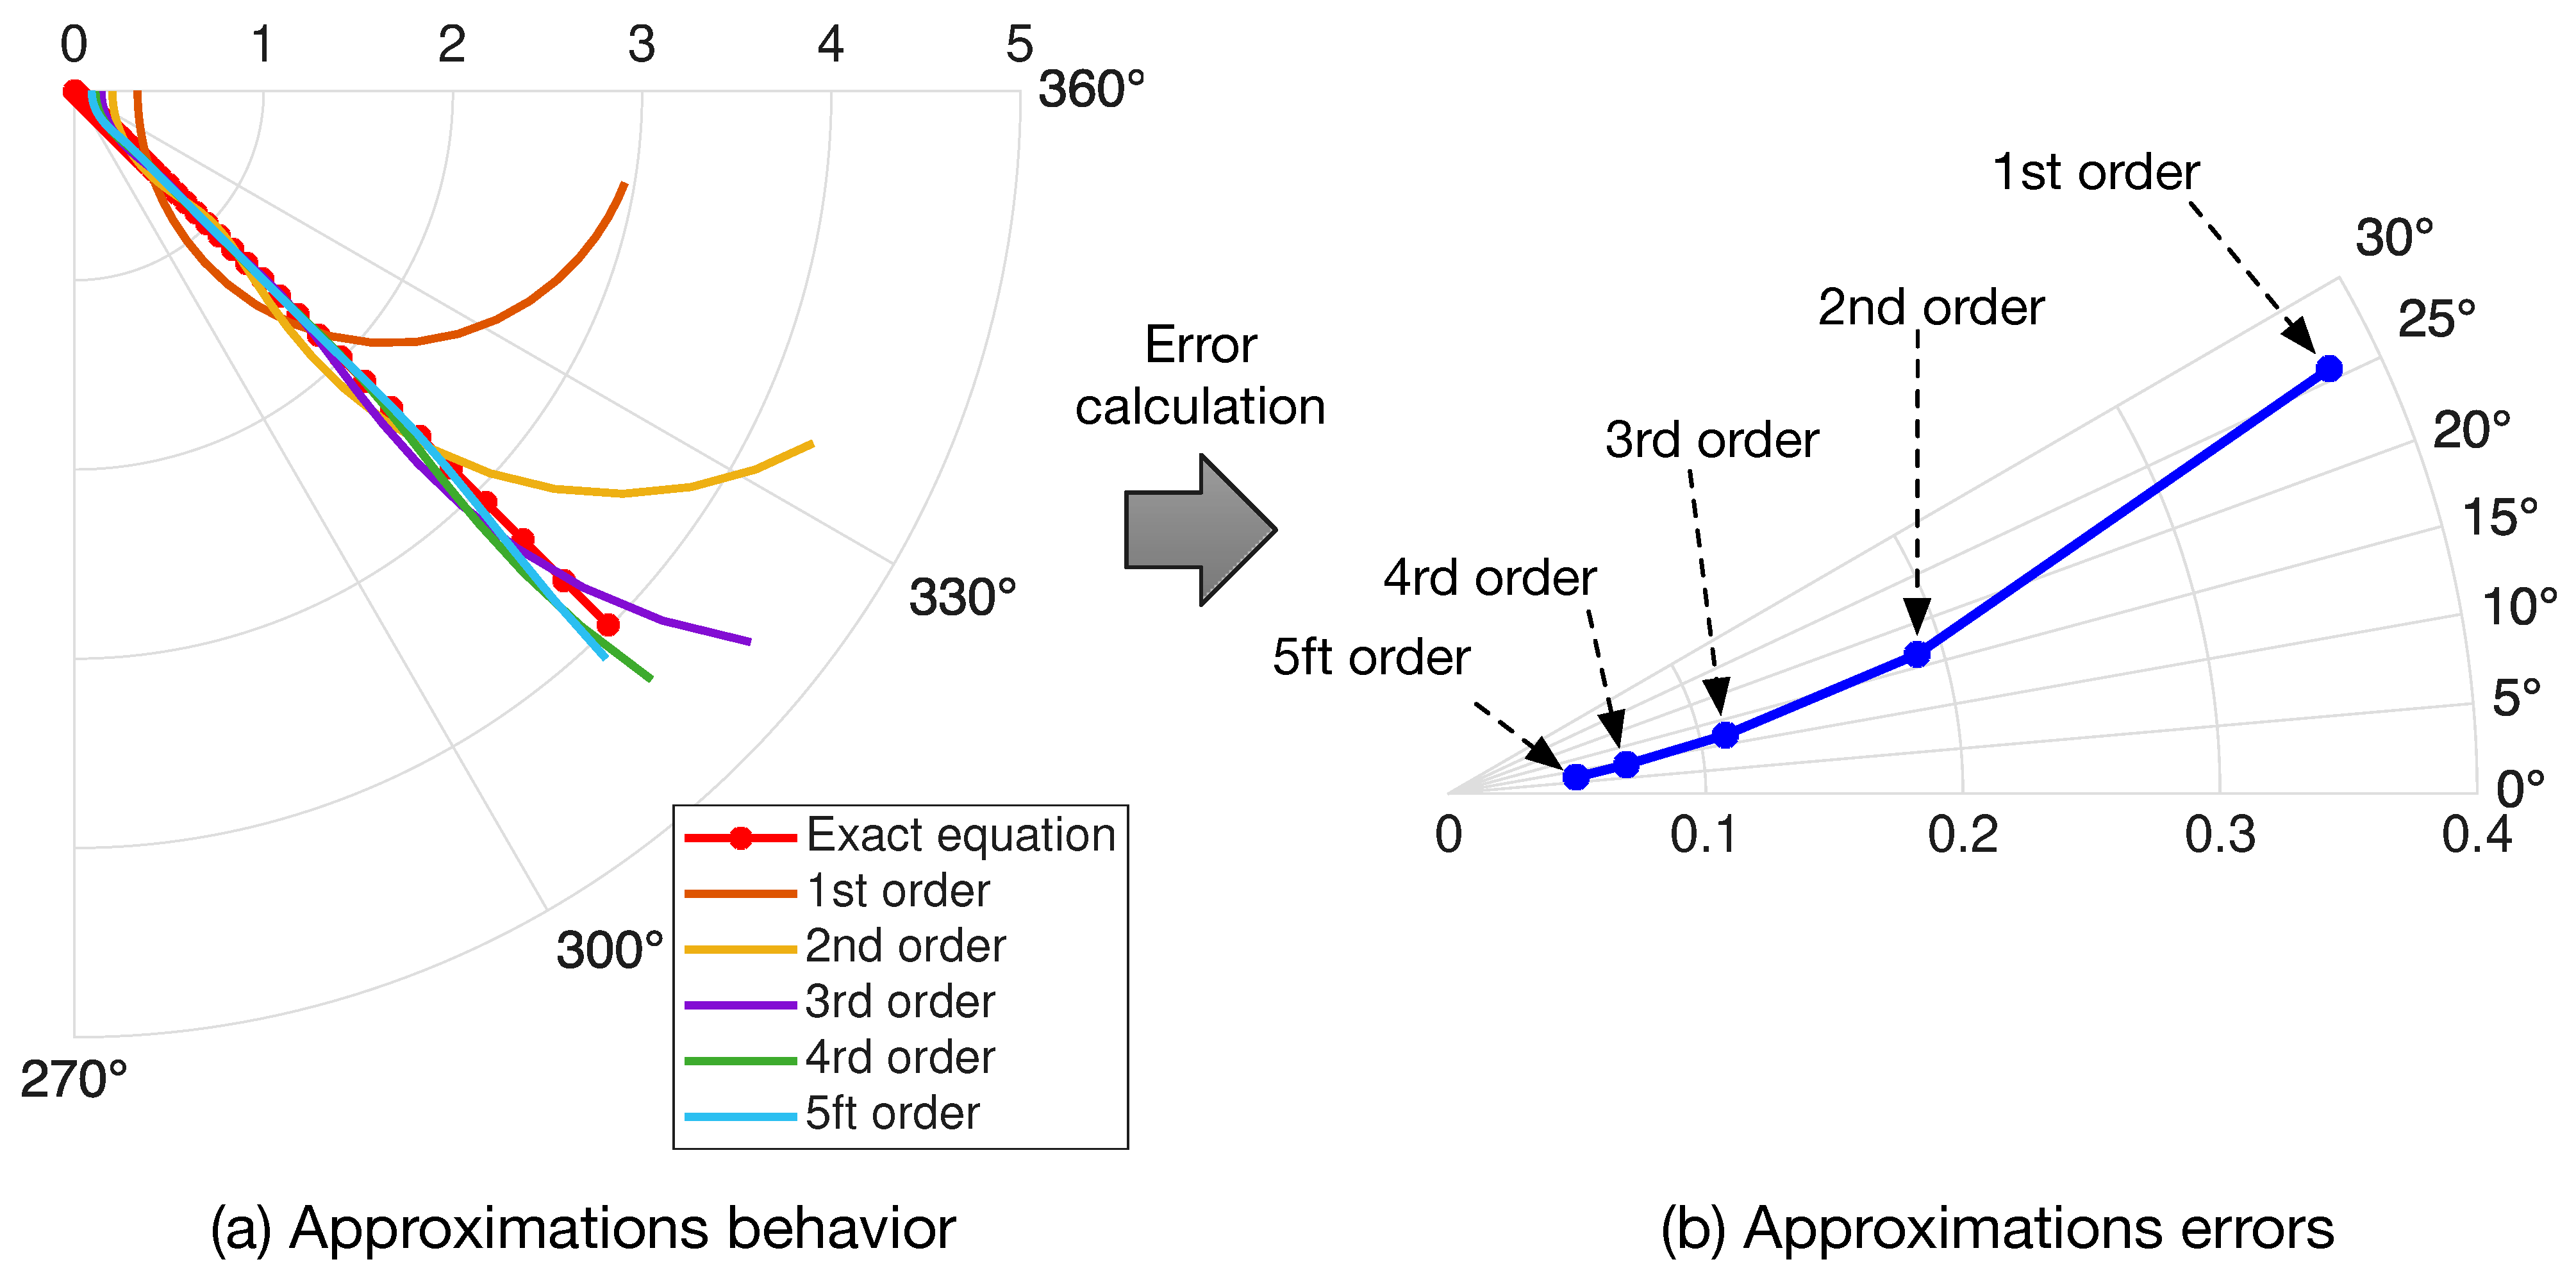
The left side of Figure 8 shows the behavior of the five polynomial approximations for a unitary Warburg impedance ( A W = 1 Ω s 1 / 2 ). As it is expected, the fifth-order polynomial provides the best results. To quantify the error introduced by the Warburg impedance approximations, the average distance e d between the polar points of the exact value r , θ and the approximation r ^ , θ ^ is calculated using (3), where N points at the same frequencies are operated. Similarly, the average difference e θ between the angles of the exact value and the approximation, at the same frequency, is calculated using (4). The right side of Figure 8 shows both distance and angle errors in polar form, where the errors are significantly reduced with the increment of the approximation order. The distance error for the fifth-order approximation is 0.05 (1.33%), while the angle error is 7.2 ° (16%).
e d = i = 1 N y i ^ y i 2 + x i ^ x i 2 N , where y i ^ = r i ^ · sin θ i ^ x i ^ = r i ^ · cos θ i ^ y i = r i · sin θ i x i = r i · cos θ i
e θ = i = 1 N θ i ^ θ i N
Figure 9 reports the circuital implementation of the Warburg impedance approximations given in (2), which is formed by a first resistor R 0 and a parallel connection of a capacitance C x and resistor R x for each order of the approximation ( x = 1 n ). The resistors and capacitors values for such a circuit were reported in [60] for a particular case, which must be adjusted depending on the application. Therefore, the values of those resistors and capacitors were normalized for a unitary Warburg impedance (Table 5), and the circuit values for any Warburg coefficient A W are calculated using the expressions given in (5). Since the first- and second-order approximations introduce large errors, only the third, fourth, and fifth orders are considered in Table 5.
R x , c i r c u i t = R x · A W , C x , c i r c u i t = C x / A W for x = 0 n
From Figure 9 and Table 5 it is concluded that the fifth-order approximation requires six resistors and five capacitances; hence, such a circuit does not introduce a significant load to any power electronics simulator. In fact, the execution time of the Warburg element approximations in a computer with a M4-pro processor with 14 cores and 24 Gb of RAM, for 100 operation conditions, is 4.76 μ s for the third order, 11.6 μ s for the fourth order, and 15.3 μ s for the fifth order. Therefore, this work selects the fifth-order approximation to represent the Warburg impedance in the equivalent circuit of the supercapacitor.

2.3.2. Introduction of Warburg Elements into the Circuital Equivalent

The polar Nyquist plot of the R-L-C circuit reported in Figure 7 shows that phase corrections are needed for both capacitive and inductive zones. Therefore, a first Warburg element with A W C coefficient is placed in parallel with the capacitor, and a second Warburg element with A W L coefficient is placed in parallel with the inductor as it is depicted in Figure 10. Finally, A W C = 1.2 Ω s 1 / 2 and A W L = 200 Ω s 1 / 2 were calculated from the minimization of the error between the complete circuital equivalent and the experimental data.
Despite the complete circuital equivalent not being designed for electrochemical interpretation, some correlation between its components and electrochemical phenomena could be discussed. Since the BMOD0058-E016-B02 supercapacitor is an electric double-layer capacitor, the capacitance C is related to the electrostatic charge accumulated at the electrode–electrolyte junction, which depends on the adsorption/desorption of the electrolyte ions on the electrode surface [76]. The series resistance R relates to the ohmic losses, and the inductive component L is related to the geometry and dimensions of its plates, as well as its connection terminals [49,50]. Finally, the Warburg elements relate to the impact of electrochemical diffusion on the supercapacitor impedance [75].

3. Results and Discussion

3.1. Frequency Response of the Complete Circuital Equivalent

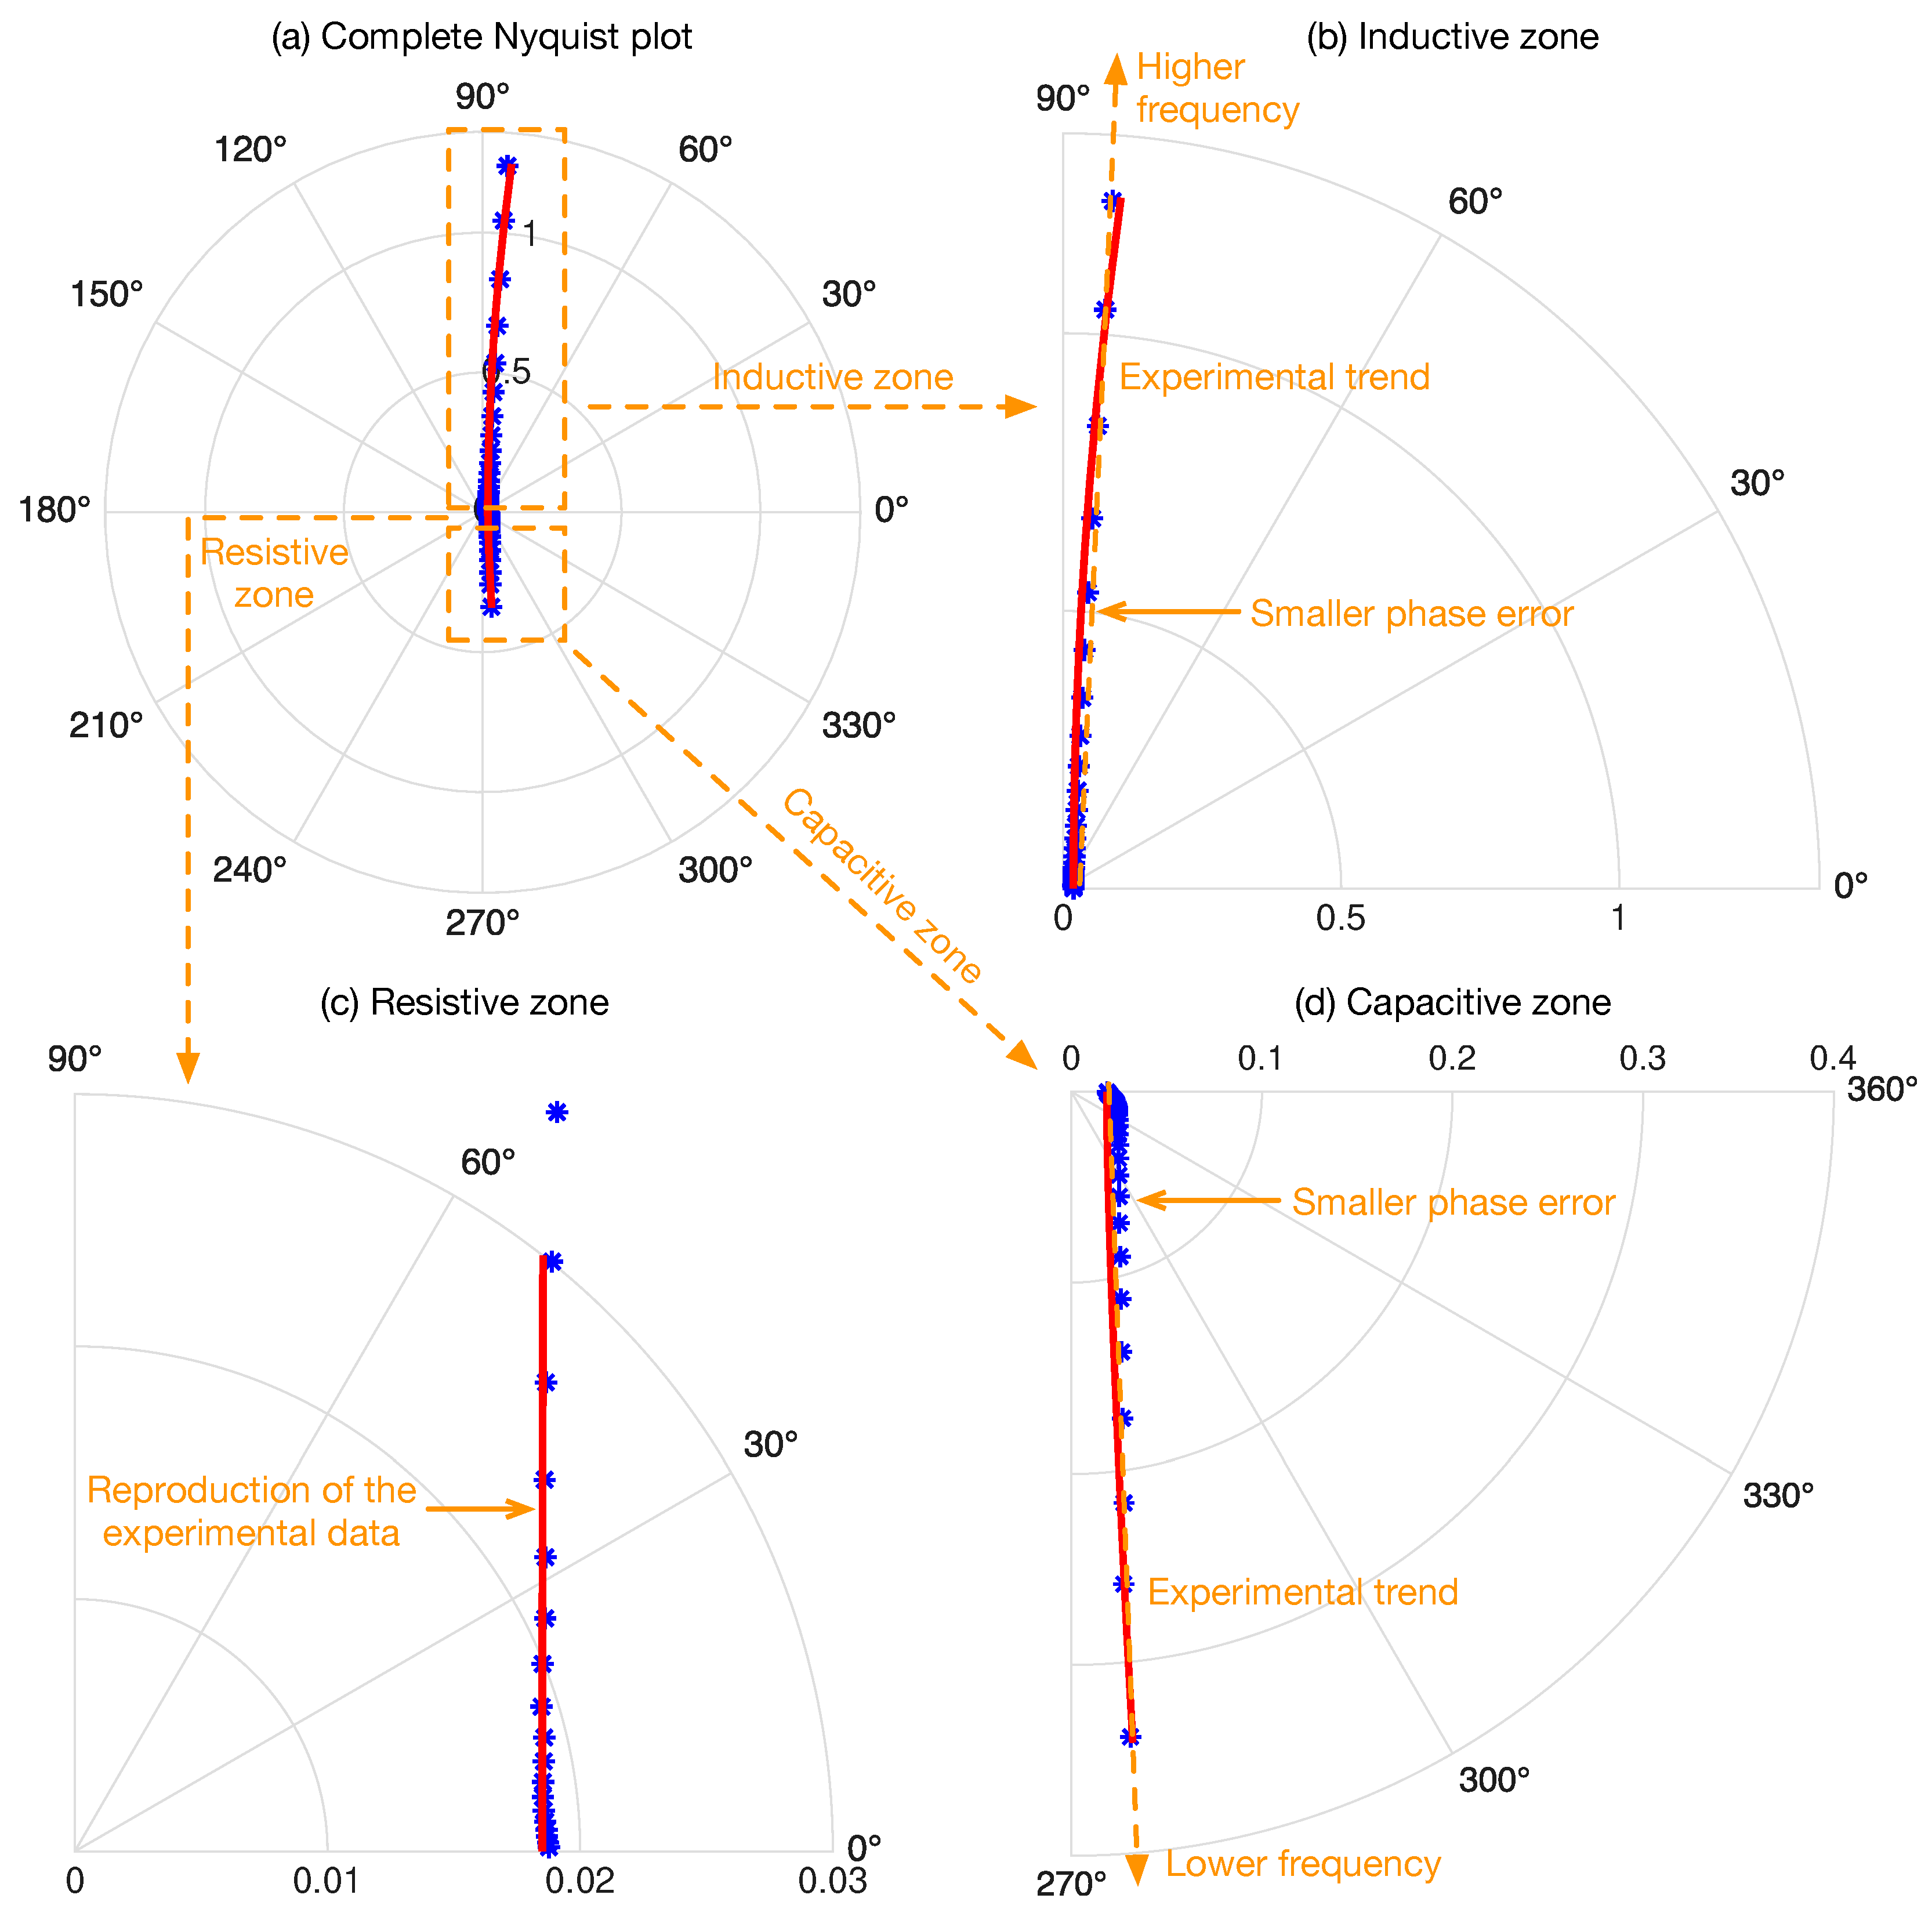
The complete circuital equivalent of Figure 10 was simulated considering fifth-order circuits to implement the Warburg elements, and those results are contrasted with the experimental data in the polar Nyquist plot presented in Figure 11. Figure 11a reports the complete 360° plot, which shows a better fit with the experimental data in comparison with the simpler R-L-C circuit (Figure 5) evaluated in Figure 7. The higher accuracy in the reproduction of the inductive behavior (0° to 90°) is observed in Figure 11b, where the complete circuital equivalent reproduces the phase change observed in the experimental data at high frequencies, thus following the experimental trend with smaller phase errors in comparison with the R-L-C circuit. Figure 11c shows the resistive zone (near 0°), where the complete circuital equivalent accurately reproduces the experimental data, thus it has a similar performance than the R-L-C circuit. Finally, the capacitive zone ( 90 ° to 360°) is analyzed in Figure 11d, where the complete circuital equivalent also reproduces the phase change for lower frequencies, providing smaller phase errors in comparison with the R-L-C circuit.
In order to quantify the performance of the complete circuital equivalent, the average distance e d = 0.0426 between the circuital equivalent and the experimental data is calculated using (3), and the average difference e θ = 7 . 07 ° between the angles is calculated using (4). Those errors are contrasted with the performance of the simpler R-L-C circuit, resulting in the following improvements. In the capacitive zone (0.01 Hz to 0.1 Hz) the average distance error is reduced by 27%, while the average angle error is reduced by 37.23%, thus improving the accuracy in the experimental data reproduction. In the resistive zone (0.1 Hz to 3 kHz) the average distance error is reduced by 4.5%, and the average angle error is reduced by 4.82%; such a smaller improvement is expected since the R-L-C circuit provides a satisfactory reproduction of the experimental data in this zone, and the complete circuital equivalent improves on the data reproduction by a small margin. Finally, in the inductive zone (3 kHz to 300 kHz) the average distance error is reduced by 16.1%, while the average angle error is reduced by 36.45%, again improving the accuracy in the experimental data reproduction. This error analysis, summarized in Table 6, shows the improvements provided by the complete circuital equivalent, which can be implemented in any circuit simulator. The execution time of the complete circuital equivalent for 100 operation conditions, in a computer with a M4-pro processor with 14 cores and 24 Gb of RAM, is 70.55 μ s. Therefore, the simulation of a single operation condition requires 0.71 μ s, which enable the use of this complete circuital equivalent in real-time simulations within such time constraints. Moreover, if shorter execution times are needed for real-time or embedded applications, the Warburg approximation could be reduced to fourth- or third-order circuits, where lower execution times are achieved at the expense of increased errors; Section 2.3.1 provides both execution times and errors for those approximations.

3.2. Power Electronics Examples

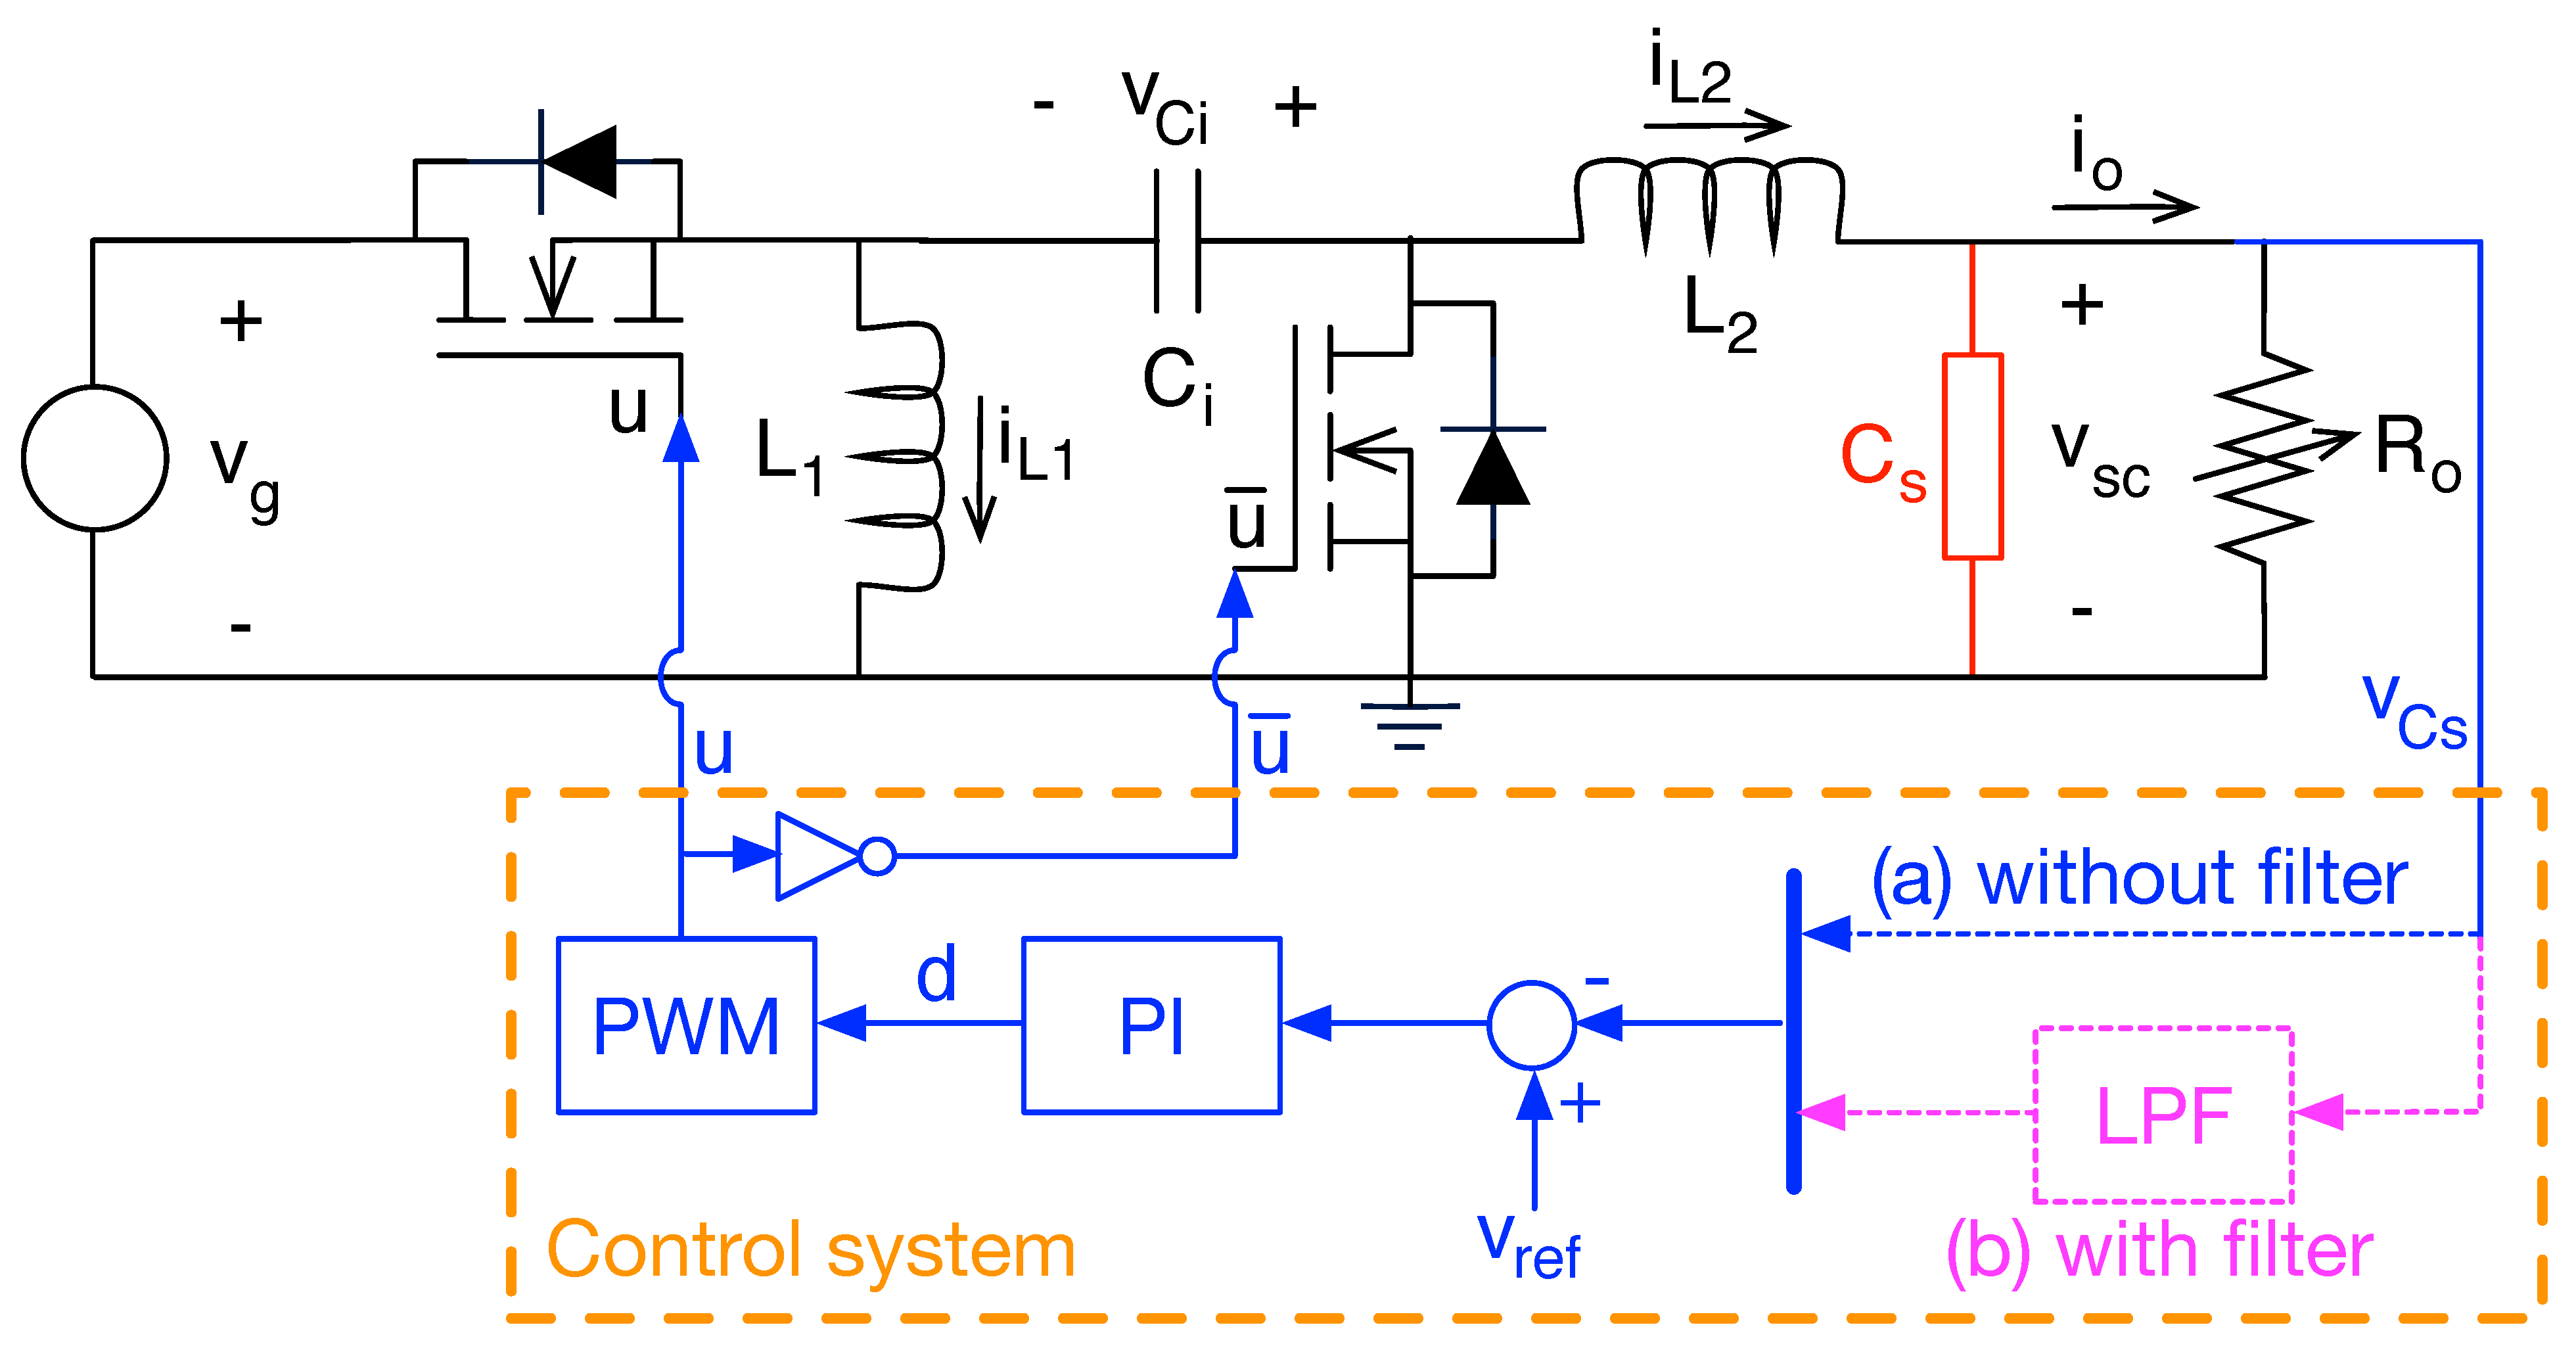
The use of the complete equivalent circuit is illustrated with power electronics applications. Figure 12 shows a Zeta converter regulating the voltage of a variable load R o , which is imposed by the supercapacitor voltage; the supercapacitor is represented by the red element C s . This power conversion system was published in [72], where the control system measures the supercapacitor voltage v s c to produce the duty cycle d, which is used by the Pulse Width Modulator (PWM) circuit to generate the activation signals of the converter’s MOSFETs (u and u ¯ = 1 u ).

3.2.1. Control Problem

This first example considers a 12 V battery ( v g = 12 V), the inductors are L 1 = L 2 = 10 μ H , the intermediate capacitor is C i = 20 μ F , and the load has an starting value of R o = 10 Ω , thus imposing a load current i o = 1.2 A . Finally, the PWM circuit is configured with a switching frequency of 100 kHz.
In this example the control system is formed by a classical feedback-loop, where the controller is a Proportional-Integral (PI) structure processing the error between v s c and the reference voltage v r e f . However, the control system of Figure 12 has two options to deliver the measurement of the supercapacitor voltage v s c to the subtractor of the feedback-loop: (a) directly without any filter, which is the blue dotted line; and (b) using a low-pass filter (LPF) to attenuate the switching ripple present in v s c , which is the magenta dotted line.
The PI controller was designed using a classical approach. The supercapacitor is represented by the classical R-C equivalent, i.e., the blue section of Figure 5, and the PI parameters are calculated using the root-locus method to achieve a settling-time lower than 2 ms, obtaining the following controller:
P I ( s ) = k · 1 + s · T s · T where k = 0.07 and T = 10 4
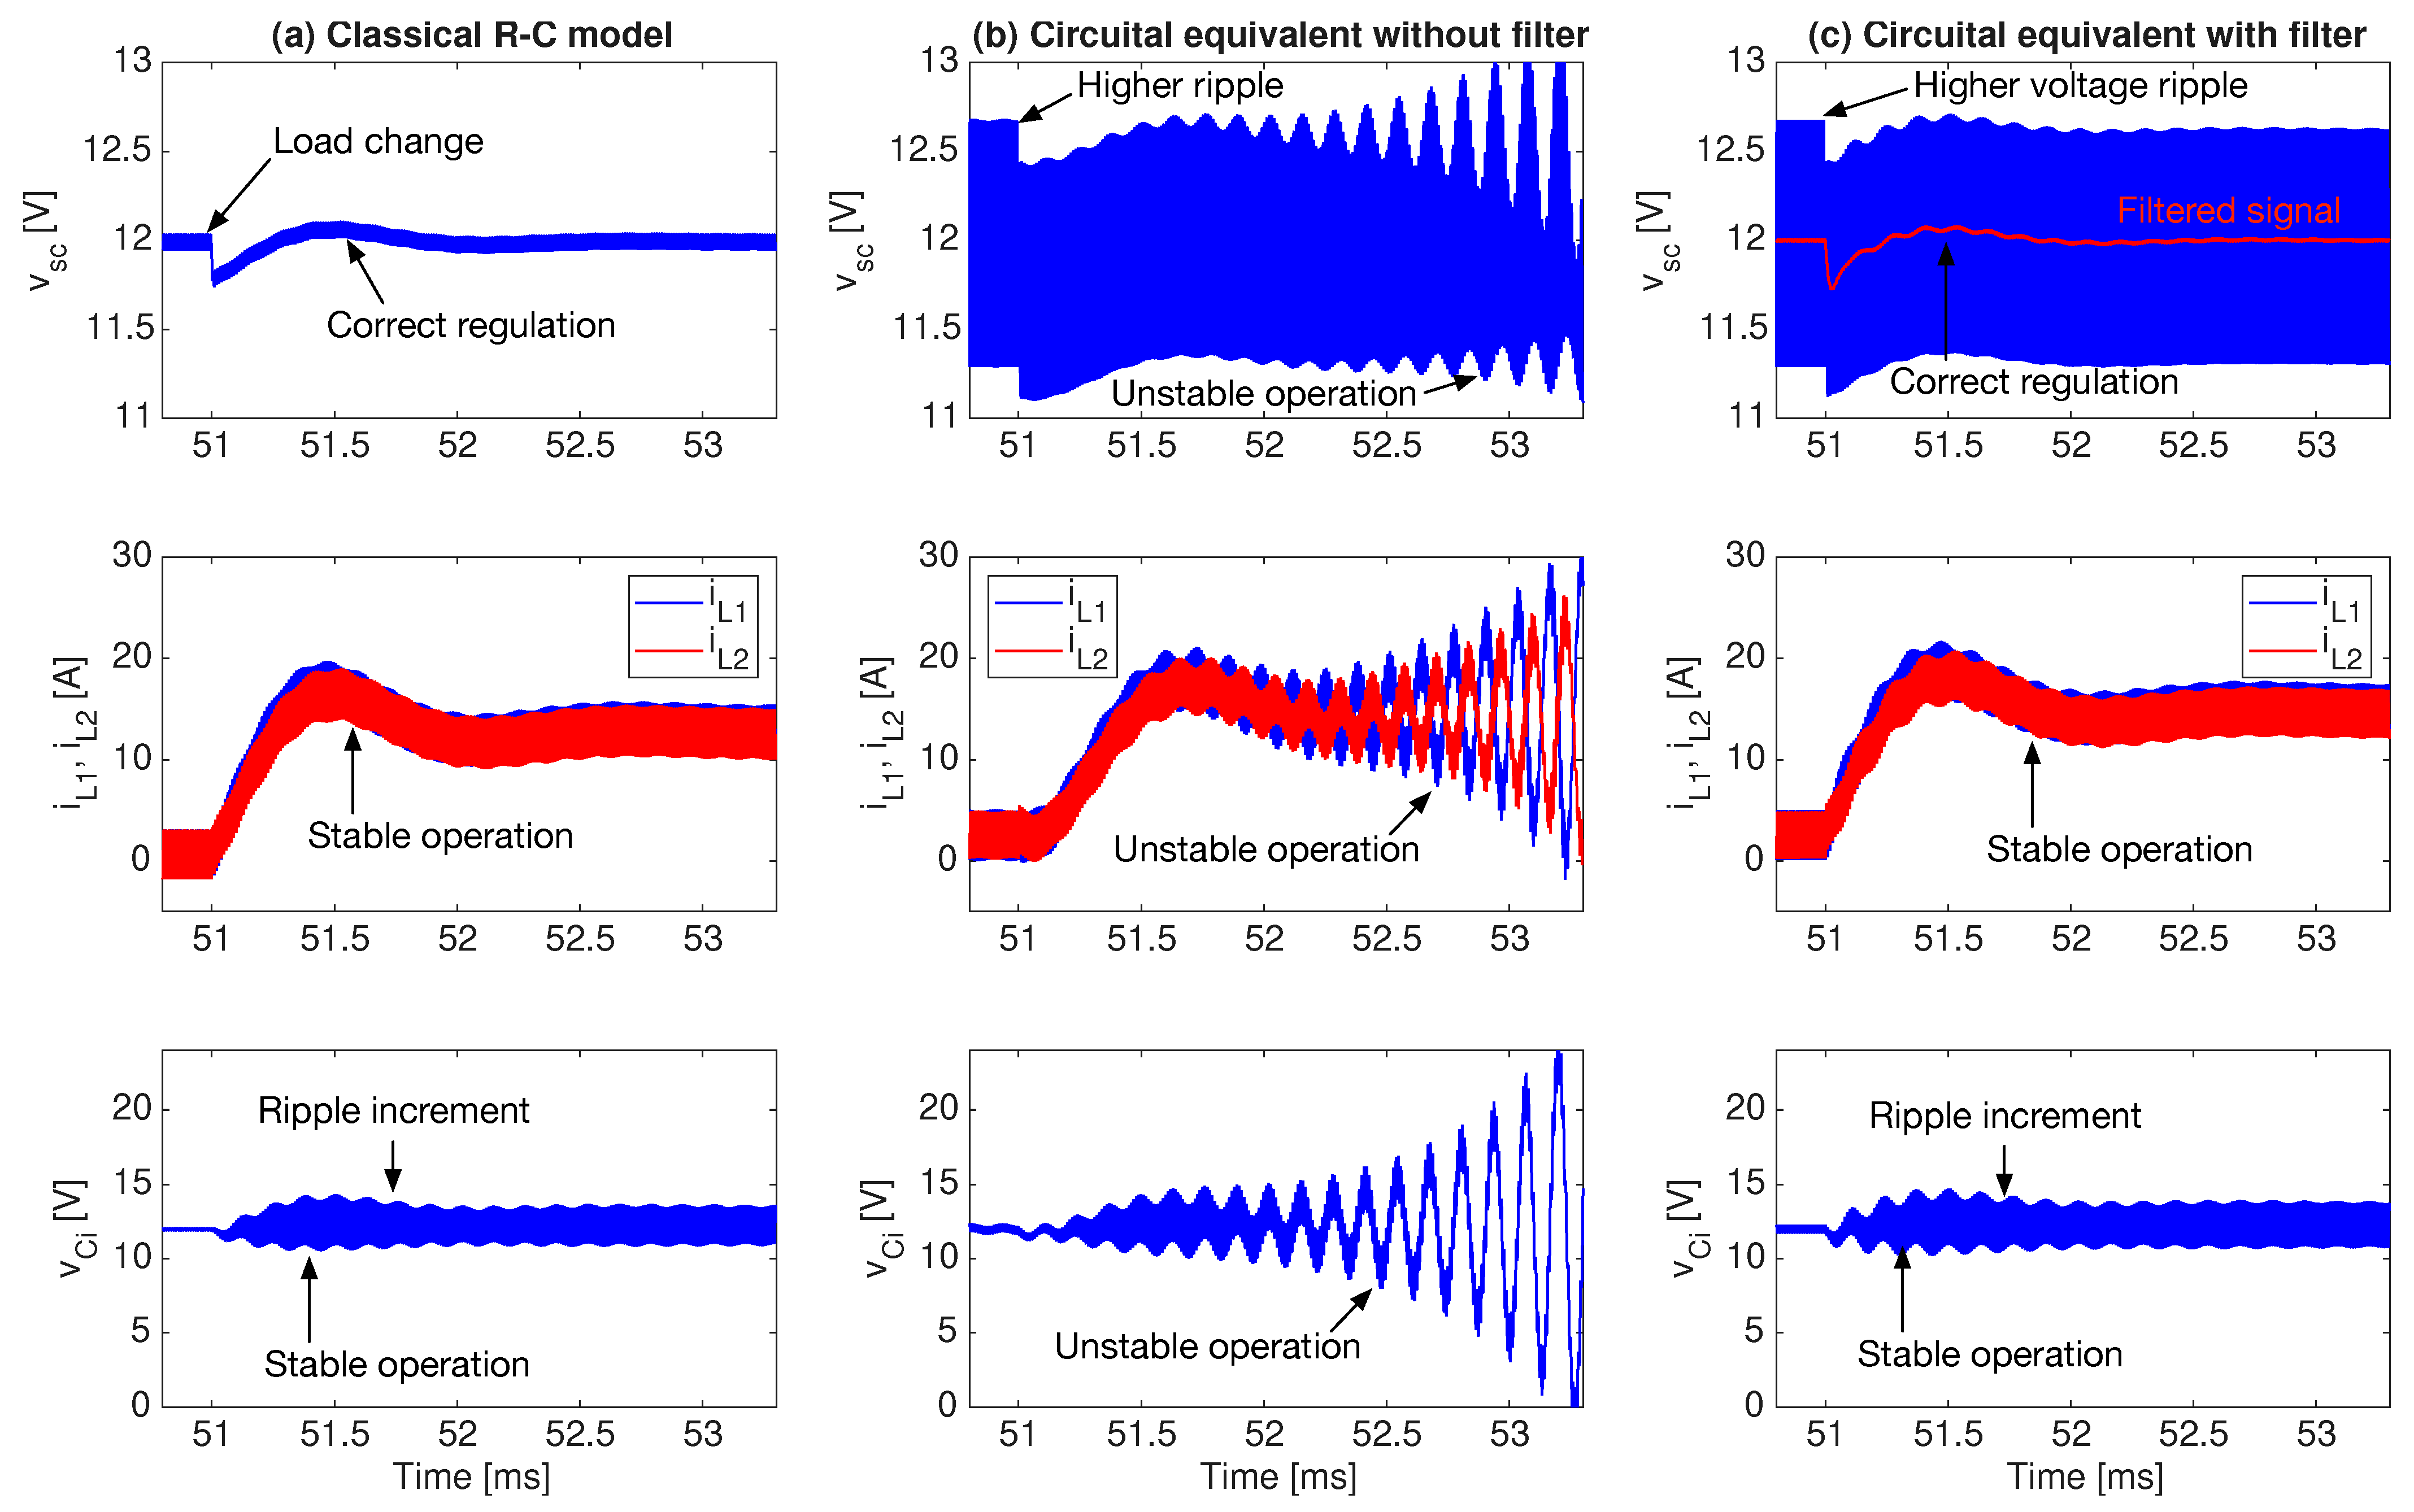
The first test was conducted by simulating the supercapacitor with the classical R-C equivalent, and at 51 ms it is considered a load change ( R o = 0.909 Ω ) that increases the current consumption to 13.2 A. The circuital simulation of the system was performed in the power electronics simulator PSIM, and in this case it adopted the path (a) in Figure 12 to measure v s c , i.e., without any filter. Figure 13a shows the results of the circuital simulation, where the correct regulation of the supercapacitor voltage v s c at 12 V is observed. Moreover, the stable operation of both inductors currents i L 1 and i L 2 is evident, where such currents are increased to supply the new load current. Finally, the stable operation of the intermediate capacitor voltage v C i is also observed, even if the voltage ripple is increased due to the current increment in the inductors. This stable operation is expected since the circuital simulation is executed with the same (and classical) supercapacitor R-C representation used to design the control system.
A second test was conducted by simulating the supercapacitor with the complete circuital equivalent of Figure 10. This test considers the same Zeta converter and control system under the same load change. The circuital simulation of this test also uses the path (a) in Figure 12 to measure v s c , i.e., without any filter. Figure 13b shows the results of the circuital simulation, where an increased voltage ripple in v s c is observed. Since the switching ripple has a fundamental frequency of 100 kHz, such an increment in the voltage ripple is produced by the inductive behavior observed in the experimental data reported in Figure 4 and reproduced by the complete circuital equivalent, which increases the supercapacitor impedance and introduce a phase change at high frequencies. Figure 13b shows that the inductors currents and intermediate capacitor voltage become unstable after the load change occurs, which is mainly caused by the voltage ripple propagation into the PI controller. This unstable behavior of the controller cannot be detected when the classical R-C equivalent is used to simulate the supercapacitor.
A classical solution to reduce the effect of voltage ripples in control systems is to introduce a low-pass filter in the voltage sensing circuitry, which is simulated in Figure 12 by means of the path (b), i.e., considering a low-pass filter (LPF) between the v s c and the input of the controller subtractor. That filter was implemented with a second-order structure featuring a cut-off frequency of 1/10 of the switching frequency (10 kHz) and a damping ratio of 0.7, which ensures a mitigation of the switching ripple. This third test also simulates the supercapacitor with the complete circuital equivalent, the same Zeta converter and control system, and under the same load change. Figure 13c shows the results of this third circuital simulation, where the same increased voltage ripple in v s c is observed. However, in this case the system has an stable operation in all the state variables ( v s c , v C i , i L 1 , and i L 2 ), which is expected since now the high-frequency ripple is not propagated into the control system. This is further observed in the filtered signal of v s c depicted at the top of Figure 13c, which has the same behavior for the supercapacitor voltage obtained with the classical R-C circuital representation used in Figure 13a; in fact, the inductors currents and v C i voltage have almost the same behavior in Figure 13a,c.
Therefore, the second and third simulations, performed with the complete circuital equivalent, put into evidence the need of an LPF in the sensing circuitry of the supercapacitor voltage, which cannot be anticipated when the classical R-C equivalent is used to simulate the supercapacitor.

3.2.2. Ripple Specification Problem

This second example considers the use of the supercapacitor to design a power system for USB power supply. Since any bidirectional DC–DC converter can be used to produce the USB bus, in this example the same Zeta converter of the previous example is considered (Figure 12), but in this case the output voltage is v U S C = 5 V ; therefore, the parameters of the PI controller in (6) are changed to k = 0.025 and T = 2 × 10 3 to ensure stability. The general schematic of the USB power system is reported in Figure 14, where the load is set to 1.66 Ω to request 3 A to the USB bus.
The USB standard [77] imposes limits of ± 5 % for safe voltage operation, thus the voltage must be constrained between 4.75 V v U S B 5.25 V . Since the supercapacitor has a very large capacitance of 58.4 F, it is expected to obtain a safe voltage ripple for the USB bus. The first simulation considers the supercapacitor represented with the classical R-C equivalent, where the small voltage ripple depicted in Figure 15a is predicted, thus also predicting the fulfillment of the USB standard.
A second simulation is reported in Figure 15b, where the complete circuital equivalent was used to represent the supercapacitor. This realistic simulation shows a large voltage ripple produced by the high-impedance of the supercapacitor at high-frequencies (100 kHz in this case), thus revealing that the USB standard is not fulfilled. Therefore, simulating the supercapacitor with the classical R-C equivalent will provide a false safety prediction for the USB bus. Instead, the complete circuital equivalent puts into evidence the need of additional safety devices to fulfill the USB standard restrictions, thus avoiding construction delays or load damages.
Such a problem can be solved by adding a high-frequency capacitor C H F in parallel with the supercapacitor to absorb the high-frequency components, thus reducing the voltage ripple of the USB bus; this solution is observed in Figure 14 as the dotted blue capacitor. For the third simulation, a small high-frequency capacitor RDS1C470MCNAFEGS [78] is selected, which has a small capacitance of 47 μ F and an ESR equal to 24 m Ω. This aluminum–polymer capacitor can absorb current ripples up to 3.75 A at 100 kHz, which is enough to support the current ripple imposed in this application (3.07 A). The simulation results of this solution are reported in Figure 15c, where the USB bus exhibits a safe operation condition. The additional C H F capacitor has a capacitance six-orders of magnitude smaller than the supercapacitor, thus it does not provide a significant energy storage; instead C H F , is only used to reduce the voltage ripple. In addition, the RDS1C470MCNAFEGS capacitor only cost USD 0.22, hence its impact on the system cost is negligible.
In conclusion, both examples show that the complete circuital equivalent makes it possible to identify high-frequency behaviors not present in the classical R-C equivalent frequently used to simulate supercapacitors in power electronics applications. This feature is specially important in the design and control of high-frequency circuits like switching power converters, among others.

4. Conclusions

Supercapacitors have emerged as pivotal components in the global energy transition and decarbonization initiatives, uniquely positioned among energy storage elements due to their remarkable balance of energy density and power capability. Their inherent attributes, including rapid charge/discharge rates, high efficiency, and extended life cycle, render them exceptionally suitable for demanding applications such as energy buffering and hybrid storage systems. However, the effective integration and optimal management of supercapacitors require accurate electrical models that can faithfully represent their complex and frequency-dependent behavior, particularly in high-frequency power electronics applications.
Simpler equivalent circuits, such as the traditional R-C model, offer implementation simplicity but inherently fail to capture critical dynamics, notably the undesired inductive effect observed at higher frequencies. This limitation reveals a significant gap, corroborated by experimental observations that delineate distinct zones of capacitive, resistive, and inductive behaviors across a broad frequency spectrum. Furthermore, a comprehensive literature review underscores the inherent trade-offs between model accuracy, computational efficiency, and the complexity of parameter identification across various modeling paradigms. This paper addresses this critical deficiency by presenting a more accurate and comprehensive equivalent circuit, capable of describing supercapacitor behavior across the operational frequency range needed in power electronics applications, thereby bridging the gap between experimental reality and theoretical representation for advanced system design and control.
The proposed equivalent circuit is meticulously derived from experimental data obtained through the characterization of commercial supercapacitors over a wide frequency range, specifically from 0.01 Hz to 300 kHz, utilizing a commercial frequency response analyzer. In contrast to models primarily intended for energy management systems, this approach is exclusively tailored for analysis and simulation within power electronics systems. Its fundamental objective is to accurately replicate the device’s external electrical behavior under a wide frequency range, without attempting to represent its intrinsic electrochemical characteristics. The critical utility of this model in high-frequency circuits has been unequivocally demonstrated in the design and control of power converters, exemplified by its application to a Zeta converter operating at 100 kHz.
In this specific case, the equivalent circuit accurately predicted a significant increase in the supercapacitor’s voltage ripple and revealed instability in the inductor currents and intermediate capacitor voltage—phenomena that are undetectable by simplified classical models. Furthermore, another contribution of this work is the inclusion of a normalized fifth-order circuit approximation of the Warburg element. This not only facilitates the parameterization of circuit elements for any Warburg coefficient using the provided equations, but also substantially improves the fit with experimental data, achieving a 27% reduction in distance error and a 37.23% reduction in angular error within the capacitive zone, and corresponding reductions of 16.1% and 36.45% in the inductive zone with respect to the simpler R-L-C model.
The application of the novel complete equivalent circuit has decisively revealed its critical importance in the design and control of power converters, especially in high-frequency systems where simplified models prove inadequate. An illustrative example is the aforementioned Zeta converter, operating at a switching frequency of 100 kHz. While a simulation employing the classic R-C model predicts stable operation under a load change, the proposed equivalent circuit, by incorporating the supercapacitor’s high-frequency inductive behavior, accurately predicts an increase in voltage ripple and instability in both the inductor currents and the intermediate capacitor voltage. This crucial phenomenon, which the simplified R-C model failed to detect, unequivocally demonstrates the capability to anticipate stability issues in high-frequency circuits provided by the proposed equivalent circuit. The subsequent inclusion of a low-pass filter in the sensing system, the necessity of which was prospectively identified by the new equivalent circuit, successfully stabilized the system. Similarly, a second example shows the need of introducing a high-frequency capacitor to reduce supercapacitor voltage ripple at high-frequencies, which is also not predicted by the classical R-C model. This underscores the profound practical utility of the complete equivalent circuit for preparing and planning experiments, enabling the proactive anticipation of filter and protection requirements, and ultimately optimizing the safety and robustness of prototypes prior to their physical implementation.
This predictive capability renders the proposed equivalent circuit as an invaluable tool for experimental preparation and planning, allowing for the pre-emptive identification of essential filters (such as the low-pass filter that stabilized the system in the converter example) and protective measures. This optimizes the safety and robustness of prototypes in experimental practice. Moreover, the model’s versatility is further enhanced by its compatibility with all major commercial circuit simulators, including PSIM, Spice/LTspice, Multisim Electronics Workbench, and MATLAB 2025a-Simscape Electrical, ensuring its broad applicability across various research and development environments.
The methodology proposed in this paper was illustrated with the commercial supercapacitor BMOD0058-E016-B02 because it has been used as an auxiliary storage device in power electronics applications, but the same procedure can be applied to other supercapacitor types or manufacturers. Therefore, a future work will be focused on characterize other supercapacitors frequently used in power electronics applications, which will be used to parameterize the complete equivalent circuit using the methodology reported in this paper, thus forming a database of equivalent circuits for commercial supercapacitors.
The supercapacitor used as example exhibits a consistent behavior for positive temperatures, but at negative temperatures its ESR can change up to 75.1% from the 25 °C value (for −40 °C), while the capacitance can change up to 6.5% from the 25 °C value (for −40 °C). It is not common to have power electronics devices operating at negative temperatures, but some specialized applications such as spacecraft or snow-resistance devices could exhibit such a condition. Therefore, another future work will be focused on characterizing the supercapacitors at negative temperatures, which will be used to produce temperature-dependent parameters of the equivalent circuits for commercial supercapacitors operating at negative temperatures.
Finally, one important aspect of the proposed equivalent circuit is the high accuracy in the reproduction of the supercapacitor frequency response, but the model parameterization requires detailed experimental data obtained with a costly frequency response analyzer. It is possible to generate similar experimental data using a sinusoidal power source (with variable frequency) to excite the supercapacitor and an oscilloscope to compare the current and voltage signals, thus producing manually the polar Nyquist plot. However, such a procedure is time consuming and its accuracy depends on the equipment quality and user experience. Another alternative is to use a power converter to generate the sinusoidal perturbations to the supercapacitor and using an embedded device to control the power converter and capture the current and voltage waveforms to compute the polar Nyquist plot. This is a very interesting alternative since it can be applied during normal operation of the supercapacitor, thus avoiding its disconnection from the power system. Nevertheless, such a solution requires a fast and accurate control system for the power converter, and precise measurement systems to acquire the voltage and current data. This is a future work currently under development.

Author Contributions

Conceptualization, C.R.-C., C.A.R.-P. and S.I.S.-G.; methodology, C.A.R.-P. and S.I.S.-G.; software, C.A.R.-P., J.D.A.-P. and C.G.-T.; validation, all authors; formal analysis, C.R.-C., C.A.R.-P. and S.I.S.-G.; investigation, C.R.-C., C.A.R.-P. and S.I.S.-G.; resources, C.R.-C. and S.I.S.-G.; data curation, C.A.R.-P. and C.G.-T.; writing—original draft preparation, C.A.R.-P. and S.I.S.-G.; writing—review and editing, C.R.-C., C.A.R.-P. and S.I.S.-G.; funding acquisition, C.R.-C. All authors have read and agreed to the published version of the manuscript.

Funding

The authors would like to thank the program which finances projects aimed at ecological and digital transition (Grant No. TED2021-131137B-IO0: “Contribution to the Ecological Transition of the Industrial Sector through Photovoltaic Self-consumption”) and the research program “Investigo” (2022-c23-i01-p03.s0020-0000590) which has been financed by the European Union with Next Generation EU funds. In addition, this research was also funded by Instituto Tecnológico Metropolitano, Universidad Nacional de Colombia, Universidad del Valle, and Minciencias—Ministerio de Ciencia Tecnología e Innovación of Colombia under the research program “Estrategias para el desarrollo de sistemas energéticos sostenibles, confiables, eficientes y accesibles para el futuro de Colombia” (Minciencias code 1150-852-70378, Hermes code 46771, ITM code 71148).

Data Availability Statement

The original contributions presented in this study are included in the article material. Further inquiries can be directed to the corresponding author. Moreover, the supercapcitor electrical circuit in PSIM is available on request from the corresponding author.

Conflicts of Interest

The authors declare no conflicts of interest. The funders had no role in the design of this study; in the collection, analyses, or interpretation of data; in the writing of this manuscript; or in the decision to publish the results.

References

  1. Sustainable Energy for All-SEforALL. 24/7 Carbon-Free Energy Compact GuideBook; Technical Report; United Nations: New York, NY, USA, 2025. [Google Scholar]
  2. Tian, X.; An, C.; Chen, Z. The role of clean energy in achieving decarbonization of electricity generation, transportation, and heating sectors by 2050: A meta-analysis review. Renew. Sustain. Energy Rev. 2023, 182, 113404. [Google Scholar] [CrossRef]
  3. Alwaeli, M.F.; Galvani, S.; Talavat, V. Addressing power quality challenges in hybrid renewable energy systems through STATCOM devices and advanced gray wolf optimization technique. Results Eng. 2025, 25, 104405. [Google Scholar] [CrossRef]
  4. Jeyaraj, T.; Ponnusamy, A.; Selvaraj, D. Hybrid renewable energy systems stability analysis through future advancement technique: A review. Appl. Energy 2025, 383, 125355. [Google Scholar] [CrossRef]
  5. Muzammal Islam, M.; Yu, T.; Giannoccaro, G.; Mi, Y.; La Scala, M.; Rajabi Nasab, M.; Wang, J. Improving Reliability and Stability of the Power Systems: A Comprehensive Review on the Role of Energy Storage Systems to Enhance Flexibility. IEEE Access 2024, 12, 152738–152765. [Google Scholar] [CrossRef]
  6. Hernández-Mayoral, E.; Madrigal-Martínez, M.; Mina-Antonio, J.D.; Iracheta-Cortez, R.; Enríquez-Santiago, J.A.; Rodríguez-Rivera, O.; Martínez-Reyes, G.; Mendoza-Santos, E. A Comprehensive Review on Power-Quality Issues, Optimization Techniques, and Control Strategies of Microgrid Based on Renewable Energy Sources. Sustainability 2023, 15, 9847. [Google Scholar] [CrossRef]
  7. Georgious, R.; Refaat, R.; Garcia, J.; Daoud, A.A. Review on Energy Storage Systems in Microgrids. Electronics 2021, 10, 2134. [Google Scholar] [CrossRef]
  8. Choudhury, S. Review of energy storage system technologies integration to microgrid: Types, control strategies, issues, and future prospects. J. Energy Storage 2022, 48, 103966. [Google Scholar] [CrossRef]
  9. Elalfy, D.A.; Gouda, E.; Kotb, M.F.; Bureš, V.; Sedhom, B.E. Comprehensive review of energy storage systems technologies, objectives, challenges, and future trends. Energy Strategy Rev. 2024, 54, 101482. [Google Scholar] [CrossRef]
  10. Fotopoulou, M.; Pediaditis, P.; Skopetou, N.; Rakopoulos, D.; Christopoulos, S.; Kartalidis, A. A Review of the Energy Storage Systems of Non-Interconnected European Islands. Sustainability 2024, 16, 1572. [Google Scholar] [CrossRef]
  11. Rekioua, D. Energy Storage Systems for Photovoltaic and Wind Systems: A Review. Energies 2023, 16, 3893. [Google Scholar] [CrossRef]
  12. Mitali, J.; Dhinakaran, S.; Mohamad, A. Energy storage systems: A review. Energy Storage Sav. 2022, 1, 166–216. [Google Scholar] [CrossRef]
  13. Almusawi, M.; Shukla, A.; S, H.; Kavitha, P.; Gambhire, G.; Pardeshi, P.R.; Pragathi, B. Comparative Analysis of Supercapacitors vs. Batteries. E3S Web Conf. 2024, 591, 01010. [Google Scholar] [CrossRef]
  14. Libich, J.; Sedlaříková, M.; Máca, J.; Čudek, P.; Kazda, T.; Fafilek, G.; Rodríguez, J.J.S. Supercapacitors vs. Lithium-ion Batteries: Properties and Applications. Chem. Ing. Tech. 2024, 96, 279–285. [Google Scholar] [CrossRef]
  15. Vukajlović, N.; Milićević, D.; Dumnić, B.; Popadić, B. Comparative analysis of the supercapacitor influence on lithium battery cycle life in electric vehicle energy storage. J. Energy Storage 2020, 31, 101603. [Google Scholar] [CrossRef]
  16. Aruna, P.; Vasan Prabhu, V.; Krishnakumar, V. Innovative optimization of hybrid energy storage systems for electric vehicles: Integrating FBPINN-SAO to enhance performance and efficiency. J. Energy Storage 2025, 108, 115021. [Google Scholar] [CrossRef]
  17. Blanch-Fortuna, A.; Zambrano-Prada, D.; López-Santos, O.; Aroudi, A.E.; Vázquez-Seisdedos, L.; Martinez-Salamero, L. Hierarchical Control of Power Distribution in the Hybrid Energy Storage System of an Ultrafast Charging Station for Electric Vehicles. Energies 2024, 17, 1393. [Google Scholar] [CrossRef]
  18. Hylla, P.; Trawiński, T.; Polnik, B.; Burlikowski, W.; Prostański, D. Overview of Hybrid Energy Storage Systems Combined with RES in Poland. Energies 2023, 16, 5792. [Google Scholar] [CrossRef]
  19. Hussain, S.; Ali, M.U.; Park, G.S.; Nengroo, S.H.; Khan, M.A.; Kim, H.J. A Real-Time Bi-Adaptive Controller-Based Energy Management System for Battery–Supercapacitor Hybrid Electric Vehicles. Energies 2019, 12, 4662. [Google Scholar] [CrossRef]
  20. Jauch Quartz. Jauch Battery Solutions-LI NCR18650-BF 2s1p; Datasheet 246480; Jauch Quartz GmbH: Villingen-Schwenningen, Germany, 2021. [Google Scholar]
  21. Jauch Quartz. Lithium-Ion Cell-LI INR21700JD-50E Energy Type; Datasheet 252240; Jauch Quartz GmbH: Villingen-Schwenningen, Germany, 2024. [Google Scholar]
  22. Varta. Easy Blade 24; Datasheet VKB: 56654 799 098; Varta Storage GmbH: Nördlingen, Germany, 2022. [Google Scholar]
  23. GlobTek. 1S5P Lithium-Ion Polymer Battery Pack with Built-in PCM, NTC(10K), Fuel Gauge, 5Cells, 3.7 Volts@9100mAh; Datasheet BL1880F6835661S5PX9M; GlobTek Inc.: Northvale, NJ, USA, 2023. [Google Scholar]
  24. Fedco Batteries. Lithium-Ion Rechargeable Battery Pack Model No DR202E; Datasheet DR202E; JFedco Batteries: Wisconsin, MN, USA, 2019. [Google Scholar]
  25. Jauch Quartz. Jauch Battery Solutions-LI18650JLS HB 1s2p; Datasheet 250480; Jauch Quartz GmbH: Villingen-Schwenningen, Germany, 2022. [Google Scholar]
  26. Jauch Quartz. Jauch Battery Solutions-LI NCR18650-BF 1s2p; Datasheet 246479; Jauch Quartz GmbH: Villingen-Schwenningen, Germany, 2018. [Google Scholar]
  27. Jauch Quartz. Jauch Battery Solutions-LI NCR18650-BF 2s2p; Datasheet 246478; Jauch Quartz GmbH: Villingen-Schwenningen, Germany, 2018. [Google Scholar]
  28. Data Power. Polymer Li-Ion Rechargeable Battery DTP605068-3P; Datasheet E-SPE-1106-01; Shenzhen Data Power Technology Ltd.: Shenzhen, China, 2015. [Google Scholar]
  29. Jauch Quartz. Jauch Battery Solutions-LI21700JSV-50; Datasheet 251511; Jauch Quartz GmbH: Villingen-Schwenningen, Germany, 2022. [Google Scholar]
  30. Jauch Quartz. Jauch Battery Solutions-LI INR 21700 50E; Datasheet 248574; Jauch Quartz GmbH: Villingen-Schwenningen, Germany, 2022. [Google Scholar]
  31. US Electronics. USE-18650-3500PCB; Datasheet E-SPE-1106-01; US Electronics Inc.: Saint Louis, MO, USA, 2021. [Google Scholar]
  32. Tecate Group. Type TLC Hybrid Capacitor (LIC); Datasheet TPLC-3R8/10MR8X14; Tecate Group: San Diego, CA, USA, 2025. [Google Scholar]
  33. Tecate Group. Type TLC Hybrid Capacitor (LIC); Datasheet TPLC-3R8/30MR10X16; Tecate Group: San Diego, CA, USA, 2025. [Google Scholar]
  34. Eaton. HS/HSL Supercapacitors Hybrid Cylindrical Cells; Datasheet 11043; Eaton Electronics Division: Cleveland, OH, USA, 2025. [Google Scholar]
  35. Knowles. DGH Low ESR Supercapacitor; Datasheet DGH505Q5R5; Knowles Precision Devices: Cazenovia, NY, USA, 2024. [Google Scholar]
  36. Kyocera. Series-Connected Super Capacitor Modules; Datasheet TDS-SC-0004; Kyocera Avx: Fountain Inn, SC, USA, 2024. [Google Scholar]
  37. Tecate Group. Type TLC Hybrid Capacitor (LIC); Datasheet TPLC-3R8/70MR10X25; Tecate Group: San Diego, CA, USA, 2025. [Google Scholar]
  38. Maxwell. Ultracapacitor Module BMOD0002 P005 B02; Datasheet 3001961-EN.5; Maxwell Technologies, Inc.: San Diego, CA, USA, 2020. [Google Scholar]
  39. Kyocera. Radial Leaded Aluminum Electrolityc Capacitors RET Series; Datasheet TDS-ALUM-0027; Kyocera Avx: Fountain Inn, SC, USA, 2024. [Google Scholar]
  40. Kyocera. SMD Aluminum Conductive Polymer Electrolytic Capacitor APA Series; Datasheet TDS-ALUM-0005; Kyocera Avx: Fountain Inn, SC, USA, 2024. [Google Scholar]
  41. Kyocera. Radial Leaded Aluminum Hybrid Electrolytic Capacitors RHA Series; Datasheet TDS-ALUM-0016; Kyocera Avx: Fountain Inn, SC, USA, 2024. [Google Scholar]
  42. Kyocera. SMD Aluminum Electrolytic Capacitors AEA Series; Datasheet TDS-ALUM-0001; Kyocera Avx: Fountain Inn, SC, USA, 2024. [Google Scholar]
  43. Fang, Z.; Shek, J.K.; Sun, W. A review of grid-connected hybrid energy storage systems: Sizing configurations, control strategies, and future directions. J. Energy Storage 2025, 118, 116226. [Google Scholar] [CrossRef]
  44. Urooj, A.; Nasir, A. Review of Hybrid Energy Storage Systems for Hybrid Electric Vehicles. World Electr. Veh. J. 2024, 15, 342. [Google Scholar] [CrossRef]
  45. Nkwanyana, T.B.; Siti, M.W.; Wang, Z.; Toudjeu, I.; Mbungu, N.T.; Mulumba, W. An assessment of hybrid-energy storage systems in the renewable environments. J. Energy Storage 2023, 72, 108307. [Google Scholar] [CrossRef]
  46. Atawi, I.E.; Al-Shetwi, A.Q.; Magableh, A.M.; Albalawi, O.H. Recent Advances in Hybrid Energy Storage System Integrated Renewable Power Generation: Configuration, Control, Applications, and Future Directions. Batteries 2022, 9, 29. [Google Scholar] [CrossRef]
  47. Alkafaji, A.S.; Al-Samawi, A.A.; Trabelsi, H. Hybrid Energy Storage Review for Renewable Energy System Technologies and Applications. In Proceedings of the 2021 18th International Multi-Conference on Systems, Signals & Devices (SSD), Monastir, Tunisia, 22–25 March 2021; pp. 1059–1067. [Google Scholar] [CrossRef]
  48. Babu, T.S.; Vasudevan, K.R.; Ramachandaramurthy, V.K.; Sani, S.B.; Chemud, S.; Lajim, R.M. A Comprehensive Review of Hybrid Energy Storage Systems: Converter Topologies, Control Strategies and Future Prospects. IEEE Access 2020, 8, 148702–148721. [Google Scholar] [CrossRef]
  49. Devillers, N.; Jemei, S.; Péra, M.C.; Bienaimé, D.; Gustin, F. Review of characterization methods for supercapacitor modelling. J. Power Sources 2014, 246, 596–608. [Google Scholar] [CrossRef]
  50. Kopka, R.; Tarczyński, W. Measurement System for Determination of Supercapacitor Equivalent Parameters. Metrol. Meas. Syst. 2013, 20, 581–590. [Google Scholar] [CrossRef]
  51. Venable. 63XX Frequency Response Analyzer; Data Sheet 09052024; Venable Instruments: Austin, TX, USA, 2025. [Google Scholar]
  52. Kroics, K.; Gaspersons, K.; Zdanowski, M. Modular DC-DC Converter with Adaptable Fast Controller for Supercapacitor Energy Storage Integration into DC Microgrid. Electronics 2025, 14, 700. [Google Scholar] [CrossRef]
  53. Shen, C.; Wang, C. State-of-charge estimation for supercapacitors based on salp swarm algorithm-optimized high and low degree cubature Kalman filters considering temperature uncertainty. Electrochim. Acta 2024, 485, 144116. [Google Scholar] [CrossRef]
  54. Ma, N.; Yang, D.; Riaz, S.; Wang, L.; Wang, K. Aging Mechanism and Models of Supercapacitors: A Review. Technologies 2023, 11, 38. [Google Scholar] [CrossRef]
  55. Cabrane, Z.; Lee, S.H. Electrical and Mathematical Modeling of Supercapacitors: Comparison. Energies 2022, 15, 693. [Google Scholar] [CrossRef]
  56. Kroics, K.; Stana, G. Bidirectional Interleaved DC–DC Converter for Supercapacitor Energy Storage Integration with Reduced Capacitance. Electronics 2022, 12, 126. [Google Scholar] [CrossRef]
  57. Şahİn, M.E.; Blaabjerg, F.; Sangwongwanİch, A. Modelling of Supercapacitors Based on Simplified Equivalent Circuit. CPSS Trans. Power Electron. Appl. 2021, 6, 31–39. [Google Scholar] [CrossRef]
  58. Zhang, L.; Hu, X.; Wang, Z.; Sun, F.; Dorrell, D.G. A review of supercapacitor modeling, estimation, and applications: A control/management perspective. Renew. Sustain. Energy Rev. 2018, 81, 1868–1878. [Google Scholar] [CrossRef]
  59. Jakubowska-Ciszek, A.; Walczak, J. Analysis of the transient state in circuit with supercapacitor. Pozn. Univ. Technol. Acad. J. Electr. Eng. 2015, 81, 71–77. [Google Scholar]
  60. Li, W.; Huang, Q.; Bai, Y.; Wang, J.; Wang, L.; Liu, Y.; Zhao, Y.; Li, X.; Zhang, J. Model reduction of fractional impedance spectra for time–frequency analysis of batteries, fuel cells, and supercapacitors. Carbon Energy 2024, 6, e360. [Google Scholar] [CrossRef]
  61. Naseri, F.; Karimi, S.; Farjah, E.; Schaltz, E. Supercapacitor management system: A comprehensive review of modeling, estimation, balancing, and protection techniques. Renew. Sustain. Energy Rev. 2022, 155, 111913. [Google Scholar] [CrossRef]
  62. Nguyen, T.Q.; Breitkopf, C. Determination of Diffusion Coefficients Using Impedance Spectroscopy Data. J. Electrochem. Soc. 2018, 165, E826–E831. [Google Scholar] [CrossRef]
  63. Randles, J.E.B. Kinetics of rapid electrode reactions. Discuss. Faraday Soc. 1947, 1, 11. [Google Scholar] [CrossRef]
  64. Logerais, P.; Camara, M.; Riou, O.; Djellad, A.; Omeiri, A.; Delaleux, F.; Durastanti, J. Modeling of a supercapacitor with a multibranch circuit. Int. J. Hydrogen Energy 2015, 40, 13725–13736. [Google Scholar] [CrossRef]
  65. Nelms, R.; Cahela, D.; Tatarchuk, B. Modeling double-layer capacitor behavior using ladder circuits. IEEE Trans. Aerosp. Electron. Syst. 2003, 39, 430–438. [Google Scholar] [CrossRef]
  66. Ates, M.; Chebil, A. Supercapacitor and battery performances of multi-component nanocomposites: Real circuit and equivalent circuit model analysis. J. Energy Storage 2022, 53, 105093. [Google Scholar] [CrossRef]
  67. Sofia, J.; Wilson, K.J. Electrical circuit modeling of photo–supercapacitor using Zubieta–Bonert model. Optik 2022, 251, 168448. [Google Scholar] [CrossRef]
  68. Faranda, R. A new parameters identification procedure for simplified double layer capacitor two-branch model. Electr. Power Syst. Res. 2010, 80, 363–371. [Google Scholar] [CrossRef]
  69. Navarro, G.; Nájera, J.; Torres, J.; Blanco, M.; Santos, M.; Lafoz, M. Development and Experimental Validation of a Supercapacitor Frequency Domain Model for Industrial Energy Applications Considering Dynamic Behaviour at High Frequencies. Energies 2020, 13, 1156. [Google Scholar] [CrossRef]
  70. Buller, S.; Karden, E.; Kok, D.; De Doncker, R. Modeling the dynamic behavior of supercapacitors using impedance spectroscopy. IEEE Trans. Ind. Appl. 2002, 38, 1622–1626. [Google Scholar] [CrossRef]
  71. Ramu, S.K.; Vairavasundaram, I.; Aljafari, B.; Kareri, T. Design of PV, Battery, and Supercapacitor-Based Bidirectional DC-DC Converter Using Fuzzy Logic Controller for HESS in DC Microgrid. J. Electr. Comput. Eng. 2024, 2024, 1–16. [Google Scholar] [CrossRef]
  72. Montenegro-Oviedo, J.A.; Ramos-Paja, C.A.; Orozco-Gutierrez, M.L.; Franco-Mejía, E.; Serna-Garcés, S.I. Design and Experimental Validation of a Battery/Supercapacitor Hybrid Energy Storage System Based on an Adaptive LQG Controller. Appl. Syst. Innov. 2024, 8, 1. [Google Scholar] [CrossRef]
  73. Maxwell. BMOD0058 E016 B02-16V Small Cell Module; Datasheet 1015371.6; Maxwell Technologies: San Diego, CA, USA, 2014. [Google Scholar]
  74. IEC 62391-2; Fixed Electric Double-Layer Capacitors for Use in Electronic Equipment-Part 2: Sectional Specification-Electric Double Layer Capacitors for Power Application. International Electrotechnical Commission: Geneva, Switzerland, 2006.
  75. Lazanas, A.C.; Prodromidis, M.I. Electrochemical Impedance Spectroscopy A Tutorial. ACS Meas. Sci. Au 2023, 3, 162–193. [Google Scholar] [CrossRef]
  76. Gerard, O.; Numan, A.; Krishnan, S.; Khalid, M.; Subramaniam, R.; Kasi, R. A review on the recent advances in binder-free electrodes for electrochemical energy storage application. J. Energy Storage 2022, 50, 104283. [Google Scholar] [CrossRef]
  77. USB Implementers Forum Inc. Universal Serial Bus-Power Delivery Specification; Standard USB Power Delivery, Revision 3.2, Version 1.1; USB Implementers Forum Inc.: Beaverton, OR, USA, 2024. [Google Scholar]
  78. Nichicon. Aluminum-Polymer Capacitor RDS1C470MCNAFEGS; Datasheet RDS; Nichicon: Kyoto, Japan, 2022. [Google Scholar]
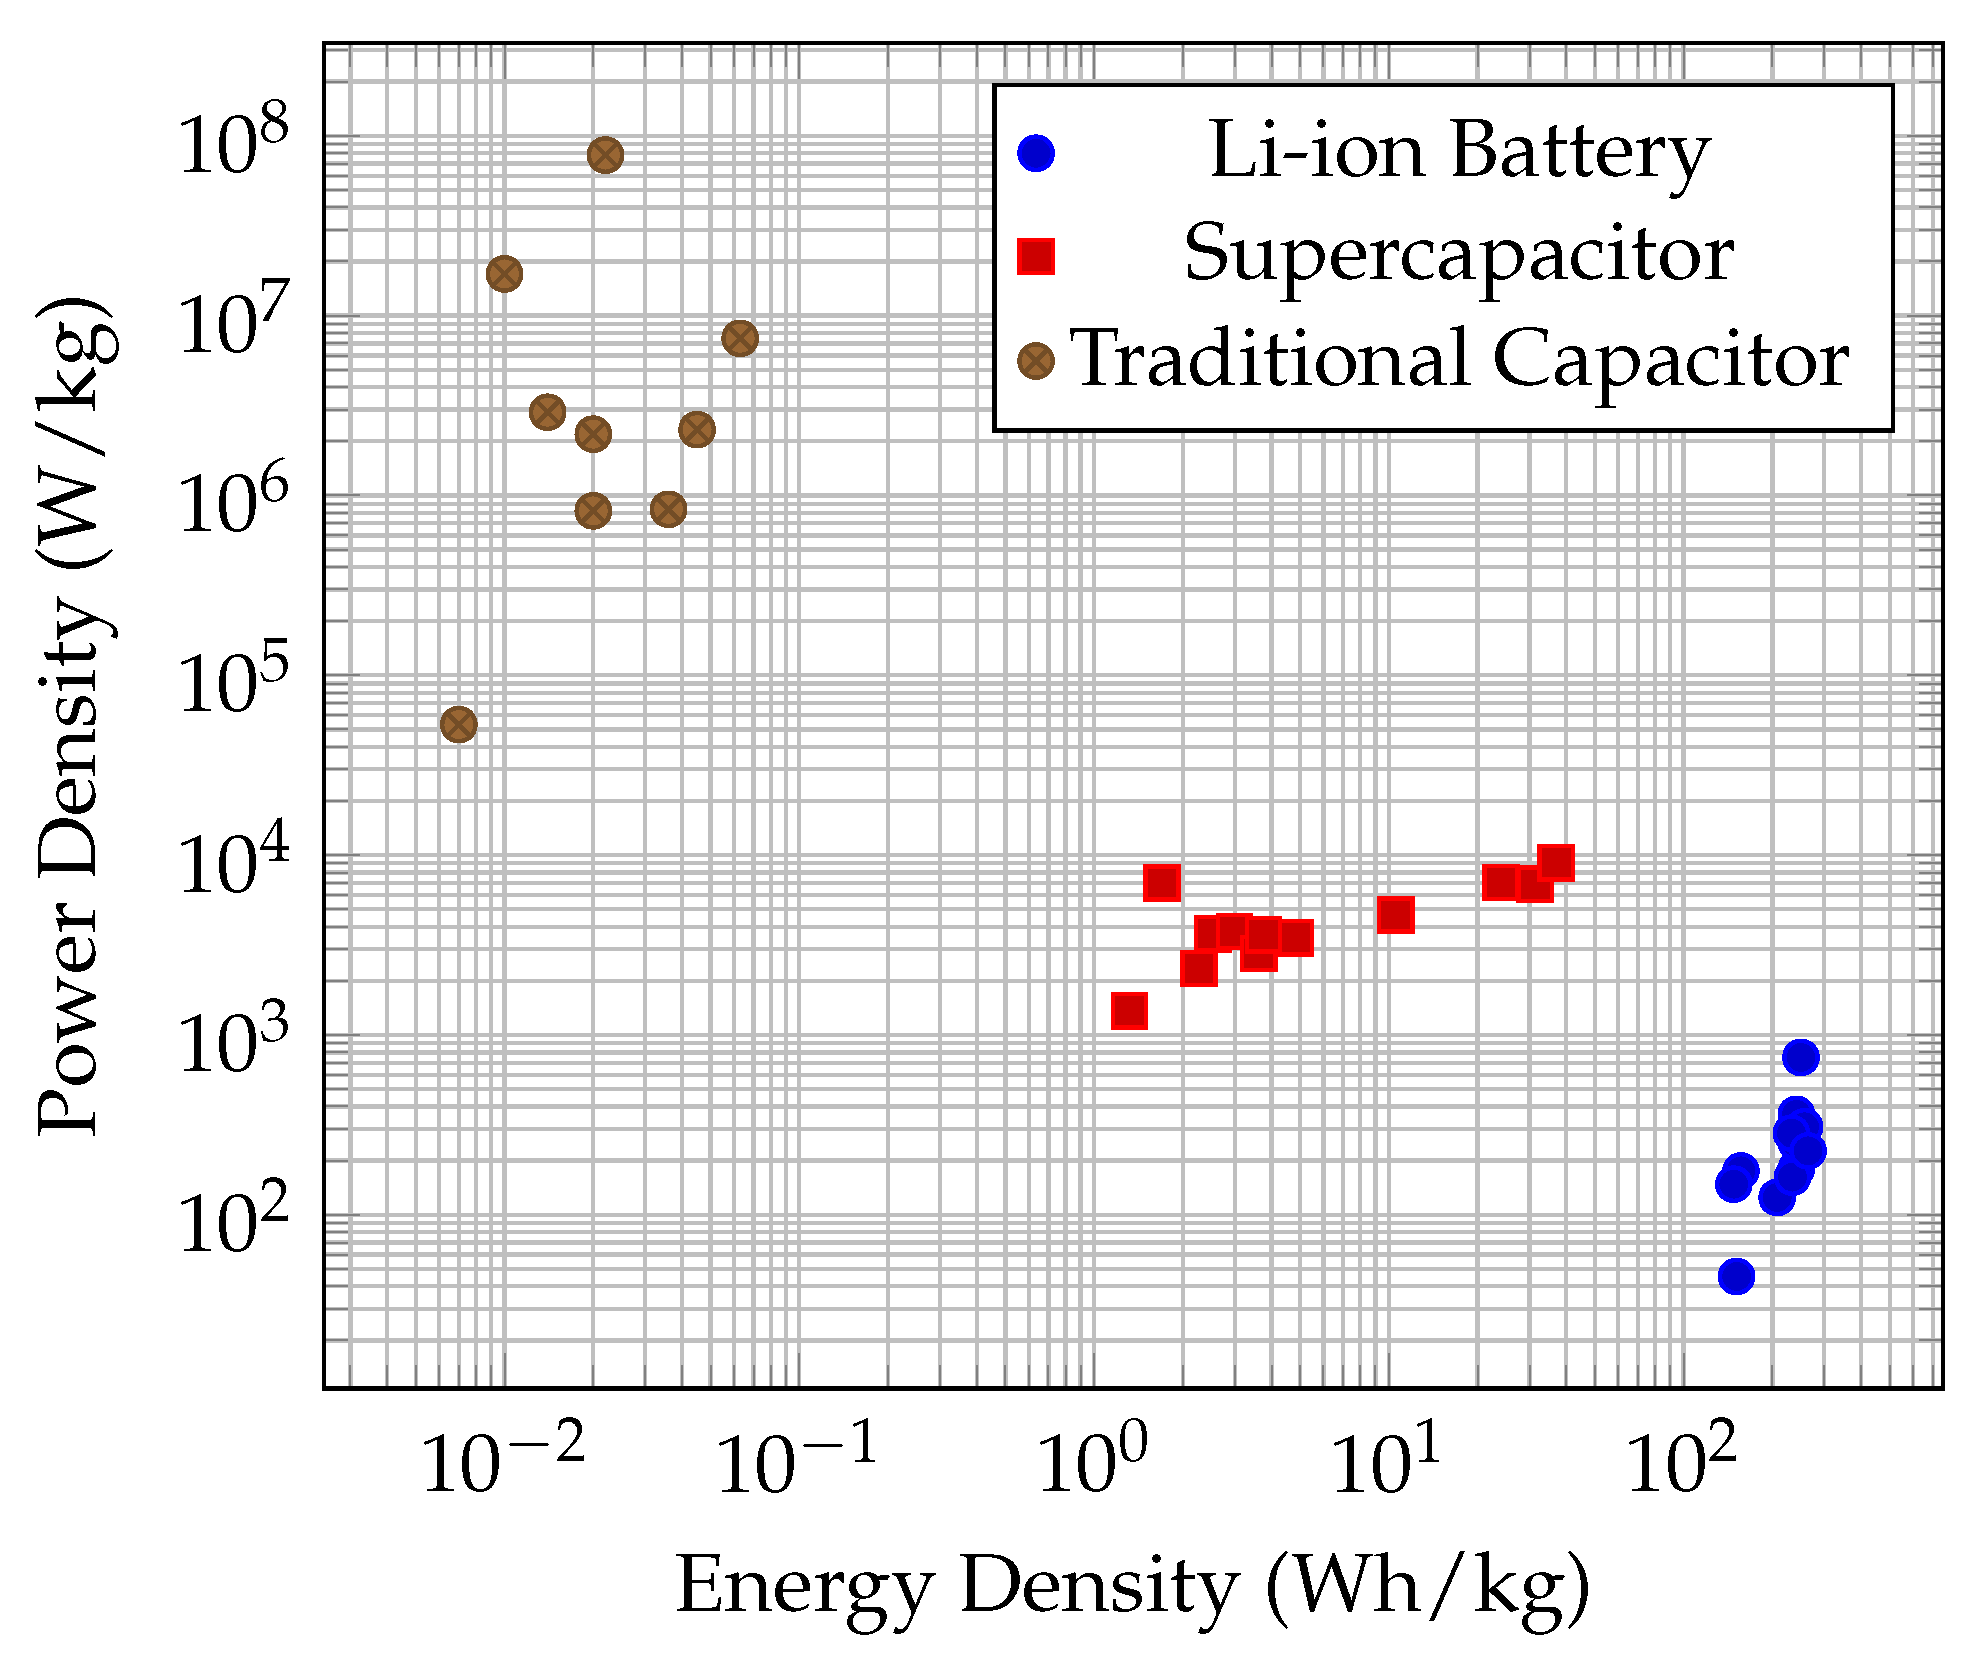
Figure 1. Ragone diagram of some commercial SCs, lithium-ion batteries, and traditional capacitors.
Batteries 11 00307 g001
Figure 2. ESR and capacitance deviations at positive temperatures reported by the manufacturer of the supercapacitor BMOD0058-E016-B02.
Batteries 11 00307 g002
Figure 3. Experimental setup for the supercapacitor characterization.
Batteries 11 00307 g003
Figure 4. Experimental frequency response of two BMOD0058-E016-B02 supercapacitors from 0.01 Hz to 300 kHz.
Batteries 11 00307 g004
Figure 5. Main components of the circuital equivalent.
Batteries 11 00307 g005
Figure 6. Frequency response of R-L-C circuit.
Batteries 11 00307 g006
Figure 7. Polar Nyquist plot of R-L-C circuit: blue asterisks report the experimental data, red line reports the simulation of the R-L-C model.
Batteries 11 00307 g007
Figure 8. Performance of the polynomial approximations of the Warburg impedance.
Batteries 11 00307 g008
Figure 9. Circuital implementation of the Warburg impedance approximations.
Batteries 11 00307 g009
Figure 10. Complete circuital equivalent.
Batteries 11 00307 g010
Figure 11. Polar Nyquist plot of the complete circuital equivalent: blue asterisks report the experimental data, red line reports the simulation of the complete circuital equivalent.
Batteries 11 00307 g011
Figure 12. Controlled Zeta converter regulating a load and supercapacitor voltage.
Batteries 11 00307 g012
Figure 13. Simulations of the example with classical R-C circuit and the complete circuital equivalent.
Batteries 11 00307 g013
Figure 14. Power system for USB power supply.
Batteries 11 00307 g014
Figure 15. Ripple simulations with classical R-C circuit and the complete circuital equivalent.
Batteries 11 00307 g015
Table 1. Main characteristics of SCs, lithium-ion batteries, and traditional capacitors.
ParameterSCsLi-Ion BatteryCapacitors
Power density (W/kg)1000–10,000200–500104–105
Energy density (Wh/kg)1–10100–265<0.1
Life cycles105–106500–2000> 5 × 10 5
Efficiency85– 98 % 80 % 95 % > 95 %
Charge/discharge times to minmin to h μ s to s
Table 2. Energy density (ED) and power density (PD) of some commercial batteries, supercapacitors, and traditional capacitors.
TypeReferenceED (W-h/kg)PD (W/kg)
BatteryLI18650JP2S1P [20]241.2361.8
LI INR21700JD-50E [21]250750
56654 799 098 [22]156.48175.35
BL1880F6835661S5PX9M [23]151.2245.37
DR202E [24]207.61124.79
LI18650JLS HB 1S2P [25]241.2180
LI18650JP1S2P [26]234162
LI18650JP2S2P [27]241.2252
DTP605068-3P [28]148148
LI21700JSV-50 [29]257.14308.57
LI INR21700 50E [30]232.11284.21
USE-18650-3500PCB [31]264.29226.53
SupercapacitorTPLC-3R8/10MR8X14 [32]10.564642.11
TPLC-3R8/30MR10X16 [33]24.017056
HS1020-3R8506-R [34]31.346890.63
DGH505Q5R5 [35]2.533650
DGH335Q8R1 [35]3.003750
DGH107Q2R7 [35]4.823471
DGH506Q2R7 [35]3.622840
SCMR22L105SRBB0 [36]2.272338
SCMT32H755SSBB0 [36]3.753600
TPLC-3R8/70MR10X25 [37]36.949047.62
BMOD0002 P005 B02 [38]1.707000
Traditional
Capacitor
RET0820152M010B [39]19.84−3821.02 × 103
RET0820391M035# [39]63.19 × 10−37478.63 × 103
APA1012821M016# [40]19.97−32191.78 ×103
APA0809100M100# [40]21.70−378,125 ×103
RHA1011561M016# [41]13.55−32902.49 ×103
RHA1009150M080# [41]9.95−317,057.57 ×103
AEA1616682M006R [42]7.03−353.19 ×10³
AEA1616222M025R [42]35.83−3837.58 ×103
AEA1213221M063R [42]45.42−32322.68 ×103
Table 3. Circuital equivalents for SCs.
NameCircuital EquivalentCharacteristics
Simple R-C [49,52,53,54,55,56,57,58,59]Batteries 11 00307 i001Analysis and implementation simplicity. It does not include diffusion effects, voltage dependency, or leakage effects.
Randles [60,61,62,63]Batteries 11 00307 i002It incorporates electrode–electrolyte interface effects and charge transfer processes. More accurate than the simple R-C model, especially for capturing dynamic and impedance phenomena.
Ladder R-C [64,65]Batteries 11 00307 i003Used to represent the physical phenomenon of the progressive penetration of ions into the porous structure of the electrodes. Good accuracy at mid-high frequencies. Slower simulations and does not capture self-relaxation and leakage.
Zubieta [57,61,66,67,68]Batteries 11 00307 i004Captures ionic diffusion effects. Complex parameterization on real systems.
TLM [54,61]Batteries 11 00307 i005Ideal for physical modeling of electrolyte. Computationally intensive. Impractical for real-time simulations.
Table 4. Coefficients for the polynomial Warburg approximation given in (2).
Order (n) a 0 a n b 0 b n
13, 11, 3
25, 10, 11, 10, 5
37, 35, 21, 11, 21, 35, 7
49, 84, 126, 36, 11, 36, 126, 84, 9
511, 165, 452, 330, 55, 11, 55, 330, 462, 165, 11
Table 5. Parameters for the circuital approximation of a unitary Warburg impedance.
Order (n)ResistorsCapacitors
3 R 0 = 0.1443 Ω ,
R 1 = 5.7723 Ω ,
R 2 = 0.7360 Ω ,
R 3 = 0.3536 Ω
C 1 = 3.3262 F ,
C 2 = 2.1399 F ,
C 3 = 0.6597 F
4 R 0 = 0.1118 Ω ,
R 1 = 7.3597 Ω ,
R 2 = 0.8875 Ω ,
R 3 = 0.3788 Ω ,
R 4 = 0.2525 Ω
C 1 = 4.3657 F ,
C 2 = 3.3761 F ,
C 3 = 1.8599 F ,
C 4 = 0.5267 F
5 R 0 = 0.0902 Ω ,
R 1 = 8.9831 Ω ,
R 2 = 1.0534 Ω ,
R 3 = 0.4257 Ω ,
R 4 = 0.2561 Ω ,
R 5 = 0.1984 Ω
C 1 = 5.3885 F ,
C 2 = 4.5514 F ,
C 3 = 3.1405 F ,
C 4 = 1.6077 F ,
C 5 = 0.4352 F
Table 6. Improvement of the complete equivalent circuit over the R-L-C circuit: e d is the average distance error, and e θ is the average angle error.
ZoneFrequency RangeImprovement over R-L-C Circuit
Capacitive0.01 Hz to 0.1 Hz e d reduced by 27%
e θ reduced by 37.23%
Resistive0.1 Hz to 3 kHz e d reduced by 4.5%
e θ reduced by 4.82%
Inductive3 kHz to 300 kHz e d reduced by 16.1%
e θ reduced by 36.45%
Disclaimer/Publisher’s Note: The statements, opinions and data contained in all publications are solely those of the individual author(s) and contributor(s) and not of MDPI and/or the editor(s). MDPI and/or the editor(s) disclaim responsibility for any injury to people or property resulting from any ideas, methods, instructions or products referred to in the content.