Article

Performance Analysis of Battery State Prediction Based on Improved Transformer and Time Delay Second Estimation Algorithm

1
School of Electrical Engineering, Shenyang University of Technology, Shenyang 110870, China
2
Department of Electrical Engineering, Hebei University of Water Resources and Electric Engineering, Cangzhou 061001, China
3
State Key Laboratory of Operation and Control of Renewable Energy and Storage Systems, China Electric Power Research Institute, Beijing 100192, China
*
Author to whom correspondence should be addressed.
Batteries 2025, 11(7), 262; https://doi.org/10.3390/batteries11070262
Submission received: 18 May 2025 / Revised: 28 June 2025 / Accepted: 10 July 2025 / Published: 13 July 2025

Abstract

As energy storage technology advances rapidly, the power industry demands accurate state estimation of lithium batteries in energy storage power stations. This study aimed to improve such estimations. An improved Transformer structure was employed to estimate the battery’s state of charge (SOC). The Time Delay Second Estimation (TDSE) algorithm optimized the improved Transformer model to overcome traditional models’ limitations in extracting long-term dependency. Innovative particle filter algorithms were proposed to handle the nonlinearity, uncertainty, and dynamic changes in predicting remaining battery life. Results showed that for LiNiMnCoO2 positive electrode datasets, the model’s max SOC estimation error was 2.68% at 10 °C and 2.15% at 30 °C. For LiFePO4 positive electrode datasets, the max error was 2.79% at 10 °C (average 1.25%) and 2.35% at 30 °C (average 0.94%). In full lifecycle calculations, the particle filter algorithm predicted battery capacity with 98.34% accuracy and an RMSE of 0.82%. In conclusion, the improved Transformer and TDSE algorithm enable advanced battery state prediction, and the particle filter algorithm effectively predicts remaining battery life, enhancing the adaptability and robustness of lithium battery state analysis and offering technical support for energy storage station management.

1. Introduction

The extensive deployment of renewable energy sources has rendered energy storage systems a crucial component of the power system. A lithium battery (LIB) energy storage system can effectively regulate the balance of power supply and demand, thereby stabilizing the operation of the power grid [1,2]. At present, accurate prediction of the state of charge (SOC) and remaining life (RL) of LIB in energy storage power plants has become one of the key challenges for their reliable operation. Accurate state-of-charge estimation (SOCE) and remaining life prediction (RLP) are beneficial for improving battery efficiency, extending its lifespan, and avoiding system failures caused by battery performance degradation or abnormalities. Therefore, it is necessary to explore advanced prediction methods to raise the accuracy of SOC estimation [3]. In recent years, scholars from around the globe have put forth a multitude of methodologies for estimating the SOC of batteries. These include model-based estimation techniques, data-driven prediction methods, and direct measurement approaches. Among these methods, model-based estimation techniques primarily depend on a comprehensive understanding of the battery’s operational principles, employing sensors to gather data such as temperature, current, and voltage. After data processing, the working state and reaction of the battery are analyzed. Common models contain Kalman electrochemical models and other similar models [4]. The direct measurement method monitors various physical quantities of the battery during charging and discharging through built-in sensors and then calculates the state of the LIB using corresponding mathematical models. Direct measurement techniques are relatively straightforward, comprising methods such as ampere-hour integration. In contrast, the data-driven estimation method does not necessitate an in-depth comprehension of the internal reaction principles of the battery; rather, it employs a data-driven approach to estimate the battery’s performance by studying the relationships between data points. This method regards the complex reaction process of the battery as a “black box system”, trains the black box by collecting physical data, and establishes a mapping relationship between input parameters and estimated SOC values [5].
Numerous scholars have conducted extensive research on the state-of-charge estimation and lifespan prediction of lithium-ion batteries. In terms of SOC estimation, Xu et al. [6] proposed an adaptive dual extended Kalman filter algorithm based on equivalent circuit model and online parameter identification, which achieved coordinated estimation of state of charge. The maximum error of state-of-charge estimation was only 2.03%, and the maximum error of Ohmic resistance was 15.3%. Wang et al. [7] proposed an adaptive square root volume Kalman filtering method based on the particle swarm optimization algorithm, which controls the relative error of SOC estimation within 0.5%. The root mean square error and average absolute error under dynamic stress testing are only 0.0019 and 0.0017, respectively. At the same time, an online corrected square root untracked Kalman filter method was proposed to reduce SOC simulation error to less than 2.36%, voltage simulation error to less than 0.04 V, and peak power estimation error to only 66 W. In terms of battery life prediction, Shu et al. [8] proposed a prediction scheme that uses the voltage range during charging as a health feature to quantify battery capacity degradation. Combined with long short-term memory neural networks and transfer learning techniques, the prediction error of battery health status is less than 3%. Cong et al. [9] proposed a residual life mixed prediction method that considers error correction. This method has high accuracy in predicting residual life under different working conditions, and the average absolute percentage error of capacity decay is less than 0.4%. In terms of battery behavior prediction, Tran M K et al. [10] proposed a machine learning-based battery behavior prediction method and compared various machine learning regression models. The model based on decision trees showed the best performance, with an R2 score of 0.99. In terms of improving modeling methods, Naseri et al. [11] proposed an efficient modeling method based on the Wiener structure, which combines a linear equivalent circuit model and static output nonlinear module. Compared with the traditional second-order equivalent circuit model, the accuracy of charging state estimation has been improved by about 1.5%. These studies have explored the SOC estimation and lifespan prediction of lithium-ion batteries from different perspectives, using various methods and techniques, and have achieved varying degrees of results. However, in practical applications, it is still necessary to comprehensively consider the advantages, disadvantages, and applicable scenarios of various methods and to further optimize and improve them.
In the field of SOC prediction and related applications of lithium batteries, the application of Transformer models is gradually receiving attention. Liu et al. [12] applied the Transformer model to an integrated voltage equalizer for high-voltage energy storage systems, which successfully achieved efficient voltage balancing in the application of nine series-connected battery cells while maintaining system scalability and simplified switch control. Zheng et al. [13] proposed a battery SOC prediction method based on the Transformer model to address the voltage fluctuation management and storage integration issues of solid-state transformers and hybrid transformers. By utilizing the self-attention mechanism of Transformer, the method accurately captures the dynamic changes of batteries under different working conditions, optimizes the scheduling of battery energy storage systems and battery health management, and effectively improves the accuracy of battery SOC prediction. Xu B et al. [14] proposed a bidirectional integrated equalizer based on the Sepic Zeta converter to address the problem caused by voltage differences between batteries and supercapacitors, and they combined it with the Transformer model to accurately estimate battery SOC, optimize the control strategy of the equalizer, and simplify the complexity of hybrid energy storage systems. The Transformer model demonstrates outstanding advantages in lithium battery SOC prediction and related applications, effectively improving prediction accuracy and system performance.
In summary, domestic and foreign researchers have conducted extensive research on battery state-of-charge estimation and life prediction and analyzed the application of Transformer models in this field. Currently, many researchers have applied Transformer models to battery state prediction, but the results are not satisfactory [15,16]. Meanwhile, traditional Transformer models have low prediction accuracy in practical applications when facing complex working conditions and external disturbances. In addition, many existing battery life prediction methods have failed to meet real-time requirements in practical applications, limiting their application in high-frequency battery management systems. High-frequency applications typically involve high C discharge and require staff to receive training on such data to ensure effective processing and analysis of complex battery state data at high frequencies. The core goal of an intelligent battery management system is to achieve high-precision, real-time, and adaptive battery SOC prediction, thereby optimizing battery efficiency and extending battery life. Therefore, this study optimized the traditional Transformer model structure. The core goal of an intelligent battery management system is to achieve high-precision, real-time, and adaptive battery SOC prediction, thereby optimizing battery efficiency and extending battery life. Therefore, this study optimized the traditional Transformer model structure. To achieve effective extraction of temporal information, this study proposed an improved Transformer model based on Time Delay Second Estimation (TDSE) and proposed the Transformer–TDSE model. In addition, a PF algorithm was proposed for the RLP of batteries, to promote the intelligent development of energy storage battery management systems. Among them, TDSE is a method that accurately captures the temporal dependencies and dynamic features of battery performance changes by performing two time delay analyses and feature extraction on battery data sequences, in order to optimize the processing capability of Transformer models for battery data.
Compared with the previous literature, this study introduced the TDSE algorithm into the Transformer model to accurately capture the time delay effect in battery SOC changes, optimized the Transformer model’s ability to handle long-term dependencies, and further improved the accuracy of SOC prediction. Meanwhile, in practical applications, batteries often face variable working environments such as temperature fluctuations, changes in charge and discharge rates, etc. Traditional Transformer models have low accuracy in these complex operating conditions. By combining TDSE, the Transformer–TDSE model can better adapt to these disturbance factors, enhance the robustness of the model to different operating conditions and external disturbances, and further improve the prediction accuracy in complex environments. In addition, it is difficult for traditional methods for predicting the remaining life of batteries to cope with the nonlinearity and uncertainty issues that exist during the battery degradation process. By introducing the PF algorithm, this study can accurately predict the health status of batteries under different charging and discharging conditions, significantly improving the accuracy and stability of battery RLP. The innovation of this research lies in optimizing the traditional Transformer model and combining it with the TDSE algorithm to achieve accurate SOCE. At the same time, a PF algorithm is proposed for predicting the RL of LIBs, effectively addressing the uncertainty and nonlinear characteristics that exist during the degradation of battery performance. The integration of two methodologies enhances the accuracy and reliability of battery management system predictions in energy storage power plants.

2. Methods and Materials

The SOCE and RLP of LIBs in energy storage power stations take a critical part in improving the performance of battery management systems, extending battery life, and ensuring grid stability and energy efficiency. A Transformer model is proposed for the SOCE of LIBs, and its structure is optimized. The time series data of the model is constructed using a combination of time delay quadratic estimation algorithms, and a Transformer–TDSE model is proposed. In addition, the PF algorithm is introduced for predicting the RL to dynamically track the degradation trend of battery health status.

2.1. Constructing Neural Network Model with Improved Transformer Structure

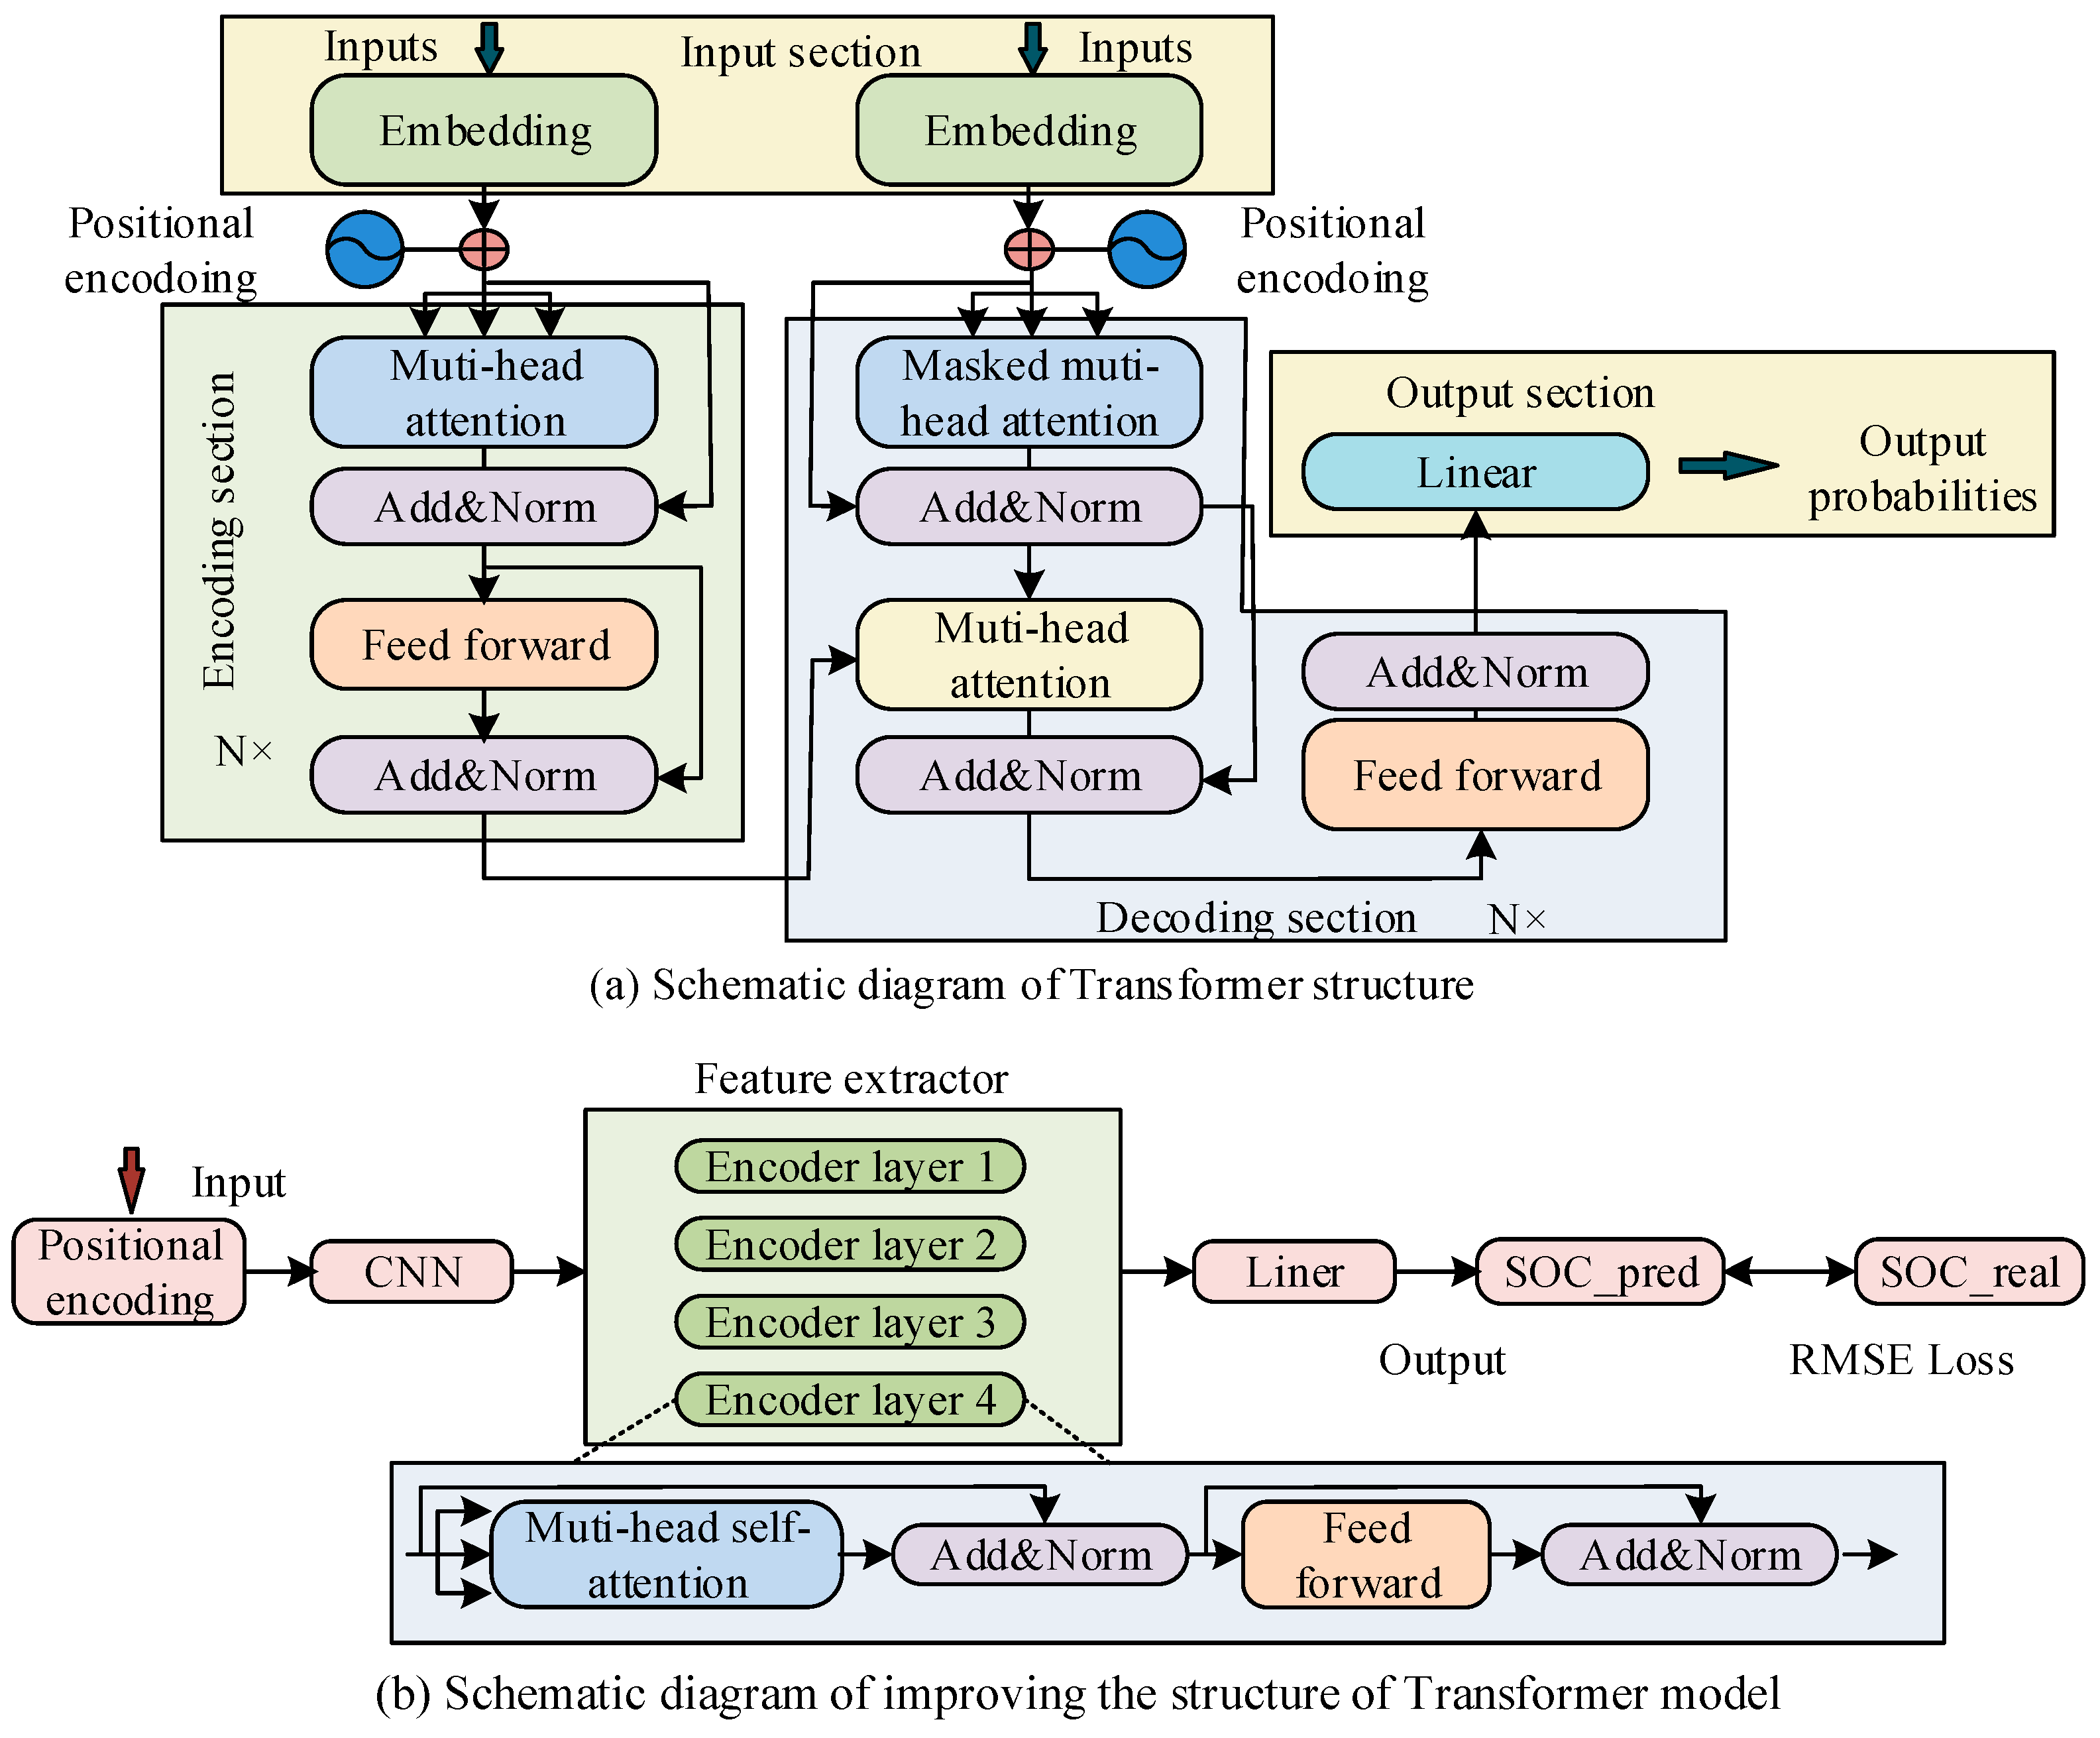
In the state estimation method of LIBs in energy storage power plants, it is difficult for conventional recurrent neural network algorithms to handle long sequence problems, and they cannot capture the dependency relationships involved. Especially in low-temperature conditions, conventional algorithms are unable to accurately estimate the SOC and have poor adaptability [17,18]. For this type of problem, the Transformer model is introduced, which mainly uses a SAM as the core to precisely predicate the SOC in long sequence patterns. The structure of Transformer is an encoder–decoder, which includes the input part, encoding part, decoding part, and output part [19]. Figure 1a denotes the schematic structure of the Transformer model.
As shown in Figure 1a, the input of the Transformer model is transmitted to the encoder–decoder through positional encoding. The encoder consists of N stacked layers, each layer containing a multi-head SAM and a feedforward neural network, and it employs residual connections and layer normalization. The decoder is also composed of N stacked layers. In addition to the above mechanism, it also adds a multi-head attention sublayer for processing the encoder output and performs masking processing [20,21]. To better handle long time series data, improvements have been made to the basic Transformer model structure. Improving the Transformer model includes six parts: input, position encoding, local feature extraction, encoder stacking layer, fully connected layer, and output prediction. Figure 1b denotes the schematic structure of the improved Transformer model. In the natural language processing, the input data for Transformer models is word vectors, which transform the original word representations into linear combinations of features through input embedding methods. The CNN structure is used in Figure 1b because the time series data of lithium batteries are essentially one-dimensional signals, and their local fluctuations contain rich dynamic features. The convolution operation of CNN can extract local correlations of temporal data through sliding windows, reducing the number of parameters by 70% compared to fully connected layers. At the same time, the weight sharing mechanism of one-dimensional convolution kernels can effectively suppress overfitting, making it more suitable for the non-stationary characteristics of battery data. When determining the parameters of the model, the kernel size is determined to be 3 and the step size is 1 through cross validation to preserve complete temporal information and avoid feature loss. The layers are stacked using two-layer convolution, with the first layer extracting basic features and the second layer fusing multi-scale features. In the setting of sliding window parameters, the window size is mainly set to 128, covering the battery thermal time constant. The step size is set to 16 to balance real-time performance and data overlap rate. When the sampling rate is 1 Hz, the 128-point sequence corresponds to 128 s, meeting the feature capture requirements under dynamic stress testing conditions.
In Figure 1b, in the input part of the improved Transformer model, the voltage, current, and temperature in the time series are mainly used as input data for battery state estimation. For ease of use, it is necessary to preprocess and normalize the input data, convert it into a linear combination of features, and use the current estimated true value of the battery state as the input label. Specifically, it is necessary to use a sliding window method to read preprocessed data, pair it with the current battery state estimation data, and form an input and label pair. From this, the input vector calculation method for improving the Transformer model can be derived as denoted in Equation (1).
X = [ V t , C t , T t ]
In Equation (1), X means the model input vector, V t means the voltage at time step t, C t denotes the current, and T t denotes the temperature. Position encoding is responsible for adding positional information to each data point in the sequence, ensuring that the input data carries corresponding positional features. The Transformer model itself does not have the ability to learn sequence information, so it needs to actively provide location information to the Transformer model. The process of position encoding requires the combination of input data and corresponding sequence information to ensure that the model learns the sequence order and temporal characteristics. The specific calculation is denoted in Equation (2).
D a t a _ t r a i n e d = I n p u t s + P o s i t i o n a l _ E m b e d d i n g
In Equation (2), I n p u t s represents the preprocessed temperature, voltage, and current, with values of [0, 1]; D a t a _ t r a i n e d represents the training data of the feature extraction layer; and P o s i t i o n a l _ E m b e d d i n g represents the position encoding data. The sum of the original input data and position encoding is the data for feature extraction. When selecting the position encoding method, if integer encoding is used, the value of the position encoding will be an integer from 0 to t. This method may affect the feature extraction performance due to the expansion of encoding values [22]. Therefore, a more suitable choice is to use sine–cosine encoding, which can limit the value of position encoding within [0, 1]. In the feature extraction section, it includes local and global feature extractions. The former mainly uses a one-dimensional convolution operation, while the latter uses a SAM. One-dimensional convolution is mainly utilized to process time series data. Its basic principle is to use a convolution kernel of length k to slide on a one-dimensional input sequence, multiply each subsequence with the convolution kernel and sum them to obtain a scalar value, and finally output a new sequence. The calculation of one-dimensional convolution is denoted in Equation (3).
y l = w 1 x l + w 2 x ( l + 1 ) + + w k x ( l + k 1 )
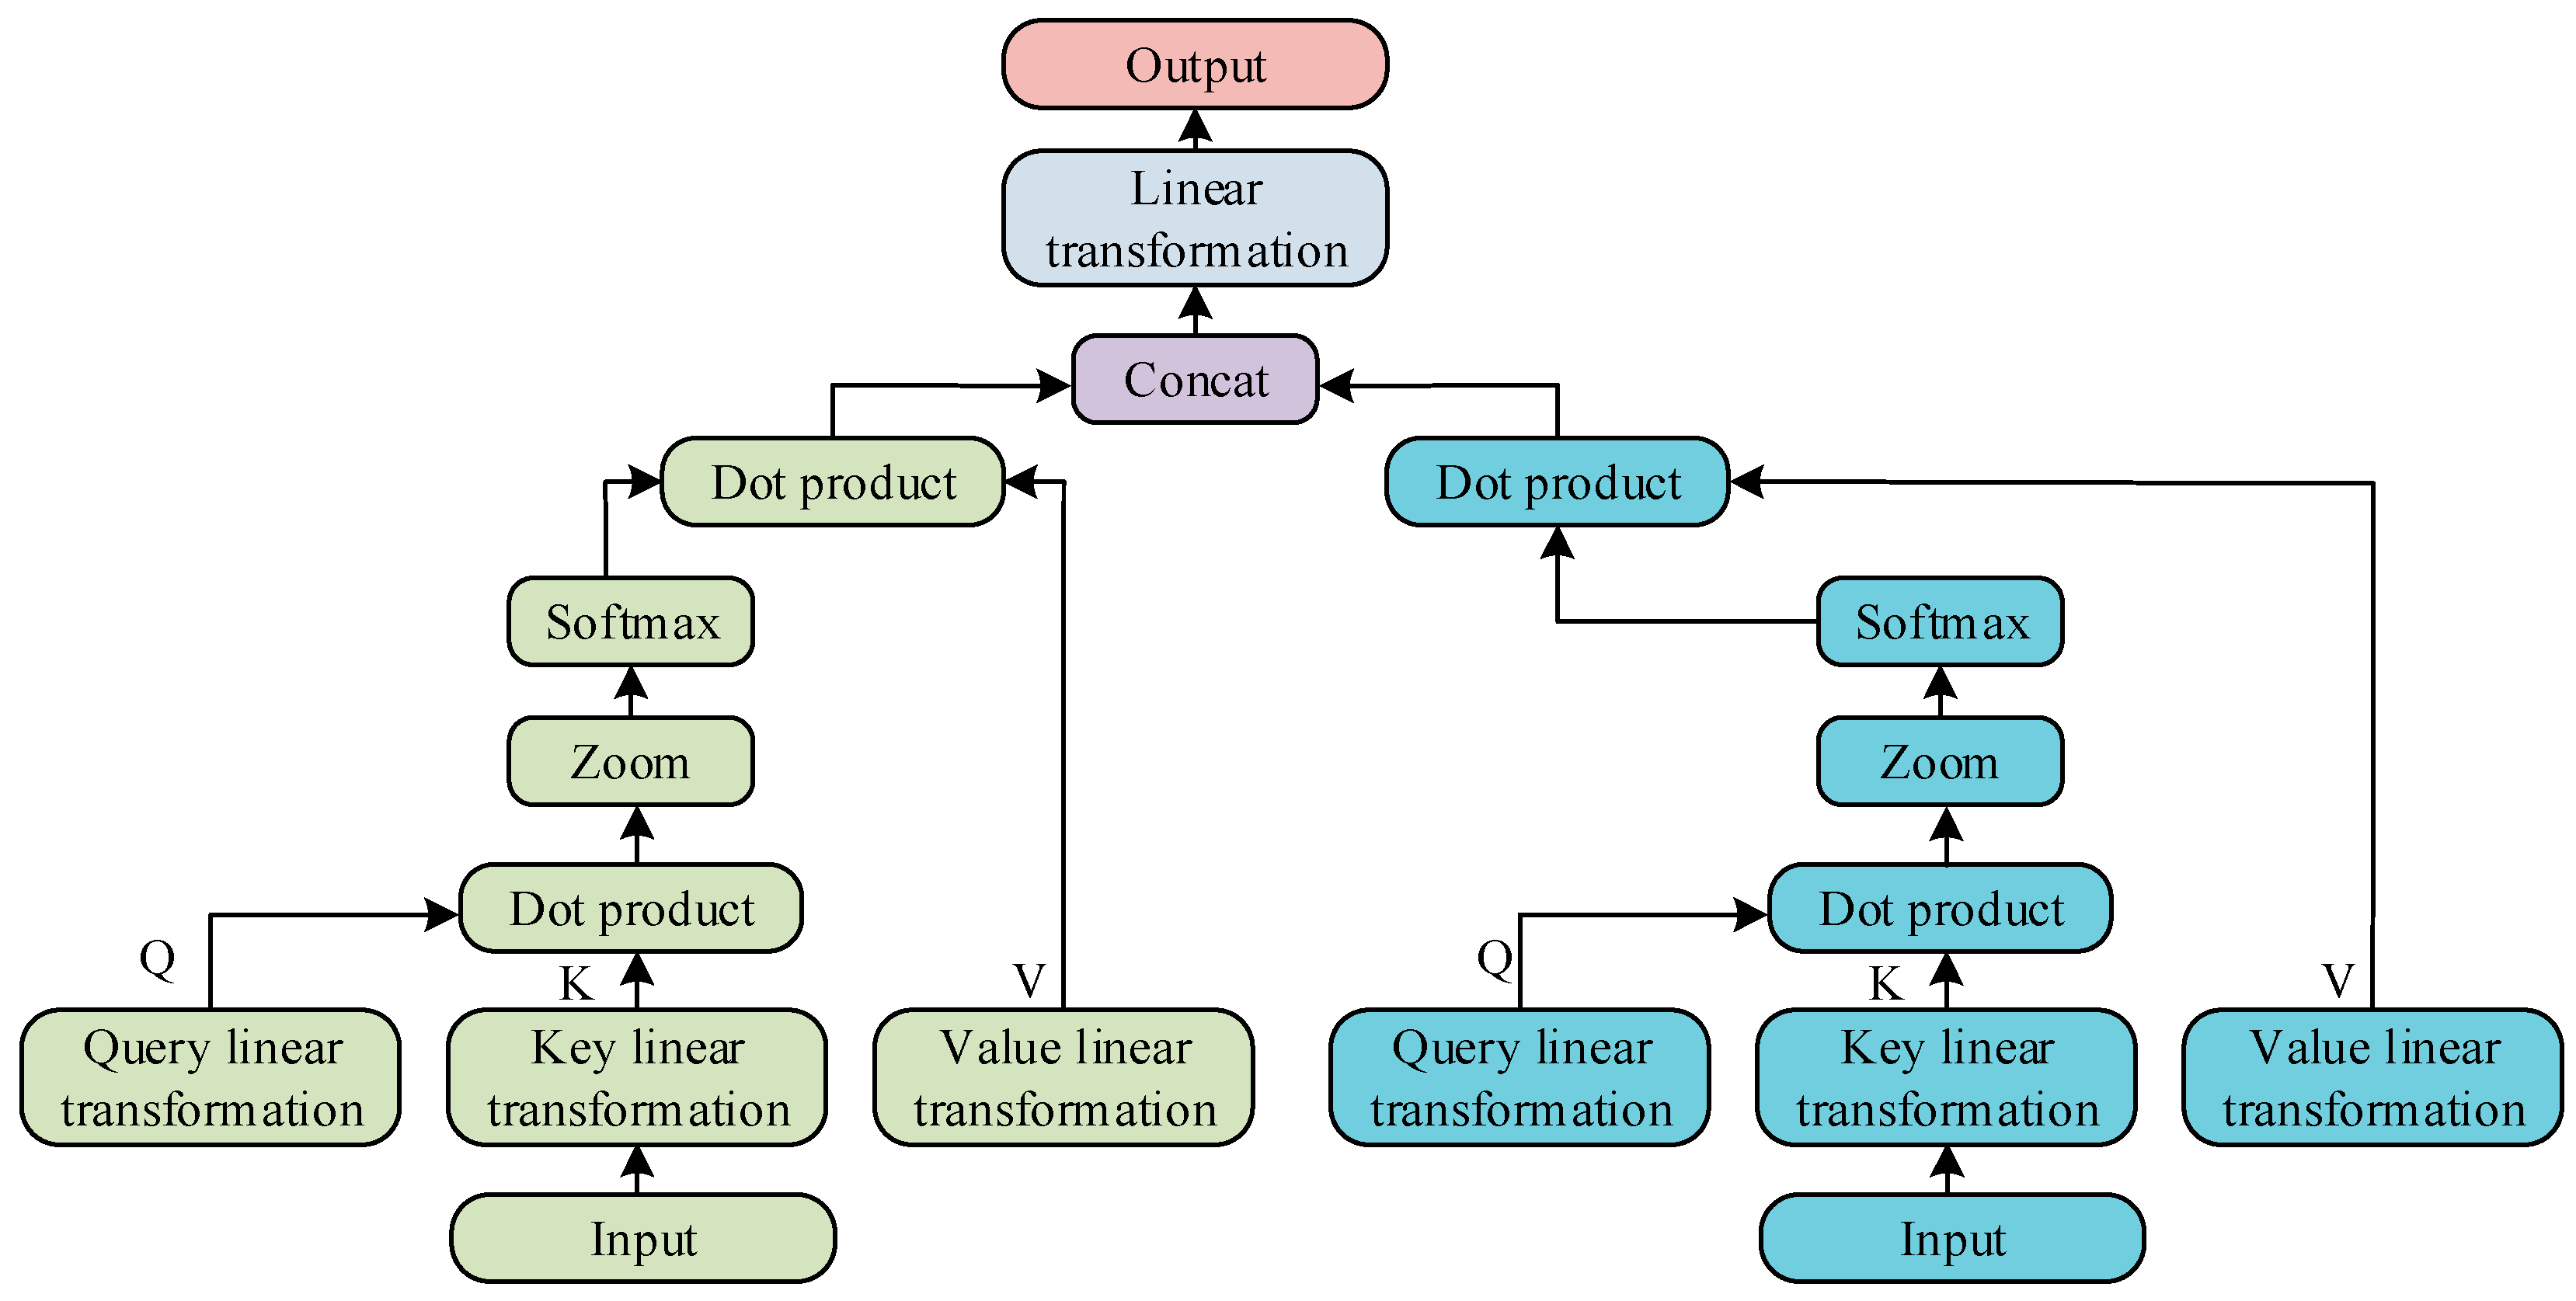
In Equation (3), w = w 1 , w 2 , , w k represents the convolution kernel and x = x 1 , x 2 , , x k represents the input sequence. l represents the starting position of the sliding window. Since each convolution kernel generates a scalar, the amount of convolution kernels determines the number of channels in the output sequence. One-dimensional convolution can effectively extract frequency components of input sequences and trends of time series. By stacking multiple convolutional layers, more abstract features can be gradually learned. The dataset used in this study is the temperature, voltage, and current data of lithium batteries in energy storage power stations in a time series, all of which belong to one-dimensional signals. The process first extracts local features of the input data through one-dimensional convolution and then further extracts global features through the decoder module, effectively mining important information in time series data. The decoder consists of a stack of four feedforward networks and self-attention modules. Feedforward networks mainly enhance the computational performance of self-attention modules through linear transformations [23]. Due to the extraction of local feature vectors from the input data, it is necessary to improve the original self-attention module to better meet the requirements of battery state estimation. This study mainly uses multiple attention heads to capture different correlations. The detailed explanation of the dual-head SAM is denoted in Figure 2.
In Figure 2, in the dual-head SAM, the input data is represented by two vectors, each vector undergoes dot product scaling through query and key linear transformations, and the output vector is generated using the softmax function. Next, compute the dot product of the output with the vector after linear transformation of the value. Finally, the output results of the two input vectors are concatenated and linearly transformed to obtain the final output vector. The dual-head SAM can effectively capture the deep relationships between input data and enhance the correlation between data [24]. In LIBs of energy storage power plants, there is a strong correlation between data at different time points under mixed operating conditions. The dual-head SAM can fully explore the inherent connections of this long sequence data under complex operating conditions, which is conducive to improving the model’s understanding and modeling ability of complex relationships. The main advantage of the dual-head self-attention mechanism over the single-head self-attention mechanism is that it can simultaneously capture multiple correlation patterns in the input data. In battery state estimation, the model can simultaneously focus on the different effects of temperature and current on SOC, thus gaining a more comprehensive understanding of the dynamic characteristics of the battery. In addition, using the dual-head SAM can improve the modeling ability of the model for complex battery behavior without significantly increasing computational complexity. In the training process of the model, RMSE is used as the loss function, and its calculation is denoted in Equation (4) [25].
R M S E = 1 n Σ i = 1 n | f s o c i y s o c i |
In Equation (4), y s o c i means the actual value of the SOC, f s o c i means the predicted value of the SOC, n means the size of the input data, and i means the time point of the input data. After each training session, the RMSE optimizer is used to update weights and biases to improve the loss function’s convergence speed. Among them, the update calculation of weights is denoted in Equation (5).
W = W α d W S d w + ε
In Equation (5), W represents weight and d W represents a small change in weight. α represents the learning rate using to control the update step size, S d w represents the weighted average of the squared gradients of weights, and ε is a very small constant. Among them, the calculation of S d w is denoted in Equation (6).
S d w = β S d w + ( 1 β ) d W 2
In Equation (6), β represents the gradient accumulation index, and β S d w represents the attenuation factor used to update S d w . The updated expression for bias is denoted in Equation (7).
b = b α d b S d b + ε
In Equation (7), b represents bias, S d b represents the weighted average of the squared gradients of bias, and S d b is calculated as denoted in Equation (8).
S d b = β S d b + ( 1 β ) d b 2
In Equation (8), β S d b represents the attenuation factor used to update S d b .

2.2. State Estimation and Battery Life Prediction Methods for LIBs

In the previous section, to better process the time series data of LIBs in energy storage power plants, the traditional Transformer model structure was improved. This study mainly adopts a dual-head SAM to capture deep level correlations in input data and enhance the correlation between data. In this improved Transformer model, the input data is provided in the form of a sequence consisting of a series of time step data, where the last data point of each sequence corresponds to an estimated value of the SOC [26,27]. But this model makes it difficult to process future information, which reduces the accuracy of state estimation for LIBs in energy storage power plants. To solve this problem, a Transformer–TDSE model was proposed by combining the Time Delay Second Estimation algorithm to construct the time series data of the model. The core idea of TDSE is to construct a historical sequence and a sequence containing future data, to perform a secondary estimation of the true SOC values in the past at the current time, and use this estimation to correct the SOC prediction results at the current time, in order to improve real-time performance and accuracy. At time t , in addition to the previous time series, another sequence is constructed to estimate the true state of charge value at time t - T , denoted as S O C t - T D . This study first estimates the SOC value at time t - T through a model and then calculates the error between it and the true value S O C t - T , as shown in Equation (9).
ε t T = S O C t - T S O C t - T D
Based on this error, the error weight w t - T is derived, and its calculation is shown in Equation (10).
ε t - T = S O C t - T S O C t - T D
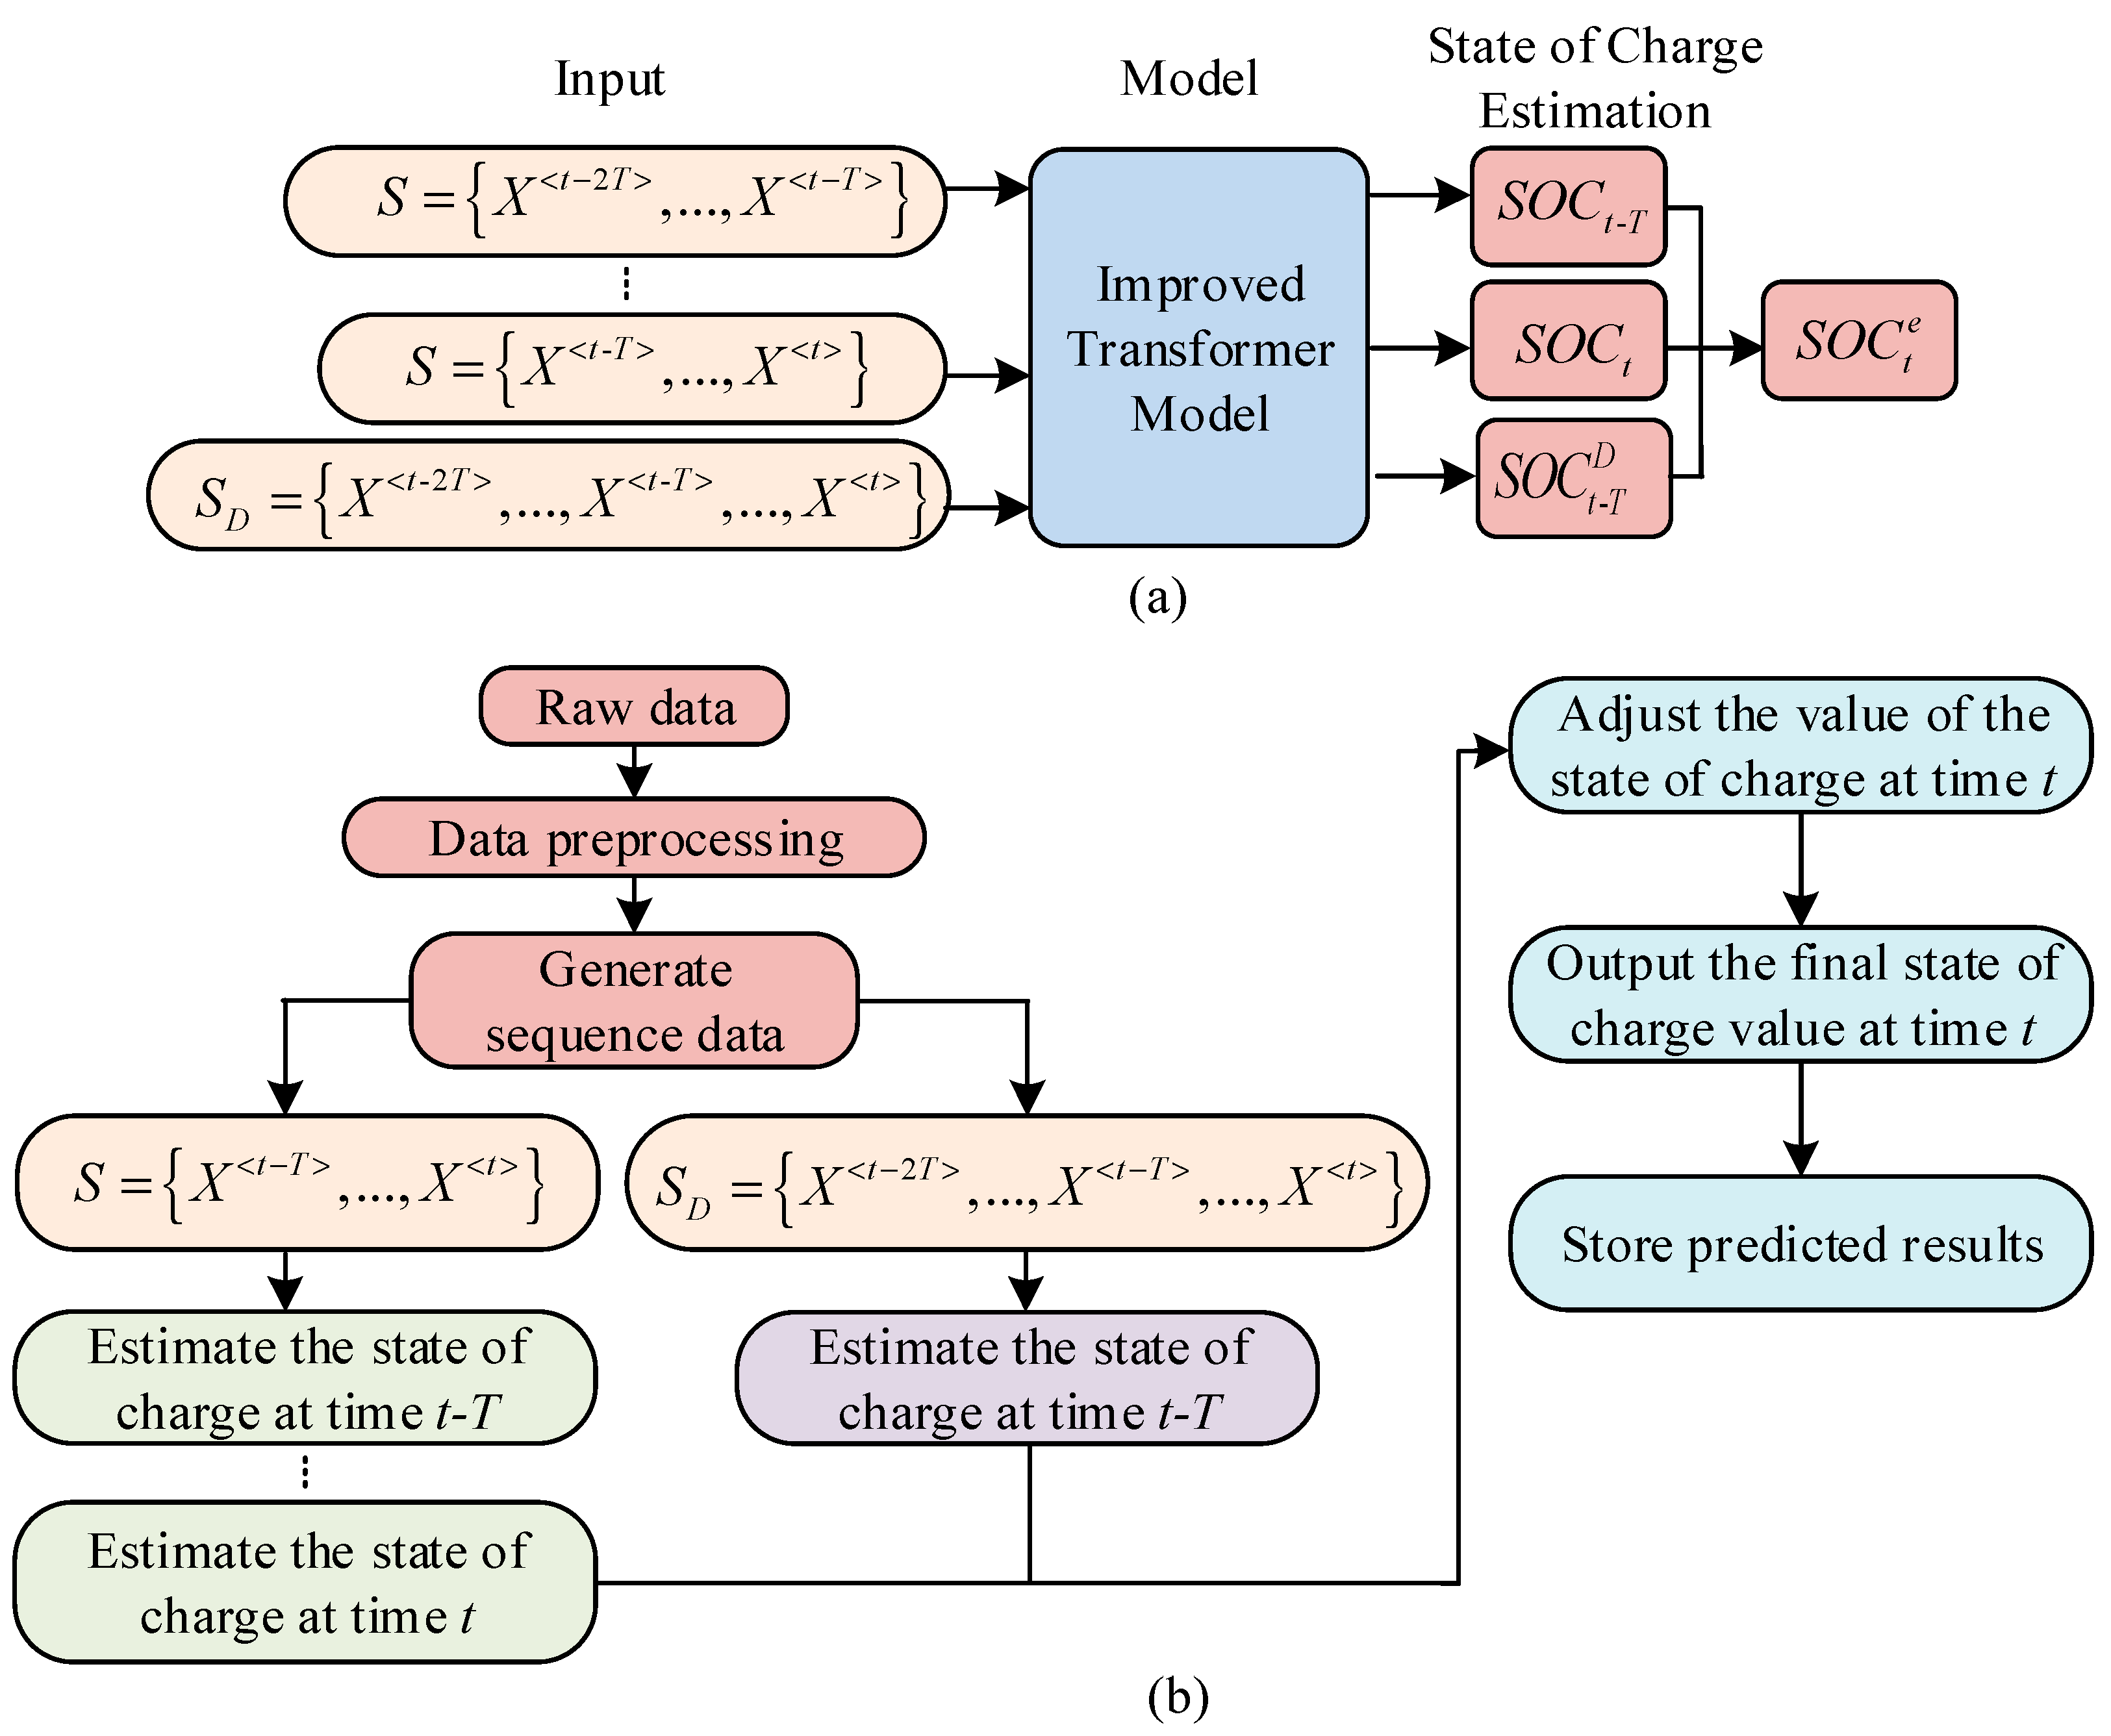
In Equation (10), w t - T reflects the magnitude of the error, and the smaller the error, the greater the weight. Similarly, calculate the SOC estimation error and its weight at time t . By combining current and past estimates, the corrected SOC estimate can be obtained using the weighted average method. In this way, the Transformer–TDSE model can more accurately capture the dynamic changes during battery charging and discharging processes, adapt to different operating conditions and temperature changes, and achieve accurate SOC estimation. The schematic diagram of SOCE based on the Transformer–TDSE model is denoted in Figure 3.
In Figure 3a, S represents the sequence from time t - T to time t, and each sequence corresponds to an estimated SOC value. S D = { X < t - 2 T > , , X < t - T > , , X < t > } represents an additional time series constructed at time t, which is utilized to estimate the true SOC values at time t - T . Finally, by combining the estimated data from each sequence, the estimated value at time t is adjusted together to obtain S D = { X < t - 2 T > , , X < t - T > , , X < t > } . From this, the process of estimating the SOC of LIBs in energy storage power stations based on the Transformer–TDSE model can be derived, as denoted in Figure 3b. In Figure 3b, the process of assessing the SOC of LIBs in energy storage power plants using the Transformer–TDSE model is to first preprocess the data, including abnormal data processing and normalization processing [28]. Next is to construct two types of sequence data. The first type is the S sequence, which consists of historical data and is used to assess the current SOC at time t in real time. The second type is the SD sequence, which contains both historical data and future data, used to estimate the SOC at past times t - T at the current time t . Subsequently, at time t - T , the S sequence and improved Transformer model are used as inputs to predict the SOC value, denoted as S O C t - T . Then, at time t , the improved Transformer is used again with the S sequence and SD sequence as inputs to estimate the SOC value at time t and the adjusted SOC value at time t - T . Finally, by combining the estimated values of S O C t - T at time t - T and t , the estimated SOC value at time t is corrected to obtain the final estimated SOC value, i.e., S O C t e . The specific operation is to first calculate the difference between the estimated values of S O C t - T at time t - T and time t and to analyze the sources and characteristics of the error. Then, based on the results of error analysis, different weights are assigned to the two estimated values. If the error of an estimated value is small, a higher weight is assigned. Subsequently, the two estimated values are weighted and averaged according to the assigned weights to obtain the corrected S O C t e .
Normally, after multiple charge and discharge cycles, the performance of LIBs will gradually decline. Therefore, developing an efficient battery management system has become crucial [29,30]. Accurately predicting a battery’s SOC allows the system to understand the battery’s current condition, enabling efficient battery management. This method can prevent the shortening of battery life caused by overcharging or over-discharging, while also avoiding safety accidents caused by battery overheating. In addition, accurate estimation of battery RL also plays an important role in the development of battery management systems. Among them, the remaining battery life reflects the health level of the battery and can predict the remaining number of rechargeable and dischargeable cycles of the battery. In addition, battery capacity directly affects the accuracy of SOC estimation, as changes in battery capacity can affect the amount of energy stored and released by the battery during charging and discharging processes. As the battery is used and aged, the actual capacity of the battery will gradually decline, making SOC prediction of the battery more complex. The capacity decline of the battery will increase the prediction error of the SOC and affect the prediction of remaining life. This study mainly uses the PF algorithm for RLP of batteries, which can effectively achieve nonlinear state estimation. Due to the influence of factors such as temperature changes, charging and discharging rates, and usage frequency during the use of batteries, their degradation process is not linearly predictable. Therefore, traditional linear prediction methods often struggle to provide sufficiently accurate prediction results. The PF represents the state space of the system by generating a set of particles that are continuously updated based on observation data and system models, and the true state of the system is estimated through weighted averaging. The weight of each particle reflects its degree of matching with the current observed data. After multiple iterations, the particle set gradually approaches the true state distribution. Therefore, the PF can effectively model and estimate the nonlinear degradation process of batteries. In the PF, each particle represents a hypothesis about the model parameters. To prevent particle degradation during the multi-step update process, state transition noise is usually introduced to make the particle update process smoother and avoid excessive concentration of particles near certain parameter values. This study mainly uses a double exponential function to model capacity degradation, which is used to characterize the decline of battery capacity over time of use. In the PF, the parameters of the double exponential function are mainly estimated as unknown state variables. The PF approximates the probability distribution of these degradation model parameters by generating a large number of particles, and it gradually updates the weights of the particles based on the observed data of the battery. The double exponential function can flexibly simulate the nonlinear and dynamic characteristics of battery capacity over time, more accurately reflecting the degradation behavior of the battery during use, enabling it to adapt to the complex changes in battery performance. Among them, the double exponential function is denoted in Equation (11).
Q = A exp ( B κ ) + C exp ( D κ )
In Equation (11), Q represents the amount of electrical energy that the battery can store at a specific moment, κ represents the number of times the battery undergoes charging and discharging processes, and A , B , C , and D are all undetermined parameters. The specific values depend on multiple factors such as the type, material, and working environment of the battery. The observed value of battery capacity at a given time is calculated as denoted in Equation (12).
Y κ = A exp ( B κ ) + C exp ( D κ ) + v ,   v N ( 0 , σ v )
In Equation (12), v represents Gaussian white noise, σ v is the observed variance, and N ( 0 , σ v ) means Gaussian noise that follows a mean of 0 and a variance of σ. Among them, the variance σ is selected through cross validation method with the aim of minimizing prediction error. The posterior probability distribution expression is denoted in Equation (13).
p ( Z κ | Y 1 : κ ) = p ( Z κ | Y 1 : κ 1 ) p ( Y κ | Z κ ) p ( Y κ | Y 1 : κ 1 )
In Equation (13), Y 1 : κ represents the capacity sequence value, Z κ represents the given state, p ( Z κ | Y 1 : κ ) represents the posterior probability distribution of the state Z κ after obtaining the capacity sequence Y 1 : κ , and Z κ | Y 1 : κ 1 represents the probability of the current state Z κ given all capacity data. p ( Y κ | Y 1 : κ 1 ) represents the marginal probability of observation value Y κ . p ( Y κ | Z κ ) refers to the likelihood function of observing Y κ given the state Z κ . The normalization constant calculation is denoted in Equation (14).
p ( Y κ | Y 1 : κ 1 ) = p ( Z κ | Y 1 : κ 1 ) p ( Y κ | Z κ ) | d X κ
The true posterior probability distribution can be obtained and calculated using Equation (15) according to the central limit theorem.
p ( Z κ | Y 1 : κ ) m = 1 M w κ m δ ( Z κ Z κ m )
In Equation (15), δ represents a variable function from 0 to 1. M means the amount of particles. w κ m means the weight of the m th particle at time κ . The estimation expression for w κ m is denoted in Equation (16).
w κ m = p ( Z κ m Y 1 : κ ) π ( Z κ m Y 1 : κ )
Subsequently, w κ m is normalized, and Equation (17) gives the specific calculation.
w κ m = w κ m m = 1 M w κ m
The capacity degradation of batteries is not only related to the number of charge and discharge cycles but also affected by factors such as temperature, current intensity, and charge and discharge rate. Therefore, when using a double exponential model for capacity decline prediction, multiple factors need to be comprehensively considered. In addition, due to varying battery capacities, each battery has a separate failure threshold set, which ranges from 70% to 80% of its rated capacity. Figure 4 shows the PF algorithm flowchart.
In Figure 4, the procedure of the PF algorithm starts by setting the initial parameters of the PF algorithm, including the number of particles, initial state, and observation model parameters. The initial state is set, including initial state estimation and weights. Then, a state transition model is utilized to update the state of each particle. Subsequently, new measurement values are obtained at each time step, and the weights of each particle are updated based on the new measurement values and observation model. Next, it is checked whether the particle weights are decreasing, i.e., whether the number of valid particles is below the set failure threshold. If so, resampling is performed. If not, it will calculate and update the particles until the particle weights degrade. The difference between the actual capacity degradation to the failure threshold cycle times and the set cycle times is used to obtain the remaining battery life.

2.3. Data Source Description

The experimental data was obtained from 5 ternary lithium batteries (rated capacity 2.0 Ah) and 5 lithium iron phosphate batteries (rated capacity 2.5 Ah), each battery completed 200–500 charge and discharge cycles, and a total of 16,800 time series samples including voltage, current, temperature, and SOC true values were obtained. The data collection covered operating conditions from −10 °C to 50 °C, including multiple operating conditions. The Arbin BT2000 battery testing system was used for data acquisition, with a sampling rate of 1 Hz. Temperature control was achieved through a constant temperature box with a stability of ±0.5 °C. Real-time recording of battery terminal voltage, charging and discharging current, and surface temperature during the testing process was carried out, as well as the simultaneous acquisition of SOC true values through the Coulomb counting method combined with the open-circuit voltage method. The collected data needed to undergo three-step preprocessing. Firstly, the 3σ principle was used to eliminate abnormal points where the voltage deviation exceeds ±2% of the rated voltage and the current deviation exceeds ±5% of the rated current. Then, the eigenvalue domain was mapped to [0, 1] through minimum–maximum scaling. Finally, the sliding window method was used to construct an input label pair, where the input was the voltage, current, and temperature sequence within the window, and the label was the SOC value at the end of the window. The model was trained using the Adam optimizer with a learning rate of 1 × 10⁻⁴, β1 = 0.9, and β2 = 0.999. The batch size was 32 and the training epochs were 100. The network structure consisted of 4 hidden layers, with 8 attention heads set in each layer. To avoid overfitting, an early stopping strategy was introduced with a patience value of 10, which means that if the validation set loss did not decrease for 10 consecutive rounds, training was terminated.
In the baseline comparison, the MAE of the Kalman filter at 10 °C was 0.95%, the PF algorithm was 0.88%, and the Transformer–TDSE model reduced MAE to 0.82%. Under extreme low-temperature conditions of −10 °C, Transformer–TDSE reduces MAE from 1.82% to 1.25% compared to the Kalman filter, verifying its adaptability to complex working conditions.
3. Results

This research verified the accuracy of the Transformer–TDSE model in estimating the SOC of batteries under different temperatures and operating conditions, aiming to simulate the working state of LIBs in energy storage power plants in real environments. During the verification, the efficacy of the model was mainly assessed using two metrics, MAE and Max Error, and compared with several common algorithms on the same dataset. In addition, this study verified the accuracy of the PF algorithm in forecasting the capacity and RL of various LIBs, using accuracy and RMSE as metrics.

3.1. Analysis of SOCE for Lithium Power Batteries

To assess the efficacy of the Transformer–TDSE model in estimating the SOC of LIBs, battery SOCE was researched under various temperatures and operating conditions. The environment for building, training, and testing the model is denoted in Table 1.
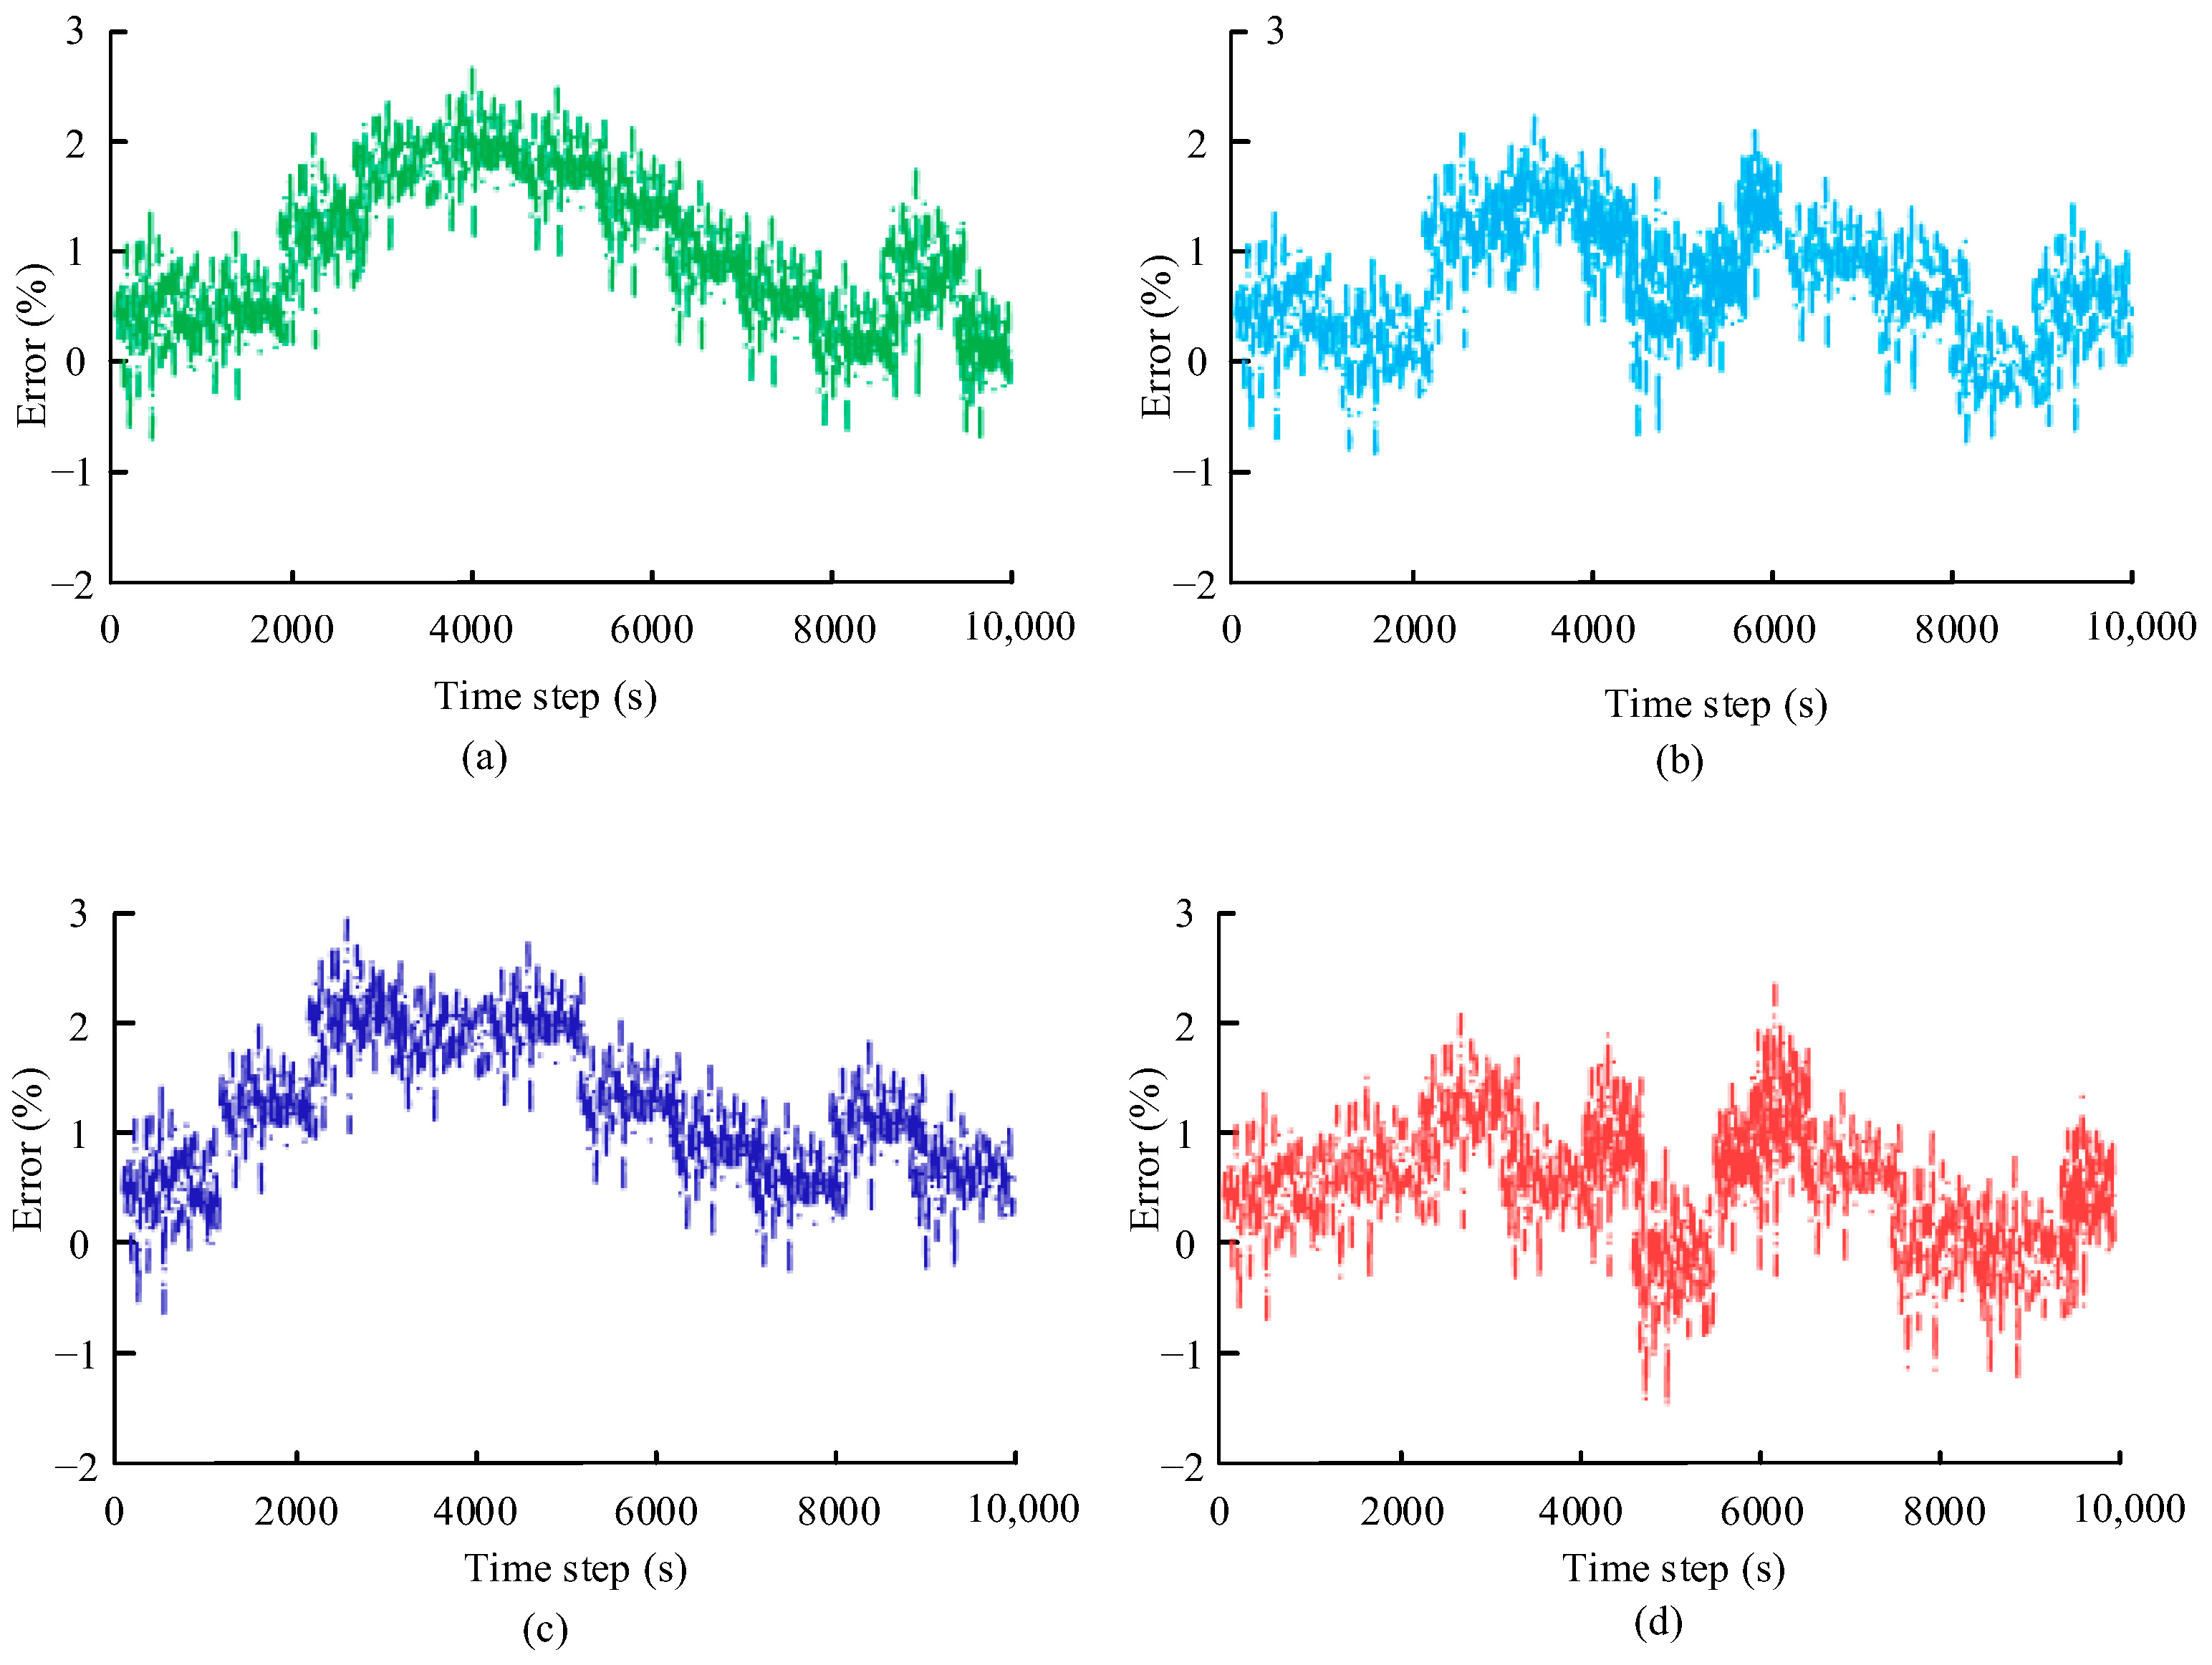
This study first explored the testing performance of the Transformer–TDSE model under different operating conditions of variable temperature. The test dataset we used included two discharge datasets, with LiNiMnCoO2 and LiFePO4 as the positive electrode materials. This includes complex operating condition data collected at two temperatures, with temperature settings of 10 °C and 30 °C, respectively. Under each temperature condition, there are five different pieces of operating condition data included. The model training set accounts for 70% and the test set accounts for 30%. The error curves of the state-of-charge estimation for the Transformer–TDSE model on different datasets are shown in Figure 5. From Figure 5a, under the temperature condition of 10 °C, the SOCE curve of the Transformer–TDSE model had a high degree of fit with the true value, with a maximum error value of only 2.68%. From Figure 5b, under the temperature condition of 30 °C, the estimated SOC curve of the transformer–TDSE model is very approximate to the true value, with a maximum error of only 2.15%. According to Figure 5c, in the LiFePO4 dataset, the estimated SOC curve of the Transformer–TDSE model had a high degree of fit with the true value curve under different temperature conditions. According to Figure 5d, the highest error value for estimating the SOC of the Transformer–TDSE model at a temperature of 10 °C was only 2.79%, and the average error was only 1.25%. The maximum error value of the SOCE at a temperature of 30 °C was 2.35%, and the average error value was 0.94%. The Transformer–TDSE model could effectively capture the dynamic changes during battery charging and discharging processes, adapt to different operating conditions and temperature changes, and achieve accurate SOC estimation.
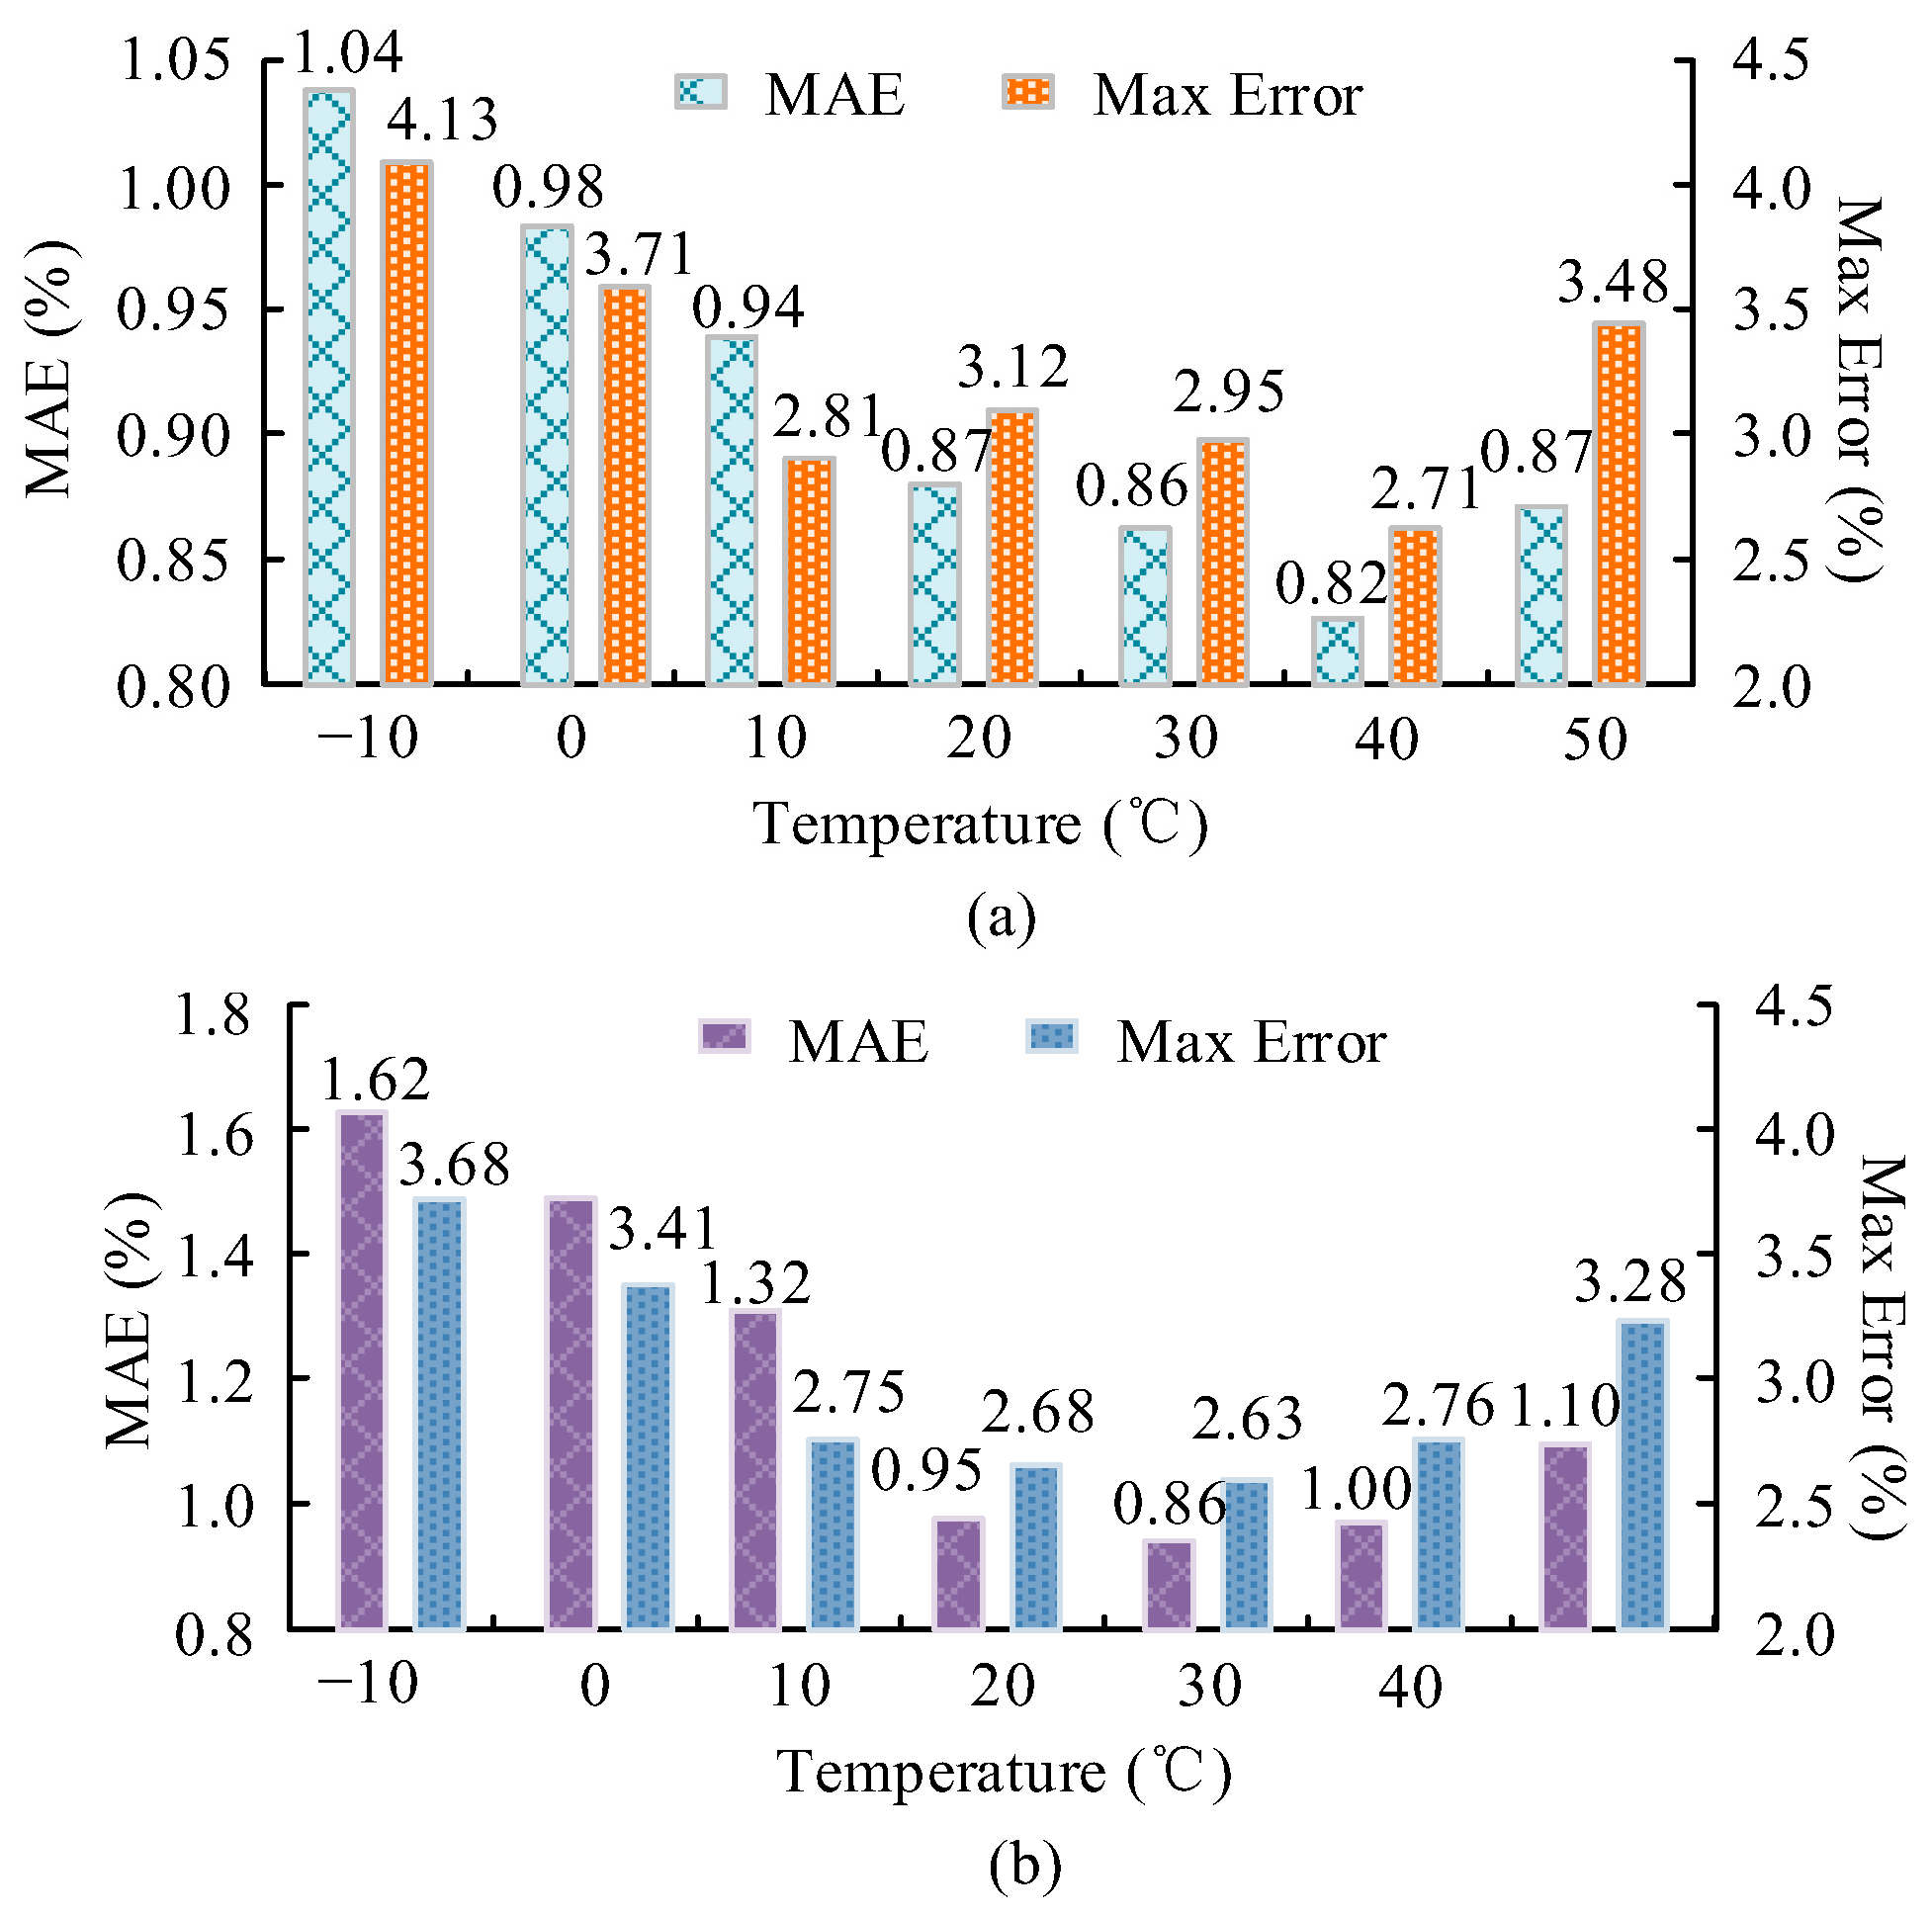
This study used MAE and Max Error as evaluation metrics to test the accuracy of the Transformer–TDSE model in estimating the SOC of batteries on the LiNiMnCoO2 dataset and LiFePO4 dataset. Among them, the testing temperatures included −10 °C, 0 °C, 10 °C, 20 °C, 30 °C, 40 °C, and 50 °C. The test findings are denoted in Figure 6. According to Figure 6a, in the LiNiMnCoO2 dataset, the MAE of the Transformer–TDSE model was 0.98% at 0 °C and only 0.82% at 40 °C. Meanwhile, the Max Error of the model was only 2.71% at a temperature of 40 °C and 2.81% at a temperature of 10 °C. In addition, the MAE value of the Transformer–TDSE model at extreme low temperatures of −10 °C was 1.04%, and the Max Error was 4.13%, both of which were higher than other temperatures. The MAE value and Max Error at an extreme high temperature of 50 °C were 0.87% and 3.48%, respectively, which showed little change compared to the indicator value at the optimal temperature. The Transformer–TDSE model was capable of adapting to battery SOCE tasks in various temperature environments, and maintained high accuracy performance even under high- and low-temperature conditions. According to Figure 6b, in the LiFePO4 dataset, the highest and lowest MAE values of the Transformer–TDSE model were only 1.48% and 0.86%, respectively, corresponding to temperatures of 0 °C and 30 °C. Meanwhile, the Max Error value of this model was as low as 0.95%. The Transformer–TDSE model demonstrated high accuracy in estimating the SOC of batteries. Meanwhile, the MAE value and Max Error of the Transformer–TDSE model at extreme low temperatures of −10 °C were 1.62% and 3.68%, respectively. The MAE value and Max Error at an extreme high temperature of 50 °C were 1.10% and 3.28%, respectively, slightly higher than the indicator value at the optimal temperature. The Transformer–TDSE model demonstrated high accuracy in estimating battery SOC at different temperatures.
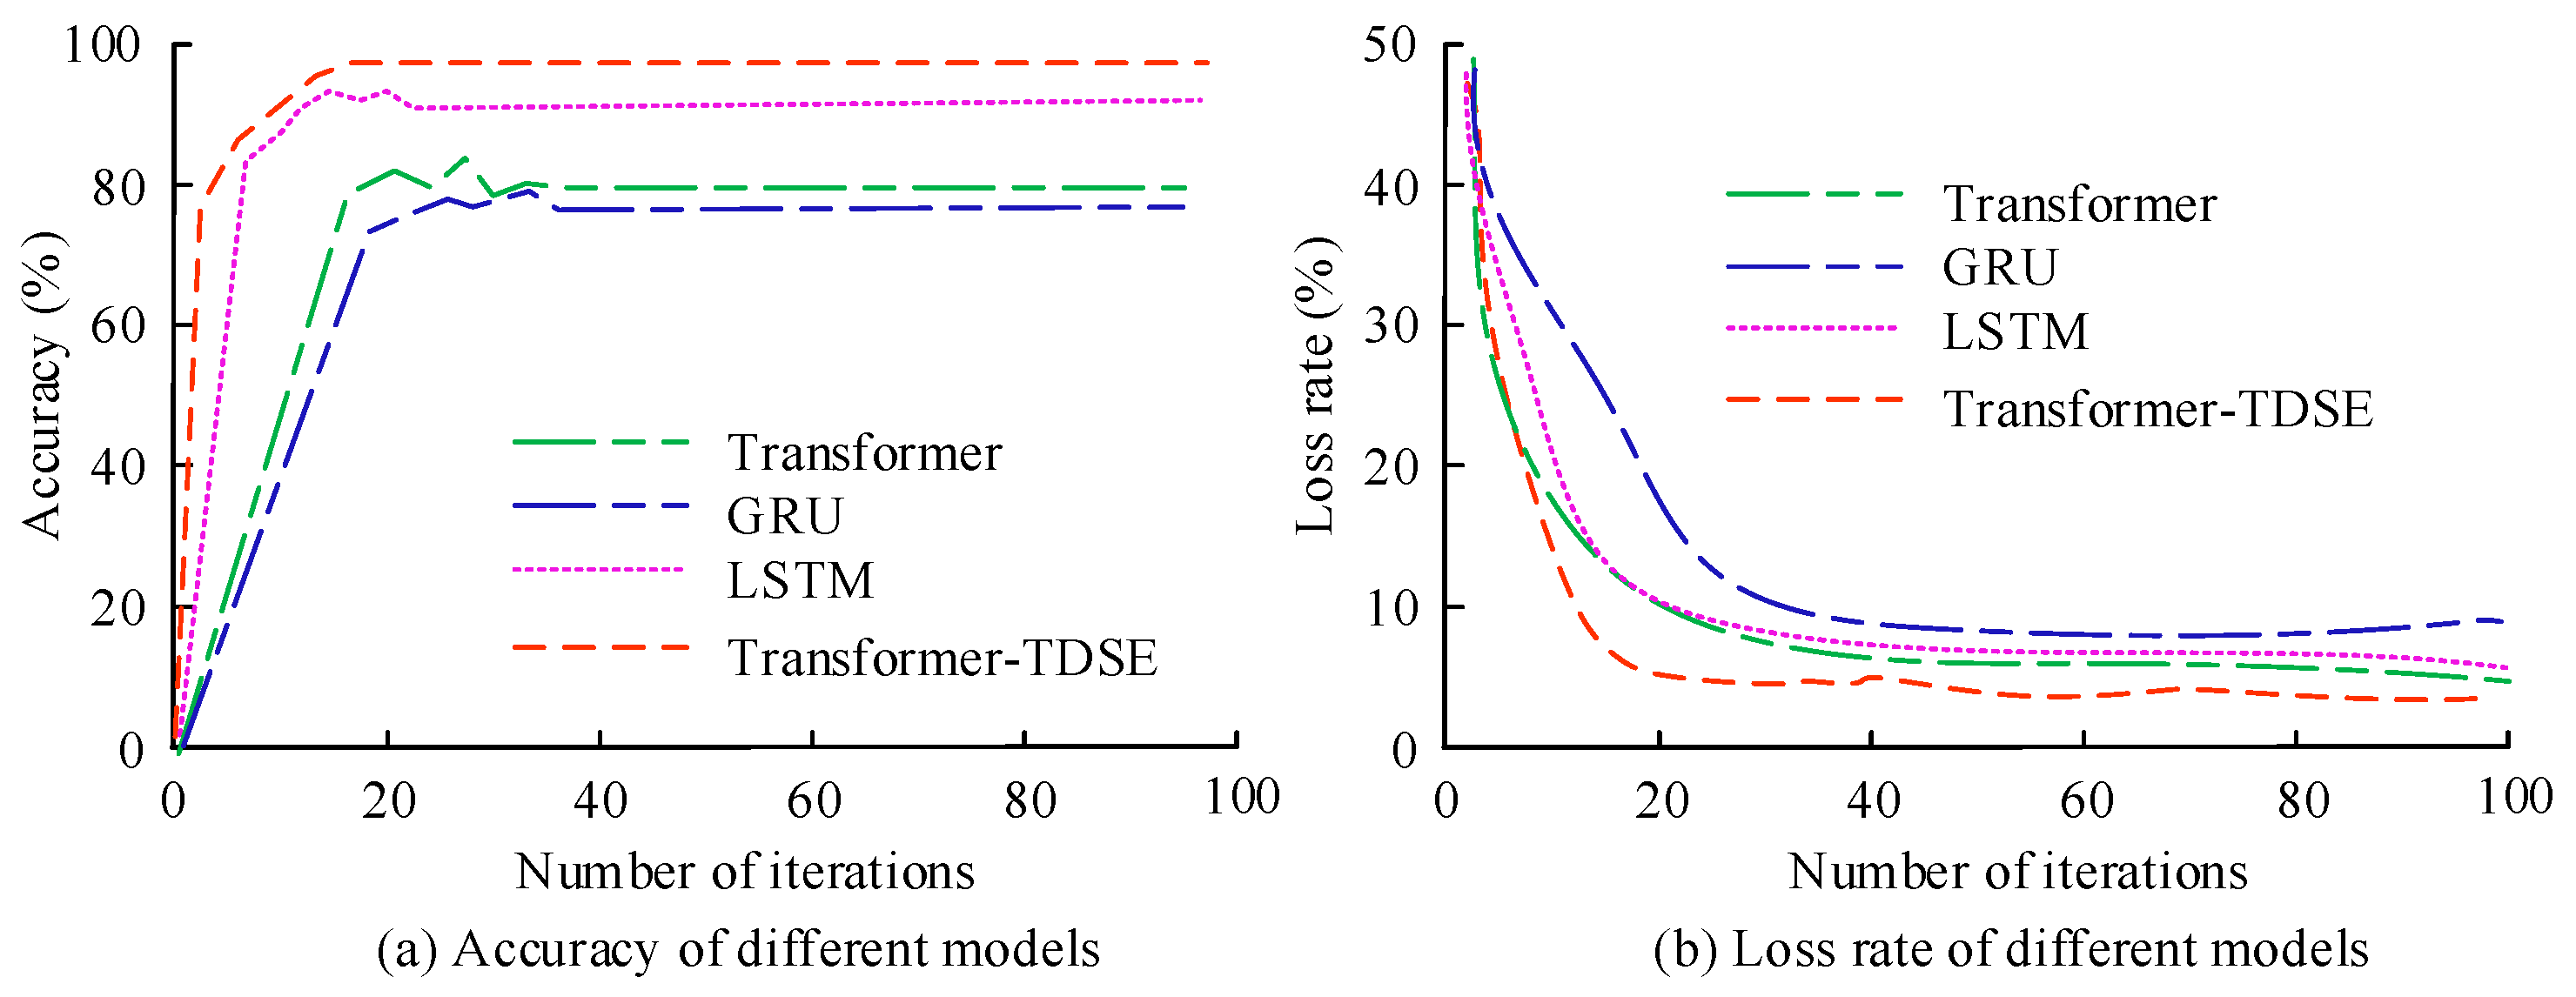
To further demonstrate the superiority of the Transformer–TDSE model, a comparison was made between the basic Transformer model, Gated Recurrent Unit (GRU), and long short-term memory (LSTM) network. The experiment mainly explored the accuracy of estimating the SOC of LIB using different models at different temperatures. The data set used was the LiNiMnCoO2 discharge data set with a training set of 70% and a test set of 30%. This study first tested the training accuracy and loss rate of each model, as denoted in Figure 7. In Figure 7a, compared with other models, the Transformer–TDSE model had the highest accuracy, converging to 98.64% after about 20 iterations. The GRU model only stabilized after 38 iterations, with an accuracy rate of only 76.89%. This indicated that the Transformer–TDSE model could quickly and effectively fit battery SOC data. In contrast, the GRU model only stabilized after 38 iterations, and the final accuracy was only 76.89%, significantly lower than the Transformer–TDSE model. This indicated that the learning process of the GRU model was relatively slow, and its fitting ability was relatively weak, which cannot achieve the high accuracy of Transformer–TDSE. As shown in Figure 7b, the loss rate of the Transformer–TDSE model was significantly lower than the other models, only 3.75%, which was 5.10% and 5.82% lower than the Transformer model and LSTM model, respectively. Meanwhile, the Transformer–TDSE model only converged 18 times. Compared with other models, the Transformer–TDSE model had faster model training speed and accuracy.
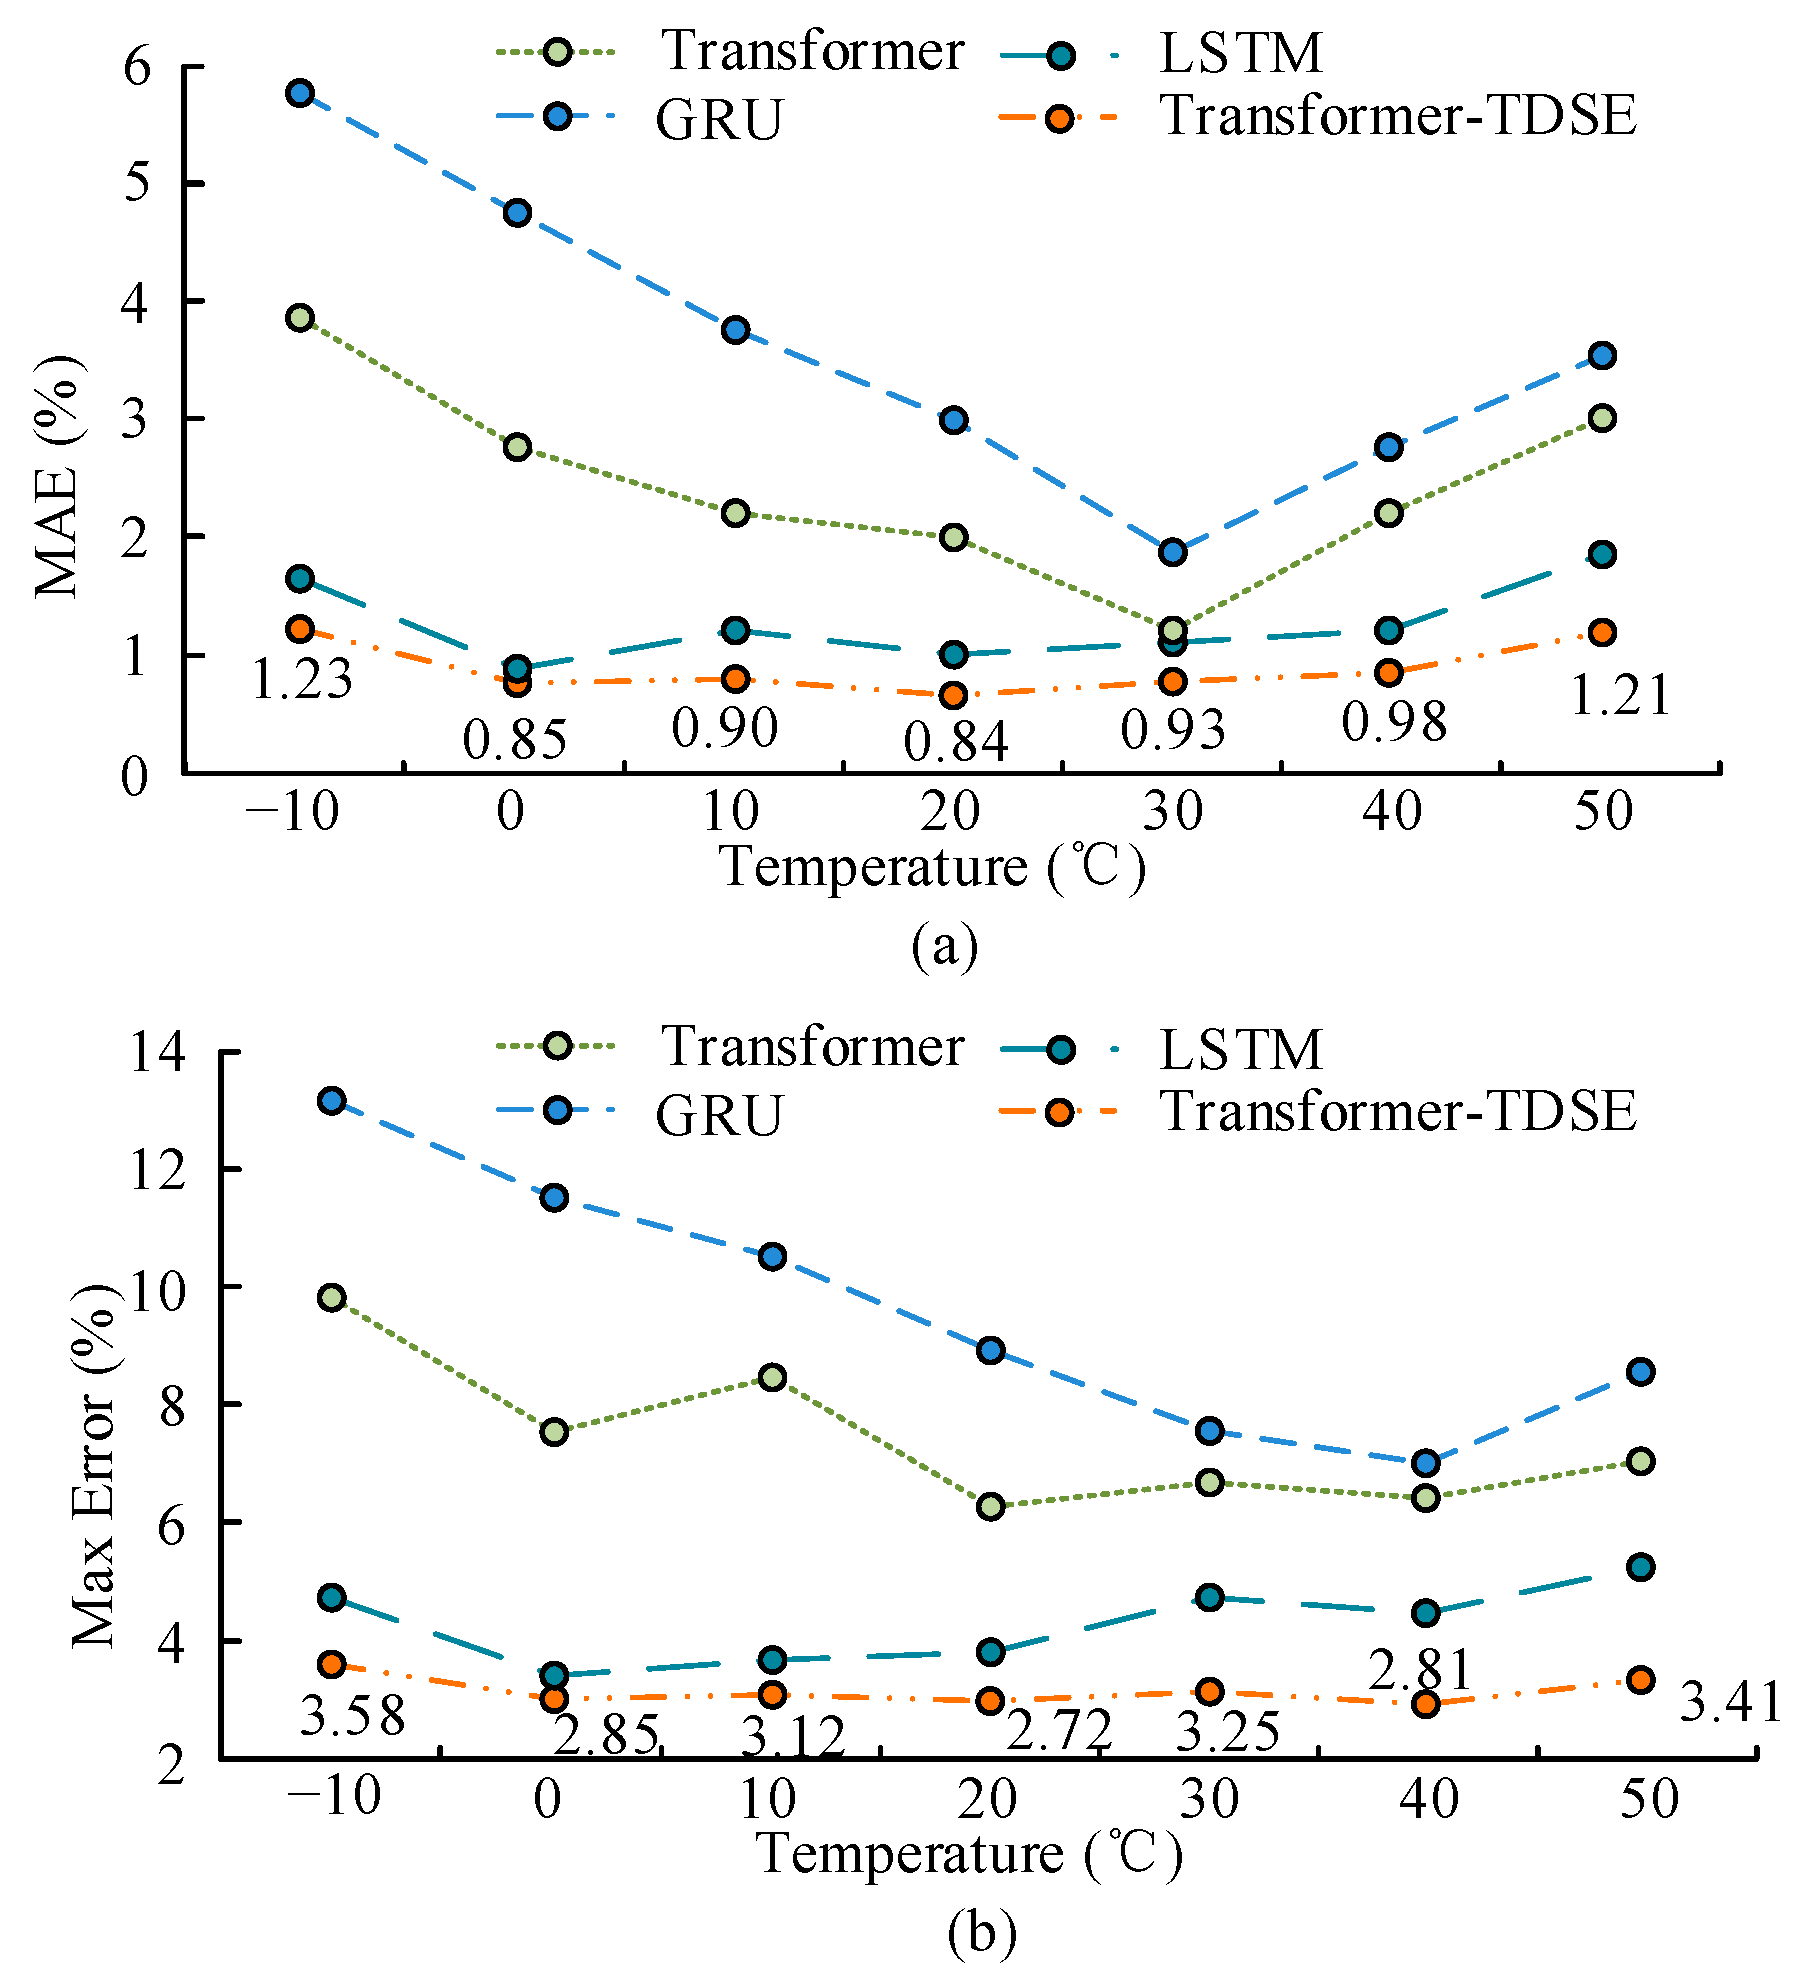
This study continued to use MAE and Max Error as evaluation metrics to verify the estimation errors of LIB SOC for each model at different temperatures. The findings are indicated in Figure 8. In Figure 8a, the estimated MAE values of the Transformer–TDSE model for the SOC at various temperatures were relatively low, with the lowest being only 0.84% and the highest being 0.98%. The MAE value of the GRU model under 0 °C temperature conditions reached 4.86%, which was 4.01% higher than that of the Transformer–TDSE model. At an extreme low temperature of −10 °C, the MAE value of the Transformer–TDSE model was only 1.23%, which was 4.61% lower than that of the GRU model. At an extreme high temperature of 50 °C, the MAE value of the Transformer–TDSE model was only 1.21%, still lower than other models. At the same time, the GRU model had the largest fluctuation in MAE values at different temperatures, while the Transformer–TDSE model had the smallest fluctuation, demonstrating the stability and robustness of the Transformer–TDSE model. As shown in Figure 8b, the Max Error value of the Transformer–TDSE model was significantly lower than that of the other models, with Max Error values of 2.85%, 3.12%, 2.72%, 3.25%, and 2.81% at various temperatures, respectively. The Max Error value of the LSTM model was second only to the Transformer–TDSE model, with a minimum Max Error value of only 3.25, indicating high prediction accuracy. At an extreme low temperature of −10 °C, the Max Error of the Transformer–TDSE model was only 3.58%. At an extreme high temperature of 50 °C, the Max Error value of the Transformer–TDSE model was only 3.41, significantly lower than other models. The Transformer–TDSE model had significant advantages in estimating the SOC of LIBs. The specific reason is that the variation of battery SOC is influenced by various nonlinear factors, including temperature changes, battery degradation, charging and discharging processes, etc. Transformer–TDSE could capture these complex relationships through its nonlinear modeling capability, thereby improving the accuracy of SOC prediction. In contrast, traditional methods such as LSTM and GRU had certain limitations when dealing with these complex relationships.

3.2. Analysis of Life Prediction Results for Lithium Power Batteries

After conducting SOC prediction experiments, this study further analyzed the prediction results of remaining battery life. Among them, the health status and remaining life of the battery are closely related to its actual SOC, so the accuracy of the SOC directly affects the estimation of battery life. In battery management systems, accurate SOC prediction can provide a stable foundation for predicting battery capacity degradation and remaining life. Meanwhile, the prediction of battery capacity degradation and lifespan can also provide important support for the accuracy of SOC prediction. The two complement each other and work together to ensure the efficient operation of the battery management system. To prove the efficacy of the PF algorithm in estimating the lifespan of LIBs, two batteries from the LiNiMnCoO2 dataset and LiFePO4 dataset were used for capacity prediction. Among them, the full life cycle of the LiNiMnCoO2 battery was 168 times, and the full life cycle of the LiFePO4 battery was 180 times. The parameters of each LIB are shown in Table 2.
In the PF algorithm, the parameter settings are indicated in Table 3. The initial parameters in the table are selected based on previous research and experimental settings.
This study first validated the performance of the double exponential model in predicting the capacity degradation of LIBs and compared it with an equivalent circuit model. The used evaluation indicators included RMSE and MAE. The prediction results of LIB capacity decline for different models are shown in Table 4. According to Table 4, the double exponential model outperformed the equivalent circuit model in terms of the RMSE and MAE indicators on both types of batteries. Among them, the RMSE and MAE values of the double exponential model on LiNiMnCoO2 batteries were 1.1% and 0.6%, respectively. The equivalent circuit model was as high as 4.2% and 3.6%. For LiFePO4 batteries, the RMSE and MAE values of the double exponential model were 1.3% and 0.8%, respectively, while the equivalent circuit model was as high as 5.0% and 3.9%. The double exponential model could more accurately reflect the process of battery capacity degradation.
The prediction results of the PF algorithm for the capacity of the two batteries are indicated in Figure 9. From Figure 9, the capacity prediction curve of the PF algorithm had a high degree of fit with the true value curve in the LiNiMnCoO2 dataset and LiFePO4 dataset. In Figure 9a, the capacity prediction curve of the PF algorithm deviated from the true value in the later stage of the cycle, but the highest error was only 0.24 Ah. The capacity of the battery gradually declined and exhibited nonlinear changes during use, but the PF algorithm could still predict the capacity of the battery well and maintain relatively small errors in the later stages of decline. As shown in Figure 9b, the maximum error between the capacity prediction results of the PF algorithm and the true values was only 0.28 Ah, further demonstrating the high-precision characteristics of the algorithm. This indicates that the algorithm has strong adaptability and can cope with the performance changes of batteries in different stages of use. At the same time, the PF algorithm can demonstrate consistent good performance in different types of batteries, proving its wide adaptability and ability to handle battery capacity prediction problems under various characteristics and working environments.
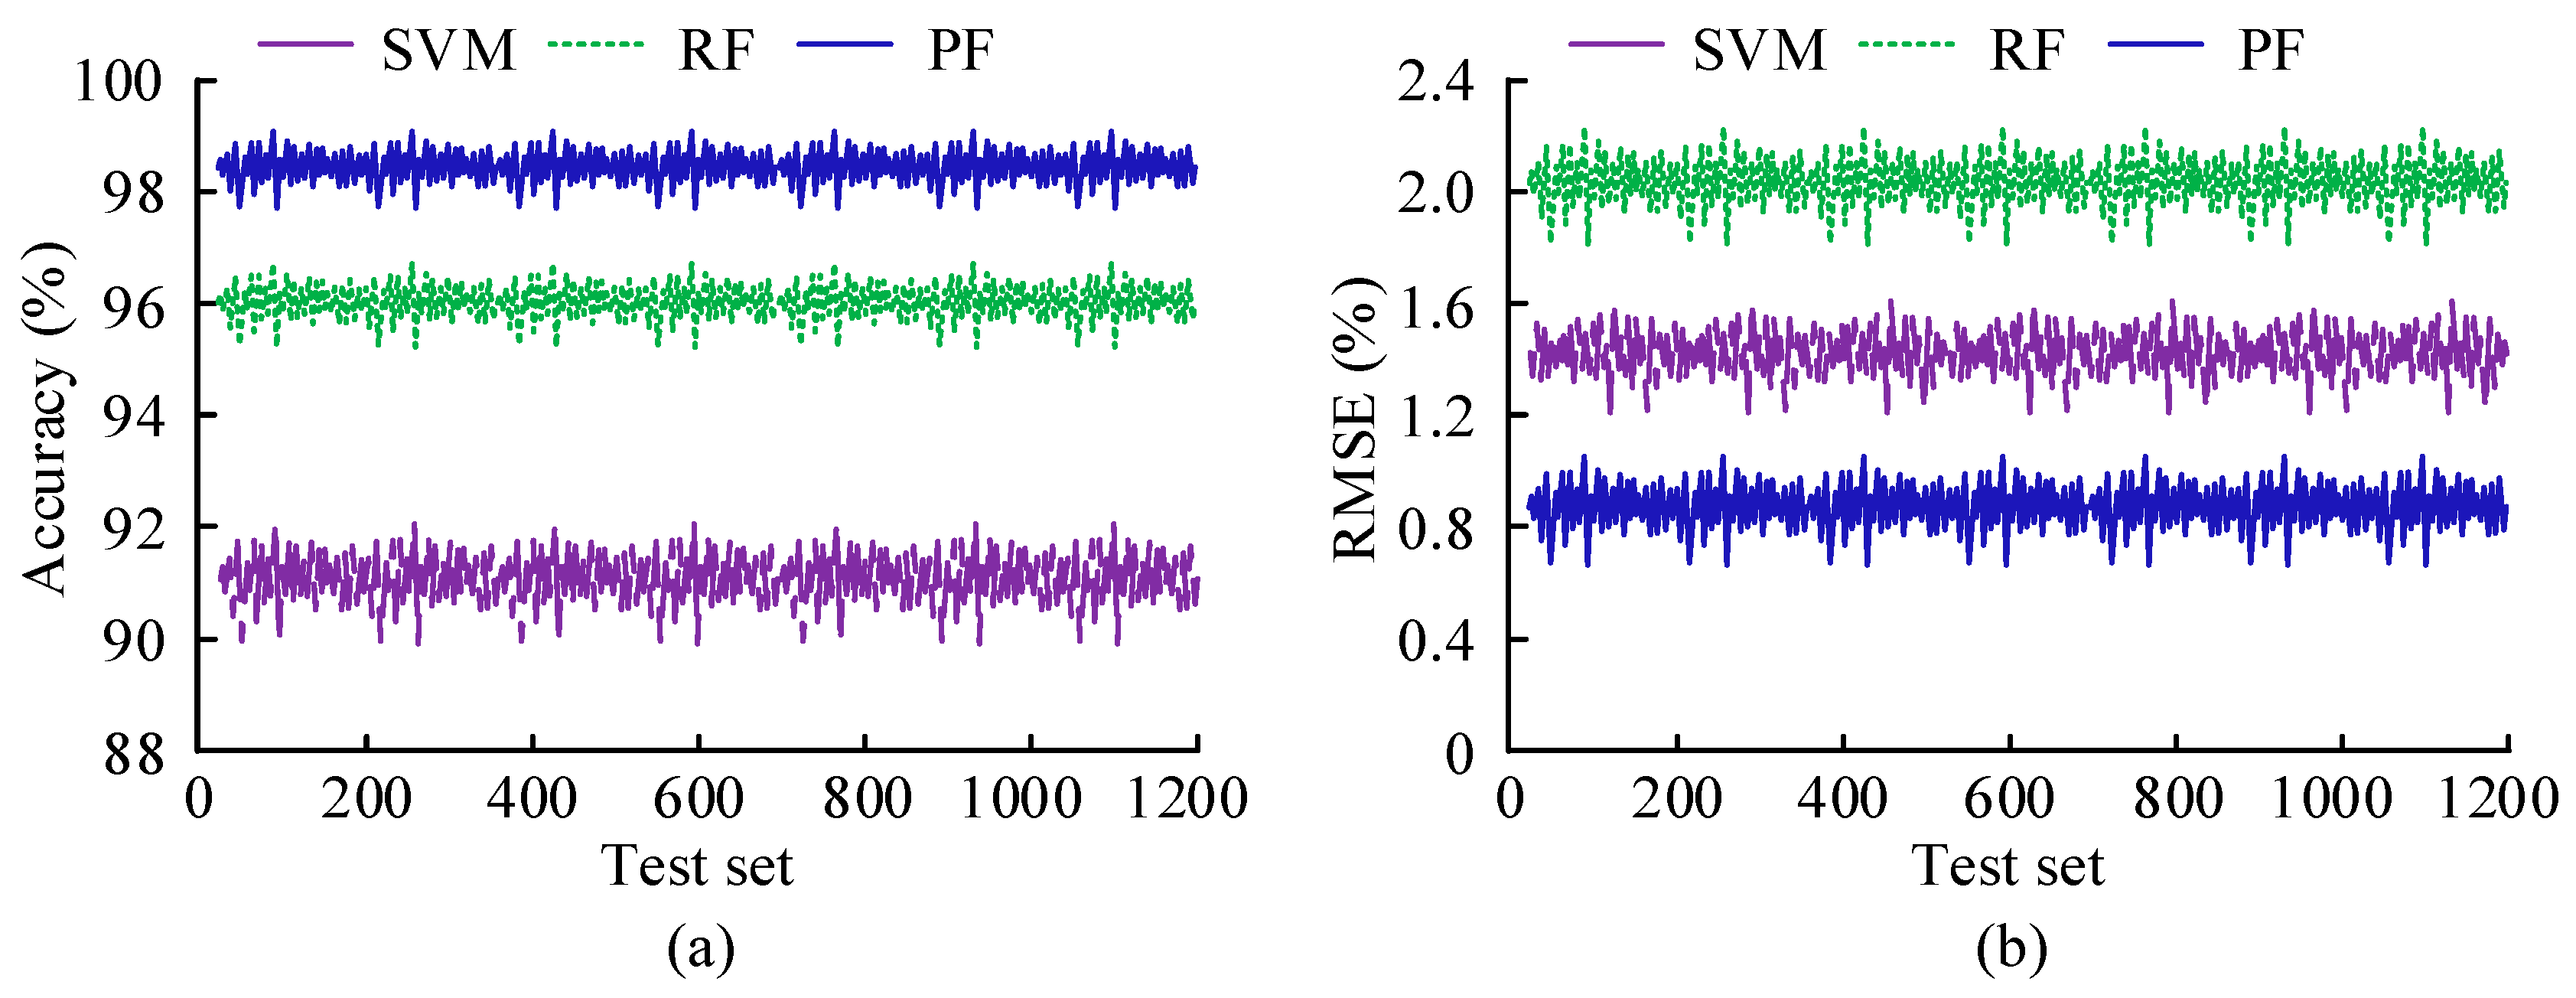
This study continued to compare the accuracy of capacity prediction using Support Vector Machine (SVM), a Random Forest (RF) network model, and the PF algorithm. The choice of SVM and RF for comparison is due to their excellent performance in handling nonlinear problems and high-dimensional data, as well as their widespread application in the field of battery state estimation. To ensure fair comparison with the PF algorithm, RF and SVM adopted a unified and standardized configuration. All methods used the same input feature set, including battery voltage, current, temperature, and historical SOC data. The proportion of training sets for all algorithms was 80%. The kernel function of SVM was RBF, the penalty parameter was 10, and the kernel function parameter was 0.1. RF consisted of 100 decision trees, with a maximum tree depth of 15 and a minimum sample size of 5 for leaf nodes. The evaluation indicators we used included accuracy and RMSE as prediction accuracy evaluation indicators. The test dataset was the LiNiMnCoO2 dataset. The capacity prediction results of each method on different datasets are denoted in Figure 10. In Figure 10a, the capacity prediction accuracy of the PF algorithm was as high as 98.34%, which was 7.24% and 2.38% higher than SVM and RF algorithms, respectively. According to Figure 10b, the RMSE of the PF algorithm was only 0.82%, while the RMSE of the RF algorithm was as high as 2.05%, and the RMSE of the SVM algorithm reached 1.43%. The PF algorithm had significant advantages in predicting battery capacity accuracy. The core advantages of the PF algorithm come from the probability inference mechanism of PF, strong noise resistance, ability to handle complex decay mechanisms, and flexible real-time updates. These advantages enable the PF algorithm to have better predictive performance in battery management systems that require high precision and dynamic adjustment.
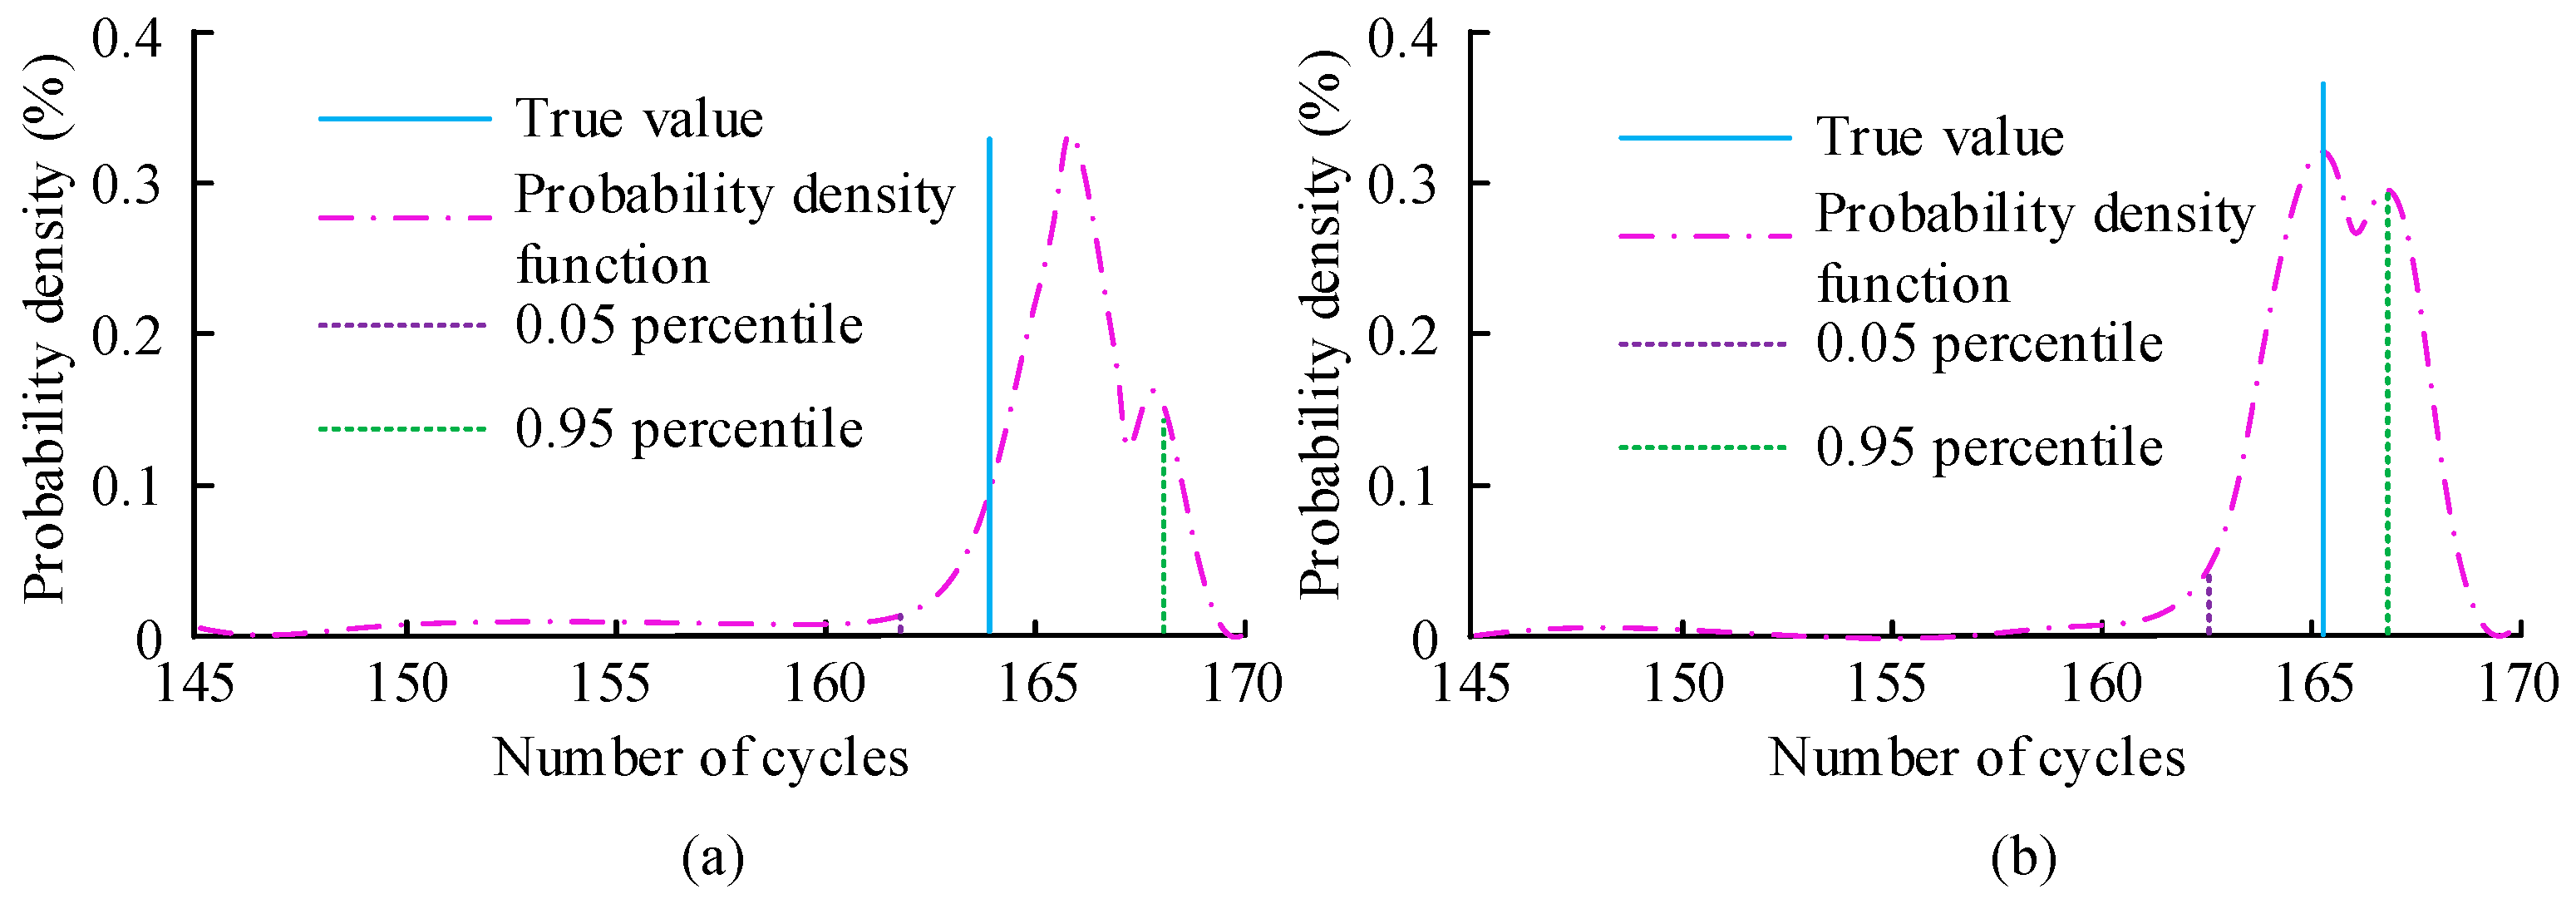
This study finally validated the RLP results of the PF algorithm for two batteries, as shown in Figure 11. Due to the differences in parameter vectors of the PF algorithm and the influence of noise, there was a certain error between the true value of the RF and the maximum a posteriori probability estimated by the PF algorithm. In Figure 11a, the average prediction error of the PF algorithm for LiNiMnCoO2 batteries was only 1.253 cycles. This indicates that the PF algorithm can accurately estimate the remaining service life of batteries with relatively small errors, and it can effectively support the long-term planning and use of battery management systems. In Figure 11b, the average prediction error of the PF algorithm for LiFePO4 batteries was only 0.053 cycles, indicating that the RLP accuracy based on the PF algorithm was relatively high. In addition, based on particle frequency distribution, this study calculated the 90% prediction interval for the remaining service life, which ranges from the 0.05 quantile to the 0.95 quantile. From Figure 11, the true values of the RL of each battery were within the prediction interval of the PF algorithm, which once again confirmed the high accuracy of this method in RLP of batteries.

4. Discussion

A Transformer–TDSE model and PF algorithm were proposed for state prediction for LIBs in energy storage power stations. The outcomes denoted that in SOCE, the Transformer–TDSE model had low MAE values at various temperatures, with the lowest being only 0.84% and the highest being 0.98%. The MAE value of the GRU model under 0 °C temperature conditions reached 4.86%, which was 4.01% higher than that of the Transformer–TDSE model. The Max Error value of the Transformer–TDSE model was significantly lower than that of other models, with Max Error values of 2.85%, 3.12%, 2.72%, 3.25%, and 2.81% at various temperatures, respectively. The Max Error value of the LSTM model was second only to the Transformer–TDSE model, with the lowest Max Error value being only 3.25. The Transformer–TDSE model demonstrated fast model training speed and accuracy during the training phase, as well as high accuracy in estimating the SOC. Similarly, scholars such as Rachman R K used an improved Transformer-based model to assess the SOC of batteries, with an estimation accuracy of over 90%. However, this model required longer training time and more computing resources [31]. In contrast, the Transformer–TDSE model performed better in terms of convergence speed and accuracy, especially in variable-temperature environments and under different operating conditions with higher prediction accuracy. In RLP, the PF algorithm had an average prediction error of only 1.253 cycles for LiNiMnCoO2 batteries. The average prediction error of the PF algorithm for LiFePO4 batteries was only 0.053 cycles, indicating that the RLP accuracy with the PF algorithm was relatively high. Zhang Z et al. [32] developed a mode-driven degradation process for predicting battery RL, using an expectation maximization algorithm based on joint learning sampling for model parameter estimation. The outcomes denoted that the raised method had an accuracy over 40% higher than the adaptive Wiener process. Compared with the proposed method, this method had higher prediction accuracy. Further research can improve the original PF algorithm. Overall, the SOCE method and RLP algorithm proposed by this research have high prediction accuracy.

5. Conclusions

To achieve SOCE and RLP of LIBs in energy storage power stations, an innovative Transformer–TDSE model was proposed, which optimized its response capability to battery delay and dynamic changes. At the same time, this study fully utilized the nonlinear state estimation capability of the PF algorithm, effectively overcoming the nonlinear challenges in battery life prediction and accurately tracking the health status of the battery and predicting its remaining life. The outcomes denoted that in the LiNiMnCoO2 dataset, the MAE value of the Transformer–TDSE model was 0.98% at 0 °C and only 0.82% at 40 °C. Meanwhile, the Max Error of the model was only 2.71% at a temperature of 40 °C and 2.81% at a temperature of 10 °C. In the LiFePO4 dataset, the highest and lowest MAE values of the Transformer–TDSE model were only 1.48% and 0.86%, respectively, corresponding to temperatures of 0 °C and 30 °C. Meanwhile, the Max Error value of this model was as low as 0.95%. Meanwhile, the capacity prediction accuracy of the PF algorithm was as high as 98.34%, which was 7.24% and 2.38% higher than the SVM and RF algorithms, respectively. The RMSE value of the PF algorithm was only 0.82%, while the RMSE value of the RF algorithm was as high as 2.05%, and the RMSE value of the SVM algorithm reached 1.43%. In addition, the true values of the RL of each battery were within the prediction interval of the PF algorithm. The combination of the Transformer–TDSE model and PF algorithm in a battery management system could accurately estimate the SOC of the battery and effectively predict the RL of the battery. Through this model combination, energy storage power stations could achieve more intelligent battery management, improving the stability and reliability of battery systems.
The method proposed by the research institute performs well in battery state estimation and life prediction, but there are still certain limitations. Firstly, under extreme operating conditions where the temperature is below −10 °C or above 50 °C, the Transformer–TDSE model experiences a significant increase in computational complexity due to the non-linear characteristics of the battery, leading to real-time inference delays in embedded systems. Secondly, when the battery capacity is below 70% of the rated value, the PF algorithm needs to maintain a particle count of 500 or more, which poses a problem of insufficient computing resources for edge devices with limited memory resources. In terms of a deployment plan, this method has the potential for multi-scenario adaptation. In response to such issues, future research on embedded systems can compress the parameter count of Transformer–TDSE models through model quantification and lightweight design. At the same time, when deployed on cloud platforms, the parallel computing characteristics of PF algorithms can be utilized to build a distributed computing framework that supports synchronous health management of thousands of battery packs. In addition, consider combining digital twin technology to achieve cloud optimization scheduling throughout the entire lifecycle.

Author Contributions

Conceptualization, B.G. and X.L.; methodology, B.G.; validation, B.G., F.G. and X.W.; formal analysis, B.G., F.G. and X.W.; investigation, B.G. and F.G.; resources, B.G. and X.L.; data curation, B.G. and X.W.; writing—original draft preparation, B.G.; writing—review and editing, B.G., X.L. and F.G.; visualization, B.G. and F.G. All authors have read and agreed to the published version of the manuscript.

Funding

This research was supported by the National Natural Science Foundation of China (grant number 52077202), Science Research Project of Hebei Education Department (grant number QN2022175).

Data Availability Statement

The LiNiMnCoO2 and LiFePO4 test datasets used in the experiment are confidential, and the source code is confidential. The source code of this paper is available on request from the corresponding author.

Conflicts of Interest

The authors declare no conflicts of interest.

Abbreviations

The following abbreviations are used in this manuscript:
LIBLithium battery
SOCState of charge
SOCEState-of-charge estimation
RLRemaining life
RLPRemaining life prediction
TDSETime delay second estimation
PFParticle filter
RMSERoot mean square error
MAEMean absolute error
SAMSelf-attention mechanism
LSTMLong short-term memory
GRUGated recurrent unit
SVMSupport vector machine
RFRandom forest

References

  1. Muhebwa, A.; Cadamuro, G.; Taneja, J. Pixel perfect: Using vision transformers to improve road quality predictions from medium resolution and heterogeneous satellite imagery. Acm. J. Comput. Sustain. Soc. 2023, 1, 1–17. [Google Scholar] [CrossRef]
  2. Shen, H.; Wang, Z.; Zhou, X.; Lamantia, M.; Yang, K.; Chen, P.; Wang, J. Electric vehicle velocity and energy consumption predictions using transformer and Markov-chain Monte Carlo. IEEE Trans. Transp. Electr. 2022, 8, 3836–3847. [Google Scholar] [CrossRef]
  3. Aizpurua, J.I.; Ramirez, I.; Lasa, I.; del Rio, L.; Ortiz, A.; Stewart, B.G. Hybrid transformer prognostics framework for enhanced probabilistic predictions in renewable energy applications. IEEE Trans. Power Deliv. 2022, 38, 599–609. [Google Scholar] [CrossRef]
  4. Andronov, M.; Voinarovska, V.; Andronova, N.; Wand, M.; Clevert, D.-A.; Schmidhuber, J. Reagent prediction with a molecular transformer improves reaction data quality. Chem. Sci. 2023, 14, 3235–3246. [Google Scholar] [CrossRef] [PubMed]
  5. Liu, Y.; Chen, S.; Li, P.; Wang, J. Status, challenges, and promises of data-driven battery lifetime prediction under cyber-physical system context. IET Cyber-Phys. Syst. 2024, 9, 207–217. [Google Scholar] [CrossRef]
  6. Xu, W.; Wang, S.; Jiang, C.; Fernandez, C.; Yu, C.; Fan, Y.; Cao, W. A novel adaptive dual extended Kalman filtering algorithm for the Li-ion battery state of charge and state of health co-estimation. Int. J. Energy Res. 2021, 45, 14592–14602. [Google Scholar] [CrossRef]
  7. Wang, S.; Zhang, S.; Wen, S.; Fernandez, C. An accurate state-of-charge estimation of lithium-ion batteries based on improved particle swarm optimization-adaptive square root cubature kalman filter. J. Power Sources 2024, 624, 235594. [Google Scholar] [CrossRef]
  8. Shu, X.; Shen, J.; Li, G.; Zhang, Y.; Chen, Z.; Liu, Y. A flexible state-of-health prediction scheme for lithium-ion battery packs with long short-term memory network and transfer learning. IEEE Trans. Transp. Electr. 2021, 7, 2238–2248. [Google Scholar] [CrossRef]
  9. Cong, X.; Zhang, C.; Jiang, J.; Zhang, W.; Jiang, Y. A hybrid method for the prediction of the remaining useful life of lithium-ion batteries with accelerated capacity degradation. IEEE Trans. Veh. Technol. 2020, 69, 12775–12785. [Google Scholar] [CrossRef]
  10. Tran, M.K.; Panchal, S.; Chauhan, V.; Brahmbhatt, N.; Mevawalla, A.; Fraser, R.; Fowler, M. Python-based scikit-learn machine learning models for thermal and electrical performance prediction of high-capacity lithium-ion battery. Int. J. Energy Res. 2022, 46, 786–794. [Google Scholar] [CrossRef]
  11. Naseri, F.; Schaltz, E.; Stroe, D.-I.; Gismero, A.; Farjah, E. An enhanced equivalent circuit model with real-time parameter identification for battery state-of-charge estimation. IEEE Trans. Ind. Electr. 2021, 69, 3743–3751. [Google Scholar] [CrossRef]
  12. Liu, L.; Yan, Z.; Xu, B.; Zhang, P.; Cai, C.; Yang, H. A highly scalable integrated voltage equalizer based on parallel-transformers for high-voltage energy storage systems. IEEE Trans. Ind. Electr. 2023, 71, 595–603. [Google Scholar] [CrossRef]
  13. Zheng, L.; Marellapudi, A.; Chowdhury, V.R.; Bilakanti, N.; Kandula, R.P.; Saeedifard, M.; Grijalva, S.; Divan, D. Solid-state transformer and hybrid transformer with integrated energy storage in active distribution grids: Technical and economic comparison, dispatch, and control. IEEE J. Emerg. Sel. Top. Power Electr. 2022, 10, 3771–3787. [Google Scholar] [CrossRef]
  14. Xu, B.; Yan, Z.; Zhou, W.; Zhang, L.; Yang, H.; Liu, Y.; Liu, L. A bidirectional integrated equalizer based on the sepic–zeta converter for hybrid energy storage 15. system. IEEE Trans. Power Electron. 2022, 37, 12659–12668. [Google Scholar] [CrossRef]
  15. Wang, Y.; Zhang, J.; Zhang, B.; Jin, Q. Research and implementation of Chinese couplet generation system with attention-based transformer mechanism. IEEE TCSS 2021, 9, 1020–1028. [Google Scholar] [CrossRef]
  16. Wang, J.; Zou, Y.; Alfarraj, O.; Sharma, P.K.; Said, W.; Wang, J. Image super-resolution method based on the interactive fusion of transformer and CNN features. Vis. Comput. 2024, 40, 5827–5839. [Google Scholar] [CrossRef]
  17. Gou, B.; Xu, Y.; Feng, X. State-of-health estimation and remaining-useful-life prediction for lithium-ion battery using a hybrid data-driven method. IEEE Trans. Veh. Technol. 2020, 69, 10854–10867. [Google Scholar] [CrossRef]
  18. Maddikunta, P.K.R.; Srivastava, G.; Gadekallu, T.R.; Deepa, N.; Boopathy, P. Predictive model for battery life in IoT networks. IET Intell. Transp. Syst. 2020, 14, 1388–1395. [Google Scholar] [CrossRef]
  19. Hunter, C.A.; Penev, M.M.; Reznicek, E.P.; Eichman, J.; Rustagi, N.; Baldwin, S.F. Techno-economic analysis of long-duration energy storage and flexible power generation technologies to support high-variable renewable energy grids. Joule 2021, 5, 2077–2101. [Google Scholar] [CrossRef]
  20. Zhang, X.; Wang, B.; Gamage, D.; Ukil, A. Model predictive and iterative learning control based hybrid control method for hybrid energy storage system. IEEE Trans. Sustain. Energy 2021, 12, 2146–2158. [Google Scholar] [CrossRef]
  21. Manuel, H.N.N.; Kehinde, H.M.; Agupugo, C.P.; Manuel, A.C.N. The impact of AI on boosting renewable energy utilization and visual power plant efficiency in contemporary construction. WJARR 2024, 23, 1333–1348. [Google Scholar] [CrossRef]
  22. Rouholamini, M.; Wang, C.; Nehrir, H.; Hu, X.; Hu, Z.; Aki, H.; Zhao, B.; Miao, Z.; Strunz, K. A review of modeling, management, and applications of grid-connected Li-ion battery storage systems. IEEE Trans. Smart Grid 2022, 13, 4505–4524. [Google Scholar] [CrossRef]
  23. Zhou, S.; Chen, Z.; Huang, D.; Lin, T. Model prediction and rule based energy management strategy for a plug-in hybrid electric vehicle with hybrid energy storage system. IEEE TPE 2020, 36, 5926–5940. [Google Scholar] [CrossRef]
  24. Hu, X.; Deng, X.; Wang, F.; Deng, Z.; Lin, X.; Teodorescu, R.; Pecht, M.G. A review of second-life lithium-ion batteries for stationary energy storage applications. Proc. IEEE 2022, 110, 735–753. [Google Scholar] [CrossRef]
  25. Zhou, L.; Yang, D.; Zhai, X.; Wu, S.; Hu, Z.; Liu, J. GA-STT: Human trajectory prediction with group aware spatial-temporal transformer. IEEE Robot. Autom. Lett. 2022, 7, 7660–7667. [Google Scholar] [CrossRef]
  26. Vishnu, C.; Abhinav, V.; Roy, D.; Mohan, C.K.; Babu, C.S. Improving multi-agent trajectory prediction using traffic states on interactive driving scenarios. IEEE Robot Autom. Lett. 2023, 8, 2708–2715. [Google Scholar] [CrossRef]
  27. Huang, K.; Xiao, C.; Glass, L.M.; Sun, J. MolTrans: Molecular interaction transformer for drug–target interaction prediction. Bioinformatics 2021, 37, 830–836. [Google Scholar] [CrossRef]
  28. Cao, Z.; Magar, R.; Wang, Y.; Barati Farimani, A. Moformer: Self-supervised transformer model for metal–organic framework property prediction. JACS 2023, 145, 2958–2967. [Google Scholar] [CrossRef]
  29. Jiang, J.; Han, C.; Zhao, W.X.; Wang, J. Pdformer: Propagation delay-aware dynamic long-range transformer for traffic flow prediction. AAAI 2023, 37, 4365–4373. [Google Scholar] [CrossRef]
  30. Yang, T.; Bai, X.; Cui, X.; Gong, Y.; Li, L. TransDIR: Deformable imaging registration network based on transformer to improve the feature extraction ability. Med. Phys. 2022, 49, 952–965. [Google Scholar] [CrossRef]
  31. Rachman, R.K.; Susanto, A.; Nugroho, K.; Islam, H.M.M. Enhanced Vision Transformer and Transfer Learning Approach to Improve Rice Disease Recognition. J. Comput. Theor. Appl. 2024, 1, 446–460. [Google Scholar] [CrossRef]
  32. Zhang, Z.; Jeong, Y.; Jang, J.; Lee, C.G. A pattern-driven stochastic degradation model for the prediction of remaining useful life of rechargeable batteries. IEEE Trans. Ind. Informatics 2022, 18, 8586–8594. [Google Scholar] [CrossRef]
Figure 1. Transformer structure before and after improvement: (a) schematic diagram of Transformer structure; (b) schematic diagram of improving structure of Transformer model.
Batteries 11 00262 g001
Figure 2. Detailed explanation of the dual-head SAM.
Batteries 11 00262 g002
Figure 3. Schematic diagram and process of state-of-charge estimation for Transformer–TDSE model: (a) schematic diagram of state-of-charge estimation based on Transformer–TDSE model; (b) battery state-of-charge estimation process based on Transformer–TDSE model.
Batteries 11 00262 g003
Figure 4. Flowchart of PF algorithm.
Batteries 11 00262 g004
Figure 5. Error curves of charge and discharge state estimation for each dataset: (a) error in LiNiMnCoO2 dataset at 10 °C; (b) error in LiNiMnCoO2 dataset at 30 °C; (c) error in LiFePO4 dataset at 10 °C; (d) error in LiFePO4 dataset at 30 °C.
Batteries 11 00262 g005
Figure 6. MAE and Max Error on different datasets: (a) prediction error of LiNiMnCoO2 dataset; (b) prediction error of LiFePO4 dataset.
Batteries 11 00262 g006
Figure 7. Accuracy and loss rate of SOCE for LIB with different models at different temperatures: (a) accuracy of different algorithms; (b) loss rate of different algorithms.
Batteries 11 00262 g007
Figure 8. Estimation errors of lithium battery SOC for various models at different temperatures: (a) MAE values of various algorithms; (b) Max Error values of various algorithms.
Batteries 11 00262 g008
Figure 9. Capacity prediction results of PF algorithm for different LIB: (a) accuracy of RLP for LiNiMnCoO2 batteries; (b) accuracy of RLP for LiFePO4 batteries.
Batteries 11 00262 g009
Figure 10. Capacity prediction results of various methods on different datasets: (a) prediction accuracy; (b) RMSE.
Batteries 11 00262 g010
Figure 11. PF algorithm predicts the LF of two batteries: (a) RLP of LiNiMnCoO2 battery; (b) RLP of LiFePO4 battery.
Batteries 11 00262 g011
Table 1. Experimental environment.
NameSpecific Configuration
Operating systemUbuntu 18.04
Deep learning frameworkPytorch 1.8
CPUI7-11700 K
GPUNVIDIA GeForce RTX 3080Ti
Hard disk500 G
Internal storage32 G
Table 2. Lithium battery parameters.
Data SetLiNiMnCoO2LiFePO4
Rated capacity (Ah)2.02.5
Rated open circuit voltage (V)3.73.2
Minimum/maximum operating voltage (V)2.5/4.22.0/3.6
Table 3. Initial parameter settings for PF algorithm.
Data SetLiNiMnCoO2LiFePO4
A 0 0.13−2.45
B 0 −0.0150.016
C 0 1.804.38
D 0 −0.003−0.002
Observation variance σ v 0.010.01
Particle number500500
Failure threshold1.31.4
Table 4. Prediction results of lithium battery capacity decline.
//LiNiMnCoO2LiFePO4
Double exponential modelRMSE (%)1.11.3
MAE (%)0.60.8
Equivalent circuit modelRMSE (%)4.25.0
MAE (%)3.63.9
Disclaimer/Publisher’s Note: The statements, opinions and data contained in all publications are solely those of the individual author(s) and contributor(s) and not of MDPI and/or the editor(s). MDPI and/or the editor(s) disclaim responsibility for any injury to people or property resulting from any ideas, methods, instructions or products referred to in the content.