Article

Impact Testing of Aging Li-Ion Batteries from Light Electric Vehicles (LEVs)

by
Miguel Antonio Cardoso-Palomares
1,
Juan Carlos Paredes-Rojas
2,
Juan Alejandro Flores-Campos
3,
Armando Oropeza-Osornio
4 and
Christopher René Torres-SanMiguel
1,*
1
Instituto Politécnico Nacional, Escuela Superior de Ingeniería Mecánica y Eléctrica, Sección de Estudios de Posgrado e Investigación, Unidad Zacatenco, Mexico City 07738, Mexico
2
Instituto Politécnico Nacional, Escuela Superior de Ingeniería Mecánica y Eléctrica, Unidad Culhuacán, Mexico City 04440, Mexico
3
Instituto Politécnico Nacional, Unidad Profesional Interdisciplinaria en Ingeniería y Tecnologías Avanzadas, Mexico City 07340, Mexico
4
Instituto Politécnico Nacional, Escuela Superior de Ingeniería Mecánica y Eléctrica, Unidad Ticomán, Mexico City 07340, Mexico
*
Author to whom correspondence should be addressed.
Batteries 2025, 11(7), 263; https://doi.org/10.3390/batteries11070263
Submission received: 12 May 2025 / Revised: 7 July 2025 / Accepted: 8 July 2025 / Published: 13 July 2025

Abstract

The increasing adoption of Light Electric Vehicles (LEVs) in urban areas, driven by the micromobility wave, raises significant safety concerns, particularly regarding battery fire incidents. This research investigates the electromechanical performance of aged 18650 lithium-ion batteries (LIBs) from LEVs under mechanical impact conditions. For this study, a battery module from a used e-scooter was disassembled, and its constituent cells were reconfigured into compact modules for testing. To characterize their initial condition, the cells underwent cycling tests to evaluate their state of health (SOH). Although a slight majority of the cells retained an SOH greater than 80%, a notable increase in their internal resistance (IR) was also observed, indicating degradation due to aging. The mechanical impact tests were conducted in adherence to the UL 2271:2018 standard, employing a semi-sinusoidal acceleration pulse. During these tests, linear kinematics were analyzed using videogrammetry, while key electrical and thermal parameters were monitored. Additionally, strain gauges were installed on the central cells to measure stress and deformation. The results from the mechanical shock tests revealed characteristic acceleration and velocity patterns. These findings clarify the electromechanical behavior of aged LIBs under impact, providing critical data to enhance the safety and reliability of these vehicles.

1. Introduction

Currently, unsustainable urban development accounts for 70% of global Greenhouse Gas (GHG) emissions, with urbanized areas contributing 23% [1]. The trend is that by 2030, it will increase by 20%, and by 2050, it will increase by 50% [2]. According to the United Nations (UN), GHG emissions cause an increase of approximately 2 °C in global temperature [3]. It also affects air quality in cities, where poor air quality poses a critical risk to the population’s health, leading to pathologies in the respiratory, cardiovascular, and central nervous systems [2,4,5,6]. For this reason, electromobility has been proposed as an early solution to the emissions caused by transport using internal combustion engines (ICEs) [7].
One trend within electromobility that has led to an increase in the sales of Light Electric Vehicles (LEVs) is micromobility. This can be defined as the use of light vehicles powered by non-polluting energies for short trips in built-up areas [8,9]. Dependence on cars is one of the main problems in large cities worldwide, so micromobility offers a sustainable, viable, and flexible transportation alternative [10,11,12], in addition to improving the psychological and physical well-being of users [13]. As a result, multiple cities have promoted and implemented infrastructure for this type of transportation, leading to a significant shift in the way people get around [10,11]. Over the last 20 years, shared mobility systems have grown from fewer than 10 cities around the year 2000 to just over 2900 cities worldwide in 2021 [14,15]. Among the vehicles that can be considered within this category are powered and unpowered vehicles, such as bicycles, skateboards, and tricycles. However, there is no standard classification in micromobility vehicles; the International Transport Forum (IFT) proposes four categories to classify micromobility from a safety perspective [8]:
  • Type A: Powered or unpowered vehicles weighing less than 35 kg and with a maximum powered design speed of 25 km/h.
  • Type B: Powered or unpowered vehicles weighing between 35 kg and 350 kg and with a maximum powered design speed of 25 km/h.
  • Type C: Powered vehicles weighing less than 35 kg and with a design speed between 25 km/h and 45 km/h.
  • Type D: Powered vehicles weighing between 35 kg and 350 kg and with a design speed between 25 km/h and 45 km/h.
Likewise, in LEV classification, the European Union offers a categorization within its L-category vehicle classification system. The L1e-L3e classes cover two-wheeled vehicles, which include e-scooters, e-bikes, and e-motorcycles [9]. Since 2017, through direct sales or shared mobility platforms, LEVs have been introduced into road traffic of more than 100 cities [16]. In the United States (US), shared micromobility systems have recorded over 133 million trips in 2023, a tenfold increase in just a decade. To achieve a substantial impact on sustainability, micromobility has the following fundamental objectives: reducing GHG emissions by reducing the use of polluting vehicles, reducing costs to bridge the social gap through sustainable business models, and improving safety and infrastructure to enhance the travel experience [17]. However, this trend has brought serious security problems to the population. Quick adoption has outpaced the necessary evolution of infrastructure, traffic regulations, and public awareness, creating a new and often poorly understood safety paradigm [9]. In China, between 2013 and 2017, there were 10,000 incidents related to fires in LEV batteries, resulting in more than 200 deaths. In England, 70 fires related to this problem were reported in London in 2021, with no fatalities. In the US, between 2021 and 2022 there were 19 deaths from incidents of this type, with New York City having the most such incidents, registering 104 fires in 2021, reaching almost double the number of incidents for the following year with 6 deaths, and 13 deceases had been reported by mid-2023, with almost the same number of fires as at the end of 2022, so an upward trend is set for the following years [18]. Spielbauer et al. [19] predict that battery fire incidents and their severity will increase in the future due to two factors: the increasing energy density of new cells being developed and the growing demand for batteries to meet the EV market. Gehandler et al. [20] report that, on average, one Battery Electric Vehicle (BEV) fire occurs per year during battery charging in multi-story car parks or large garages. Meigs [18] investigates multiple fires caused by LEV batteries, from storage warehouses to apartment buildings, which have raised concerns among both the population and government authorities.
Pan et al. [21] recommend avoiding discharging the battery altogether and avoiding leaving it unused for extended periods, as this can cause premature aging and increase the risk of fatal failure.
The energy storage system of electric vehicles is responsible for supplying the stored electrical energy to the vehicle’s propulsion system and secondary systems [22]. Lithium-ion batteries (LIBs) are widely used in the electromobility sector as energy storage due to their high energy density, which is significantly better than that of other types of batteries, such as lead–acid, nickel–cadmium, and nickel–metal, which were once used but have been displaced by LIBs. The energy storage system in electric vehicles can be divided into three categories: (1) The cell—the name given to an individual battery. Internally, it is composed of positive and negative electrodes, separators, and an electrolyte, embedded in a metal housing (typically steel or aluminum), with positive and negative terminals on the exterior. (2) The module—the connection of multiple cells in series or parallel, placed on polymer bases and connected with nickel-plated steel sheets welded to the cell terminals. Additionally, a battery management system (BMS) is connected and embedded in a heat-shrinkable plastic and a general housing (aluminum, ABS, or fiberglass), as required by the application. (3) The package—at this level, this is formed by combining modules, which are connected in series or parallel, depending on the application. Like the module, a battery management system is required. However, this system incorporates sensors and microcontrollers, as well as support systems (such as cooling and/or heating) to ensure its correct operation. Likewise, the package is protected by a structure with protection plates to maintain the battery’s integrity in the event of mechanical impact [23,24]. According to Wang et al. and Goodman et al. [25,26], BEVs that suffer a traffic accident, can deform and/or fracture main elements of their energy storage system, which would cause failures such as disconnection between key elements, and external or internal short circuit in the cells, which could result in battery fire. The correct positioning of the energy storage system, together with an appropriate structural design, is a key parameter for electric vehicle safety [27].
In safety micromobility, the literature focuses on the injuries caused by collisions or road traffic accidents. The authors report on the severity and the body region affected by driver-users, where the upper and lower extremities are the most affected, mostly in LEVs like e-scooters, e-bikes, and conventional bikes [8]. Data from the US Consumer Product Safety Commission (CPSC) paints a stark picture, with Emergency Department (ED) visits related to e-scooters showing consistent year-over-year growth, nearly doubling in 2019 compared to the previous year. Additionally, overall micromobility injuries have increased by an estimated average of 23% annually since 2017. This trend has continued, with injuries soaring by nearly 21% in 2022 alone, accompanied by a rising number of fatalities [28,29]. In terms of collision type, there are collisions involved that occur due to loss of vehicle control or collisions with stationary objects, as well as crashes with objects in motion, such as motor vehicles, which can result in rear-end crashes or hit-and-run incidents. Another crash type involves pedestrians tripping over e-scooters or fallen bicycles [9]. However, the literature does not mention how road traffic accidents occur and what happened with the LEVs.
The safety of the energy storage systems of electric vehicles is critical for their safe use on the streets, as even the highest level of protection is insufficient to prevent fires at high speeds. Zhu et al. [30] noted that battery packs are susceptible to penetration due to sideswipe collisions and road debris impacts. In mechanical abuse, LIBs could have malfunctions, such as the breakage of the module’s external and internal support elements. This can lead to the disconnection between main elements, such as the BMS with the cells, as well as the rupture of the connector plates between the internal cells, which would cause a reduction in the voltage and energy capacity of the module. In more serious failures, an external or internal short circuit may occur in the cells due to the intrusion of conductive materials into the module. In this condition, LIBs exhibit a voltage drop and an increase in temperature, which varies depending on the type of short circuit. In external short circuits, the increase in temperature and voltage drop is progressive, which causes electrolyte leakage due to the increase in internal pressure in the cell. However, if it were to occur between the longitudinal faces of the cells, the steel would melt due to the extreme increase in temperature, which would cause a fracture in the casing, allowing the electrolyte to leak.
On the other hand, in internal short circuits, the thermal reaction is extremely violent; when an external conductive element penetrates the cell, or the internal roll is billed by the formation of dendrites due to aging, this causes conjunction between the anode and the cathode, quickly causing a voltage drop, and an increase in internal temperature and pressure, which leads to thermal runaway from the cell. At the module level, this can lead to a domino effect in the surrounding cells, as the external increase in temperature in a cell also leads to different levels of failures due to the evaporation of the internal electrolyte, from the decrease in energy capacity, to an internal short circuit due to the total evaporation of the electrolyte and the melting of the separator, resulting in thermal runaway from multiple cells. Even if the pressure inside the module or package is very high, deflagration can occur [27,28,29,30,31,32]. Zhao et al. and Larsson [33,34] found that an internal short circuit can occur for multiple reasons, such as mechanical deformations or manufacturing failures. They also observed that another reason may be the formation of dendrites within the cells that fracture the internal materials of the roll due to aging.
In fire propagation, full-scale experiments conducted in residential structures show that an e-scooter fire can cause a room to reach flashover, a state where all combustible surfaces ignite simultaneously within 30 s of the first visible smoke being emitted from the battery. The time from that first puff of smoke to a violent gas explosion can be as little as 10–20 s, making the room of origin immediately fatal and rendering escape nearly impossible [35]. For suppression fires, Torelli et al. [36] quantify the consequences of a single-cell thermal runaway failure within an e-mobility battery pack and determine the effectiveness of various suppression strategies that could be employed by a user in a home environment. Direct water cooling only partially mitigated the event by lowering the temperature and slowing the propagation, but it could not extinguish it. Fire blankets were counterproductive, failing to contain hazards while increasing pack temperature by insulating the event. The study concludes that incorporating design features, such as thermal insulation between cells, is a more robust solution for preventing thermal propagation and minimizing the severity of battery failure.
Aging in LIBs has been rigorously studied, as it undergoes a series of gradual and irreversible degradation processes. Aging leads to a reduction in nominal capacity and an increase in internal resistance (IR), which is the opposition to current flow inside the LIB. The elevated internal resistance in an aged cell is a critical factor that fundamentally alters its response to abuse. The state of health (SOH) of the battery is a quantitative parameter that measures the current state of a cell with respect to its original state. At the micro level, the presence of microcracks in the anode and cathode material, due to the formation of dendrites, can lead to serious failures such as an internal short circuit. In a 1000-cycle aging study, Goodman et al. [26] found that small-format pouch cells damaged by three-point bending often remained electrically functional despite the formation of internal short circuits (ISCs), but exhibited accelerated degradation, as confirmed by electrical characterization, Computed Tomography (CT), and post-mortem analysis. According to Santhanagopalan et al. [37], this type of failure can be presented by cells that comply with the safety regulations implemented in industry, due to imperceptible failures in manufacturing, so it should be of special attention in future research.
A significant gap exists in the scientific literature regarding the long-term impact of mechanical stress on the safety and aging of lithium-ion batteries, a topic that has received far less attention than aging under standard operating conditions. To understand the influence of cycling on mechanical damage, Fuchs et al. [38] characterized and compared two pouch cells, one cycled and one not, after inducing deformation with a 4 mm diameter steel ball, employing post-mortem and SEM analysis for the investigation. Significantly accelerated aging was observed by Li et al. [39] in 21,700 cylindrical cells subjected to radial compressions of 3 mm and 6 mm, followed by 100 cycles. Through characterization using Incremental Capacity Analysis (ICA), Electrochemical Impedance Spectroscopy (EIS), and CT, this degradation was attributed to potential micro-leakage at the positive terminal gasket. In an experiment by Sahraei et al. [40], cylindrical 18650 LFP cells underwent rod indentation with a 6 mm diameter and 4.6 mm depth, followed by subsequent cycling for up to 89 times. After this, their performance showed no significant degradation relative to control cells.
Given the operation of Light Electric Vehicles (LEVs) in urban areas, these vehicles are not exempt from traffic accidents. Therefore, with the growing demand for this type of electric vehicle in recent years, the number of accidents due to falls and collisions with mobile or stationary objects is also expected to increase. In the context of electric micromobility, such situations are typically addressed from the perspective of injuries to the user and/or other affected individuals. However, energy storage systems based on electrochemical lithium-ion cells, such as those found in bicycles, scooters, and tricycles, can malfunction under conditions of mechanical abuse, as might occur in a traffic collision. The UL 2271:2018 standard categorizes the outcomes of such abuse into several levels of severity [41]:
  • Loss of protective control.
  • Electric shock hazard.
  • Venting.
  • Electrolyte leakage.
  • Rupture.
  • Fuel concentration.
  • Fire.
  • Explosion.
Consequently, the quantification of abuse during such an event is of significant interest, as it can trigger a battery malfunction that may lead to catastrophic failure and a hazardous situation for users and third parties.
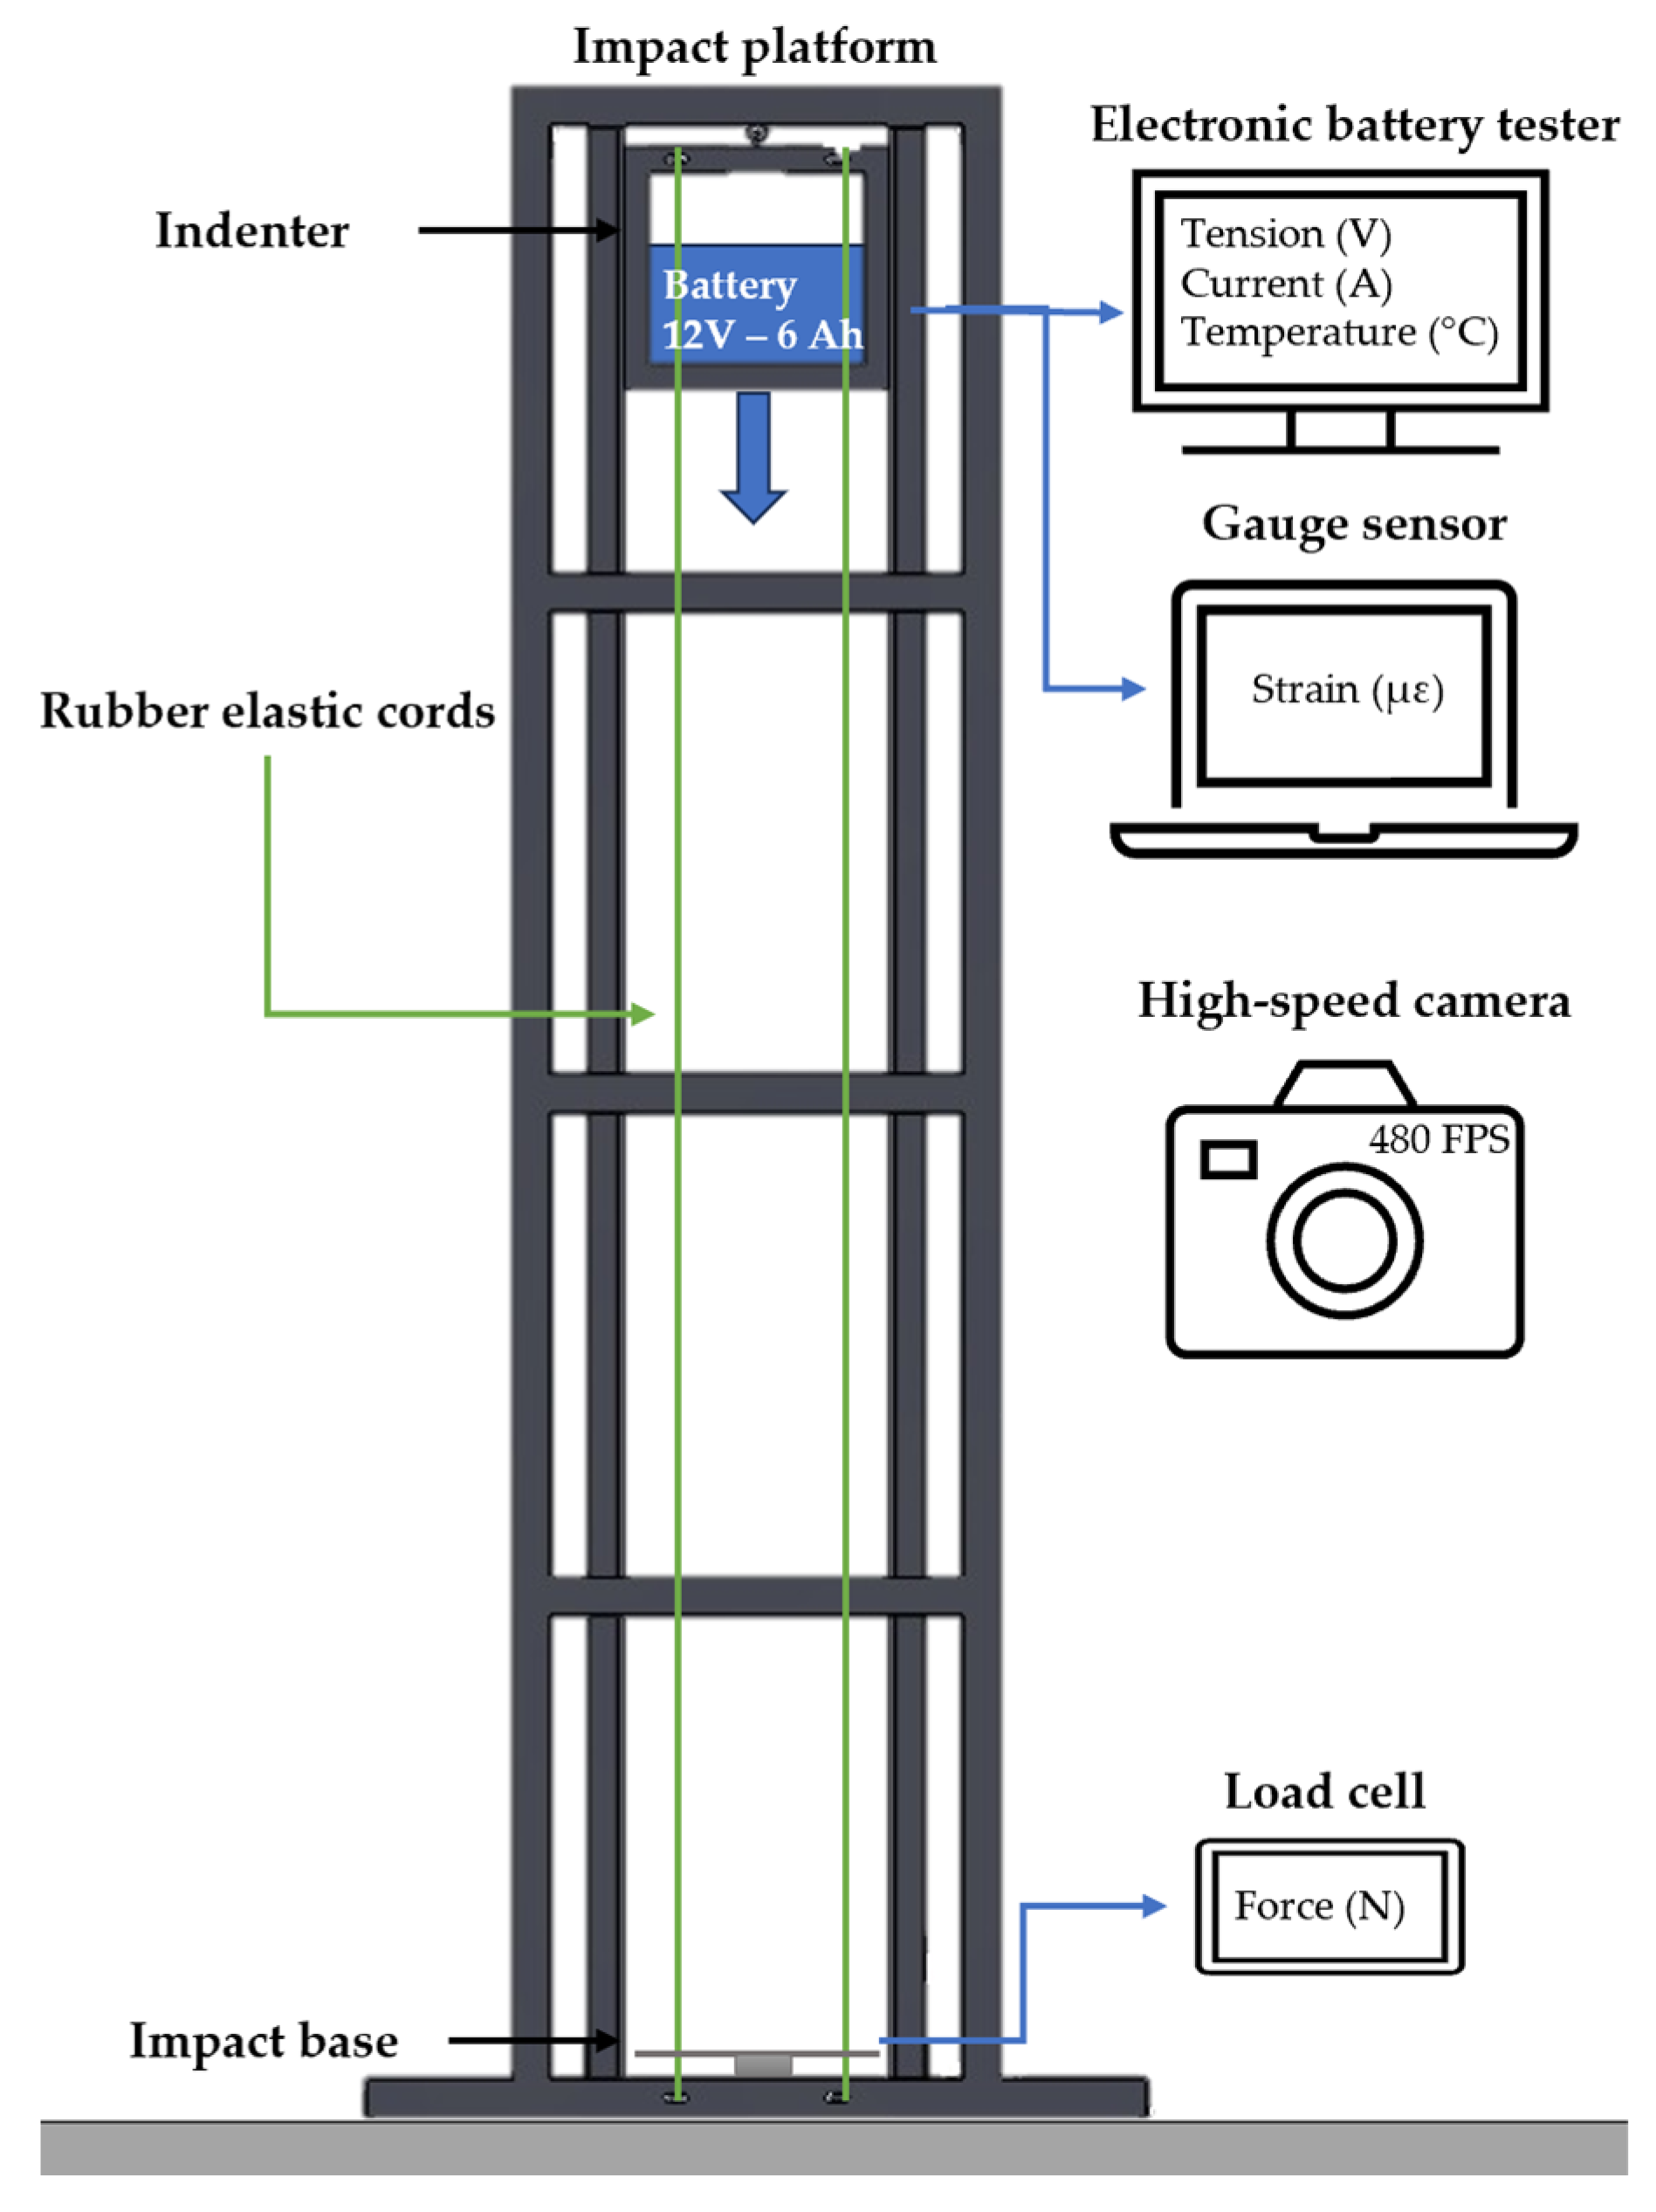
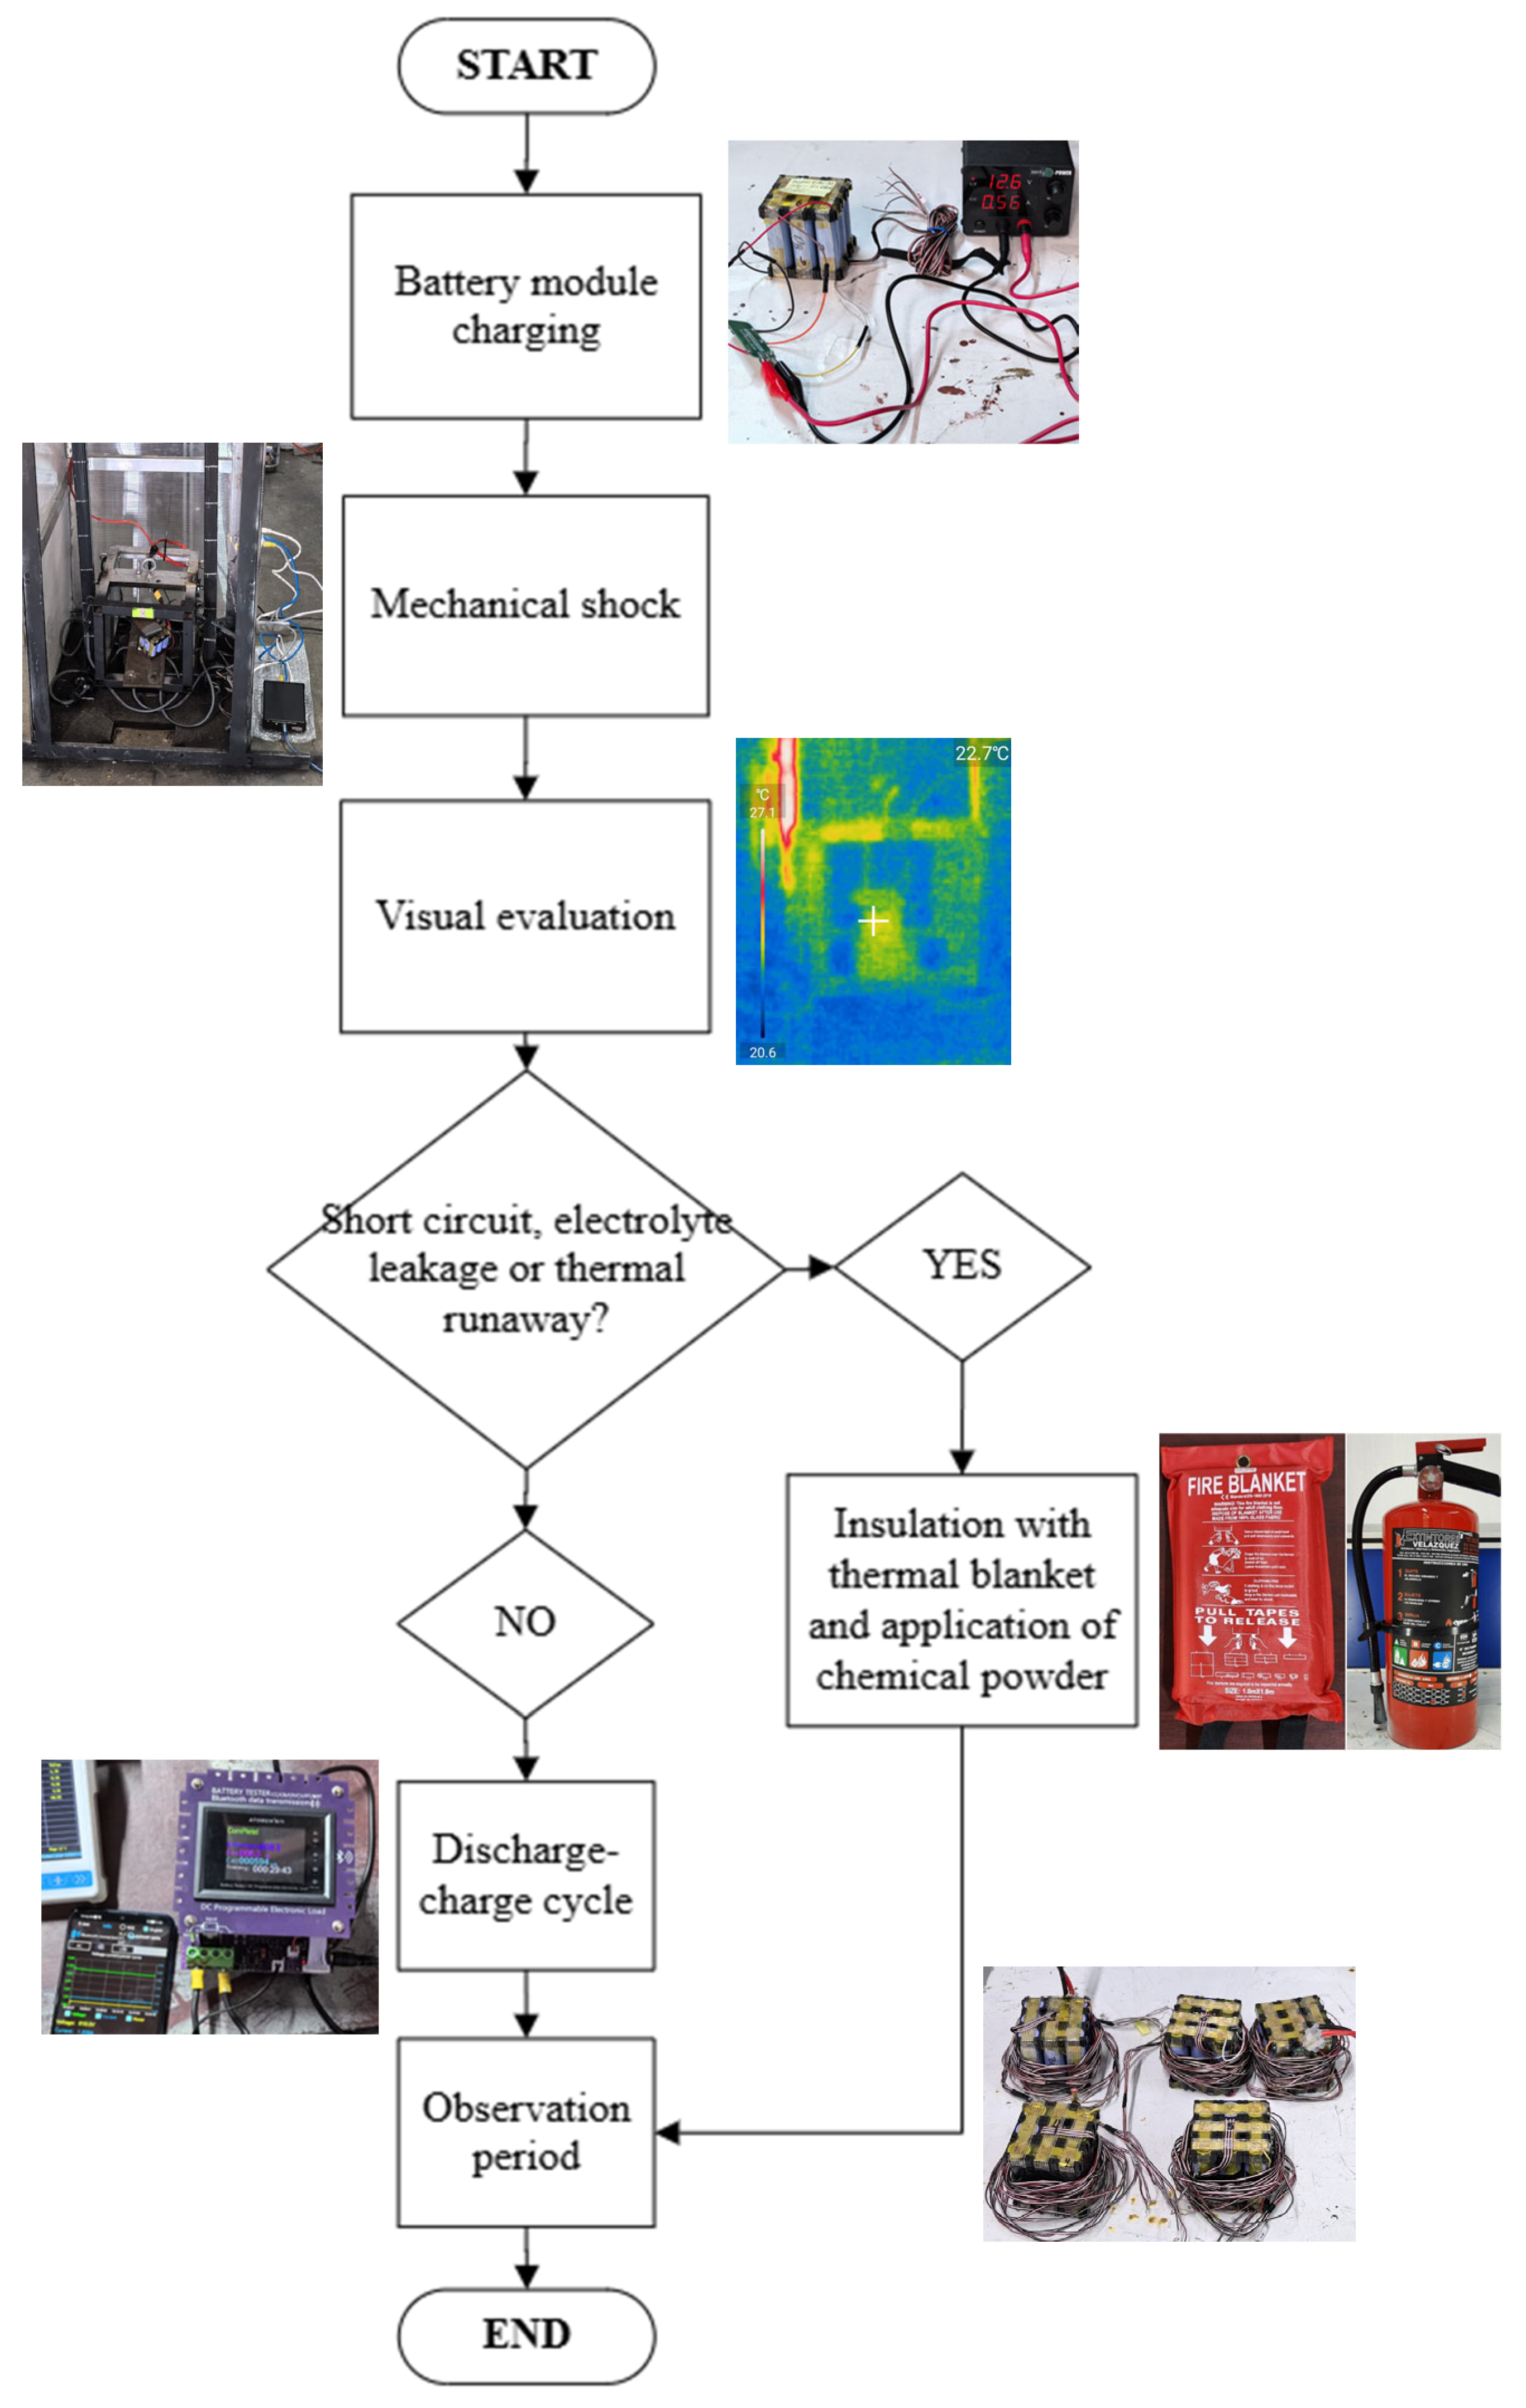
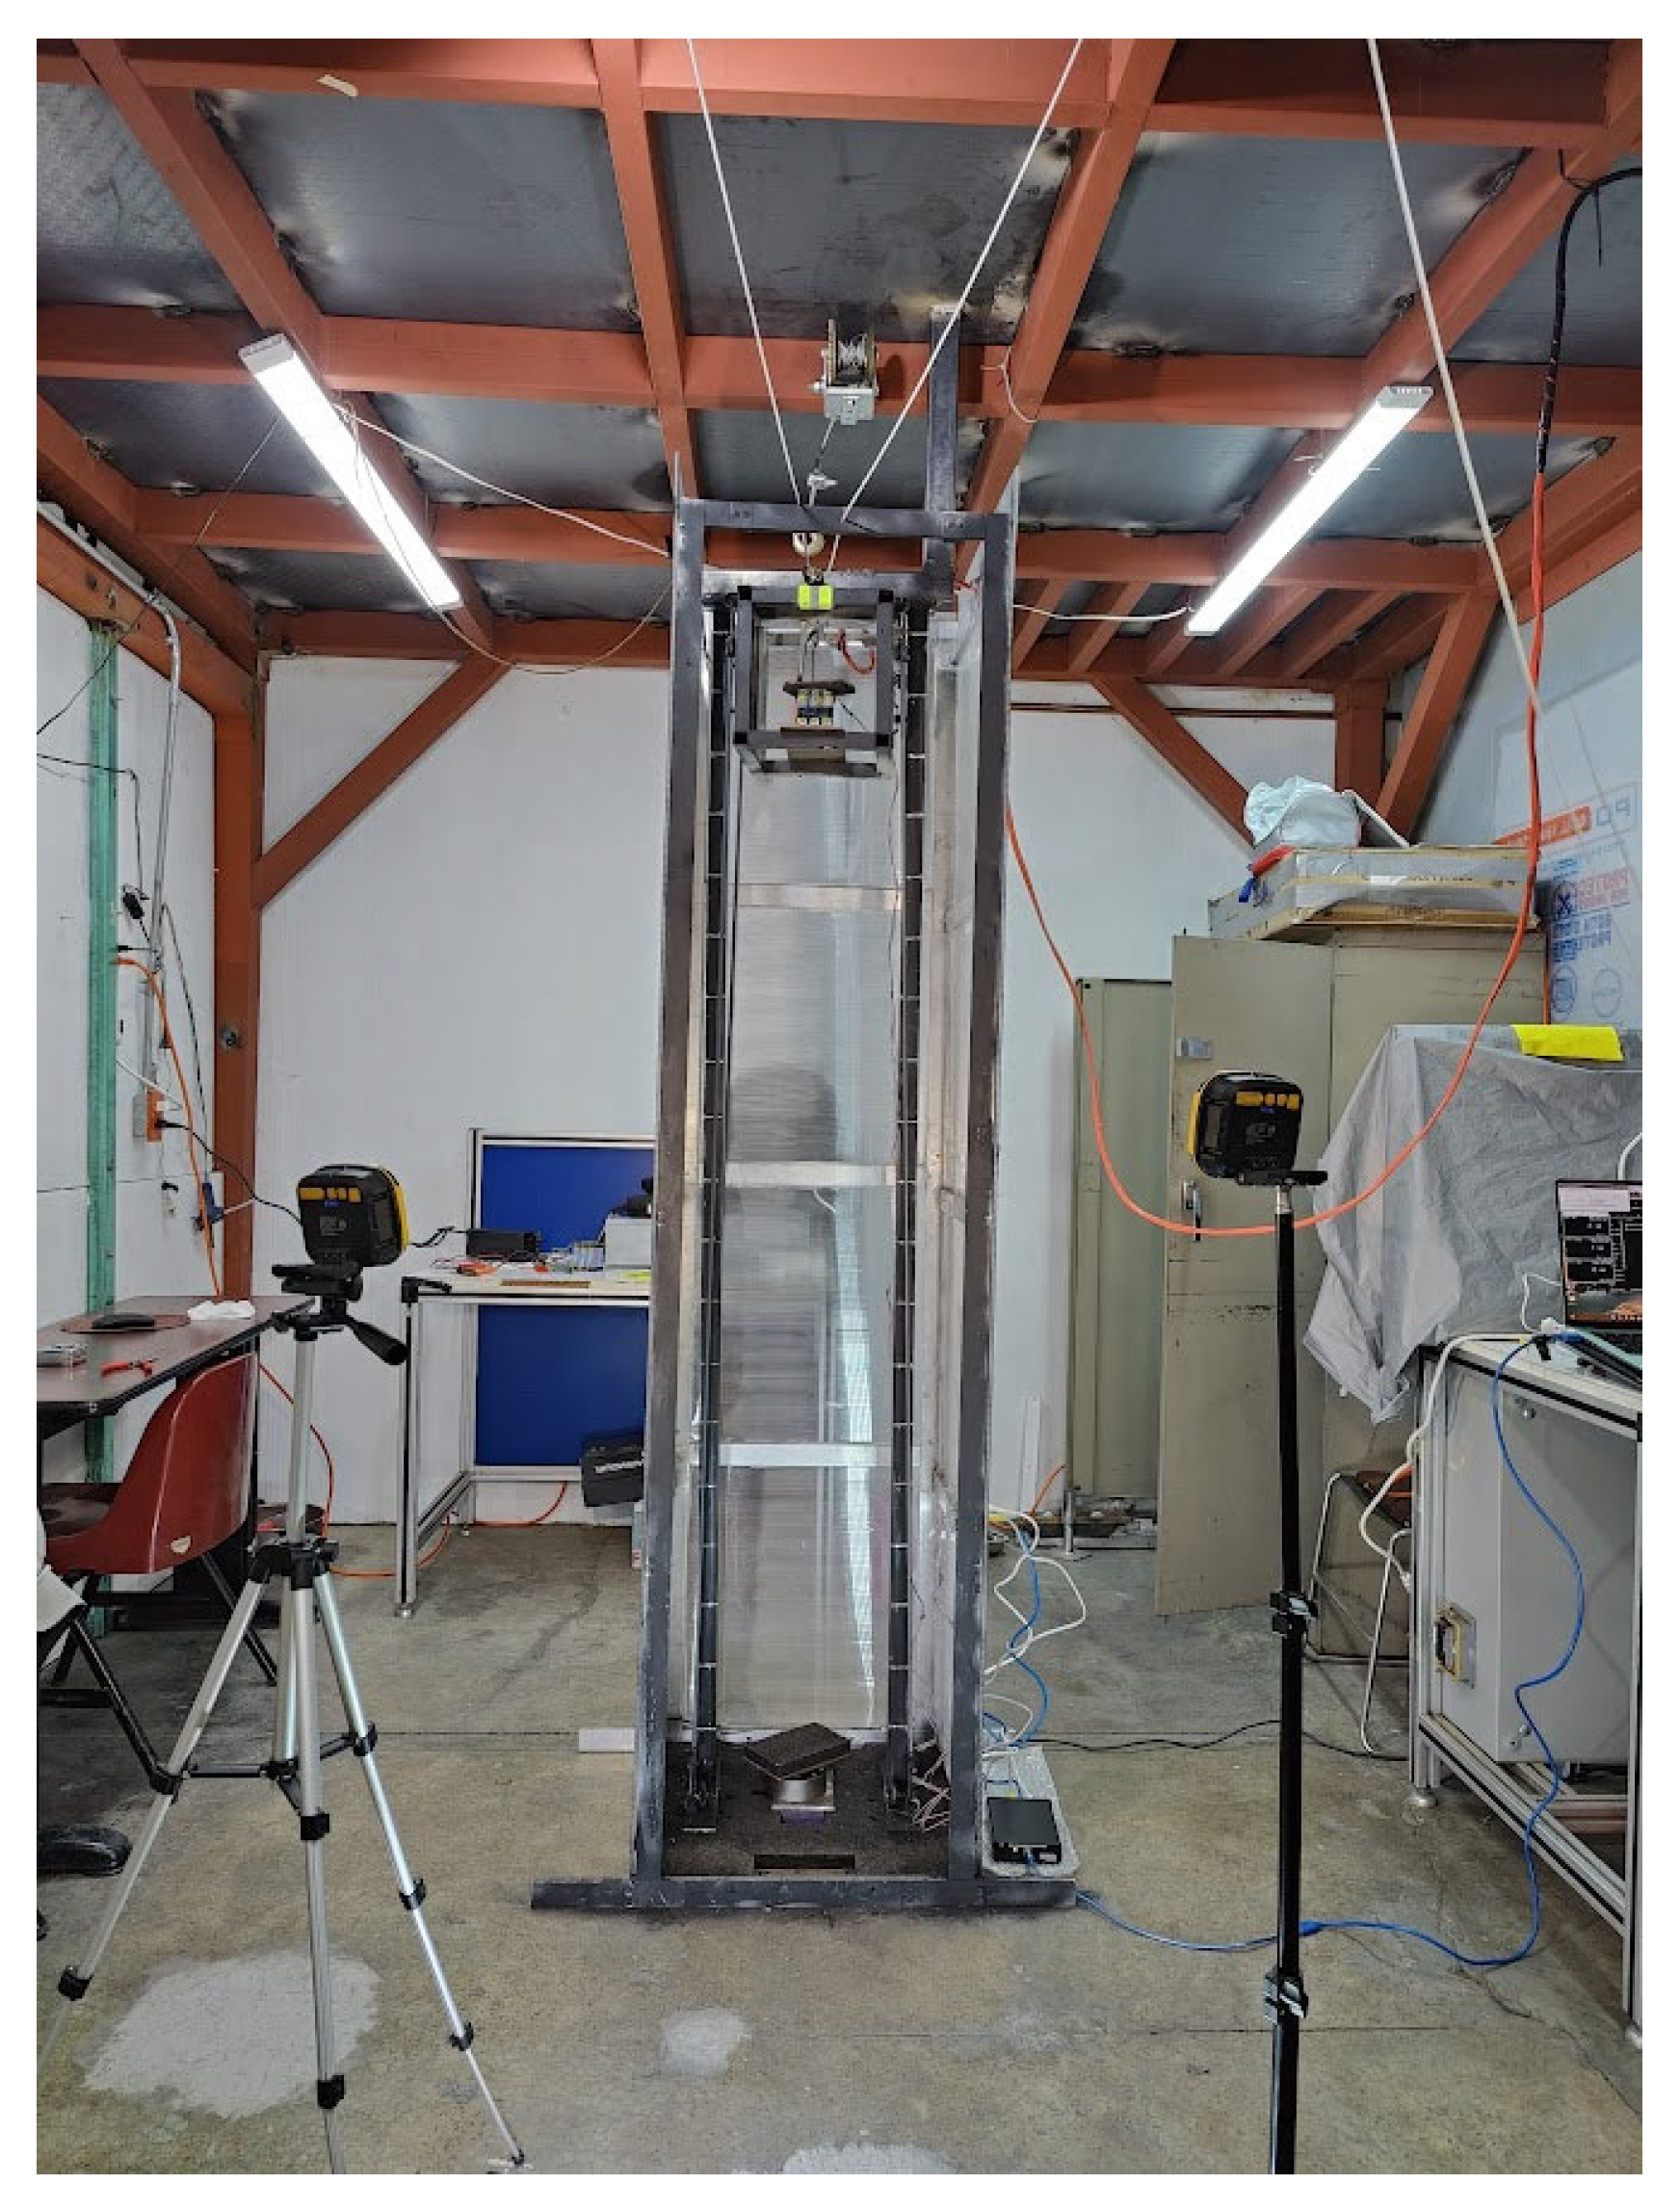
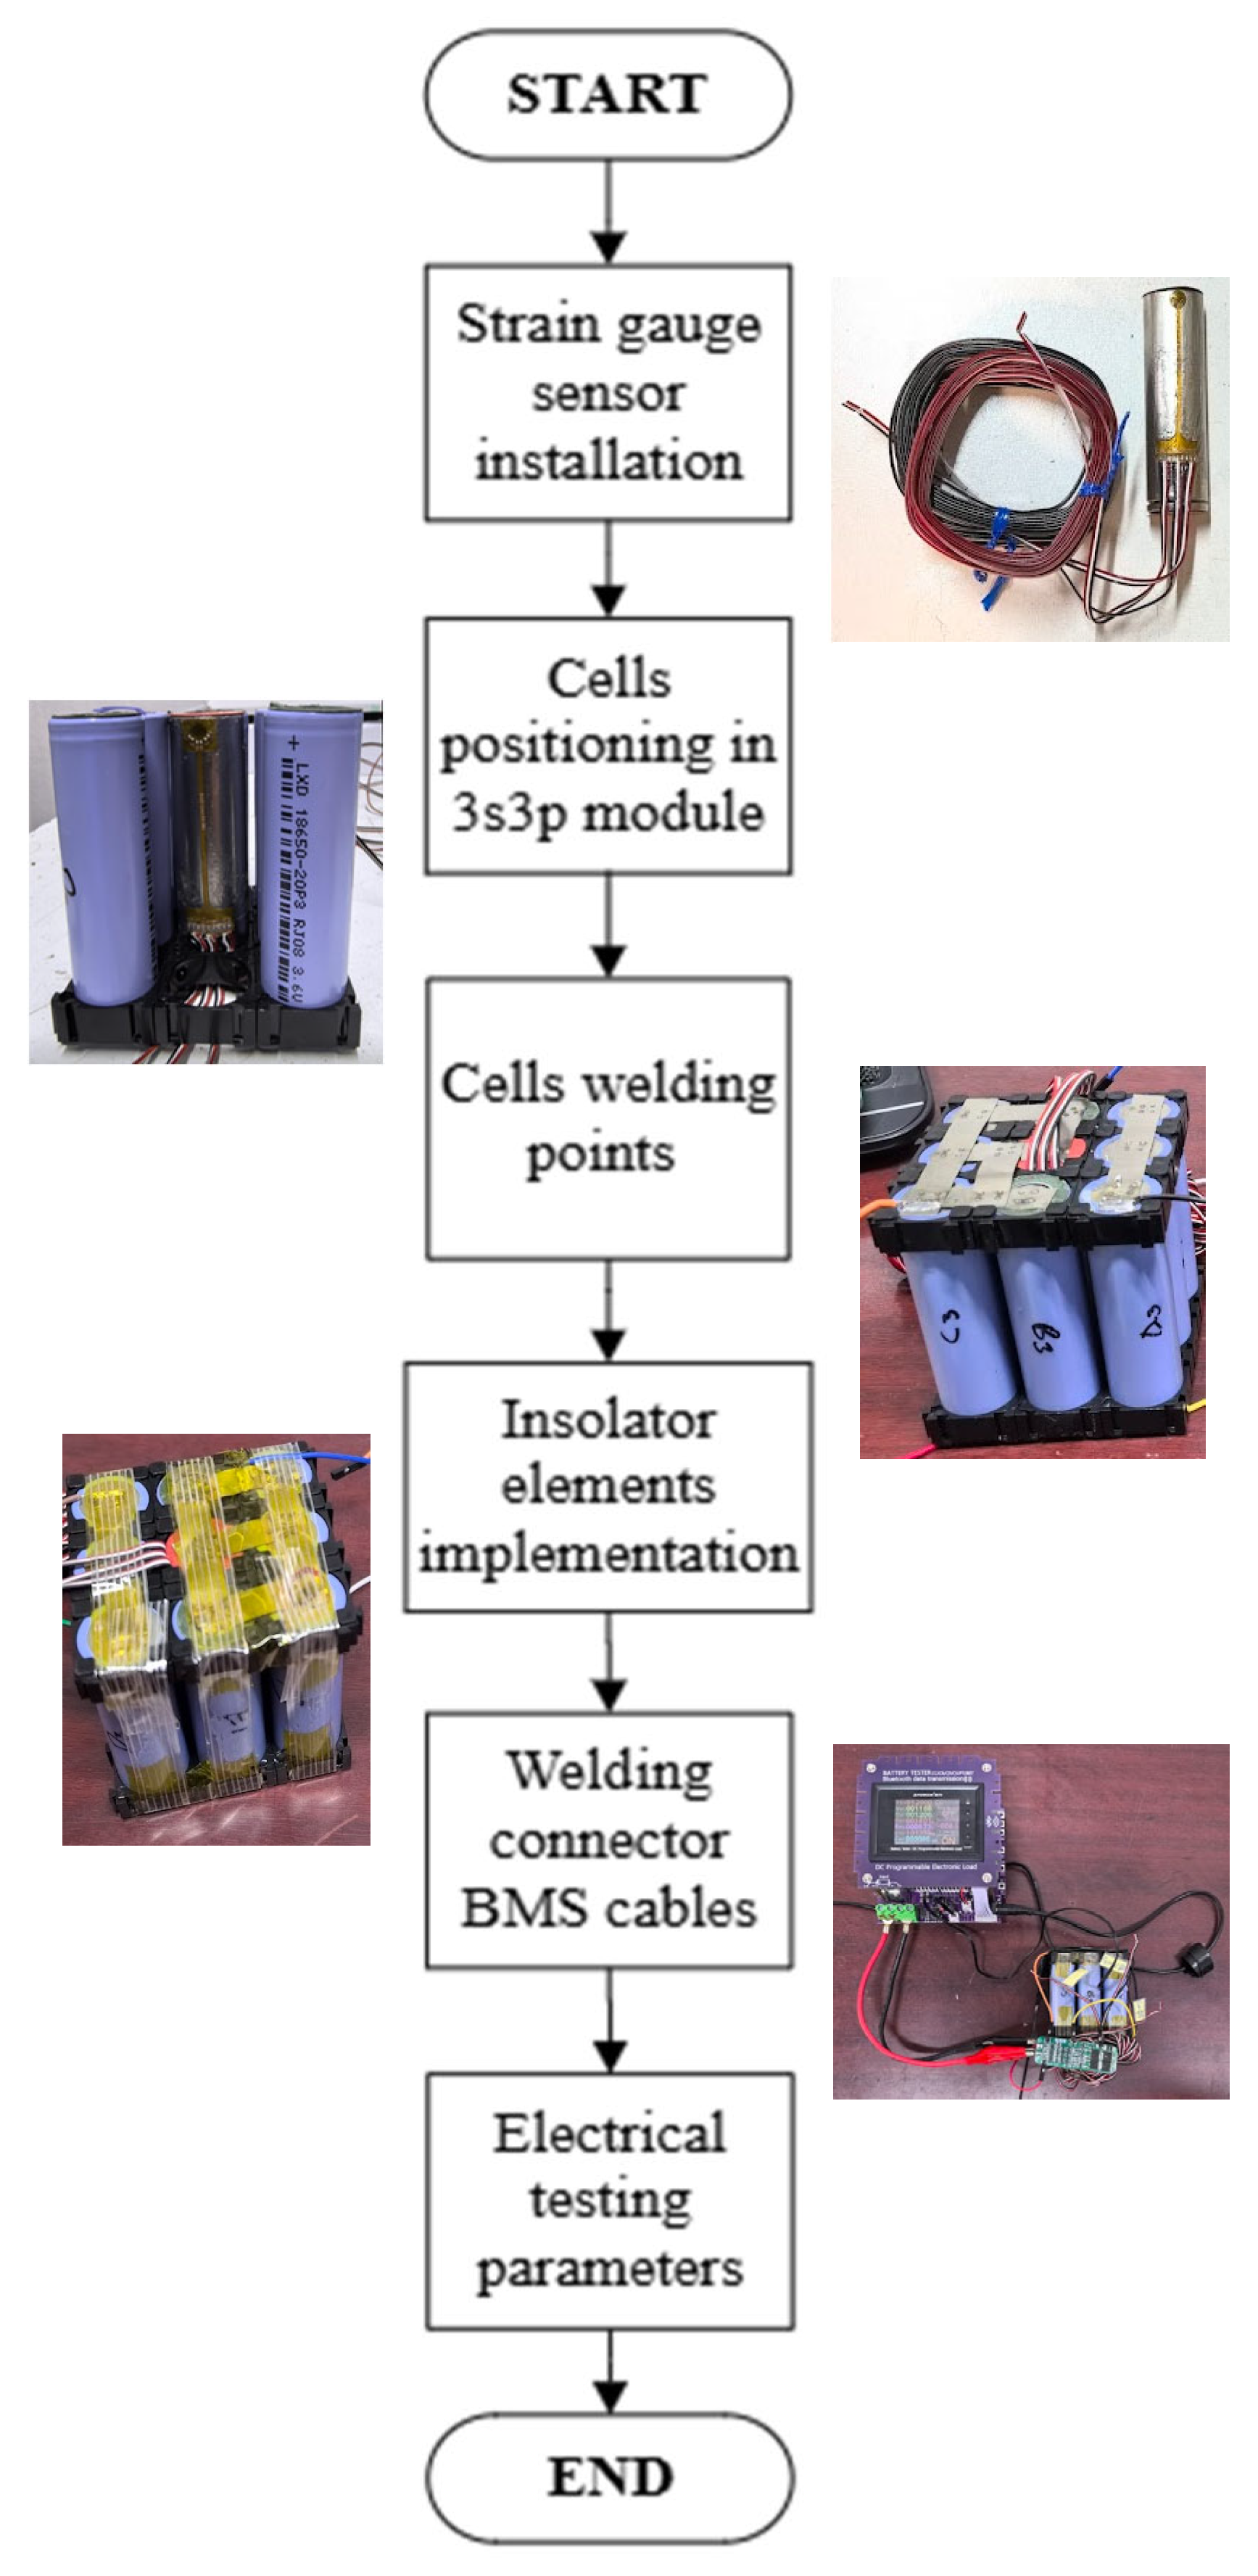
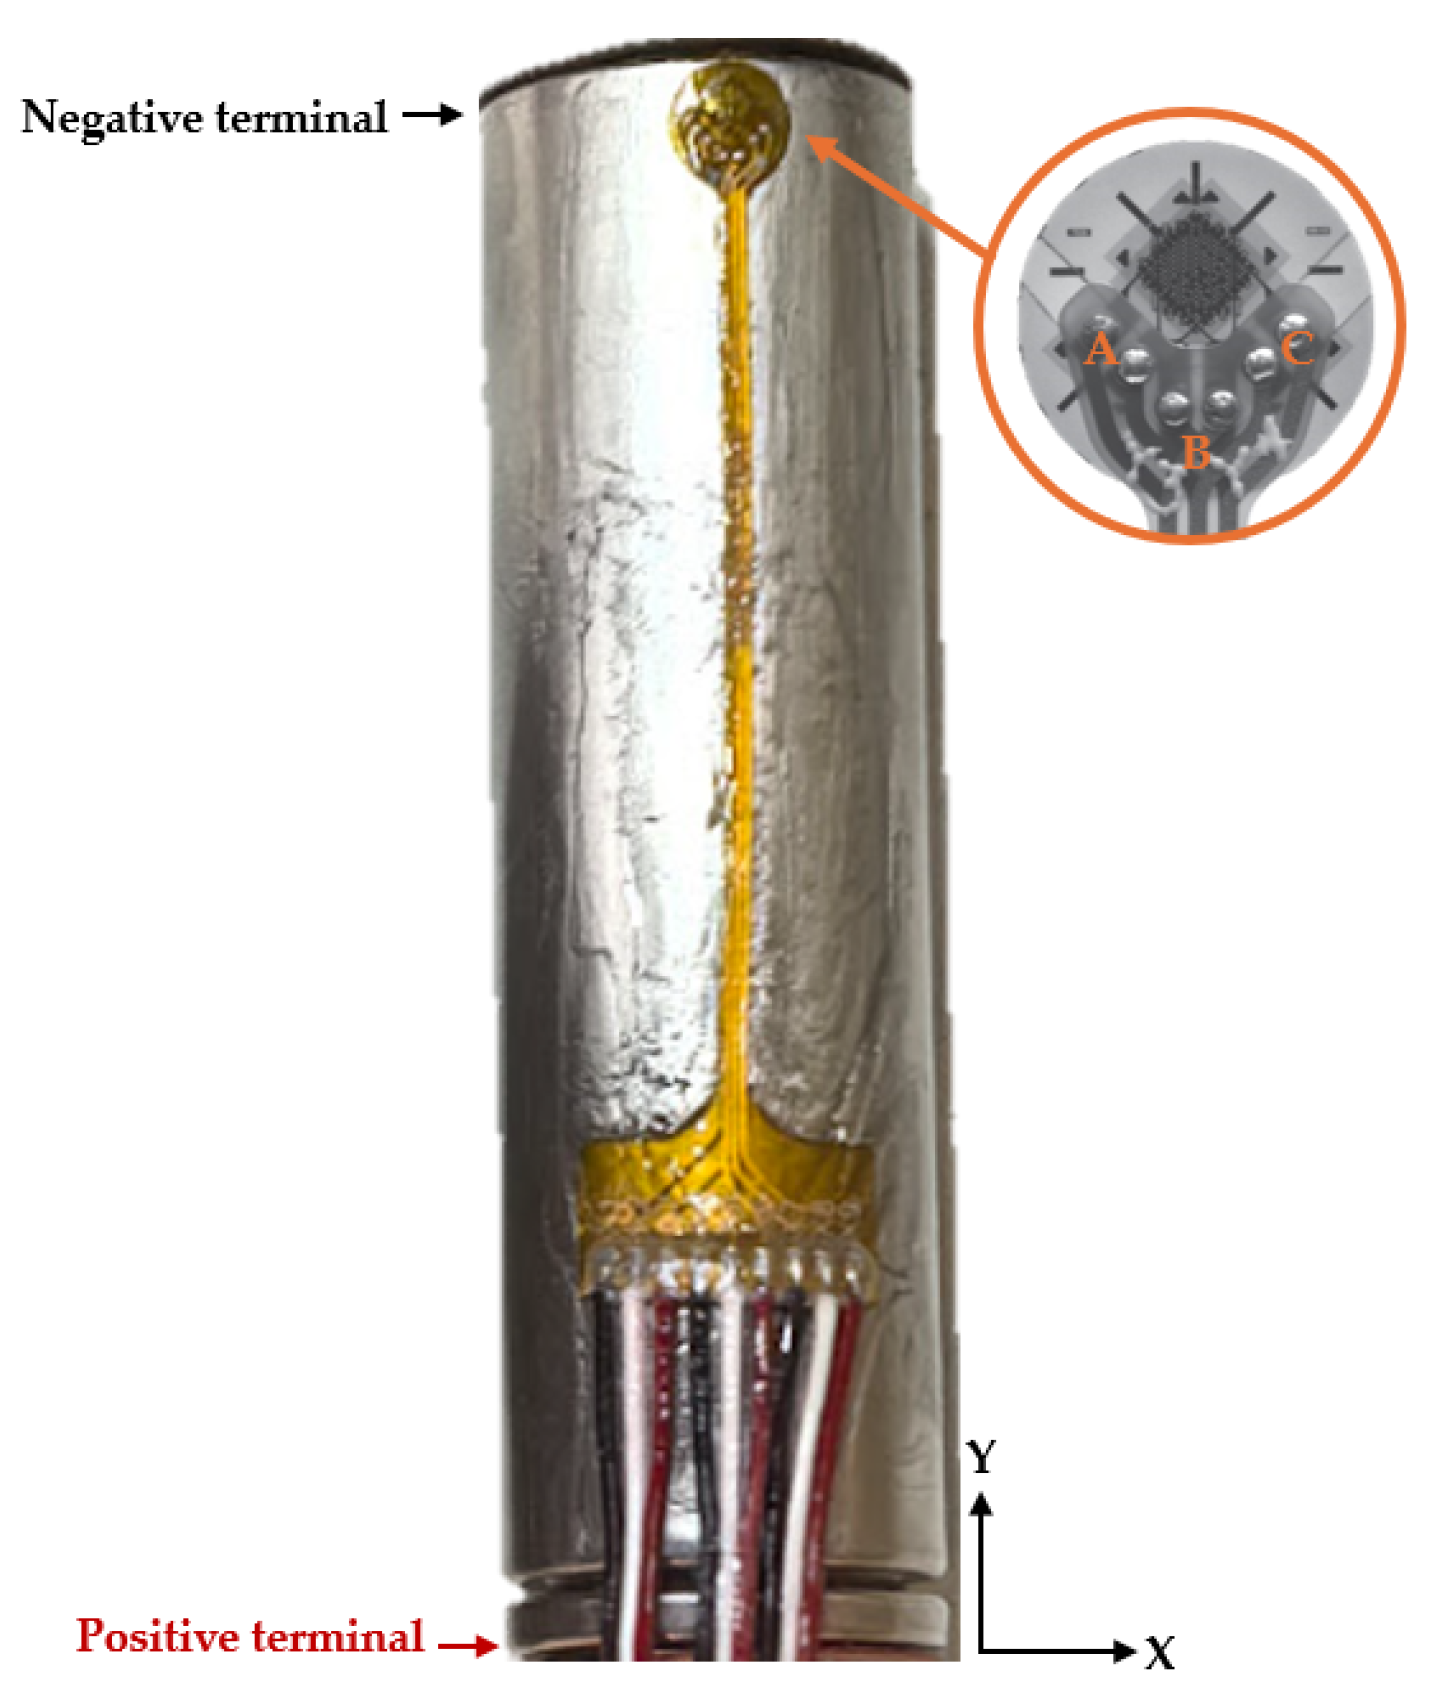
This research aims to evaluate the electrical and mechanical parameters of 18650 lithium-ion cells within aged battery modules sourced from electric micromobility Light Electric Vehicles (LEVs). Through charge–discharge cycling tests, the SOH and IR of the cells under evaluation are determined. Subsequently, using an impact platform, a mechanical shock scenario is recreated in accordance with the UL2271:2018 standard [41] to simulate impacts the vehicle may receive, which could affect battery performance. To quantify the mechanical damage resulting from this phenomenon, the use of strain gauges affixed to the housing of the module’s internal cells is proposed. Concurrently, the module’s electrical parameters are monitored with a lithium-ion battery testing system to detect transient spikes. Such events could precipitate an internal short circuit and/or a rise in cell temperature, potentially triggering a cascading failure in adjacent cells that could lead to a fire or an explosion in the electric vehicle’s battery module.
The article is organized as follows: Section 2 describes the experiment’s design, materials, instrumentation used in the tests, and the methodology for the mechanical shock test steps. Also, the selected LEV and its battery module are presented as objects of study. Likewise, the description of the steps for manufacturing the test modules and the impact platform contemplated for the mechanical shock tests is provided. Section 3 presents the results obtained from the performance tests conducted in the cells, as well as the stresses and deformations induced by mechanical shock in the central cells of the battery modules. Additionally, the impact velocity and total acceleration received by the battery modules are presented through videogrammetric analysis. Section 4 discusses the results shown in Section 3. Section 5 presents the conclusions of the research.

2. Materials and Methods

2.1. Study Object: e-Scooter

As mentioned above, sales of LEVs have increased significantly due to the micro-mobility trend over the last 5 years. The best-selling LEVs globally are e-bikes, e-scooters, and mopeds. For this reason, a pre-owned e-scooter (Citycoco Harley) that has been in use since 2019 was selected. Multiple Chinese automakers have manufactured this e-scooter model, so the assembly origins are unknown. The LEV is presented in Figure 1, and its specifications are in Table 1.

Battery Module

As mentioned in Table 1, the LEV’s energy storage system consists of two lithium-ion battery modules, each with a 60 V and 12 Ah capacity, manufactured by Hao Yang New Energy. The technical specifications of the module are presented in Table 2.
As exterior protection and anchorage within the LEV, the battery module is housed in a polymer case. Within this module, eighty 18650 lithium-ion cells are arranged in a 16-series–5-parallel (16S5P) configuration, with a battery management system (BMS) that provides protection against overcharge and overdischarge of the internal cells. For the electrical connections between the cells, the spot-welding method was employed, utilizing 0.2 mm plates of nickel-plated steel as the conductive medium. Also, the use of polymer bases for the vertical positioning of the cells gives support and rigidity to the module. On the other hand, it is worth highlighting the use of electrical and thermal insulators, such as insulating rings positioned at the positive pole of the cells, thermal and antistatic tape for the connections between the BMS and the cells, and the use of acrylic plates as internal protection of the module. Figure 1 illustrates the disassembly process of the battery module.
The cells used inside the battery module are LXD 18650-20P3, manufactured by Zinzong LoreStar Technology Co., Ltd., Sichuan, China. In Table 3, the technical specifications of the cell can be seen. In Figure 2, Figure 3 and Figure 4, a detailed log of charging, rate discharge, and cycling characteristics, respectively, is reported by the manufacturer on the datasheet.
In this cell, the used charging method is the constant current–constant voltage (CC/CV) method. The manufacturer reports that experiments and measurements were carried out under a standard temperature (23 ± 2 °C) and standard humidity (65 ± 20%). In Figure 2, a detailed log of charging characteristics is shown, where 1000 mA (0.5C) of CC is applied until the limit voltage of 4.2 ± 0.05 V is reached. Then, a CV phase begins, and the current starts to decrease until it reaches 20 mA (0.01C), at which point it cuts off.
In the performance test, the manufacturer tested the cell under various discharge rates (1000 mA to 6000 mA) and a cut-off voltage of 2.75 V. Charging at 1000 mA–4.2 V CC-CV is described below. Figure 3 shows the cell’s voltage versus discharge capacity.
To test the cell’s lifetime, the manufacturer performed cycling tests. Using the charging rate mentioned (1000 mA), and a discharging constant current rate of 6000 mA (3C) to a cut-off voltage of 2.75 V, waiting 10 min between charging and discharging, under the standard temperature and humidity conditions mentioned below. After three consecutive cycles, if the cell is ≤80% of its initial capacity, it is considered the end of its useful life. Figure 4 illustrates the percentage of lifetime versus the number of charge–discharge cycles.

2.2. Experiment Design

For this test, it is proposed to recreate a mechanical impact scenario for the battery module of an LEV. In this type of test, multiple regulations include this test within their mechanical abuse tests. The UL 2271:2018 standard focuses on the testing of LEVs, such as e-bikes and e-scooters, which fall within the classification of electric micromobility devices [8]. This standard describes initial conditions and parameters for the testing of LIBs using mechanical impact test scenarios.
  • The sample battery or device under test (DUT) shall be 100% SOC and secured on all sides to the testing machine.
  • The DUT will be subjected to mechanical shock in each of the six spatial directions, or, depending on the module’s positioning within the LEV, to a frontal shock.
  • For modules with a mass ≤ 12 kg, the test parameters are as follows:
  • Pulse shape—semi-sinusoidal.
  • Acceleration—50 g.
  • Pulse duration—11 ms.
  • During the test, the central module’s temperature should be monitored.
  • If the sample is still operational after the test, it must be subjected to at least one charge and discharge cycle at the maximum values recommended by the manufacturer.
  • A 1 h observation period should precede this test.
Considering the above, the design of the experiment for mechanical shock tests on battery modules used in an e-scooter was developed.
As an object of study, it is proposed to use the battery module of an e-scooter, which is one of the best-selling LEV platforms worldwide [8]. To ascertain the SOH of the internal cells, the battery module was disassembled to perform cycling test on each cell. Also, it was planned to divide the internal cells into compact modules of 9 cells to perform a greater number of tests with the least number of cells involved. A constant current and voltage charging method was used to charge the modules, as indicated by the manufacturer’s charging method. Moreover, the battery modules were positioned within an impact platform, taking into account their placement within the vehicle. This platform has a movable indenter at the center, with 1 DOF in the Z axis. This base has a rubber bed to achieve a semi-sinusoidal pulse, as well as elastic cords in tension that help increase the acceleration impact.
During the testing process, a slow-motion video was shot using a high-speed camera to perform a videogrammetric analysis of the linear kinematics of the mechanical shock process on the battery module. Additionally, the use of strain gauges enables the measurement of deformations within the internal cells. Additionally, the module’s temperature, voltage, and current are monitored by an electronic battery tester. Figure 5 shows an outline of the design of the experiment.
For this purpose, a flow diagram for the experimental test is drawn up in Figure 6. In this, 5 steps are taken into consideration, which are described below. Table 4 presents the instruments used during the impact test.
  • Battery module charge: DUTs are charged to 100% SOC with an adjustable power supply according to the manufacturer’s charging method.
  • Mechanical shock: The DUT is mounted inside the indenter, and its positioning is defined by the original module’s position within the LEV, which is perpendicular to the impact plate along the Z-axis (see Table 5). After impact, the electronic battery tester monitors the DUT’s electrical parameters. Additionally, the gauge strain and load cell’s DAQs, as well as the video recording, begin to record the data. After that, the platform’s safety bolt is released, and the DUT impact occurs.
  • Visual evaluation: A visual inspection of the DUT is carried out after the test to detect external short circuits, electrolyte leakage, or thermal runaway that may trigger a fire. If there is an ignition, a thermal blanket is used for isolation, and chemical powder is applied using an ABC fire extinguisher to reduce the temperature in the internal cells.
  • Discharge–charge cycle: If the DUT does not exhibit visible damage, a discharge–charge cycle will be conducted at the rate specified by the manufacturer, with visual inspections of the module maintained throughout. Additionally, external temperature monitoring will be performed using a thermal camera at a safe distance.
  • Observation period: A period of observation of the module is maintained for at least 1 h. After this, it will be kept in a safe deposit box.

2.3. Work Area

For the development of this research, a work area of 12 m2 was used inside an academic laboratory, as can see it in Figure 7. For security reasons, the work area was separated and well-ventilated to perform the cycling and impact test on LIBs. The temperature in the room and relative humidity were about 20 ± 5 °C and 50 ± 20%, respectively.

2.4. Device Under Test (DUT)

For the DUTs, compact battery modules were manufactured with the internal cells of the electric scooter module battery. This was carried out to perform multiple tests with a single battery module and to achieve the repeatability of the results.

2.4.1. DUT Concept Design

As the first step in manufacturing battery modules, the conceptual design of the modules was developed. For this test, it is proposed to assemble modules of 9 cells in a 3s3p configuration, as this number of cells allows for the replication of the pattern found in modules with a central cell surrounded by eight cells on its periphery. Subsequently, the technical specifications of the cells used are required to calculate the energy capacity, charging and discharging voltages, and maximum and nominal discharge currents, as described in Table 5.

2.4.2. Detailed DUT Design

For this step, a CAD design of the battery module was created, along with a list of the main components required for module manufacture, which is presented in Table 6.

2.4.3. DUT Manufacturing

Special materials and tools were used in the manufacturing of DUT. Figure 8 shows the methodology used for the DUTs assembly. The methodology steps are described below.
  • Strain gauge installation: For this, the installation of triaxial gauges on the cell housing was proposed to measure the deformations in the longitudinal and circumferential axes of the cell. The material used for these tests is the triaxial gauges or MicroMeasurements® rosettes C4A-06-G1350A-120-39P, which are described in Table 7, in conjunction with the D4 data acquisition system. The strain gauge used is a stacked rosette type. Figure 9 shows the 0° (A-gauge), 45° (B-gauge), and 90° (C-gauge) configuration of the strain gauge. The gauge was installed using the manufacturer’s recommended bonding material and method, ensuring the correct orientation of the gauge with respect to its positive and negative terminals. 3s3p cell positioning: A 3s3p configuration is proposed for cell positioning. In this configuration, the cell with gauge rosette installed is in the central position and surrounded by eight cells, in the same pattern found in the LEV’s battery modules.
  • Cell welding points: For cylindrical LIBs, the spot-welding method is used to make electrical connections between the cells. This method is ideal because it does not generate excessive heat on the poles, which can cause premature wear in the cell. To achieve this, a 4 kW SUNKCO 737G spot-welding machine and a nickel-plated steel plate as the connector (10 mm × 0.2 mm) were used.
  • Isolator elements: The use of thermal and electrical insulation is essential, such as the use of self-adhesive joints as insulating protection in the positive terminal of the cell, BGA tape for the thermal insulation of the connections, and the use of fiberglass tape to support the cells in case of a rupture of the support bases.
  • BMS connection: A 3s-BMS was implemented to ensure safe management during the DUT’s charge–discharge cycle.
  • Electrical testing parameters: To validate the correct function of the DUTs, a charge–discharge cycle is performed on each DUT. For the charging process, a constant current (CC)–constant voltage (CV) method was used at 12.6 V–1.5 A to charge to 100% SOC. For the discharging process, a 1.5 A CC rate was applied.

2.5. Impact Platform

The impact platform envisioned for the impact tests was manufactured in-house, as shown in Figure 10. The objective of this was to perform mechanical impact at both the cell level and the module level, which is limited to an impact area of 0.09 m2 (0.3 m long × 0.3 m wide).
This platform has a simple inverted catapult design, where the indenter is mounted on two rails in a vertical position and accelerated by four elastic cords. Table 8 describes the main components of this platform.
In the impact base, a Day Sensor load cell was installed to measure the impact force resulting from mechanical shock. Technical specifications and calibration details are provided in Table 9.
To achieve the desired speed in the indenter, the base was anchored to the lower part of the structure by elastic rubber ropes, which allow its potential energy to be transmitted in tension to the base, which transforms it into linear movement. Those elastic cords have an elastic stiffness constant K = 313.92 N/m, which was calculated experimentally by applying a known mass of 2 kg and multiplying by the gravitational constant (a = 9.81 m/s2), the force supported by the spring (F) is calculated; and by subtracting the initial length from the final length, the total elongation of the spring (x) is calculated; so, by means of Hooke’s law, this constant can be calculated if the ropes are considered as ideal springs.
K = F/∆x
By taking the average values of the 4 strings, the elastic stiffness constant was calculated. The results are shown in Table 10.
Likewise, the force and energy stored in tension were calculated. Equation (1) is used for the calculation of force, and the equation of mechanical work is used with Equation (2).
U = ½ × K × (∆x)2
The mass of the indenter (m), being at a certain height (h), also transfers force and energy upon impact with an object, so Newton’s second law and potential energy can be used to calculate these values. Table 11 presents the total force and energy resulting from the indenter.
F = m × a
Ep = m × a × h

3. Results

3.1. SOH of Internal Cells

To obtain the SOH of the module’s internal cells, a charge–discharge cycle test was performed using a smart-charged XTAR®, VA, USA VC8 Gen2, as shown in Figure 11. At the first step, the initial voltage and internal resistance of the cells were measured to compare with the manufacturer’s data. Subsequently, the cells were tested using the method specified by the manufacturer, as described in Table 12.
Three cycles were performed on each cell to measure their actual capacity and calculate the average capacity. After that, the SOH of the cells was calculated using Equation (5).
SOH = (Qmax/Cn) × 100
where
  • Qmax = real cell capacity (mAh)
  • Cn = Nominal Cell Capacity (mAh)
In this case, the rated capacity of each cell, as reported by the manufacturer for its as-new condition, is 2000 mAh.
Figure 12 shows the plots of the electrical parameters measured and calculated for each series of internal cells. In Table A1, it can be seen that these parameters are listed by individual cell. In the following graphs, the parallel cells connected are represented from lighter to dark green (1p to 5p in each series)

3.2. Mechanical Shock Tests

For the mechanical shock test, an initial condition was proposed, as shown in Table 13.

Kinematic Results

The measurement of the kinematic parameters of the indenter using videogrammetry was proposed to corroborate the platform’s operation in compliance with the design parameters set by regulations and to validate the correct operation of the impact platform throughout the experimental tests. For this purpose, recordings of the platform in operation were made, and later, they were analyzed using Kinovea®, a free-to-use video study software designed for movement analysis, with a primary focus on sports science and biomechanical analysis [42]. However, due to the interface’s design, it can perform movement analysis of any object, so its use in this application is convenient.
For this type of study, the quality, lighting, and fluidity of the recording are essential since the computer program with which it is analyzed collects the data in frames per second (FPS) and reference points placed on the object to be analyzed; so, by correctly controlling these three aspects, the reliability of the results obtained improve significantly. Considering the above, recording equipment and lighting suitable for recording the tests were installed to perform the experimental tests.
The results obtained from the linear kinematic analysis using Kinovea® 2023.1.2 version, are presented in Table 14 and Table 15, which show the impact of velocity and pulse acceleration on each test, respectively. Figure 13 and Figure 14 also present a comparative graph of velocity and pulse acceleration versus time.
To register the maximum force achieved in the tests, a load cell was installed on the platform base as mentioned in Table 9 of Section 2.5 Table 16 shows the impact force resulting from each test.

3.3. Thermal and Electrical Results

The electrical parameters and internal temperature of each module are measured during tests. As mentioned, an electronic battery tester is used to measure voltage and current, while a thermocouple positioned on the central cell measures the internal temperature. Additionally, the external temperature was monitored using a thermal camera. The DUT’s voltage, current, and power versus time graphs are presented in Figure 15, Figure 16 and Figure 17, respectively. The temperature after the mechanical shock test is presented in Table 17.

3.4. Stresses and Deformations on Internal Cells

For the mechanical analysis, the longitudinal and hoop strains, as well as the principal stress, were measured on the cell case at the moment of impact. To carry out a quantifiable analysis on the effects of mechanical shock on the battery module, the use of strain gauges was proposed to measure the deformations caused by this physical phenomenon. Together with a specialized data acquisition system, the change in electrical resistance in these devices was measured, transforming it into resulting microdeformations in the analyzed material. This test method enables various experiments to be conducted with 18650 cells, regardless of their internal chemistry, in a non-invasive manner during battery operation.
For this purpose, a strain gauge rosette was installed in the central cell of each test module, as mentioned in Figure 9 of Section 2.4.3.
Due to this, three strain orientations are measured at an impact moment, and Figure 18, Figure 19, and Figure 20 present the strain measured on gauges A, B, and C, which are oriented at 0°, 45°, and 90°, respectively. Table 18 shows the strains measured in each test.
Due to strain, rosettes are used to determine the state of plane stress at a point on a material’s surface, where hoop and longitudinal strains are measured along the X and Y axes, respectively. The strain components were then calculated using the following equations:
εa = εx × cos2θa + εy × sin2θa + γxy × sinθa × cosθa
εb = εx × cos2θb + εy × sin2θb + γxy × sinθb × cosθb
εc = εx × cos2θc + εy × sin2θc + γxy × sinθc × cosθc
Table 19 presents the strain components calculated as a 3 × 3 equation system.
After this, the stress components can be calculated using Hooke’s law for plane stress, as outlined in the following equations. Table 20 presents the calculated stress components.
σx = (E/1-ν2) × (εx + νεy)
σy = (E/1-ν2) × (εy + νεx)
τxy = (E/2(1 + ν)) × (γxy)
After obtaining the stress components, the principal stress and the maximum shear stress were calculated. Table 21 presents the principal stress calculated.
σ1,2 = ((σx + σy)/2) ± (((σx − σy)/2)2 + τxy2)1/2
tan 2θp = γxy/(εx − εy)
τmax = (((σx − σy)/2)2 + τxy2)1/2
To verify if the case material does not fail in the mechanical impact scenario, a Von Mises (VM) failure criterion was calculated with Equation (15). The criterion results are shown in Table 22 for each test.
σVM = ((σx)2 − (σx ∙ σy) + (σy)2 + (3τxy2))1/2

4. Discussion

Regarding the study object, as has been mentioned, the e-scooter is pre-owned, so the conditions of use of the battery module prior to purchase are unknown. Factors such as the drop, prolonged charging, or discharging of the battery module affect its lifetime.
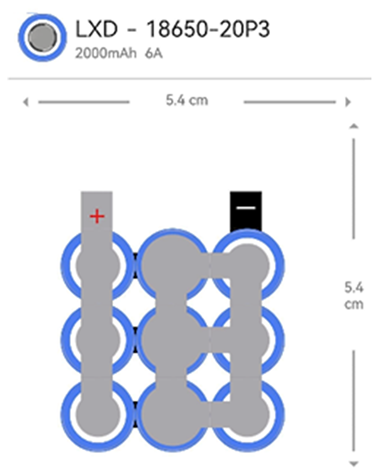
The battery module consists of 80 cells, each with a capacity of 2 Ah, arranged in 16 cells per string and 5 strings per cell bank. With five cells in parallel, a coulomb capacity of 10 Ah is obtained, and the manufacturer reports a coulomb capacity of 12 Ah. So, the actual Coulomb capacity is 2 Ah lower than what the manufacturer reports on its datasheet.
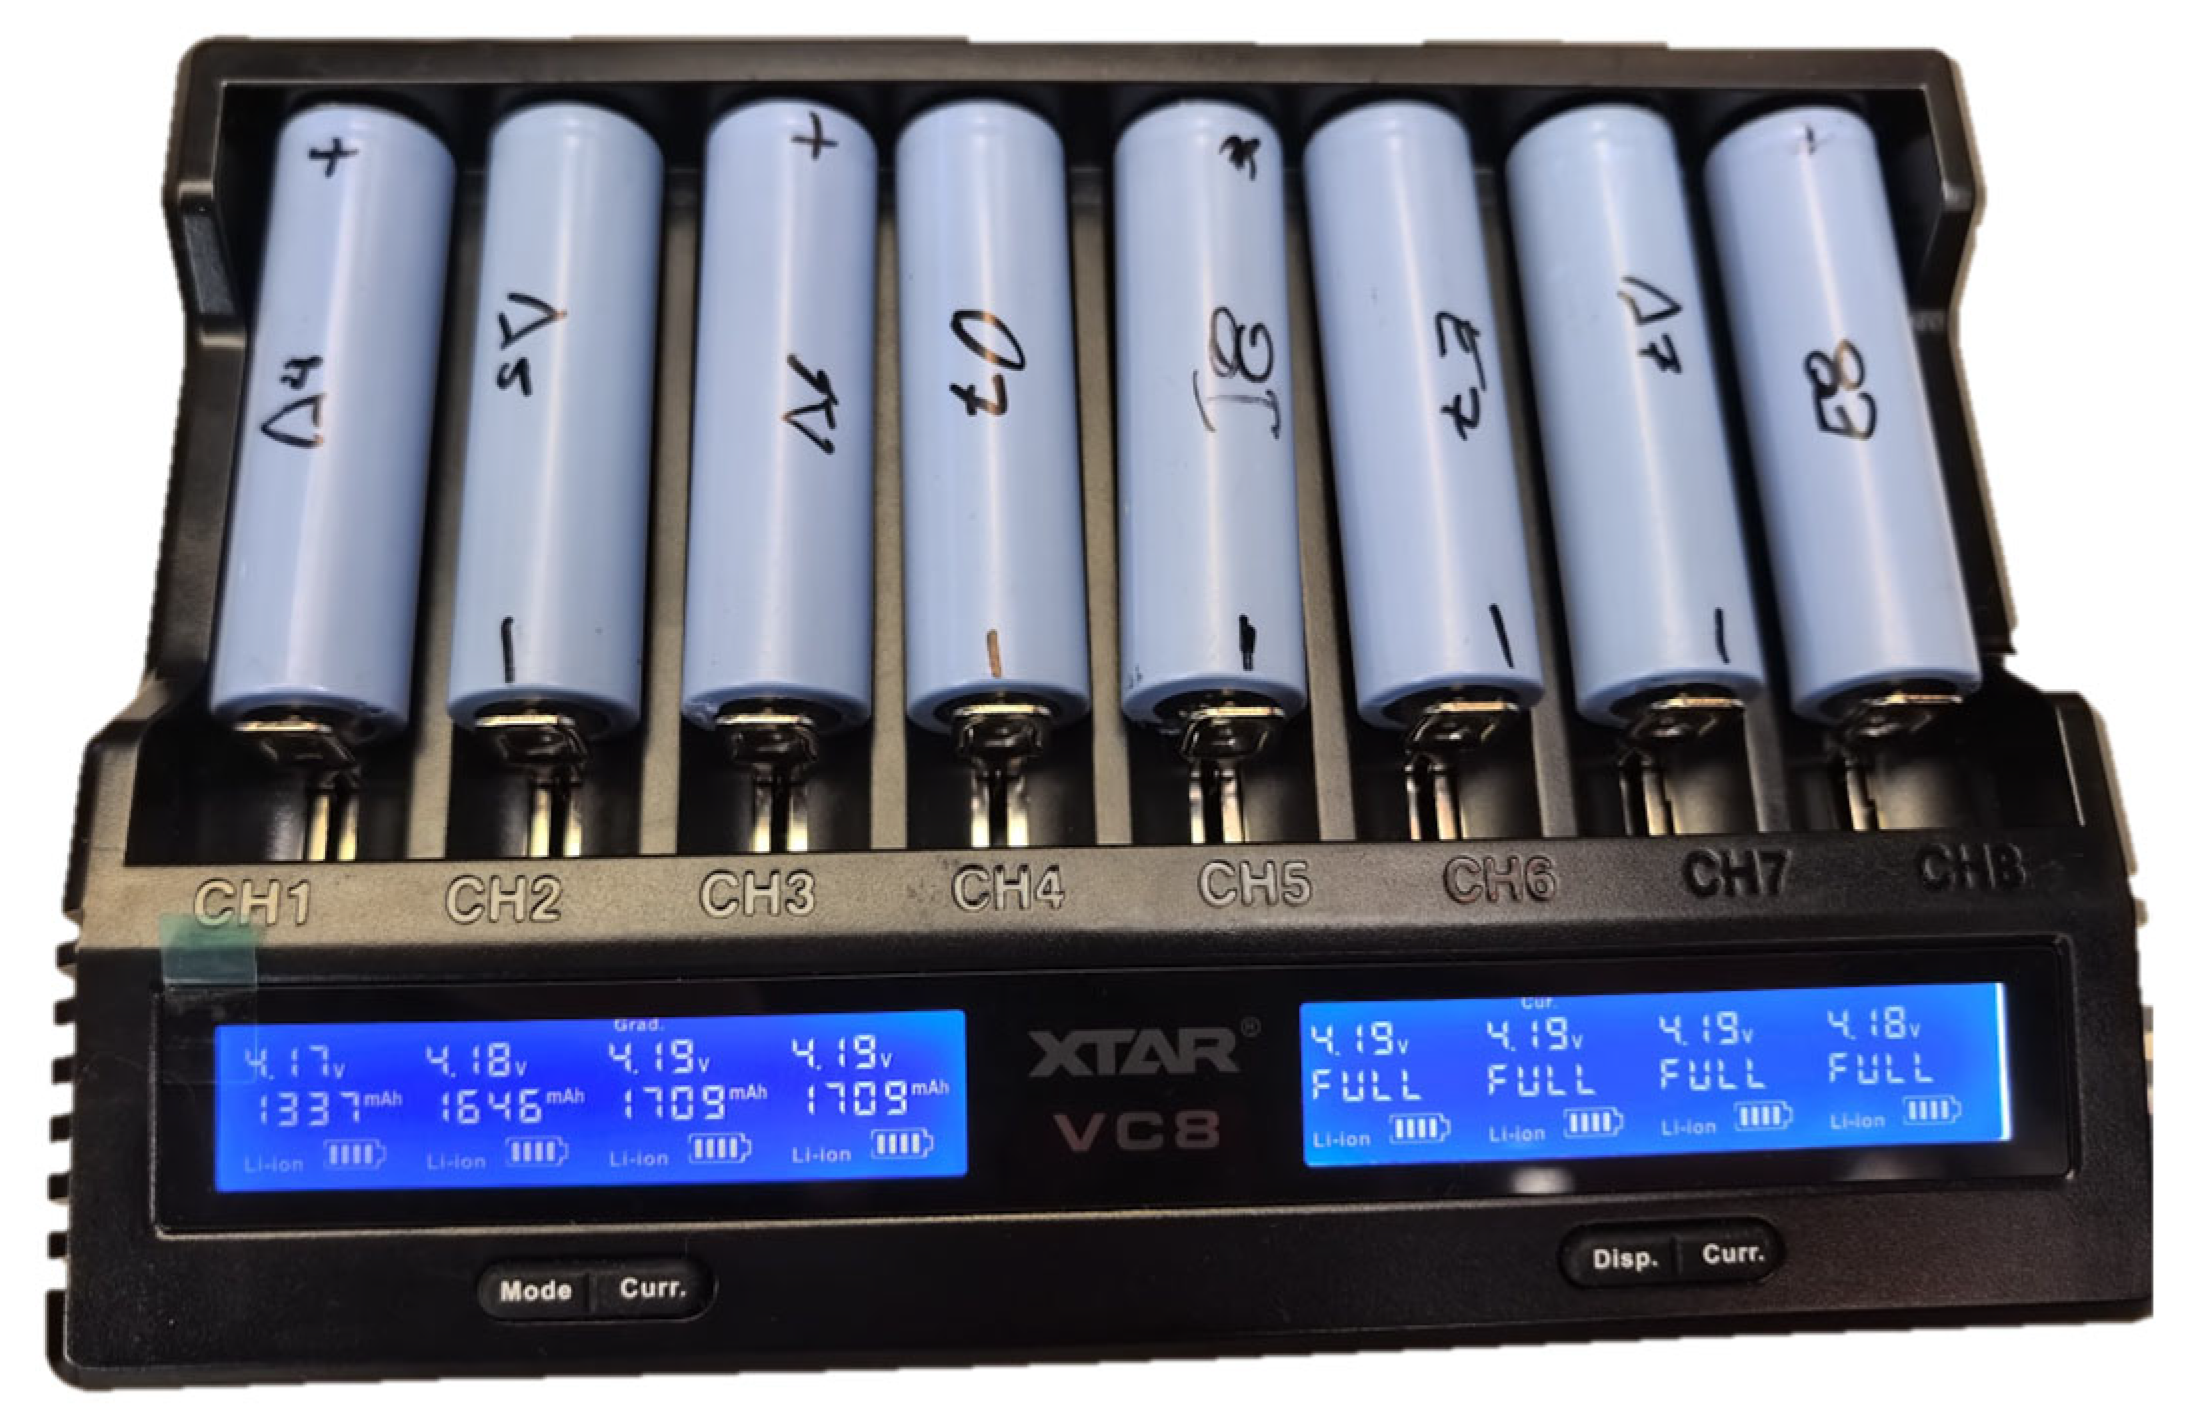
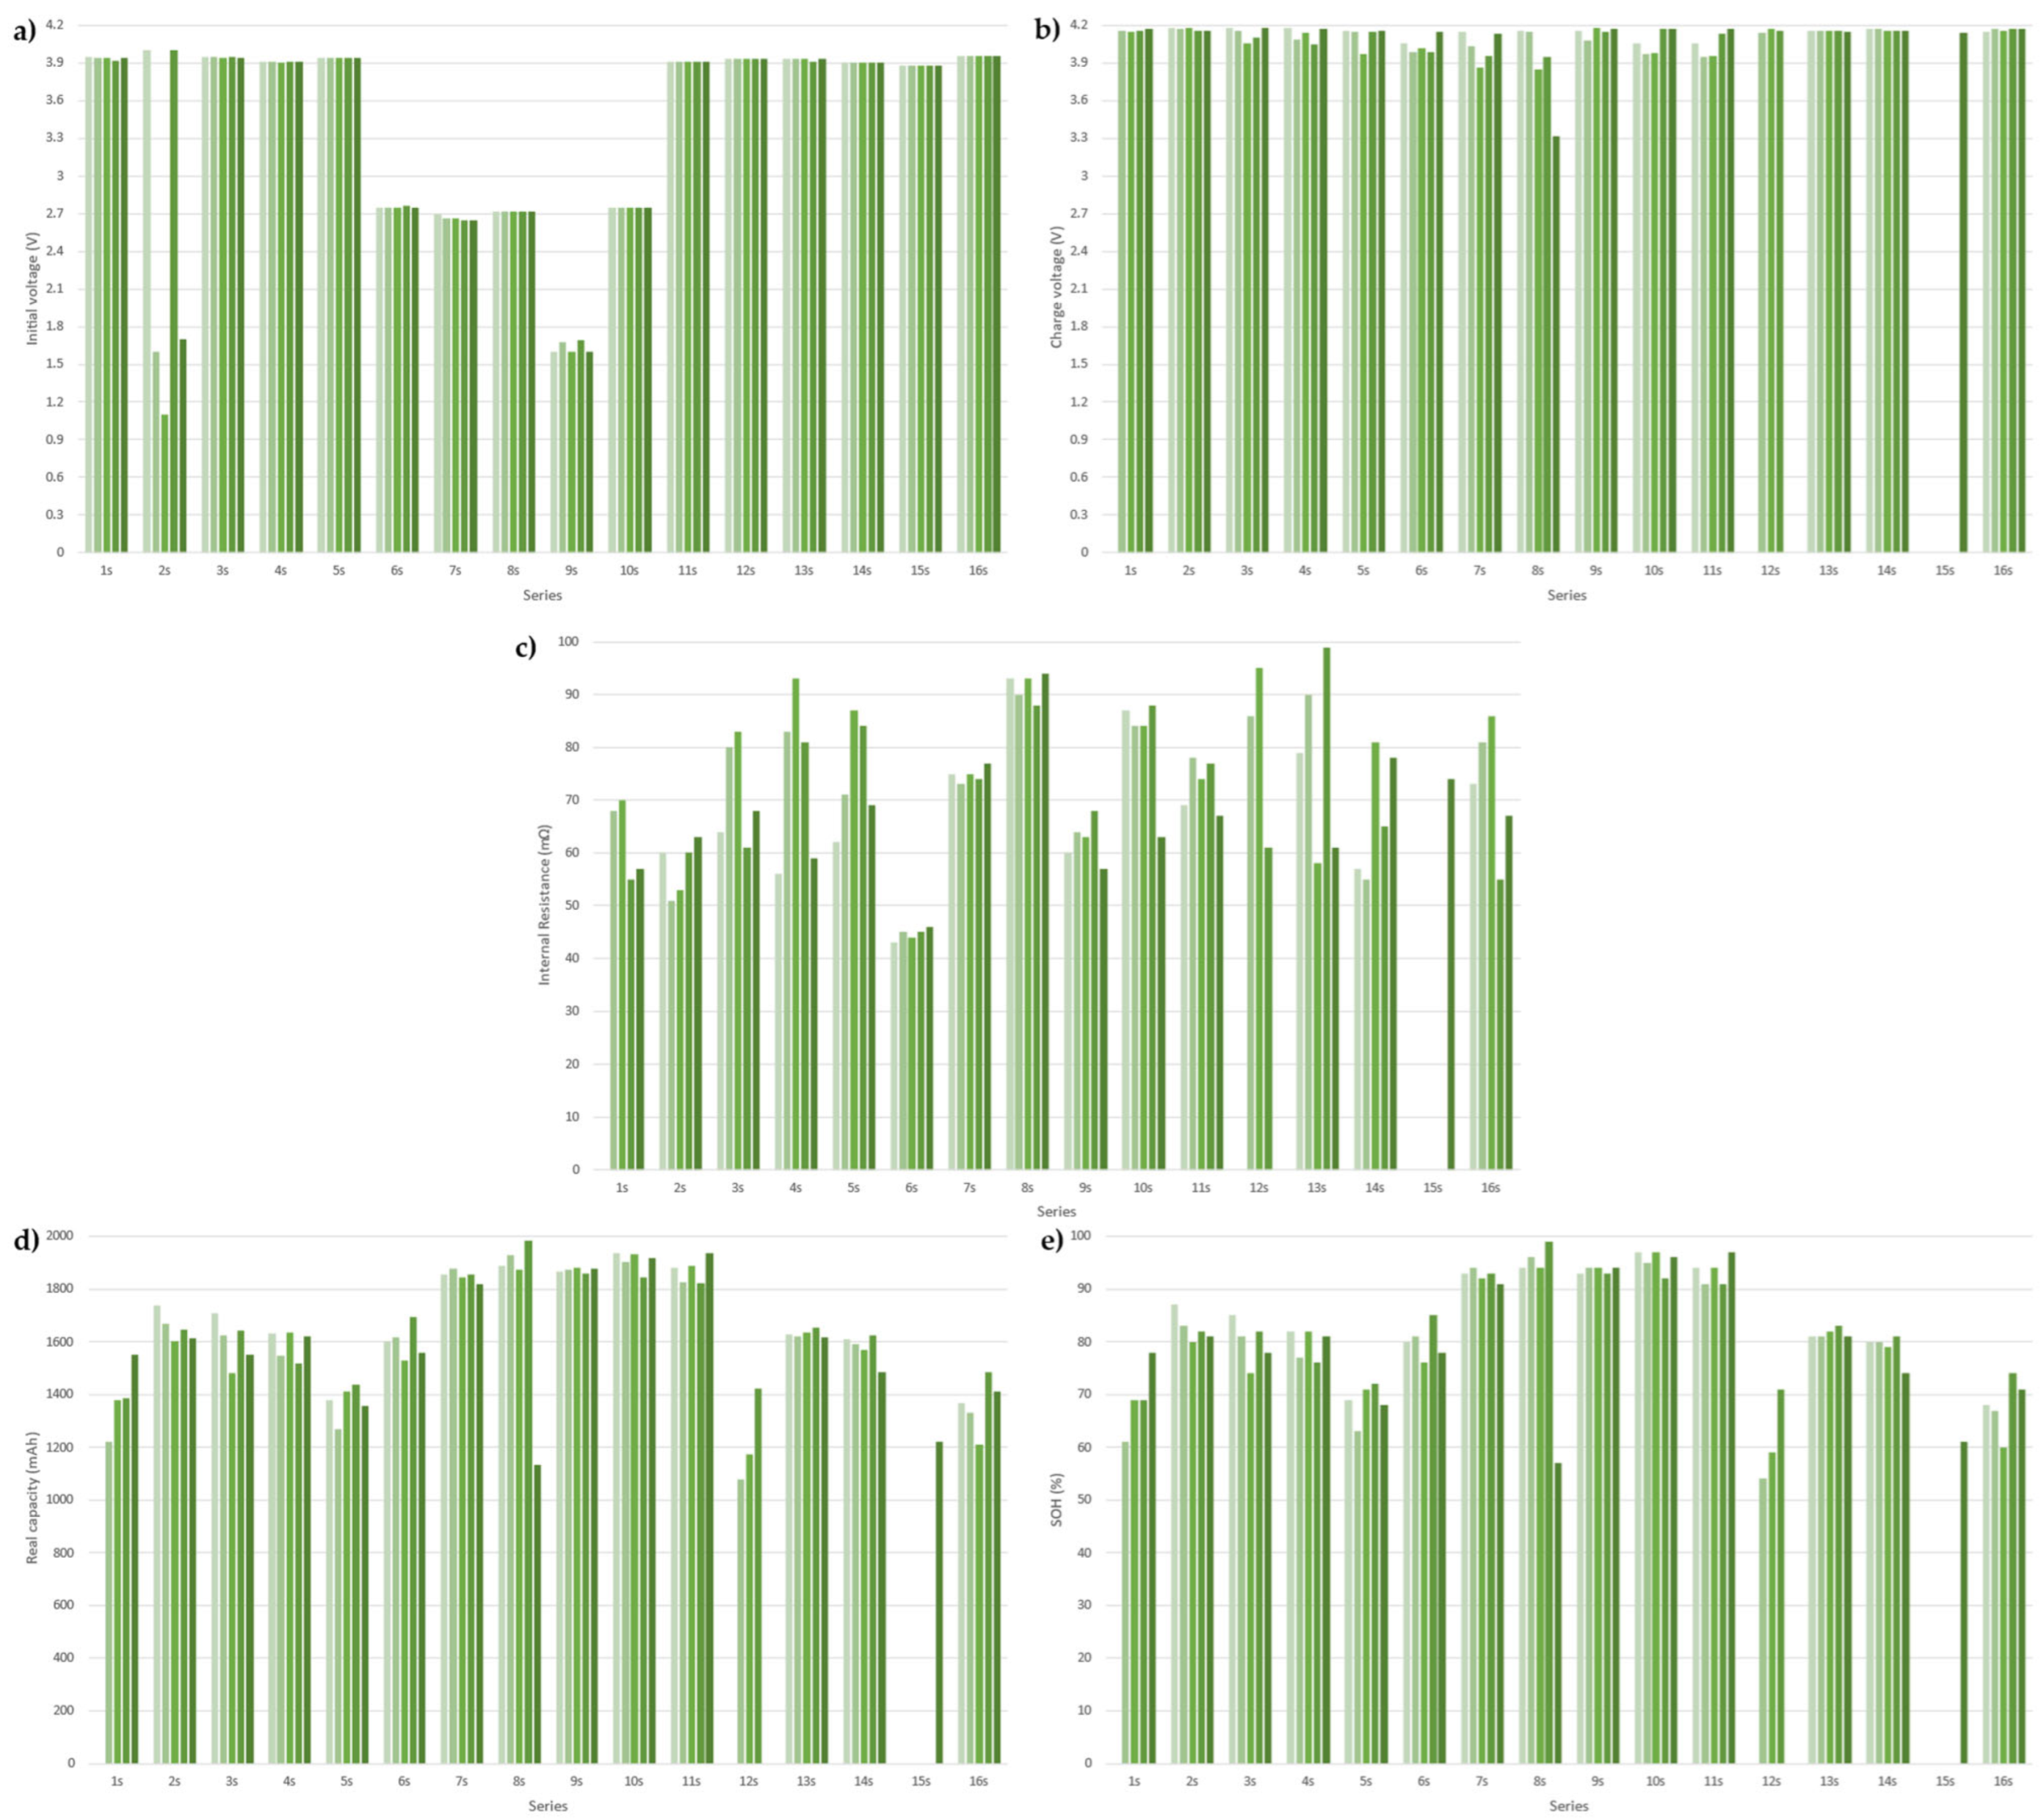
The aging of the battery module was notorious. It was not possible to make a capacity test to verify its real capacity and SOH because it does not have a measurement instrument; its charge voltage measured was 64.1 V, which is lower than the charge voltage of a brand-new battery module according to the manufacturer’s parameters (67.2 V). Although, in the voltage series, it was noted that in serial 2, in three cells, and in serials 6 to 10, all cells were below their discharge voltage. When analyzing the internal cells, it was found that 18 cells (22%) were below the discharge voltage reported by the manufacturer (2.75 V); the rest of the cells were within normal voltage values. This could occur due to a BMS malfunction, resulting in a balance issue in the cell’s series, or if the battery charger used was not manufactured according to the manufacturer’s specifications, which would affect the BMS functions. A future investigation testing the control and electronic systems in aged LEVs could help to understand how they contribute to the premature aging of internal cells.
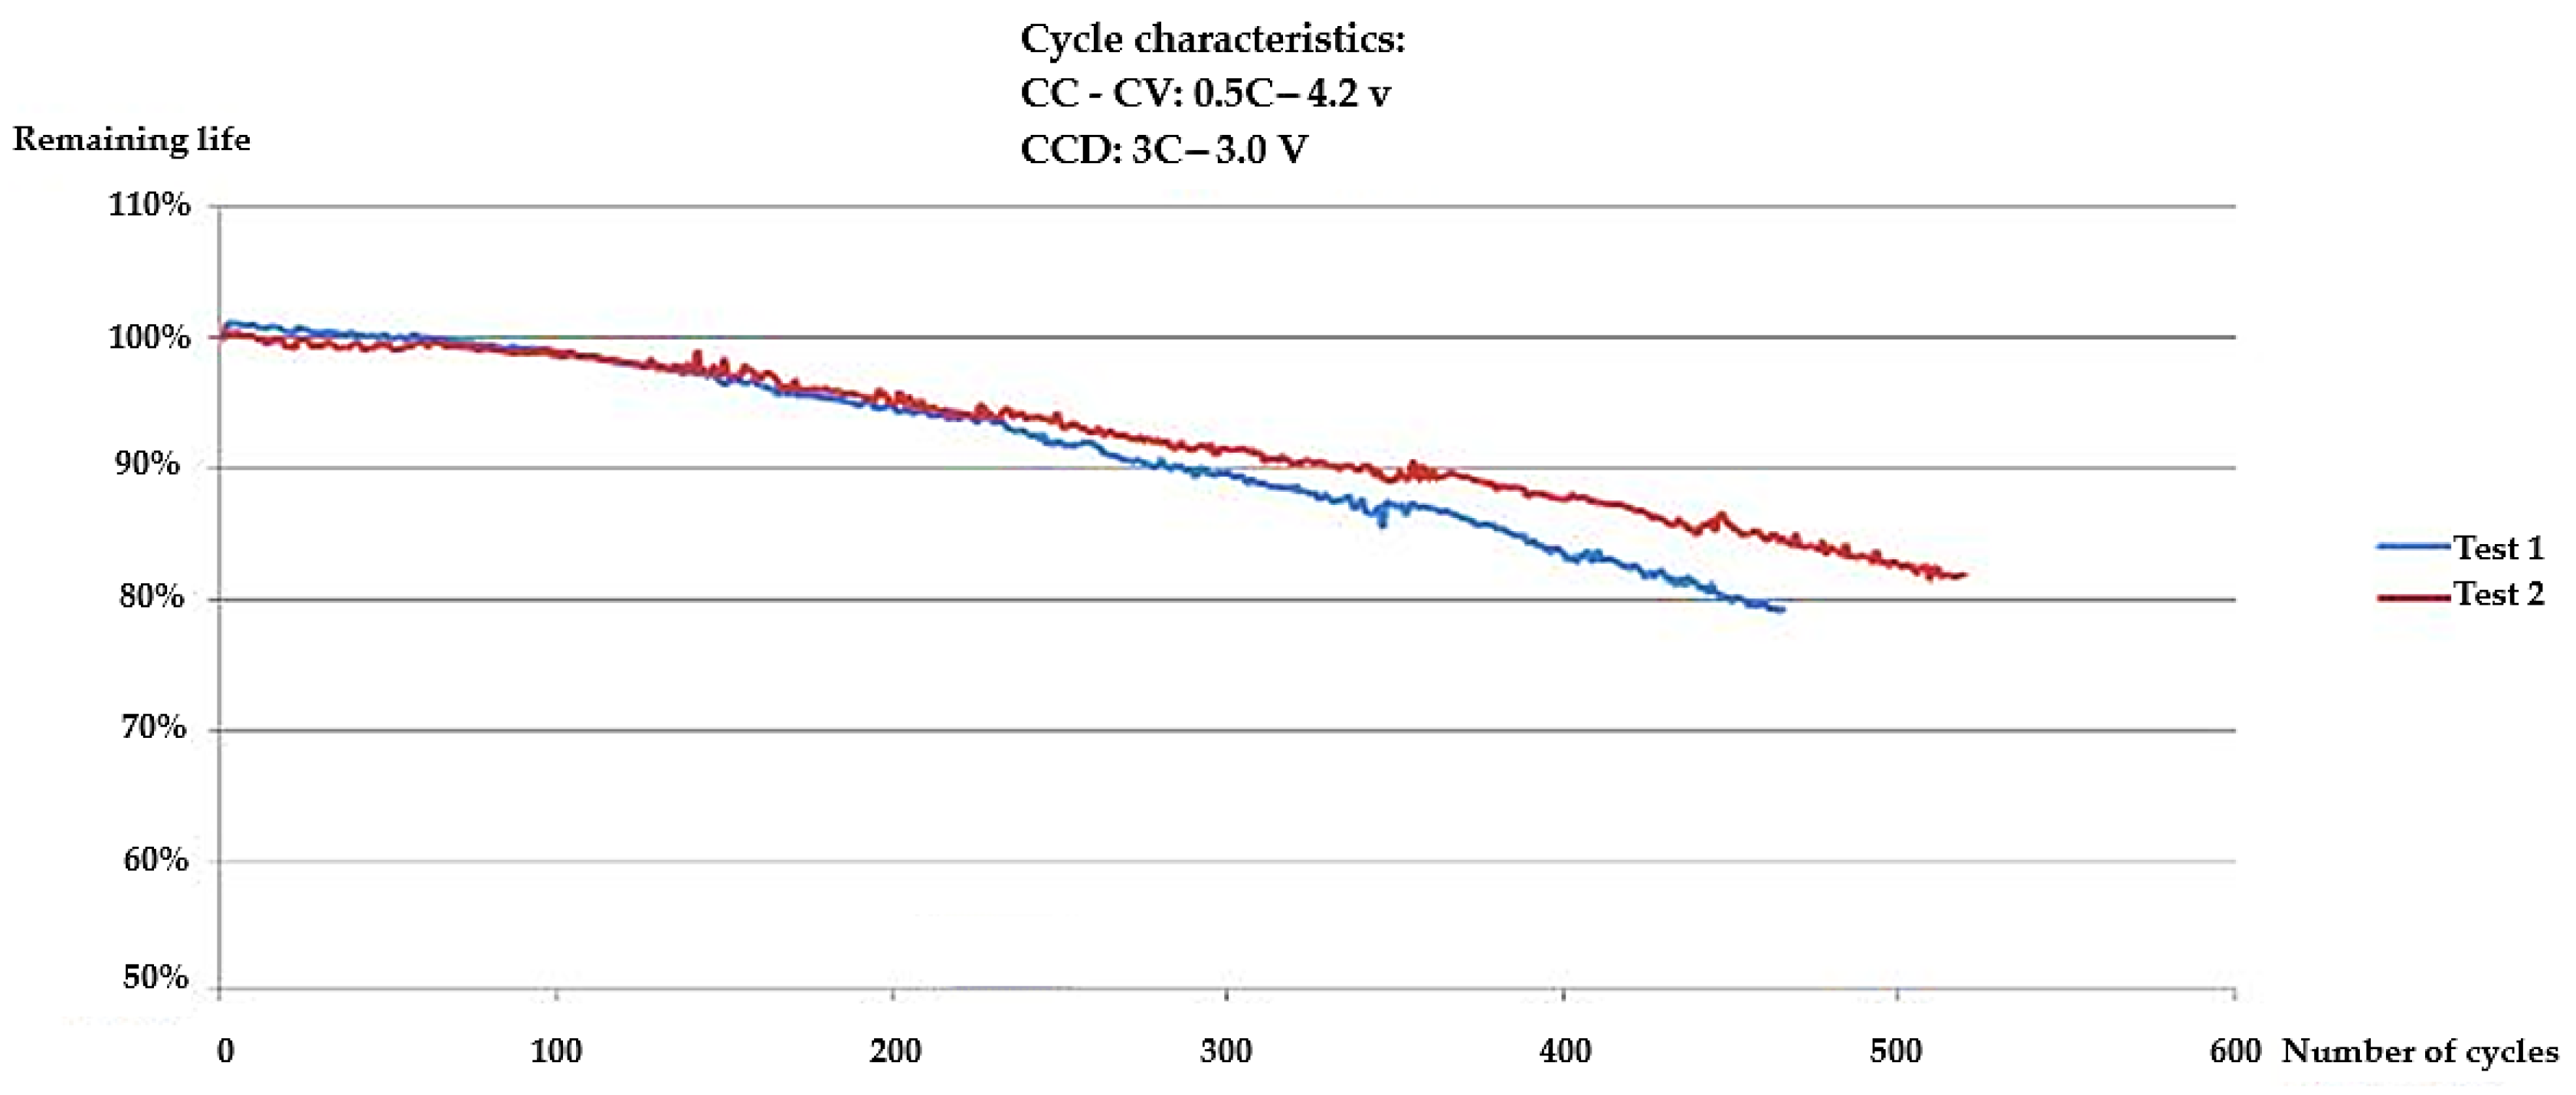
In the cycling test, the 80 cells that made up the battery module were tested to measure their SOH. In this study, it was found that 46 cells (57%) had a SOH ≥ 80%, and 24 cells (30%) maintained a SOH ≥ 90%. On the other hand, seven cells (9%) stopped working within the first cycle. It should be noted that these cells were within the nominal voltage, in contrast to those with low voltage, which returned to the nominal voltage after a charging cycle. Regarding the remaining 27 cells (34%), their SOH was greater than 50%, so their useful life had ended, according to the datasheet. It should be noted that in the IR measurement, the cells presented an increase in resistance between 100 and 200% with respect to the original IR reported by the manufacturer (≤30 mΩ); however, this was obtained with a smart charger that has a two-wire method of measurement, so the values could have a high degree of uncertainty.
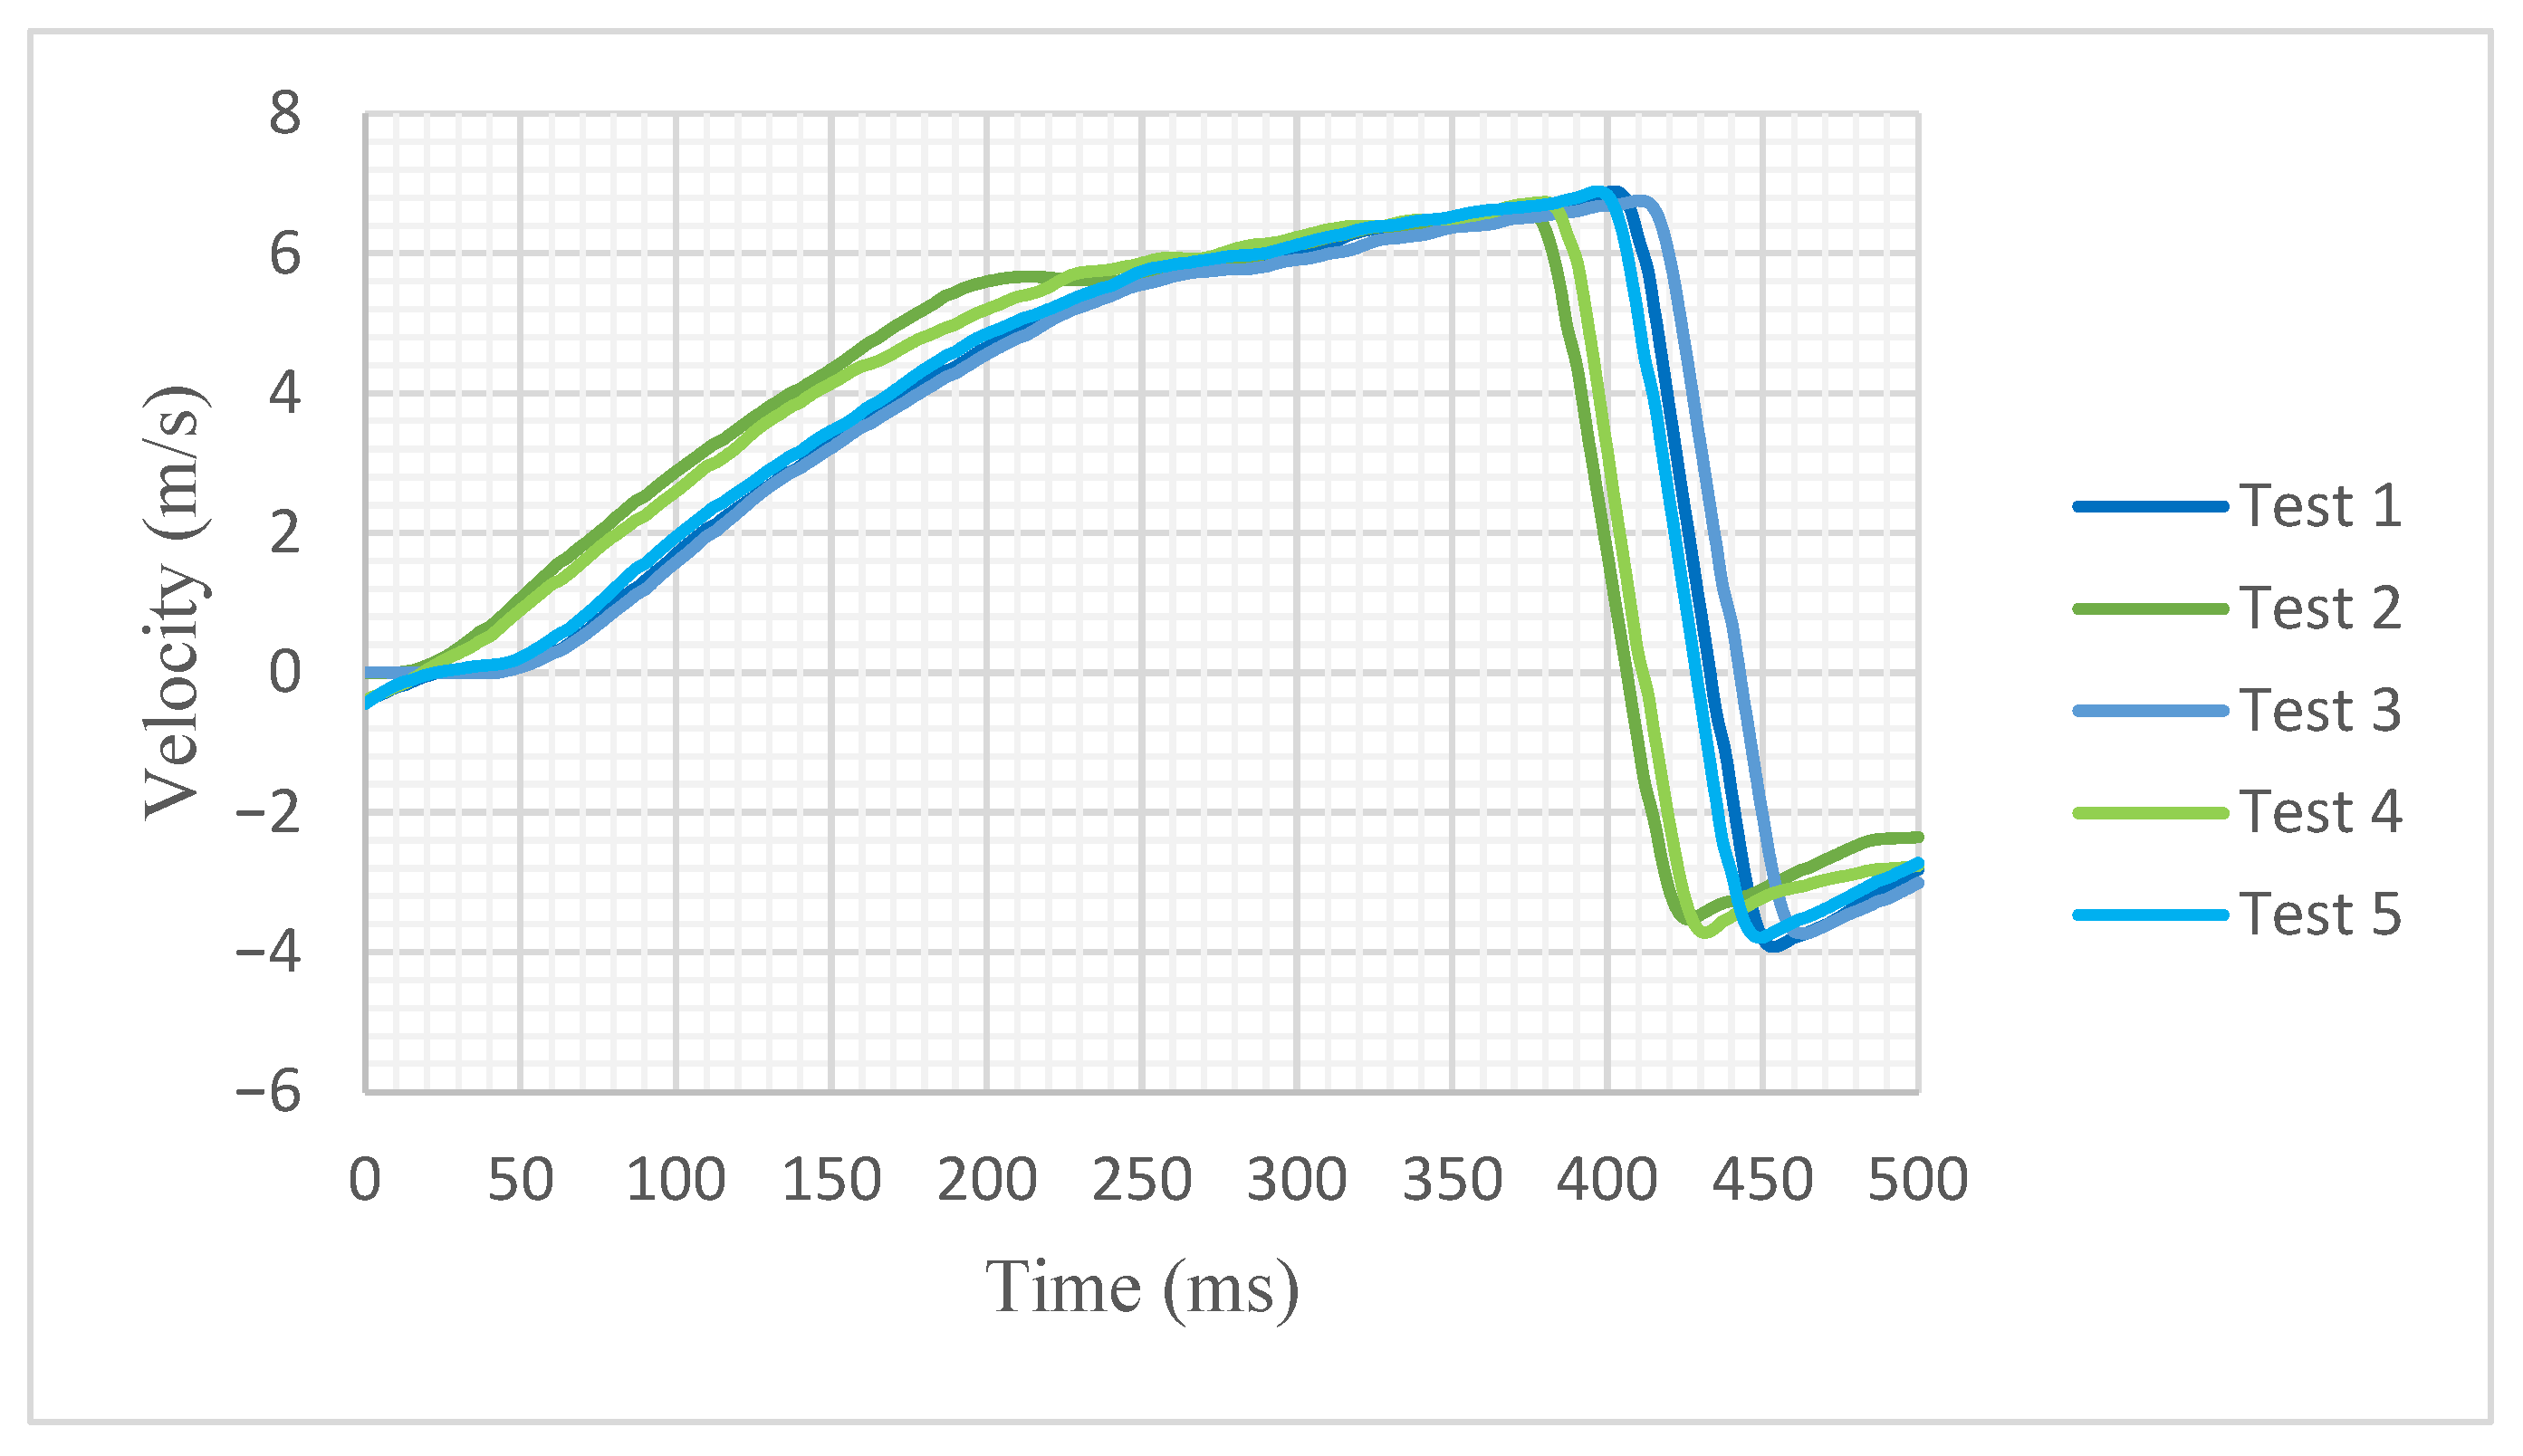
Regarding lineal kinematics, 
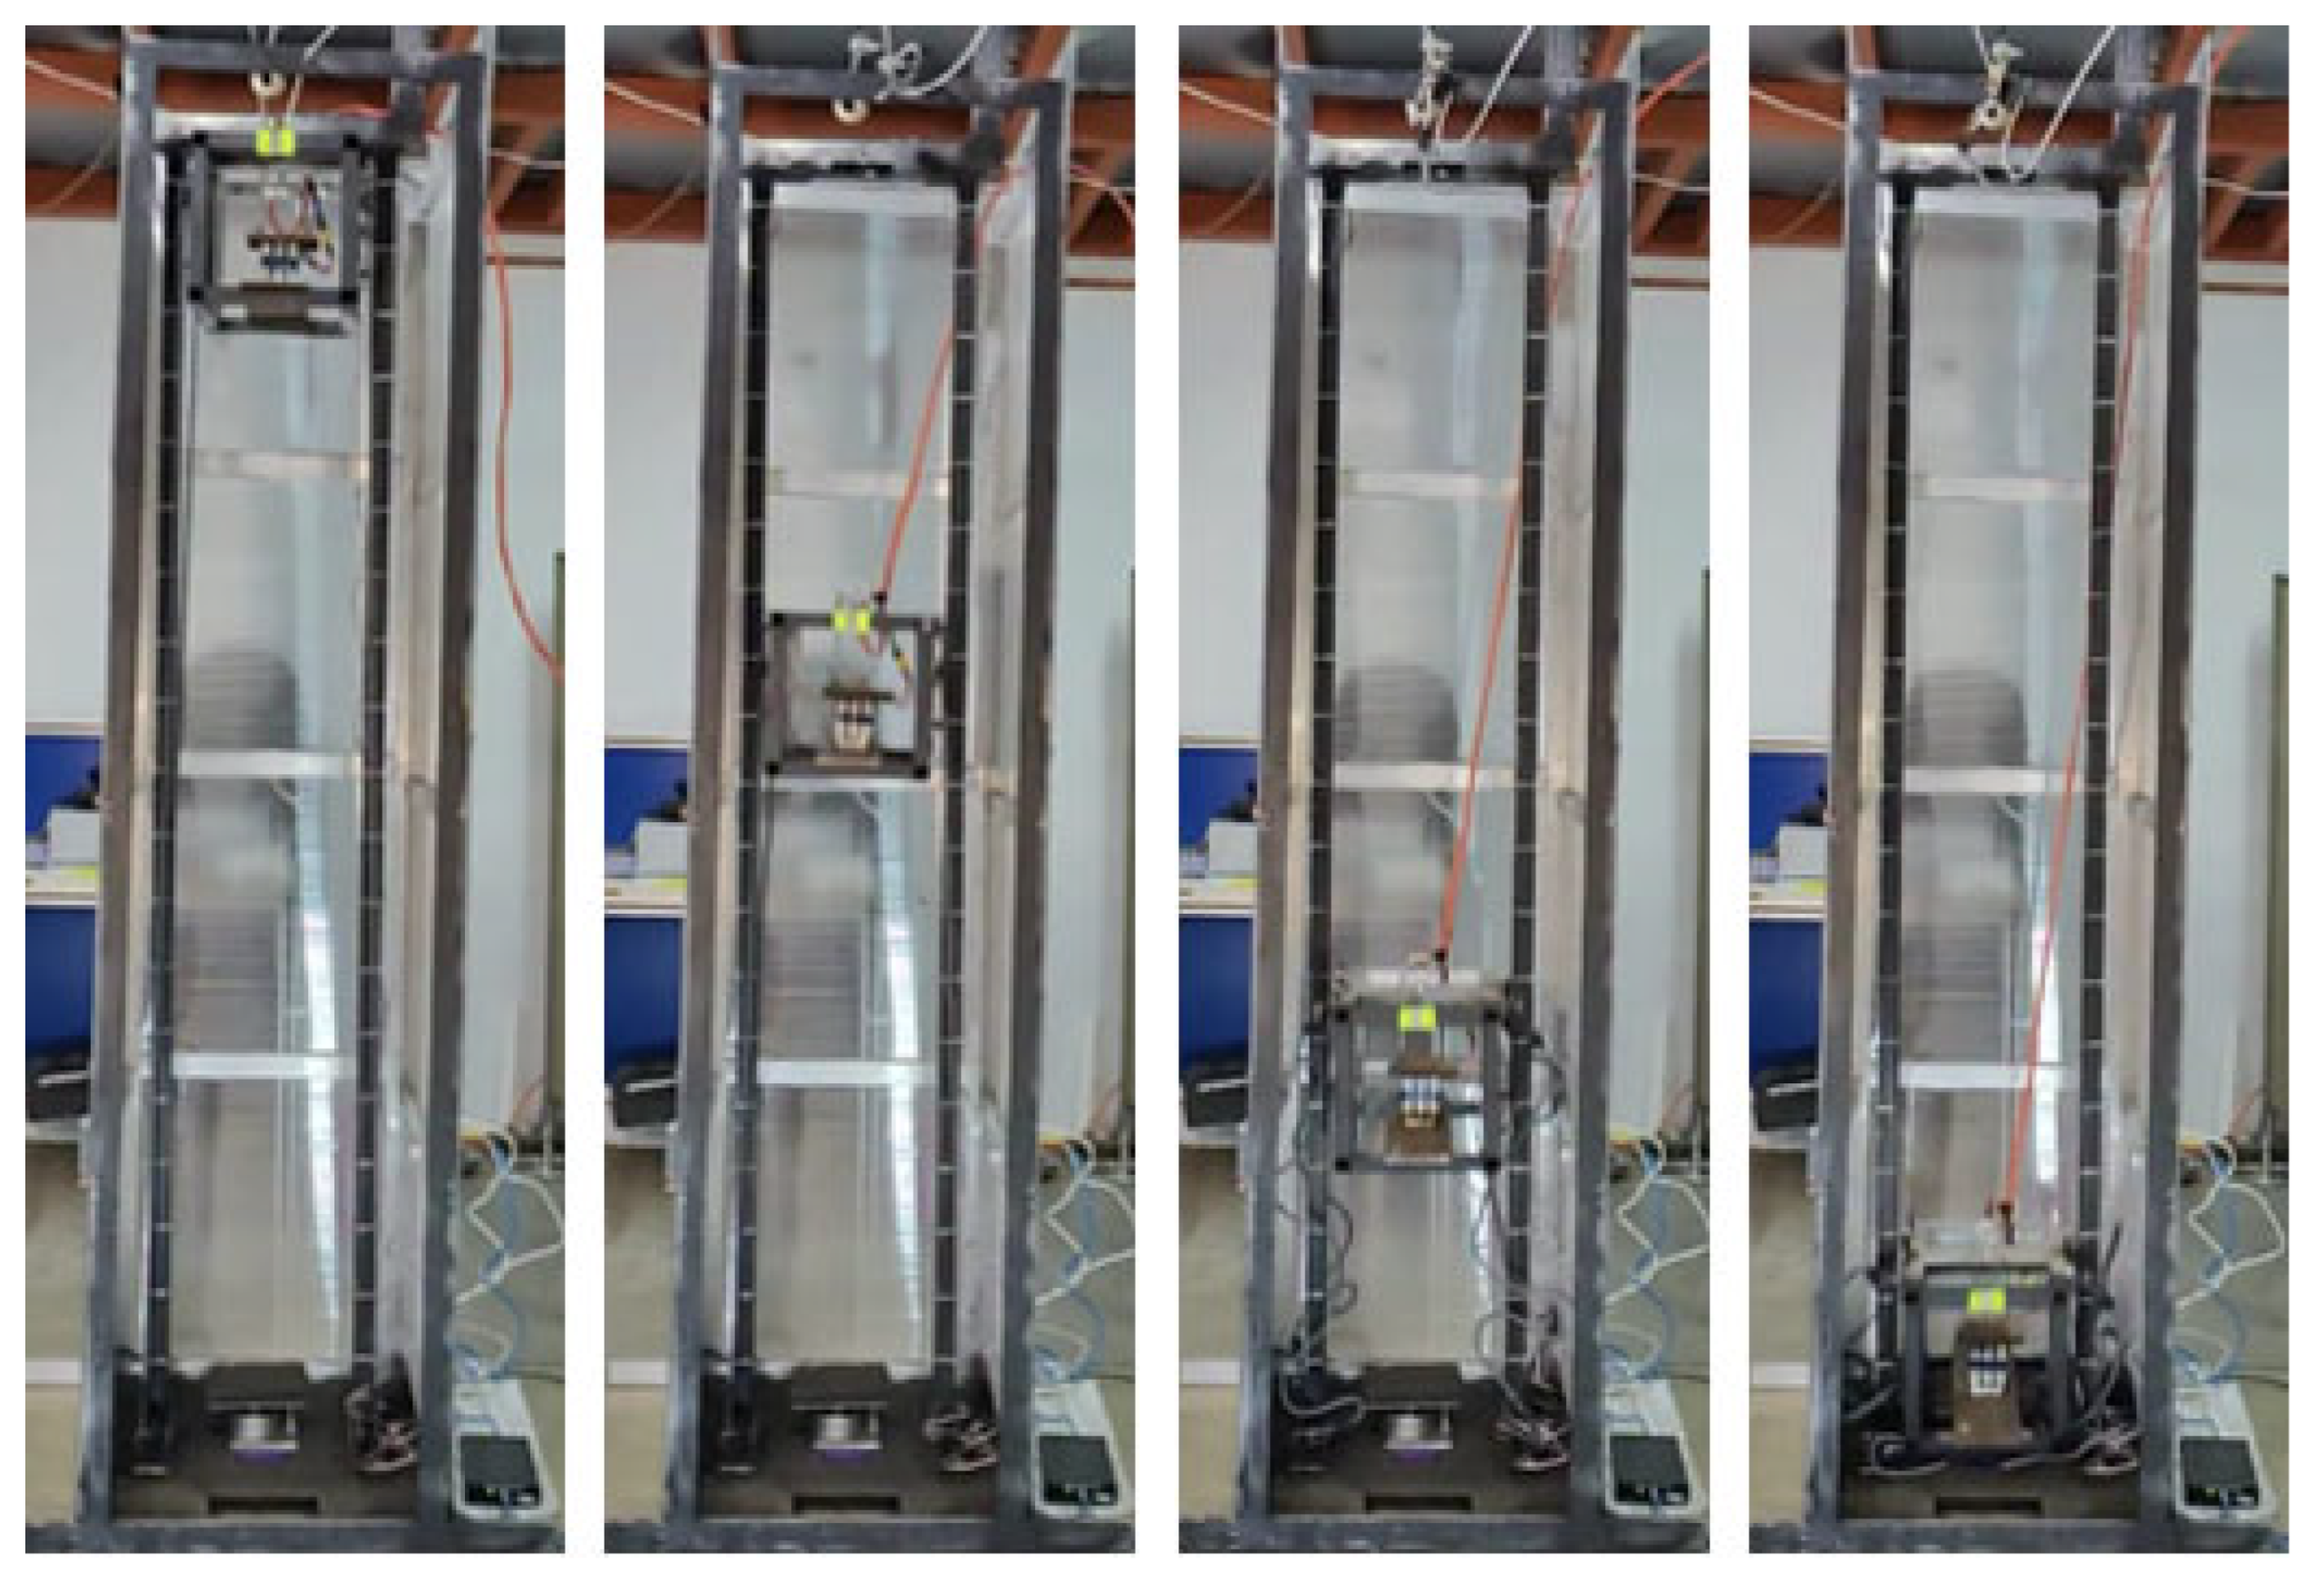
Figure 13 shows the comparison of speed against time in the five tests carried out. At this stage, the acceleration lasted between 0 and 250 milliseconds (ms), as the tension in the elastic cords had been released. Consequently, a 1 G acceleration stage was entered, and the speed increased continuously to between 250 and 420 ms. Subsequently, the impact occurred, wherein the indenter abruptly lost speed until it reached 0 m/s. However, due to inertia, a rebound stage occurred, which took place between 420 ms and 600 ms, wherein negative velocities resulted from the movement of the indenter in the opposite direction to the fall, ultimately stabilizing. 
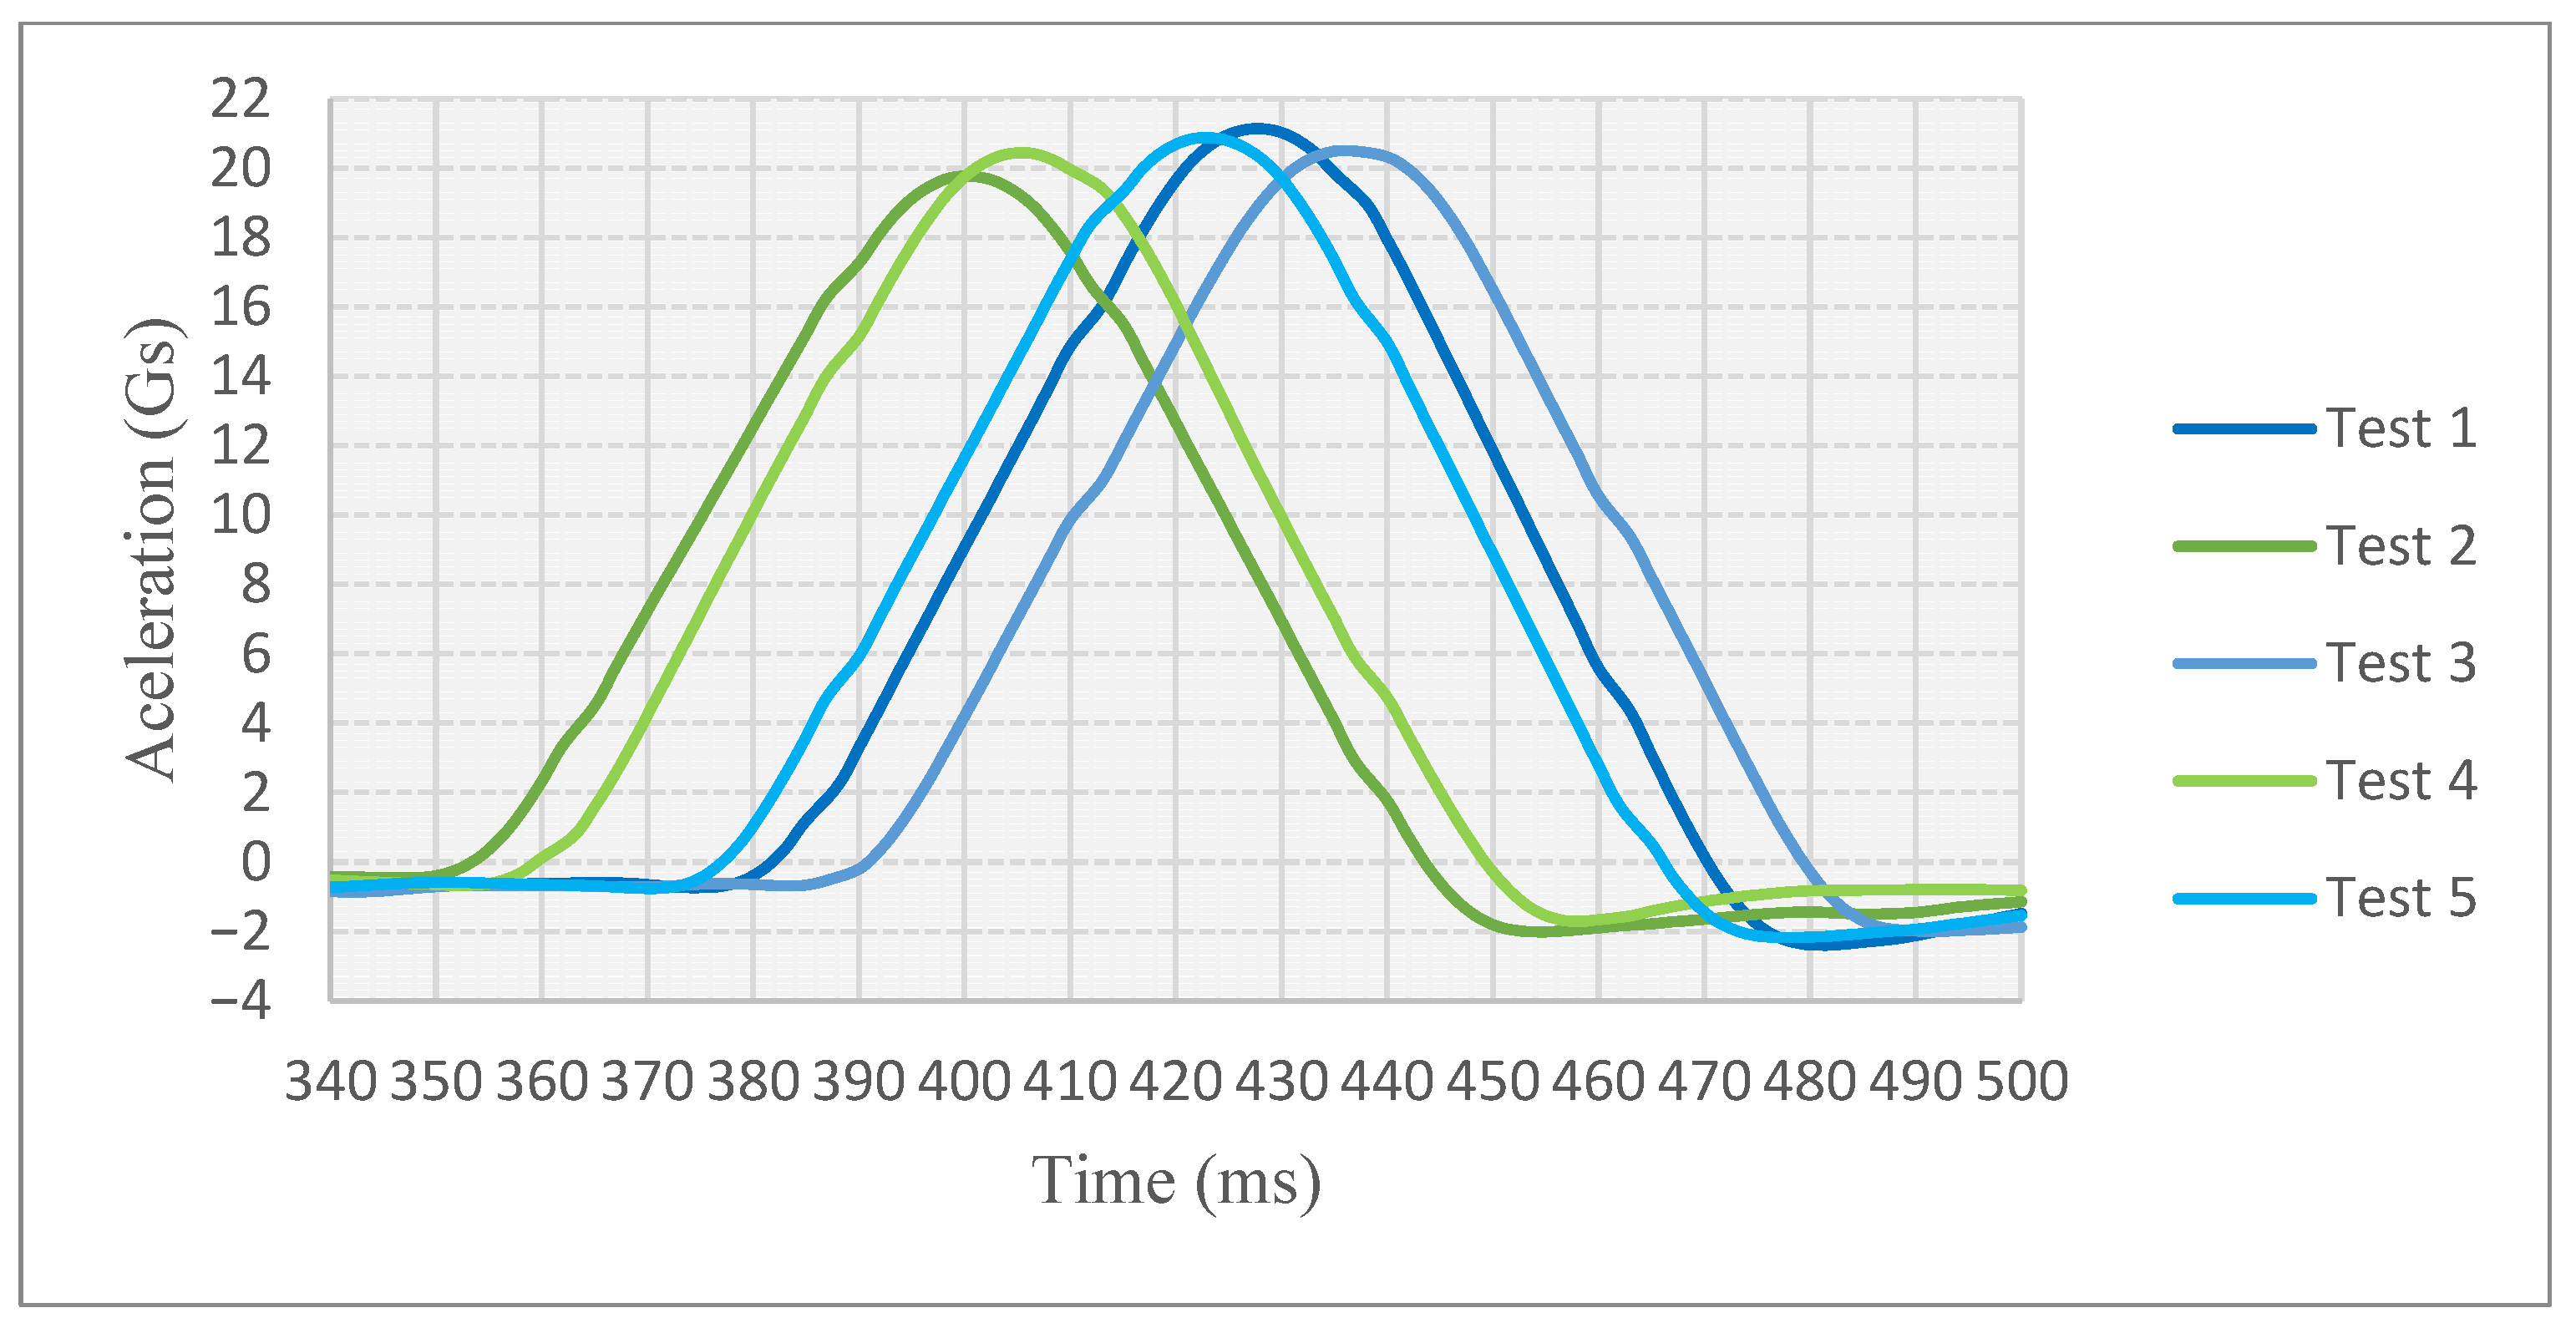
Figure 14 shows the comparison of acceleration against time in the five tests carried out. It should be noted that the semi-sinusoidal pulse part of the graph will be analyzed, as it is the primary focus of the study. This pulse occurred between 350 and 490 ms, where the start of each curve represents the acceleration before impact, and the peak corresponds to the maximum deceleration during impact. The average duration of these pulses is 53.6 ms. Maximum acceleration was measured by the change in direction, i.e., from maximum deceleration during impact to the maximum acceleration after impact. Additionally, the design data according to the regulations is a function of g-force, so the origin is positioned at the beginning of the curve, and the conversion from m/s2 to g-force is carried out.
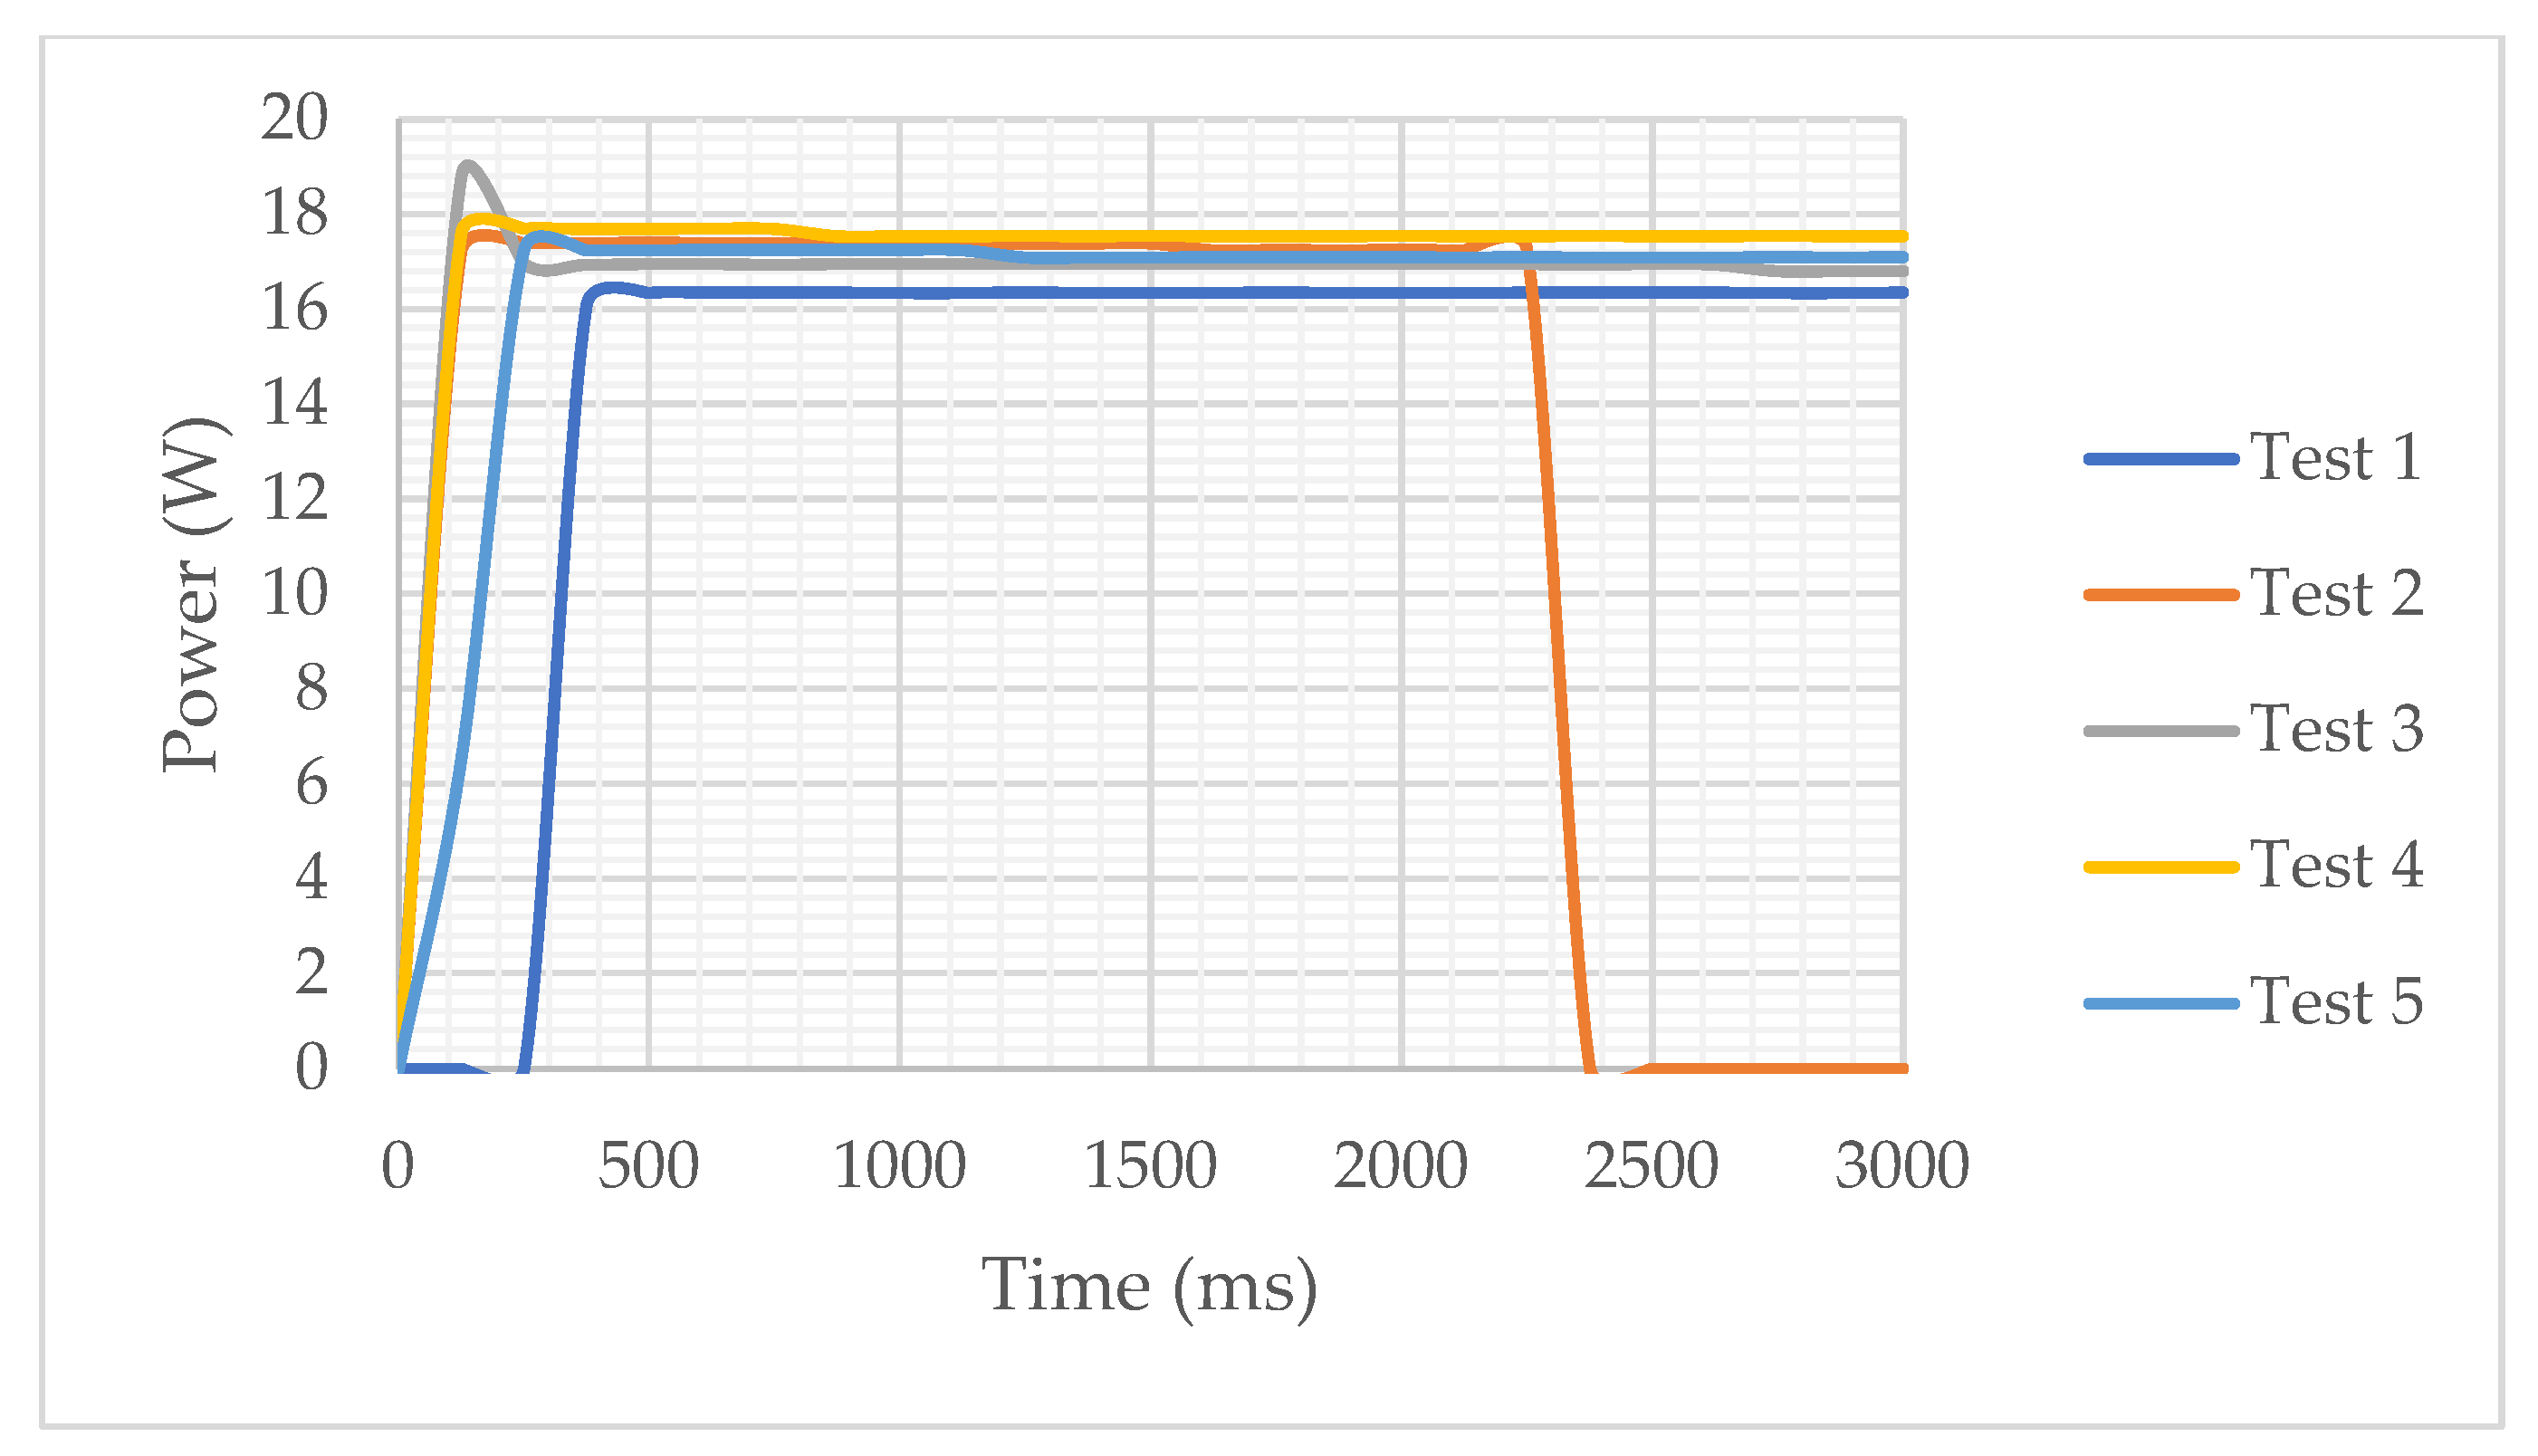
With respect to the electrical parameters, the DUTs were at 100% SOC. In Figure 15, a voltage drop peak, and a current surge peak are observed; therefore, power is shown in Figure 16 and Figure 17, respectively. This is due to the power demand of 1.5 A DC during the tests. The moment of shock occurs between 2000 and 2500 ms, where test 2 presents a sudden drop in voltage, current, and power. This is due to the failure of the connection between the BMS and the XT-60 connector. With respect to the other modules, they did not present any change in their parameters at the time of the crash.
Regarding the thermal part, the internal and external temperatures of the modules were measured. The internal temperature was within a range of 25 ± 0.5 °C, whereas the external temperature record was in a range of 28 ± 0.5 °C. The temperature difference was due to the thermal camera recording the temperature of the BMS, which has a higher operating temperature than the cells.
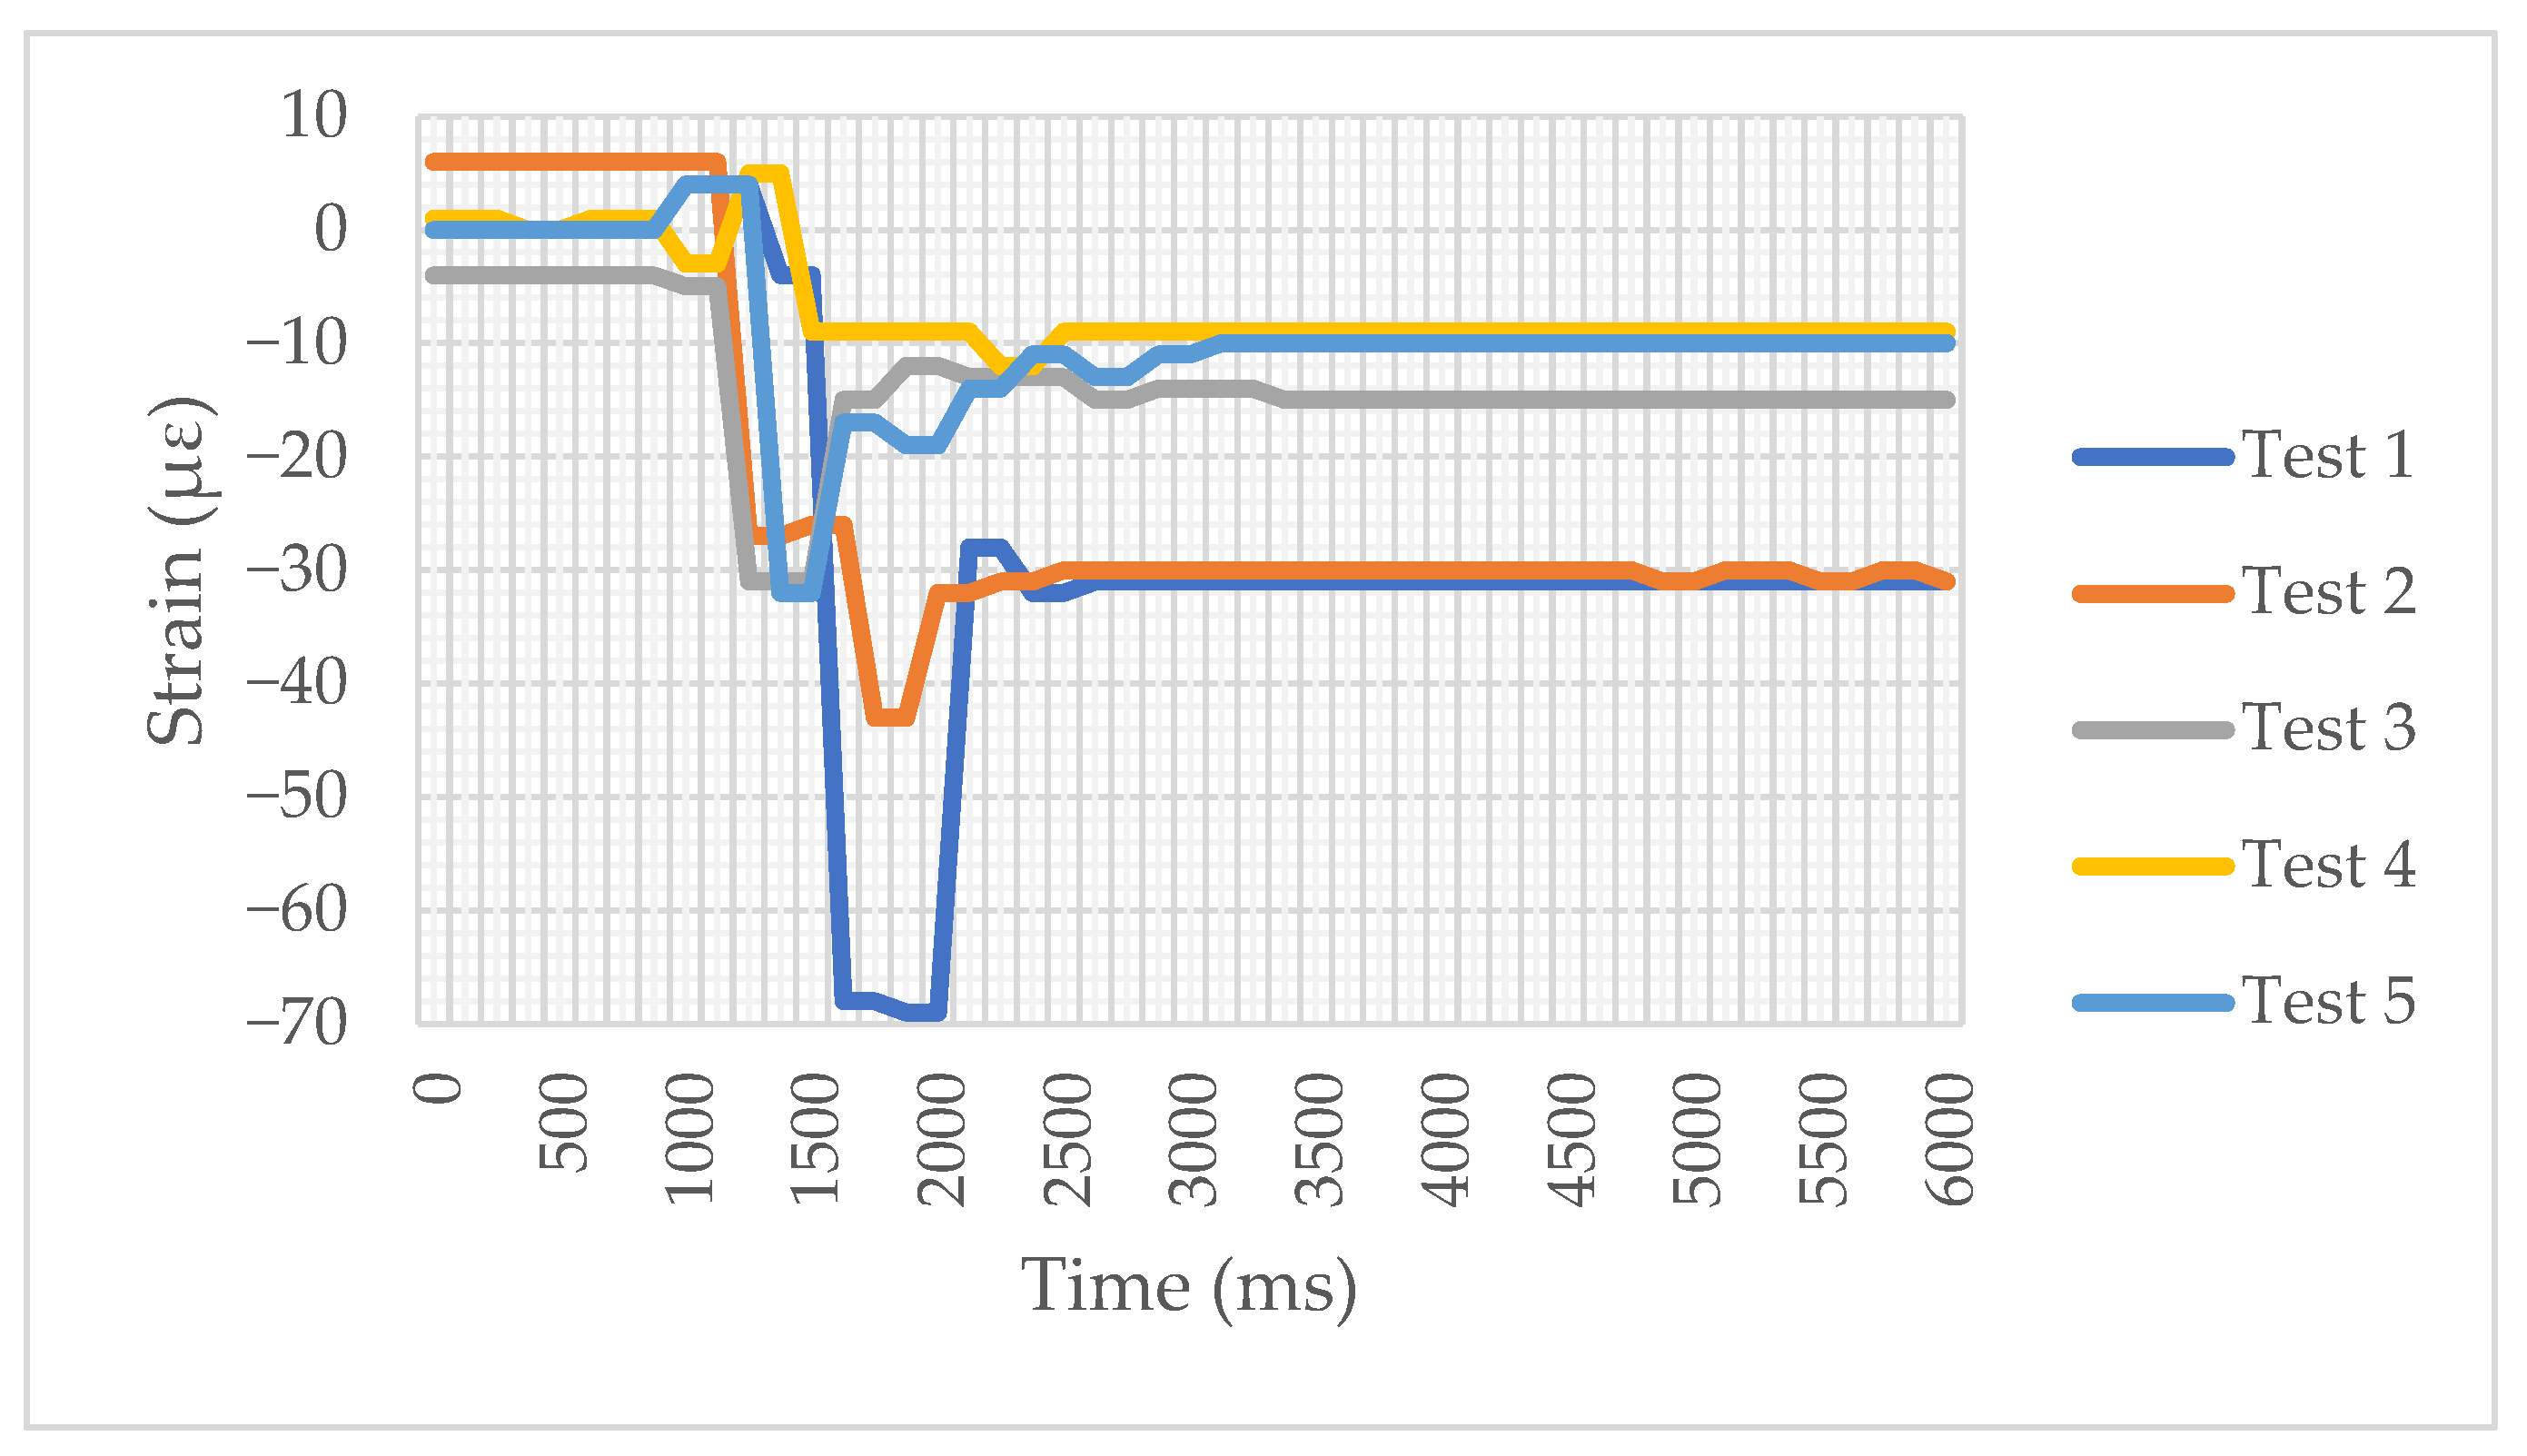
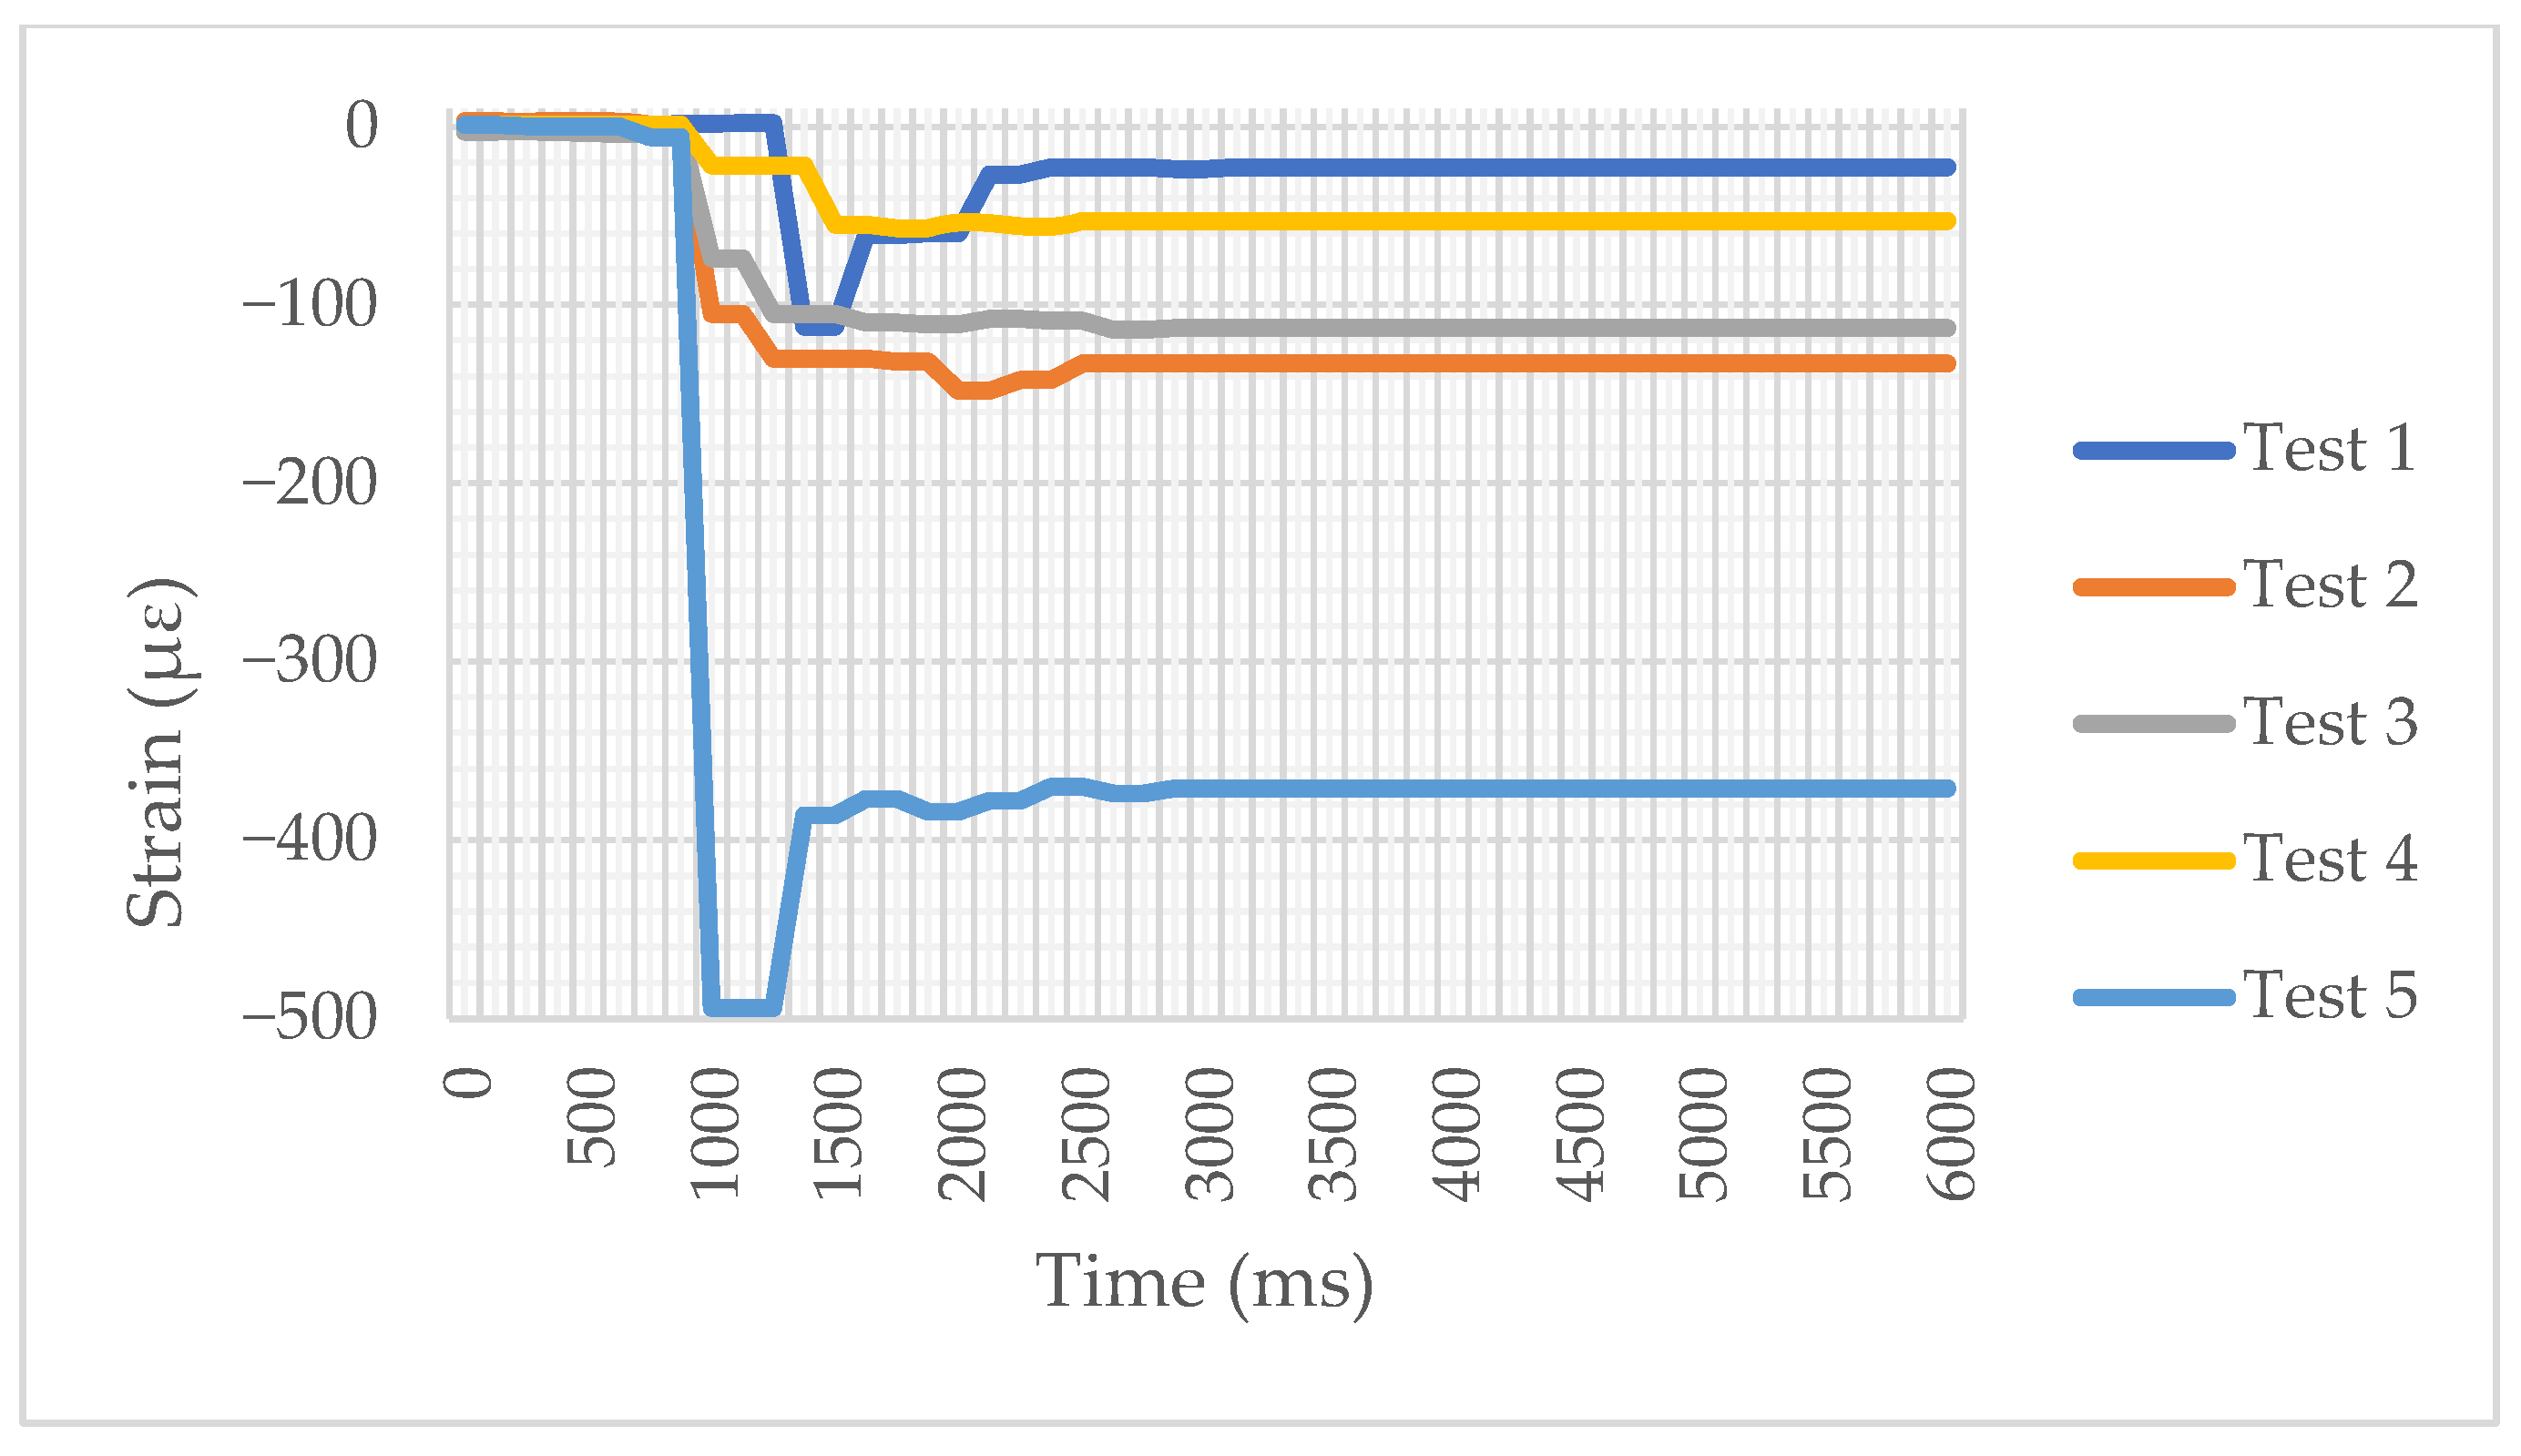
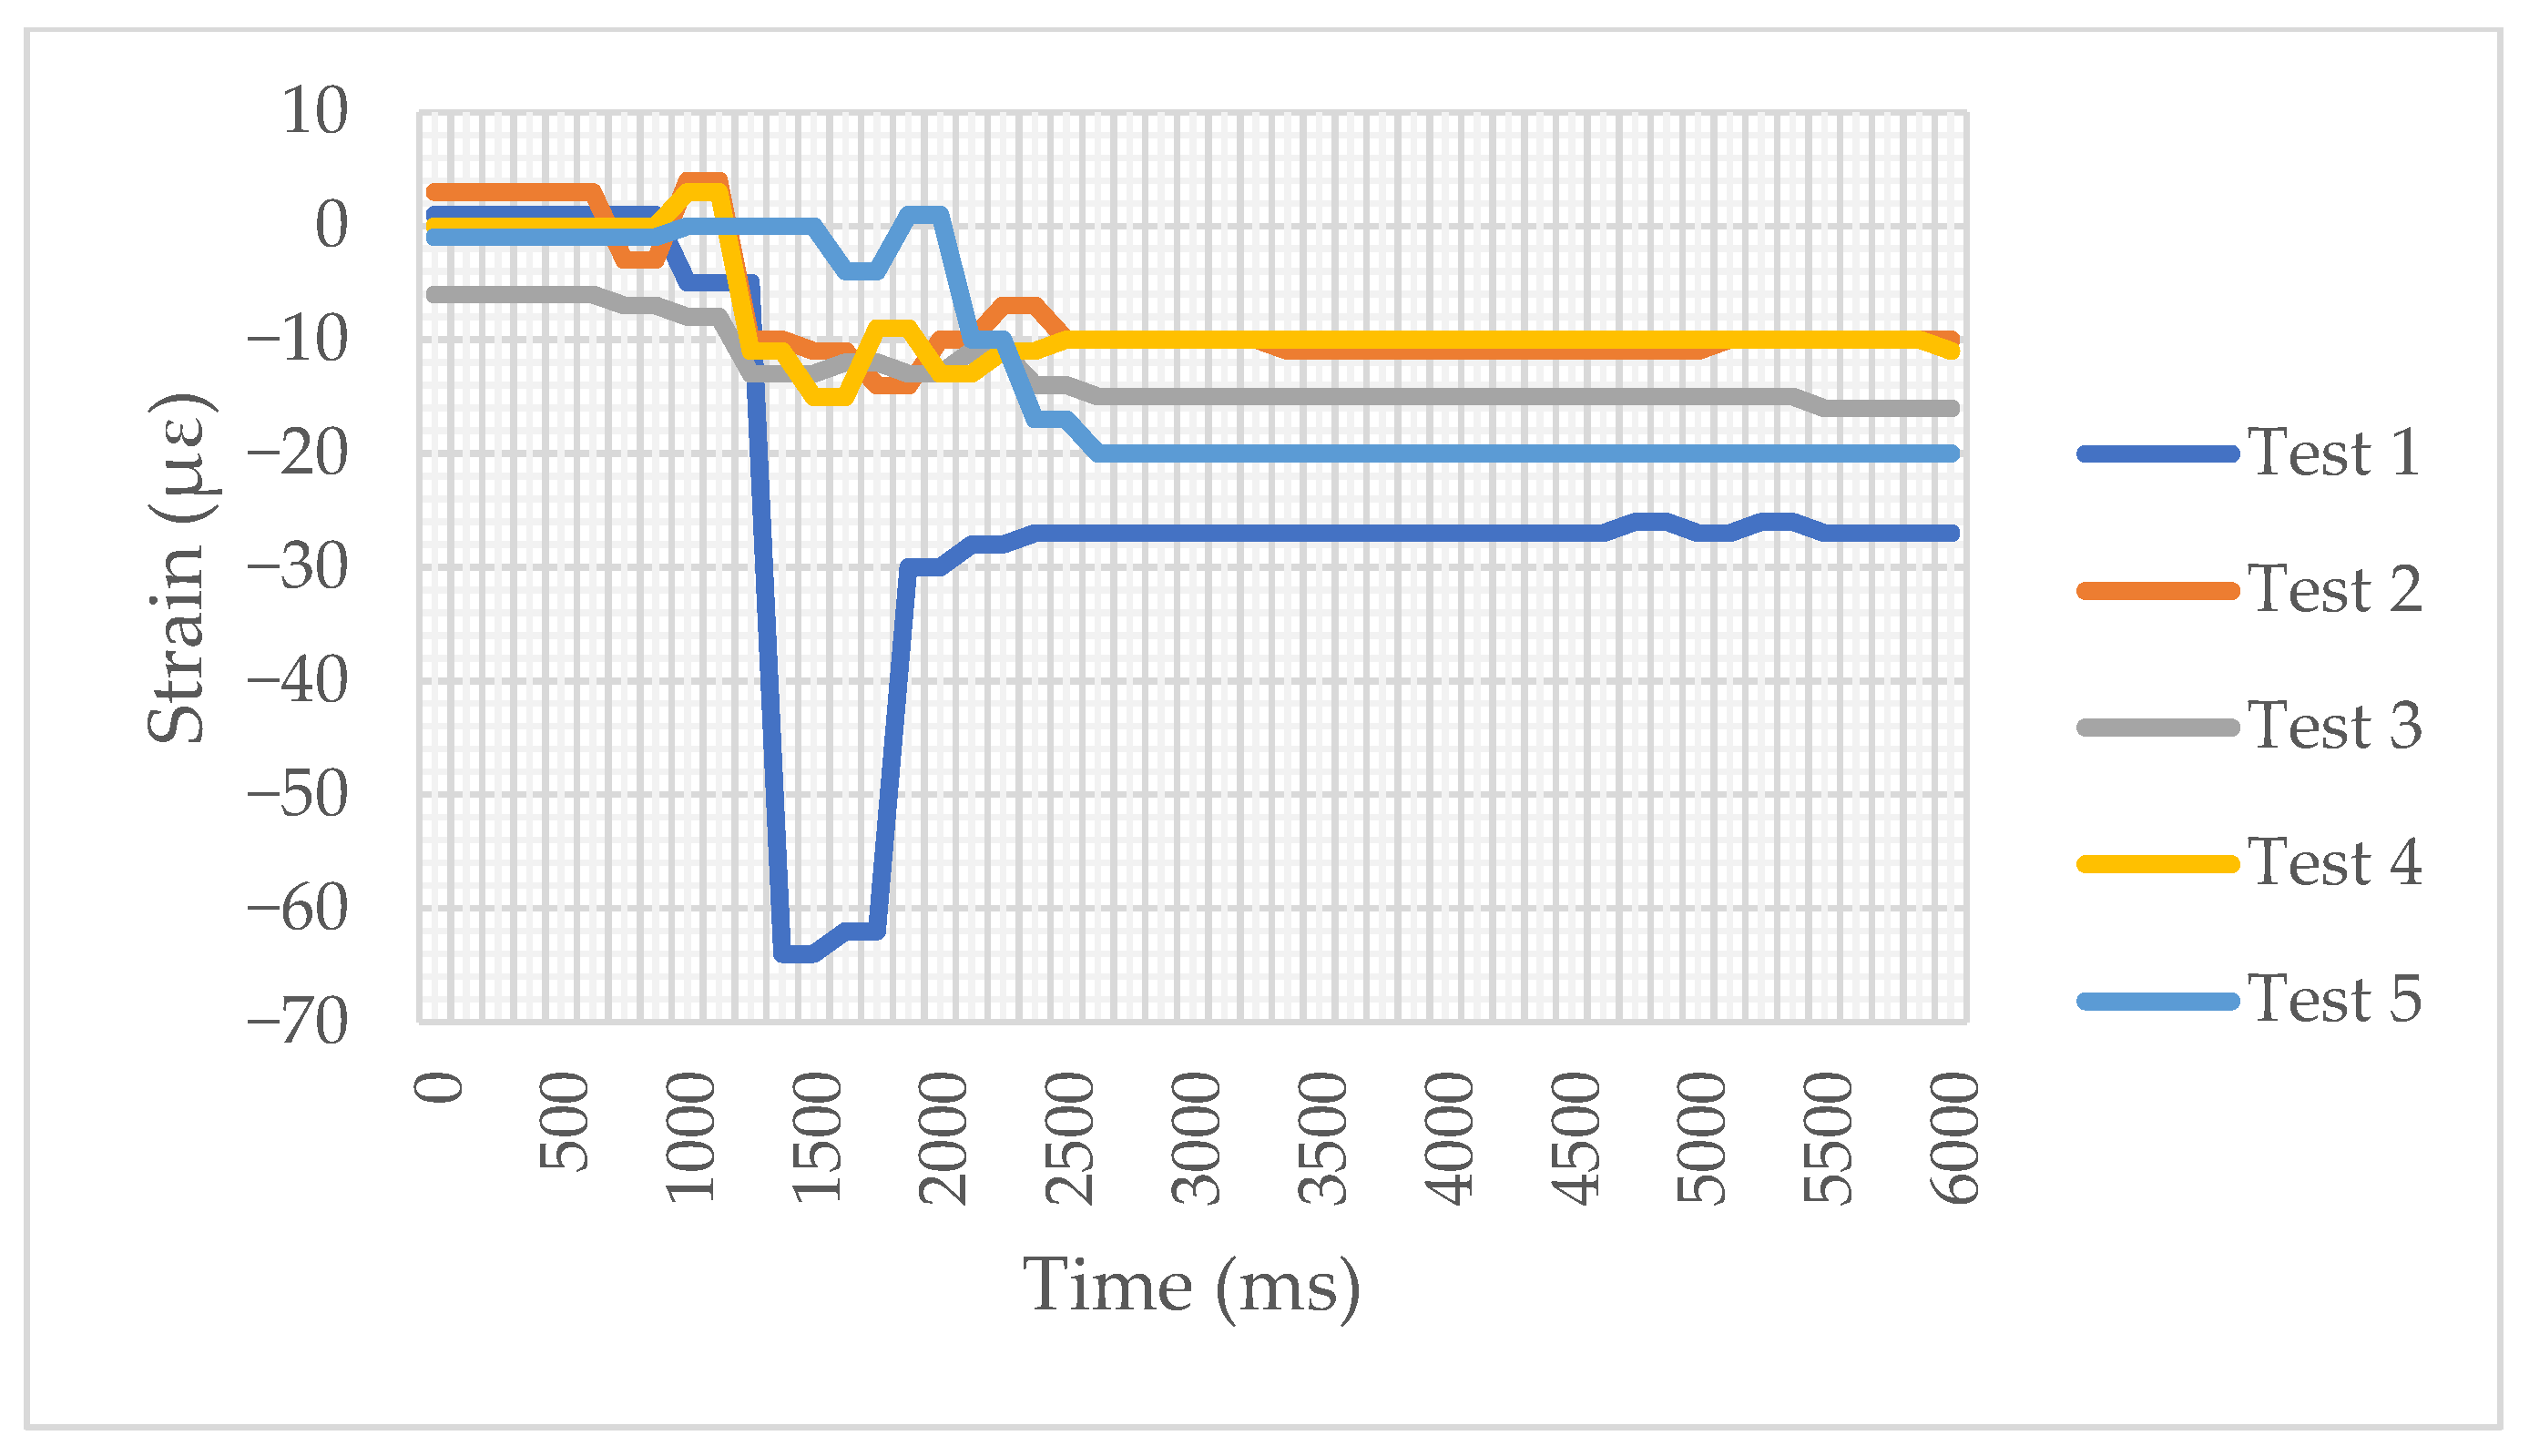
In the mechanical analysis, Figure 18, Figure 19 and Figure 20 show the records of microdeformations in gauges A, B, and C, respectively. In these graphs, the peak of the microdeformations occurs between 1000 and 2000 ms. In Table 18, the strain values are negative, which indicates the cells are being compressed during impact. The strain values varied across the tests, affecting the DUTs differently due to the impact force. Test 5 showed the highest compressive strain in the cell’s longitudinal face, this being −354 µε. Utilizing the Von Mises failure criterion, it was confirmed that the casings of the tested cells exhibit no cracks from the applied impact, as the elastic limit of the casing material (A3 steel) is 250 MPa. Test 5 recorded the highest result at 114.73 MPa. It is worth highlighting that the DUTs inside the platform were fixed only on its Y-axis. When reviewing the slow-motion recordings, it was noted that the DUTs moved randomly, which could have altered the measurements of the gauges during the impact, as observed in test 5.

5. Conclusions

This work provides a critical new understanding of lithium-ion cell aging and mechanical shock response, quantifying the damage incurred at the cell level within an aging battery module of an electric scooter under mechanical shock conditions, such as those encountered in traffic accidents. More than half of the internal cells maintained an SOH of over 80%, and almost half of those cells had an SOH of ≥90%, indicating they remain within their useful life. However, there was a notable increase in their IR, leading to significant aging, even if the cells generally maintained capacity. This higher IR increases the risk to performance and might cause voltage drops and higher temperatures under high current loads. This parameter would have to be measured with high-precision equipment to verify and have a correct correlation.
Mechanical impact tests revealed a pattern of initial acceleration followed by a sharp deceleration upon impact, and a subsequent rebound phase. While most modules exhibited no instantaneous electrical failures during these tests, the observed random movement was attributed to insufficient mounting points and a mechanical measurement source of inaccuracy. Despite the failure criterion indicating that the casing material withstood mechanical impacts, the internal materials of the cells may fail, resulting in microcracks that could lead to internal short circuit. Therefore, a post-mortem study of the tested cells would be advantageous.
The single incident of a module connection failure highlights the importance of robust connection integrity in environments susceptible to shock. Although internal temperatures during testing remain constant, the temperature difference relative to external readings from the thermal camera, which is influenced by the running temperature of the BMS, underscores the importance of considering sensor location in future thermal investigations.

Author Contributions

Conceptualization, M.A.C.-P. and C.R.T.-S., methodology, J.C.P.-R.; software, J.A.F.-C.; validation, A.O.-O. and C.R.T.-S.; formal analysis M.A.C.-P. and C.R.T.-S., investigation, J.A.F.-C. and C.R.T.-S. resources J.A.F.-C. and C.R.T.-S.; data curation, J.C.P.-R. and C.R.T.-S.; writing—original draft preparation, M.A.C.-P. and C.R.T.-S.; writing—review and editing, M.A.C.-P. and C.R.T.-S.; visualization, A.O.-O.; supervision, J.C.P.-R. and C.R.T.-S.; project administration, A.O.-O. and C.R.T.-S.; funding acquisition, C.R.T.-S. All authors have read and agreed to the published version of the manuscript.

Funding

The authors wish to gratefully acknowledge the Secretaría de Ciencia, Humanidades, Tecnología e Innovación (SECIHTI), as well as support received by the National Polytechnic Institute through the projects SIP 20250106, SIP 20250288, SIP 20250033, as well as EDI grants. This research was performed in the CONAHCYT National Laboratory for Intelligent Electromobility (LANCEI: Laboratorio Nacional CONAHCYT en Electromovilidad Inteligente).

Institutional Review Board Statement

Not applicable.

Data Availability Statement

The original contributions presented in this study are included in the article. Further inquiries can be directed to the corresponding author.

Acknowledgments

The authors are thankful to the Instituto Politécnico Nacional and an EDI grant from SIP/IPN.

Conflicts of Interest

The authors declare no conflicts of interest.

Appendix A

Table A1. Electrical cell parameters obtained in the performance test.
CellInitial
Voltage (V)
Charge
Voltage (V)
IR (mΩ)Capacity (mAh)SOH (%)Mass (g)
1s-13.95000045
1s-23.944.166812216144
1s-33.944.157013776945
1s-43.924.165513866944
1s-53.944.175715517845
2s-14.004.186017398745
2s-21.604.175116678345
2s-31.104.185316048044
2s-44.004.166016488244
2s-51.704.166316128144
3s-13.954.186417098544
3s-23.954.168016238145
3s-33.944.068314837444
3s-43.954.106116428244
3s-53.944.186815527844
4s-13.914.185616308245
4s-23.914.098315487744
4s-33.904.149316348244
4s-43.914.058115197644
4s-53.914.175916198145
5s-13.944.166213776944
5s-23.944.157112676345
5s-33.943.978714117144
5s-43.944.158414377244
5s-53.944.166913576845
6s-12.754.064316048044
6s-22.753.994516188144
6s-32.754.024415297644
6s-42.763.994516958545
6s-52.754.154615607844
7s-12.694.157518559345
7s-22.664.037318799444
7s-32.663.867518439244
7s-42.653.967418579344
7s-52.654.137718189145
8s-12.724.169318879444
8s-22.724.159019289645
8s-32.723.859318729444
8s-42.723.958819859945
8s-52.723.329411325745
9s-11.604.166018669345
9s-21.684.086418729445
9s-31.604.186318829445
9s-41.694.156818589345
9s-51.604.175718779444
10s-12.754.068719369744
10s-22.753.978419039544
10s-32.753.988419339745
10s-42.754.178818459245
10s-52.754.176319189644
11s-13.914.066918809444
11s-23.913.957818279144
11s-33.913.967418889444
11s-43.914.137718219144
11s-53.914.176719369744
12s-13.93000044
12s-23.934.148610795444
12s-33.934.179511755945
12s-43.934.166114217144
12s-53.93000044
13s-13.934.167916288144
13s-23.934.169016228145
13s-33.934.165816358244
13s-43.914.169916528344
13s-53.934.156116178144
14s-13.904.175716108044
14s-23.904.175515908045
14s-33.904.168115717945
14s-43.904.166516258144
14s-53.904.167814847445
15s-13.88000045
15s-23.88000045
15s-33.88000044
15s-43.88000044
15s-53.884.147412216145
16s-13.964.157313686845
16s-23.964.178113326744
16s-33.964.168612096045
16s-43.964.175514857444
16s-53.964.176714137144

References

  1. Rode, P.; Burdett, R. Towards a Green Economy. United Nations Environment Program. 2011. Available online: https://wedocs.unep.org/bitstream/handle/20.500.11822/7979/GER_12_Cities.pdf?sequence=3&isAllowed=y (accessed on 20 January 2025).
  2. United Nations. Goal 11: Make Cities Inclusive, Safe, Resilient, and Sustainable. 2022. Available online: https://www.un.org/sustainabledevelopment/cities/ (accessed on 20 January 2025).
  3. Raczek, T. The Paris Declaration on Electromobility and Climate Change and Call to Action. 2015. Available online: https://unfccc.int/news/the-paris-declaration-on-electro-mobility-and-climate-change-and-call-to-action (accessed on 20 January 2025).
  4. Chau, T.; Wang, K. An association between air pollution and daily most frequently visits of eighteen outpatient diseases in an industrial city. Sci. Rep. 2020, 10, 2321. [Google Scholar] [CrossRef] [PubMed]
  5. Juginović, A.; Vuković, M.; Aranza, I.; Biloš, V. Health impacts of air pollution exposure from 1990 to 2019 in 43 European countries. Sci. Rep. 2021, 11, 22516. [Google Scholar] [CrossRef]
  6. World Health Organization. The Top 10 Causes of Death. 2020. Available online: https://www.who.int/news-room/fact-sheets/detail/the-top-10-causes-of-death (accessed on 24 January 2025).
  7. Mock, P. World-Harmonized Light-Duty Vehicles Test Procedure (WLTP); Technical Report; International Council Clean Transportation: San Francisco, CA, USA, 2013. [Google Scholar]
  8. ITF. Safer Micromobility. In International Transport Forum Policy Papers, No. 129; OECD Publishing: Paris, France, 2024. [Google Scholar]
  9. Yannis, G.; Crist, P.; Petraki, V. Safer Micromobility: Technical Background Report; National Technical University of Athens: Zografou, Greece, 2024. [Google Scholar]
  10. Oeschger, G.; Carroll, P.; Caulfield, B. Micromobility and public transport integration: The current state of knowledge. Transp. Res. Part D Transp. Environ. 2020, 89, 102628. [Google Scholar] [CrossRef]
  11. Feng, C.; Jiao, J.; Wang, H. Estimating E-Scooter Traffic Flow Using Big Data to Support Planning for Micromobility. J. Urban Technol. 2020, 29, 139–157. [Google Scholar] [CrossRef]
  12. MDCG DocsRoom—European Commission. Ongoing MDR IVDR Guidance Plan. 2020. Available online: https://ec.europa.eu/docsroom/documents/37824 (accessed on 28 January 2025).
  13. Stark, J.; Meschik, M.; Singleton, P.A.; Schützhofer, B. Active school travel, attitudes and psychological well-being of children. Transp. Res. Part F Traffic Psychol. Behav. 2018, 56, 453–465. [Google Scholar] [CrossRef]
  14. Møller, T.H.; Simlett, J. Micromobility: Moving Cities into a Sustainable Future. EY Report. 2020. Available online: https://www.ey.com/content/dam/ey-unified-site/ey-com/en-gl/insights/automotive/documents/ey-gl-micromobility-moving-cities-into-a-sustainable-future-01-2025.pdf (accessed on 7 July 2025).
  15. Galatoulas, N.-F.; Genikomsakis, K.N.; Ioakimidis, C.S. Spatio-Temporal Trends of E-Bike Sharing System Deployment: A Review in Europe, North America and Asia. Sustainability 2020, 12, 4611. [Google Scholar] [CrossRef]
  16. POLIS Macro Managing Micro Mobility. Available online: https://www.polisnetwork.eu/wp-content/uploads/2019/11/Polis-Paper-Macromanaging-MicroMobility.pdf (accessed on 31 January 2025).
  17. McQueen, M.; Abou-Zeid, G.; MacArthur, J.; Clifton, K. Transportation Transformation: Is Micromobility Making a Macro Impact on Sustainability? J. Plan. Lit. 2020, 36, 46–61. [Google Scholar] [CrossRef]
  18. Meigs, J.B. The Dark Side of “Micro-mobility”; Tragedies like this week’s e-bike repair shop fire highlight the hidden dangers that personal vehicles powered by lithium-ion batteries pose to urban environments. City J. 2023. Available online: https://link.gale.com/apps/doc/A779944225/AONE?u=anon~74a78fcf&sid=googleScholar&xid=bbeaebe4 (accessed on 3 February 2025).
  19. Spielbauer, M.; Berg, P.; Ringat, M.; Bohlen, O.; Jossen, A. Experimental study of the impedance behavior of 18650 lithium-ion battery cells under deforming mechanical abuse. J. Energy Storage 2019, 26, 101039. [Google Scholar] [CrossRef]
  20. Gehandler, J.; Karlsson, P.; Vylund, L. Risks Associated with Alternative Fuels in Road Tunnels and Underground Garages; SP Technical: Singapore, 2017. [Google Scholar]
  21. Pan, Z.; Li, W.; Xia, Y. Experiments and 3D detailed modeling for a pouch battery cell under impact loading. J. Energy Storage 2020, 27, 101016. [Google Scholar] [CrossRef]
  22. Ehsani, M. Modern Electric, hybrid Electric and fuel cell vehicles. In Fundamentals, Theory and Design; CRC Press: Boca Raton, FL, USA, 2010. [Google Scholar]
  23. Automotive Cells Co. Battery Cell, Module or Pack. What’s the Difference? 30 June 2022. Available online: https://www.acc-emotion.com/stories/battery-cell-module-or-pack-whats-difference-infographics (accessed on 12 February 2025).
  24. Das, A.; Li, D.; Williams, D.; Greenwood, D. Joining Technologies for Automotive Battery Systems Manufacturing. World Electr. Veh. J. 2018, 9, 22. [Google Scholar] [CrossRef]
  25. Wang, W.; Yang, S.; Lin, C.; Li, Y. Mechanical and electrical response of cylindrical Lithium-ion cells at various State of Charge. Energy Procedia 2018, 145, 128–132. [Google Scholar] [CrossRef]
  26. Goodman, J.K.S.; Miller, J.T.; Kreuzer, S.; Forman, J.; Wi, S.; Choi, J.; Oh, B.; White, K. Lithium-ion cell response to mechanical abuse: Three-point bend. J. Energy Storage 2020, 28, 101244. [Google Scholar] [CrossRef]
  27. Trattnig, G.; Leitgeb, W. Chapter 2: Battery modelling for crash safety simulation. In Automotive Battery Technology; Springer: Berlin, Germany, 2014; pp. 19–35. [Google Scholar]
  28. Office of the New York City Comptroller Brad Lander. Street Safety in the Era of Micromobility; Government of New York City: New York, NY, USA, 2024. Available online: https://comptroller.nyc.gov/reports/street-safety-in-the-era-of-micromobility/ (accessed on 7 July 2025).
  29. Qawasmeh, B. Micro-Mobility Safety Assessment: Analyzing Factors Influencing the Micro-Mobility Injuries in Michigan by Mining Crash Reports. Future Transp. 2024, 4, 1580–1601. [Google Scholar] [CrossRef]
  30. Zhu, J.; Wierzbicki, T.; Li, W. A review of safety-focused mechanical modeling of commercial lithium-ion batteries. J. Power Sources 2018, 378, 153–168. [Google Scholar] [CrossRef]
  31. Bisschop, R.; Willstrand, O.; Rosengren, M. Handling Lithium-Ion Batteries in Electric Vehicles: Preventing and Recovering from Hazardous Events. Fire Technol. 2020, 56, 2671–2694. [Google Scholar] [CrossRef]
  32. Zhipeng, S.; Xiagjun, B.; Haishuo, M.; Tianyi, M. Comparative Study on Methods of Dynamic Crash Test of Power Batteries. Adv. Nanosci. Nanotechnol. 2021, 5, 5–9. [Google Scholar]
  33. Zhao, W.; Luo, G.; Wang, C.-Y. Modeling Internal Shorting Process in Large-Format Li-Ion Cells. J. Electrochem. Soc. 2015, 162, A1352–A1364. [Google Scholar] [CrossRef]
  34. Larsson, F. Lithium-Ion Battery Safety-Assessment by Abuse Testing, Fluoride Gas Emissions and Fire Propagation. Ph.D. Thesis, Chalmers University of Technology, Gothenburg, Sweden, 2017. [Google Scholar]
  35. Fleischmann, C.; Weinschenk, C.; Madrzykowski, D.; Schraiber, A.; Gaudet, B. Quantifying the Fire Hazards of Lithium-Ion Battery Fires Caused by Thermal Runaway in E-Scooters. FSRI. 1 May 2025. Available online: https://fsri.org/research-update/journal-article-quantifies-fire-hazards-lithium-ion-battery-fires-caused-thermal (accessed on 18 June 2025).
  36. Torelli, D.A.; Faenza, N.; Johns, P.; Lawton, S.; Frake, J. Evaluation of fire spread and suppression techniques in micro-mobility battery packs. ECS Adv. 2024, 3, 010501. [Google Scholar] [CrossRef]
  37. Santhanagopalan, S.; Ramadass, P.; Zhang, J. Analysis of internal short-circuit in a lithium-ion cell. J. Power Sources 2009, 194, 550–557. [Google Scholar] [CrossRef]
  38. Fuchs, G.; Willenberg, L.; Ringbeck, F.; Sauer, D.U. Post-mortem analysis of inhomogeneous induced pressure on commercial lithium-ion pouch cells and their effects. Sustainability 2019, 11, 6738. [Google Scholar] [CrossRef]
  39. Li, L.; Chen, X.; Yuan, Q.; Wang, T.; Ji, H.; Papović, S.; Raleva, K.; Pan, F.; Yang, T.; Li, J. Effects of minor mechanical deformation on the lifetime and performance of commercial 21700 lithium-ion battery. J. Electrochem. Soc. 2022, 169, 060544. [Google Scholar] [CrossRef]
  40. Sahraei, E.; Gilaki, M.; Lynch, W.; Kirtley, J.; Soudbakhsh, D. Cycling results of mechanically damaged li-ion batteries. In Proceedings of the 2019 IEEE Electric Ship Technologies Symposium (ESTS), Washington, DC, USA, 14–16 August 2019; pp. 226–230. [Google Scholar] [CrossRef]
  41. ANSI/CAN/UL/ULC 2271; Batteries for Use in Light Electric Vehicle (LEV) Applications, UL 2271. Underwriters Laboratories: Northbrook, IL, USA, 7 September.
  42. Charmant, J. “Features,” Kinovea.org. [Online]. Available online: https://www.kinovea.org/features.html (accessed on 7 July 2025).
Figure 1. Study object (a) Citycoco Harley e-scooter; (b) 60 V–12 Ah battery module; (c) Li-ion cell LXD18650 20P3.
Batteries 11 00263 g001
Figure 2. Charging characteristics in LXD18650 Li-ion cell.
Batteries 11 00263 g002
Figure 3. Rate discharge test in LXD18650 Li-ion cell.
Batteries 11 00263 g003
Figure 4. Cycling test in LXD18650 Li-ion cell.
Batteries 11 00263 g004
Figure 5. Experiment design.
Batteries 11 00263 g005
Figure 6. Methodology for impact testing.
Batteries 11 00263 g006
Figure 7. The work area used in the shock test.
Batteries 11 00263 g007
Figure 8. Methodology for DUTs Assembly.
Batteries 11 00263 g008
Figure 9. Strain gauge rosette orientation.
Batteries 11 00263 g009
Figure 10. Impact platform used.
Batteries 11 00263 g010
Figure 11. Cycling test in LXD18650-20P3 cells.
Batteries 11 00263 g011
Figure 12. (a) Initial voltage; (b) charge voltage; (c) IR; (d) real capacity; and (e) SOH in LXD18650-20P3 cells.
Batteries 11 00263 g012
Figure 13. Comparative graph: velocity vs. time.
Batteries 11 00263 g013
Figure 14. Comparative graph: pulse acceleration vs. time.
Batteries 11 00263 g014
Figure 15. Voltage vs. Time.
Batteries 11 00263 g015
Figure 16. Current vs. Time.
Batteries 11 00263 g016
Figure 17. Power vs. Time.
Batteries 11 00263 g017
Figure 18. Strain-A vs. time.
Batteries 11 00263 g018
Figure 19. Strain-B vs. time.
Batteries 11 00263 g019
Figure 20. Strain-C vs. time.
Batteries 11 00263 g020
Table 1. Technical specifications: Citycoco Harley 2019 e-scooter.
ParameterValue
MotorizationBLDC Hub motor—1000 W
Energy storage systemTwo Li-ion battery modules 60 V–12 Ah
Mass80 kg
Maximum velocity40 km/h
Autonomy60 km
Load capacity200 kg
Brake systemFront and rear hydraulic disk brakes
Dimensions1.85 × 0.8 × 1 m
Table 2. Technical specifications: Hao Yang new energy® battery module 60 V–12 Ah.
ParameterValue
Nominal voltage60 V
Coulomb capacity12 Ah
Energy capacity720 Wh
Charge voltage67.2 V
Maximum charging current5 A
Maximum discharging current30 A
Dimensions200 × 165 × 70 mm
Production date20 December 2018
Table 3. Technical Specifications: LXD 18650-20P3 battery cell.
ParameterValue
Nominal voltage3.6 V
Coulomb capacity2 Ah
Energy capacity7.2 Wh
Charge voltage4.2 ± 0.05 V
Discharge voltage2.75 V
Nominal charging current0.25C (0.5 A)
Maximum charging current1C (2 A)
Nominal discharging current0.5 A
Maximum discharging current6 A
Mass43 ± 1 g
Internal resistance≤30 mΩ
Nominal charging temperature0–45 °C
Nominal discharging temperature−10–60 °C
Table 4. Measuring instruments used.
QuantityManufacturerInstrumentFunction
1Atorch®, Guangdong, ChinaDL24MP-FXElectronic battery tester: Voltage, current and temperature monitor, and capacity tester for module battery
1Nice-power®, Shenzhen, ChinaSPS-E305Adjustable power supply: Constant current and constant voltage battery charger
1MicroMeasurements®, Wendell, NC, USAD4 DAQ and C4A-06-G1350A-120-39P Strain gaugeGauge strain data acquisition system: Longitudinal and circumferential micro-strain cell
1Day Sensor®, Shenzhen, ChinaDY-920A DAQ and DYLF-102 Load cell Load cell data acquisition system
1UNI-T®, Guangdong, ChinaUTi-120MSmartphone thermal camera: External battery temperature monitor
1One Plus®, Shenzhen, China10 pro (Sony Sensor IMX789)High-speed recording: 720p–480 FPS
Table 5. DUT concept design.
ParameterValueConceptual Design
Configuration3s3pBatteries 11 00263 i001
Cells quantity9
Coulomb capacity6 Ah
Energy capacity64.8 Wh
Nominal voltage10.8 V
SOC 0–100%8.25–12.6 V
Nominal charging current1.5 A
Maximum charging current6 A
Nominal discharging current1.5 A
Maximum discharging current18 A
Mass0.387 kg
Table 6. DUT detailed design.
QuantityComponentDetailed Design
9LXD 18650-20P3 cellBatteries 11 00263 i002
18Polymeric support base
6Niquel connector sheet 60 mm
6Niquel connector sheet 40 mm
4Connector cable 24 AWG 50 mm
1BMS 3s
Table 7. Technical specifications: C4A-06-G1350A-120-39P.
ParameterValue
Resistance120 ± 0.9% Ω
Gauge factor1.92
Temperature range−50–80 °C
Sensitive rosette size5.1 × 5.1 mm
Table 8. Main components of the impact platform.
ComponentDescription
Protection structurePrismatic structure made of 1/2 × 1 1/2-inch aluminum slabs, covered on the outside by a 6 mm thick transparent polycarbonate plate as an insulating system for thermal and electrical protection.
IndenterSquare steel structure 270 mm long and 248 mm high. Made with 1 × 1/2-inch PTR profile by means of welded joints, and connected to 2 U-100 rails by means of 4 compatible forklifts with an effective travel of 2 m and powered by four rubber bungee cords. At the bottom, it has a 5 mm thick steel plate for impact against the impact base. Inside, there is a plate for holding the battery module.
Impact baseDonut-type load cell with a 5 mm thickness and a 100 mm square steel plate.
Table 9. Technical specifications: DYLF-102 Day Sensor® load cell.
ParameterValue
Capacity300 kg–2942 N
Operation temperature−20–160 °C
Excitation voltage5–15 VDC
Sensitivity2.0 mV/V
Output impedance700 Ω
Input impedance780 Ω
Insulation resistance2000 MΩ
Accuracy0.05%
Nonlinearity0.03%
Repeatability0.03%
Hysteresis0.03%
Test instrumentFluke® 8041
Table 10. Calculation of the elastic stiffness constant in the ropes.
Initial LengthFinal Length∆xK
1.0412 m1.1037 m0.0625 m313.92 N/m
Table 11. Force and energy calculated.
Total ForceTotal Energy
1039.67 N1649.78 J
Table 12. Charge–discharge characteristics in the SOH test.
ParameterValue
Charging methodCV–CC
Charging voltage4.2 V
Charging current1000 mA
Cut-off current20 mA
Discharge current1000 mA–CC
Cut-off voltage2.75 V
Number of cycles3
Room temperature25 °C
Relative humidity50%
Table 13. Initial conditions of mechanical shock test.
ParameterValue
DUT’s SOC100%
DUT’s current discharge1500 mA CC
Indenter height1.70 m
Cord elongation1.93 m
Room temperature25 °C
Relative humidity50%
Table 14. Impact velocity achieved in tests.
Test12345AverageVarianceConfidence Intervals (95%)
Impact velocity (m/s)6.896.596.766.746.896.770.0156.619–6.929
Table 15. Pulse acceleration achieved in tests.
Test12345AverageVarianceConfidence Intervals (95%)
G-force23.5321.7922.4922.1523.0622.610.4921.738–23.470
Pulse duration (ms)535454535453.60.352.92–54.28
Table 16. Impact force achieved in tests.
Test12345AverageVarianceConfidence Intervals (95%)
Impact force (N)128512681251139913981320.25253.71230.2–1410.2
Table 17. DUT’s temperature after shock tests.
Test12345
Internal temperature (°C)25.12524.924.425.3
External temperature (°C)28.528.328.328.228.5
Table 18. Strain measures achieved in tests.
Gauge’s Strain12345
εa (µε)−4−32−15−9−14
εb (µε)−112−148−114−57−378
εc (µε)−64−10−15−9−10
Table 19. Strain components in impact tests.
Strain Components12345
εx (µε)441068439354
εy (µε)−112−148−114−57−378
γxy (µε)60−2200−4
Table 20. Stress components in impact tests.
Stress Components12345
σx (MPa)2.38919.9814.656.4766.86
σy (MPa)−20.586−25.86−19.95−9.92−65.73
τxy (MPa)4.419−1.6100−0.29
Table 21. Principal stress in impact tests.
Principal Stress12345
σ1 (MPa)3.20920.3714.656.4766.86
σ2 (MPa)−21.406−26.25−19.95−9.92−65.73
θp (°)10.515−4.86000.06
τmax (MPa)12.30823.3117.38.19566.3
Table 22. Von Mises criterion calculated.
Failure Criterion12345
σVM (MPa)23.1840.1530.6314.36114.73
Disclaimer/Publisher’s Note: The statements, opinions and data contained in all publications are solely those of the individual author(s) and contributor(s) and not of MDPI and/or the editor(s). MDPI and/or the editor(s) disclaim responsibility for any injury to people or property resulting from any ideas, methods, instructions or products referred to in the content.

