Article

Investigating the Thermal Runaway Characteristics of the Prismatic Lithium Iron Phosphate Battery Under a Coupled Charge Rate and Ambient Temperature

1
Graduate Schools, Chinese People’s Police University, Langfang 065000, China
2
School of Rescue and Command, Chinese People’s Police University, Langfang 065000, China
3
Graduate Schools, Monash University, Subang Jaya 47500, Selangor Darul Ehsan, Malaysia
4
Emergency Rescue Technology Key Laboratory of Hebei Province, Langfang 065000, China
*
Author to whom correspondence should be addressed.
Batteries 2025, 11(7), 253; https://doi.org/10.3390/batteries11070253
Submission received: 11 May 2025 / Revised: 13 June 2025 / Accepted: 1 July 2025 / Published: 4 July 2025
(This article belongs to the Special Issue Thermal Management System for Lithium-Ion Batteries: 2nd Edition)

Abstract

Optimizing the charging rate is crucial for enhancing lithium iron phosphate (LFP) battery performance. The substantial heat generation during high C-rate charging poses a significant risk of thermal runaway, necessitating advanced thermal management strategies. This study systematically investigates the coupling mechanism between charging rates and ambient temperatures in overcharge-induced thermal runaway, filling the knowledge gaps associated with multi-indicator thermal management approaches. Through experiments on prismatic LFP cells across five operational conditions (1C/35 °C, 1.5C/5 °C, 1.5C/15 °C, 1.5C/25 °C, and 1.5C/35 °C), synchronized infrared thermography and electrochemical monitoring quantitatively characterize the thermal–electric coupling dynamics throughout overcharge-to-runaway transitions. The experimental findings reveal three key observations: (1) Charge rate and temperature have synergistic amplification effects on triggering thermal runaway. (2) Contrary to intuition, while low-current/high-temperature charging enhances safety versus high-current/high-temperature conditions, low-temperature/high-current charging triggers thermal runaway faster than high-temperature/high-current scenarios. (3) Staged multi-indicator lithium battery thermal runaway warning signals would be more accurate (first peaks > 0.5 °C/s temperature rise rate + >10 V/s voltage drop rate). These findings collectively demonstrate the imperative for next-generation battery management systems integrating real-time ambient temperature compensation with adaptive C-rate control, fundamentally advancing beyond conventional single-variable thermal regulation strategies. Intelligent adaptation is critical for mitigating thermal runaway risks in LFP battery operations.

1. Introduction

The global push for clean energy and sustainable development has propelled electric vehicles (EVs) as a mainstream green transportation solution [1,2]. Lithium-ion batteries, particularly lithium iron phosphate (LFP) variants [3], have become the primary power source for EVs and energy storage systems due to their extended cycle life [4], high energy density [5], and enhanced thermal stability [6]. However, persistent safety concerns regarding thermal runaway—triggered by mechanical impacts (e.g., crushing), thermal stress, or electrical faults (overcharging, short circuits)—continue to endanger lives and hinder widespread adoption of high-energy-density battery systems [7,8]. Understanding the fundamental mechanisms and critical influencing factors of thermal runaway remains essential for developing safe charging protocols, thereby preventing catastrophic failures like fires or explosions at their origin [9].

1.1. Related Work

Research into the thermal runaway characteristics of lithium-ion batteries began in the early 21st century. Early studies investigated short-circuit and overcharge behaviors in small-capacity LiCoO2/graphite-based cells, revealing that extreme overcharging induces cell rupture and localized temperatures exceeding lithium’s melting point, which triggers exothermic reactions and accelerates thermal runaway [10]. Concurrently, mechanical abuse conditions such as puncture-induced short circuits were identified to cause rapid localized heating, activating internal chemical reactions [4]. Calorimetric analyses further demonstrated a linear relationship between heat generation during overcharging and charging current, suggesting that effective heat dissipation through cooling systems could theoretically prevent thermal runaway under such conditions [11]. Subsequent reviews systematically summarized thermal runaway mechanisms under abuse scenarios, emphasizing chain reactions involving such mechanisms as material decomposition and internal short circuits, while proposing energy release diagrams to quantify reaction kinetics [9]. Comparative studies on lithium iron phosphate batteries revealed capacity-dependent thermal runaway behaviors [12]. And investigations explored low-temperature thermal runaway processes and internal exothermic reactions [13,14].
To enhance battery safety, research has focused on three main directions: mechanism elucidation [15,16], early-warning model development [17,18], and suppression strategies [19,20]. Electrochemical–thermal coupling models demonstrated that elevating electrolyte oxidation potentials and increasing thermal runaway initiation temperatures could improve overcharge tolerance [21]. Simultaneously, optimization of battery thermal management systems (BTMSs) was proposed to improve temperature uniformity in battery packs, thereby extending service life and mitigating thermal hazards. In suppression research, temperature control and voltage monitoring are prioritized. The core temperature control means to inhibit thermal runaway in lithium batteries include real-time monitoring of single cell temperature through the battery management system (BMS), setting the warning threshold (e.g., 50~60 °C), and triggering the current limitation protection [22]. Active/passive heat dissipation uses liquid cooling, air cooling, or high-thermal-conductivity materials (e.g., graphene), and rapid circuit cutoff at extreme high temperatures (e.g., 140 °C or above). Charging voltage control focuses on preventing overcharging: strictly limiting the charging cutoff voltage (e.g., LFP ≤ 3.65 V), and adopting CC-CV segmented charging algorithms to reduce the accumulation of polarization heat [23]. This involves dynamically adjusting the charging current and voltage thresholds in conjunction with the state of health of the battery (SOH), and realizing triple protection of voltage–temperature–capacity through the fuses, MOSFET hardware, and BMS software [24].
Current thermal runaway prevention systems for Li-ion batteries primarily emphasize single-factor regulation of intrinsic parameters (e.g., temperature, voltage) [25,26]. In temperature-dominant strategies, battery management systems (BMSs) monitor cell temperatures in real time while establishing graded response thresholds (e.g., 50 °C warning, 140 °C shutdown), supported by liquid/air cooling systems, for active thermal management [27]. However, these strategies inadequately address dynamic thermal interactions between ambient temperature fluctuations and heat dissipation efficiency; for instance, elevated ambient temperatures may intensify thermal exchange loads in liquid cooling systems, amplifying localized overheating risks. For voltage-linearization control, CC-CV charging algorithms restrict cutoff voltages (NMC ≤ 4.2 V, LFP ≤ 3.65 V) with state-of-health (SOH)-based dynamic current adjustments [28]. Nevertheless, voltage protection mechanisms, designed under standardized laboratory conditions, neglect quantitative evaluation of ambient temperature-induced nonlinear polarization voltage distortions [29,30]. Notably, fixed current thresholds persist despite accelerated lithium deposition at low temperatures, potentially inducing dendrite penetration through separators [31]. Critical gaps persist in understanding thermal runaway evolution under ambient temperature-charging current coupling effects, necessitating urgent transition from single-parameter threshold frameworks to dual-factor coupled models (ambient temperature vs. charging current) to advance BMS algorithm development.
In this study, we conducted overload charging experiments at different charging rates on LFP batteries at different ambient temperatures. The temperature peak, voltage peak, temperature and voltage change trend, and mass loss, after the LFP battery thermal runaway occurred, were used to determine the severity of the thermal runaway. The main purpose is to explore factors that can reduce or delay the thermal runaway of LFP batteries. This study proposes a risk assessment method for LFP battery thermal runaway for the battery detection system, and is expected to avoid the occurrence of battery thermal runaway events.

1.2. Innovative Contributions

This study makes the following original contributions to the field of lithium-ion battery safety research:
(1) Multi-Stress Experimental Framework
A systematic overcharge protocol was established, combining extreme temperature gradients (5 °C to 35 °C) with varying charging rates (0.5–3C). This dual-stress methodology quantifies synergistic effects of thermal and electrochemical abuse conditions, revealing previously undocumented thresholds where capacity-dependent thermal stability variation exists [32].
(2) Predictive Severity Quantification
A four-dimensional thermal runaway severity index was developed, integrating peak temperature, critical voltage thresholds, dynamic response gradients, and post-event mass loss [33,34,35].
This multi-parameter risk metric bridges the critical gap between exploring the thermal runaway mitigation strategy and early warning for LFP batteries, providing actionable thresholds for battery safety management systems.

1.3. Organization

The structure of this paper is organized as follows. In Section 2, a theoretical analysis of overcharge-induced thermal runaway in LFP batteries is presented. Section 3 illustrates the experimental design for conducting overcharging thermal runaway. In Section 4, the experimental results are discussed and analyzed. Finally, in Section 5, the research conclusions and prospects are presented.

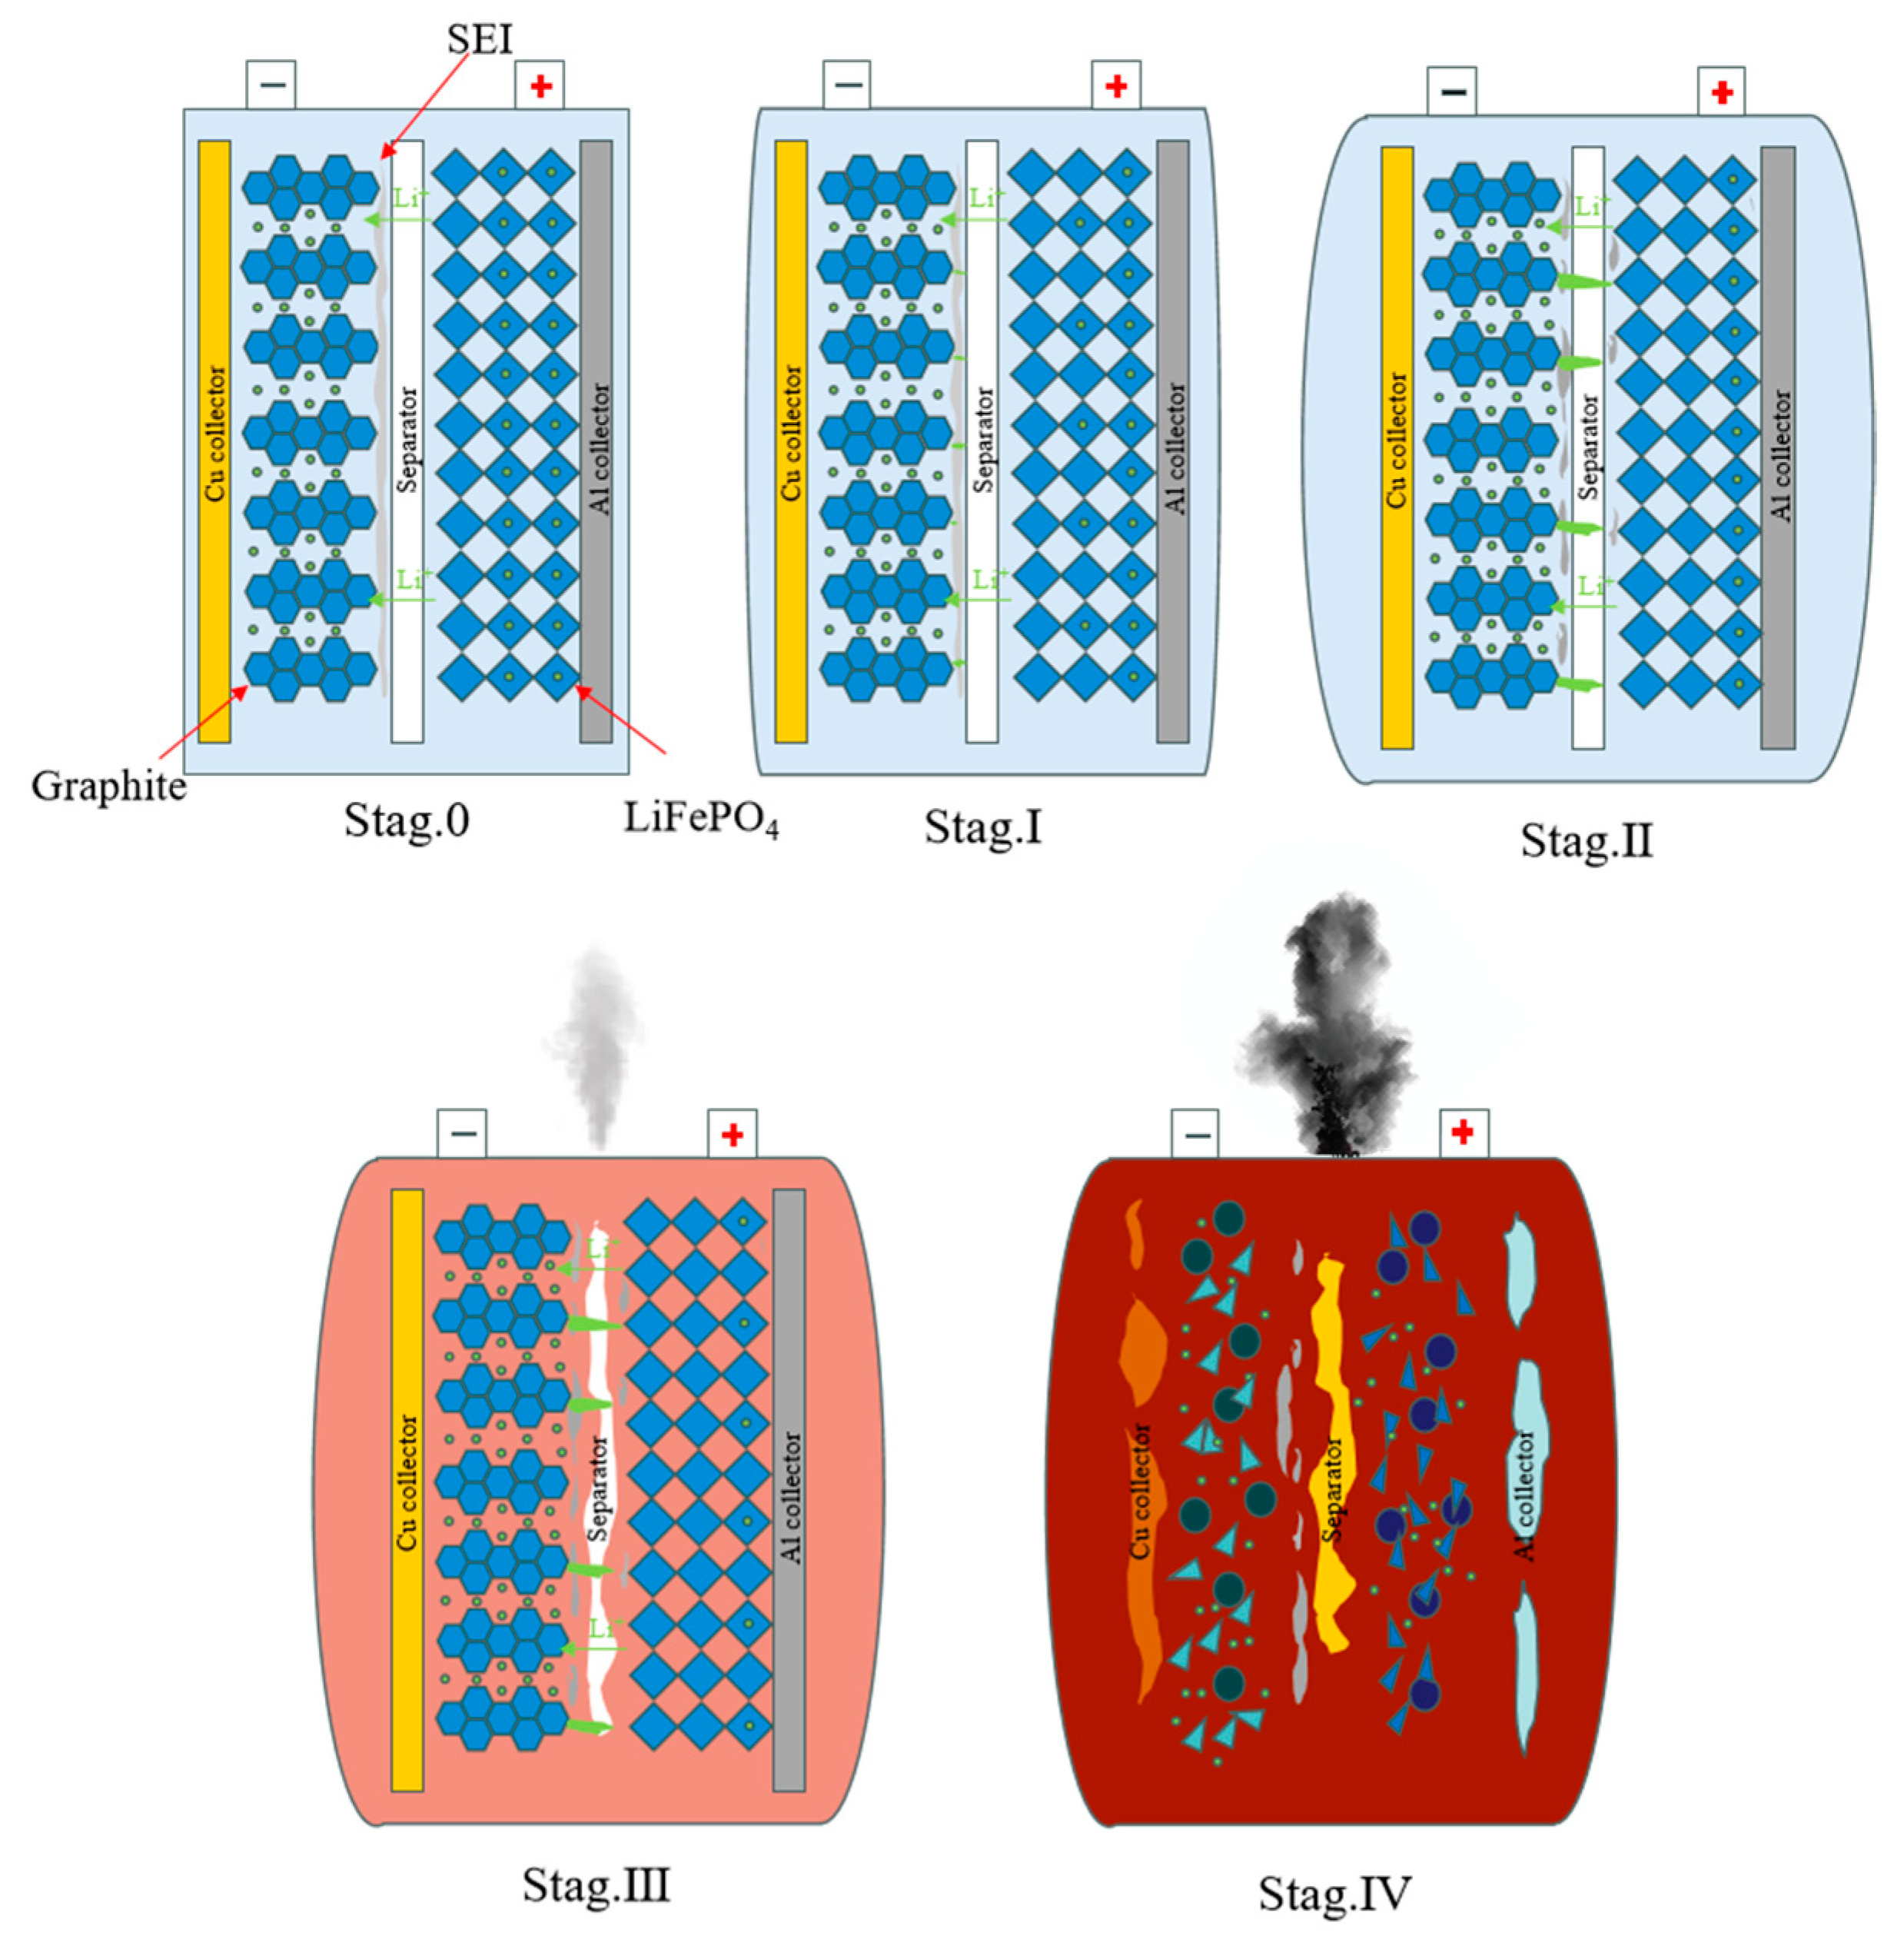
2. Theoretical Analysis of Overcharge-Induced Thermal Runaway in LFP Batteries

Under overcharge conditions, the progression severity of lithium battery thermal runaway exhibits cyclic dependence on thermal variations. Building upon a systematic evaluation of existing thermal runaway mechanisms in lithium-ion systems, this study establishes a four-stage theoretical framework to elucidate the temperature-driven evolution of thermal runaway in LFP batteries [36]. The proposed analytical model delineates the phase-transition dynamics from initial thermal accumulation to final failure propagation, with the corresponding mechanistic interactions schematically illustrated in Figure 1. Due to the secrecy of the battery manufacturing technology of the battery manufacturer, it is considered in this section that the lithium salt component in the electrolyte is mainly lithium hexafluorophosphate (LiPF6), and the solvent is mainly ethylene carbonate (EC).

2.1. Stage I: Incipient Thermal Accumulation (Initially–80 °C)

Despite full state-of-charge conditions, residual electrochemical redundancy persists in electrodes. Overcharge beyond rated capacity initiates lithium dendrite nucleation at the graphite anode. Progressive temperature rise (0.2 °C /min) accompanies solid electrolyte interphase (SEI) film decomposition starting at 80 °C (Equation (1)) [37], primarily driven by ohmic heating from internal resistance.
R O C O 2 L i L i 2 C O 3 + C O 2 + H C
This phase manifests as (1) voltage plateau formation with <5% fluctuation; (2) initial gas generation (H2, CH4) [38] causing mild cell swelling [39].

2.2. Stage II: Electrochemical Interface Degradation (90–120 °C)

Continued decomposition of the solid electrolyte interphase (SEI) occurs on the graphite anode as temperatures escalate. This SEI breakdown exposes pristine graphite to direct electrolyte contact, simultaneously releasing organic byproducts and gaseous species (Equations (1)–(3)) that cause severe cell swelling.
L i P F 6 L i F + P F 5
P F 5 + H 2 O 2 H F + P O F 3
This phase is characterized by the following: (1) voltage plateau stabilization (ΔV < 0.05 V) signaling lithium over-deintercalation at the cathode; (2) dominant heat sources: ohmic losses (≈60%) + electrolyte decomposition. This indicates that the cathode and anode electrochemical reactions are extremely unbalanced, with a significant release of energy, which is one of the critical signs of thermal runaway.

2.3. Stage III: Thermal Escalation (120–150 °C)

Partial electrolyte solvents (ethylene carbonate) undergo exothermic decomposition (Equation (4)), releasing flammable gases such as C2H4. The internal pressure rises to approach the critical threshold of the pressure relief valve, initiating gas venting. Concurrently, accelerated temperature increase triggers separator melt shrinkage, potentially causing direct anode–cathode contact (short circuit) and sustained gas leakage through the valve (observed as white smoke emission) [40].
C 3 H 4 O 3 E C C O 2 + C 2 H 4
This phase manifests as follows: (1) temperature ramp rate: 2–3 °C/s; (2) dominant gas species: C2H4 (>60% molar fraction).

2.4. Stage IV: Critical Thermal Runaway (150–300 °C)

Overcharging causes damage to the internal structure of the battery, and the battery enters a state of deep charging. At the same time, with a sharp rise in internal pressure, the voltage rapidly rises to a peak and then plummets. The heat after the short circuit causes the temperature to rise, triggering an autocatalytic chain reaction, inducing large-scale heat release through electrolyte decomposition, which further intensifies reaction kinetics. Specifically, at approximately 200 °C, the exothermic reaction between the negative electrode and the electrolyte generates substantial thermal energy, accelerating reaction rates under rising temperatures (Equation (5)). The system ultimately transitions into a complete thermal runaway state [41].
C + E C L i x C + C O + C 2 H 4
This phase manifests as follows: (1) voltage spike–plummet cycle (Vmax > 4.8 V → <2 V in 15 s); (2) thermal runaway propagation rate: 8–12 °C/s.

3. Experimental Design

3.1. Battery Sample Parameters

The experiment used Guoxuan 25 Ah prismatic lithium-ion cells, with lithium iron phosphate (LFP) as the cathode and graphite as the anode material. Key battery specifications are provided in Table 1. To ensure experimental stability and repeatability, all cells underwent three preconditioning charge–discharge cycles before testing. These cycles included constant current–constant voltage (CC-CV) charging and constant current (CC) discharging protocols. In CC mode, the cells were discharged to 2.3 V at 0.5C (12.5 A). Subsequently, a CC-CV protocol was applied with a voltage limit of 3.60 V and a 0.5C (12.5 A) current until the current decayed below 0.5 A, followed by a 30 s holding period.

3.2. Experimental Device

The experiment was conducted using the platform shown in Figure 2. A ZTE 2400 (ZXD2400-TFT32-Produced by ZTE Corporation in Foshan, China) programmable power supply provided constant current charging across multiple C-rates with a specified regulation accuracy of ±0.01 V (voltage) and ±0.01 A (current). Based on the unique properties of battery materials, testing was conducted within a temperature-controlled chamber (with a temperature regulation accuracy of ±1 °C) to maintain ambient temperature stability while minimizing the thermal gradient between the environment and the battery. For high-temperature test groups, heating pads (with a temperature regulation accuracy of ±0.1 °C) were affixed to the battery surfaces to reduce the temperature differential between the batteries and their surroundings. The temperature differential between the battery and its ambient environment was determined using integrated temperature sensors within the climate chamber and digital temperature readouts from the heating pads. Two 1 mm diameter K-type thermocouples were positioned at the pressure relief valve base and geometric center of the battery surface, with temperature data averaged accordingly. The thermocouple exhibits an operational temperature range from −200 °C to 1300 °C with a measurement accuracy of ±1 °C. Synchronized temperature and voltage signals were recorded at a 1 Hz sampling frequency using a Hongrun K728 (Produced by Hongrun Company in Fujian, China) data logger to ensure temporal alignment. The temperature and voltage signals acquired by the data logger were recorded with respective accuracies of ±1 °C and ±0.01 V. Visual documentation was captured with a 1920 × 1080/30 fps industrial camera, while a Hikvision P20MAX V2 (Produced by Hikvision in Shenzhen, China) infrared thermal imager recorded the evolution of the temperature field. Pre-/post-test mass measurements were performed with a 0.1 g precision balance (2 kg capacity).

3.3. Experimental Plan

To investigate the multifactorial influences on thermal runaway behavior and mechanisms in overcharged LFP batteries, five experimental matrices were designed. The configuration comprised four temperature gradients at a fixed charging rate and multiple charging rates at the peak temperature condition, as detailed in Table 2. Based on the experimental protocol, connect the battery to the data acquisition device first, then place it inside the constant-temperature chamber. For the high-temperature test group, heat the battery using a heating pad. One hour prior to the start of the experiment, activate the constant-temperature chamber and set its temperature; 30 min before the experiment starts, activate the heating pad and set its temperature. Configure the parameters of the overload charging power supply according to the requirements of each test group. Commence the experiment when the difference between the ambient temperature of the constant-temperature chamber and the battery temperature remains below 0.5 degrees Celsius for 30 consecutive seconds.

4. Experimental Analysis and Discussion

4.1. Analysis of Battery State Changes

4.1.1. Changes in Shape and Surface

Key changing phenomena in shape and surface observed across five experimental groups are shown in Figure 3. Post-test analysis reveals that batteries in the 1C/35 °C and 1.5C/5 °C groups exhibited only mild bulging with limited gas venting through pressure relief valves, showing no severe thermal runaway. In contrast, the remaining three groups underwent significant morphological changes following intense thermal runaway. Comparative analysis demonstrates that the 1.5C/35 °C and 1.5C/15 °C groups experienced more extensive melting of surface polymer insulation under sustained high temperatures, exposing metallic casings. The 1.5C/25 °C battery catastrophically ruptured after valve activation due to excessive internal pressure from thermal runaway.
Temporal comparisons between the 1C/35 °C and 1.5C/35 °C groups reveal that identical ambient temperatures but differing C-rates produced similar deformation patterns at distinct onset times. Notably, all four 1.5C groups with varied ambient temperatures demonstrated comparable deformation timelines.
Based on the above analysis, the key observations that can be drawn mainly include the following:
  • Early-stage overcharging-induced deformation showed no ambient temperature dependence.
  • Higher C-rates accelerated deformation onset, though deformation alone did not necessarily trigger severe thermal runaway.
  • With the exception of Group 1.5C/5 °C (where thermal runaway may have been suppressed by low-temperature effects, as analyzed later), the severity of thermal runaway showed a positive correlation with ambient temperature across experimental groups.

4.1.2. Changes in Battery Mass

Pre- and post-test mass and thickness data for all five experimental groups are presented in Table 3. Notably, the 1.5C/25 °C group underwent catastrophic rupture, while the two severe thermal runaway groups exhibited minimal mass discrepancies (0.3 g) despite showing ~125 g reductions compared to initial values. Crucially, despite differing ambient temperatures, these thermal runaway groups demonstrated nearly identical mass losses, indicating that ambient conditions influence thermal runaway intensity but not the underlying chain reactions. These self-terminating reactions ceased upon reactant depletion, resulting in consistent final mass reductions. Non-thermal-runaway groups displayed ~50 g mass losses—70 g less than thermal runaway groups—confirming that overcharge-induced heating still triggered initial electrolyte vaporization and partial reactions without full runaway.
Lithium battery mass analysis shows that the difference in energy release between complete thermal runaway and thermal runaway interruption is closely related to the mass, so it is necessary to carry out thermal runaway characterization of lithium batteries in stages. Combined with cross-condition mass/thickness correlations, this validates the earlier conclusion from Section 4.1.1: Different ambient temperature changes will not affect the shape change of the lithium battery in the case of thermal runaway.
Given that the batteries were commercially sourced products, inherent manufacturing variations resulted in minor inter-cell mass differences within the experimental samples. The initial pre-experiment masses of battery specimens ranged from 625.0 g to 635.0 g (630.0 g ± 5.0 g), where the ±5.0 g deviation reflects intrinsic sample-to-sample variability—not measurement uncertainty of the weighing apparatus. The post-experiment masses presented in Table 3 represent the mean values derived from triplicate gravimetric measurements per individual battery unit.

4.1.3. Analysis of Battery Thermal Propagation

Since the test group with severe thermal runaway had similar states at different time points, infrared thermography in the 1.5C/15 °C group was selected for analysis in this section. The thermal propagation during complete thermal runaway (TR) in LFP batteries is illustrated in Figure 4. Figure 4a,b reveal Stage I (the initial overcharging phase), where proximity to the electrodes shows peak temperatures due to charging rate effects. Figure 4c,d demonstrate Stage II progression: rising SOC and temperature trigger LiPF6 electrolyte decomposition, accompanied by heat accumulation zone relocation. Figure 4d,e document Stage III characteristics, showing bottom-to-top thermal propagation that correlates with observed cell expansion. Combined with morphological deformation patterns, Figure 4f captures diffuse venting from the upper region, confirming that Stage III temperature escalation accelerates electrolyte decomposition. This creates self-reinforcing expansion until internal gas pressure exceeds the relief valve’s safety threshold. Figure 4g depicts Stage IV critical behavior marked by high-pressure jet emission from the safety valve. This final phase occurs when sustained chain reactions reach critical temperature thresholds, resulting in full valve rupture [42].
This thermal evolution analysis validates the proposed four-stage TR phase division in LFP batteries. The spatially resolved thermal profiling establishes a visual framework for subsequent stage-specific TR characteristic differentiation, ensuring analytical precision in mechanism studies.

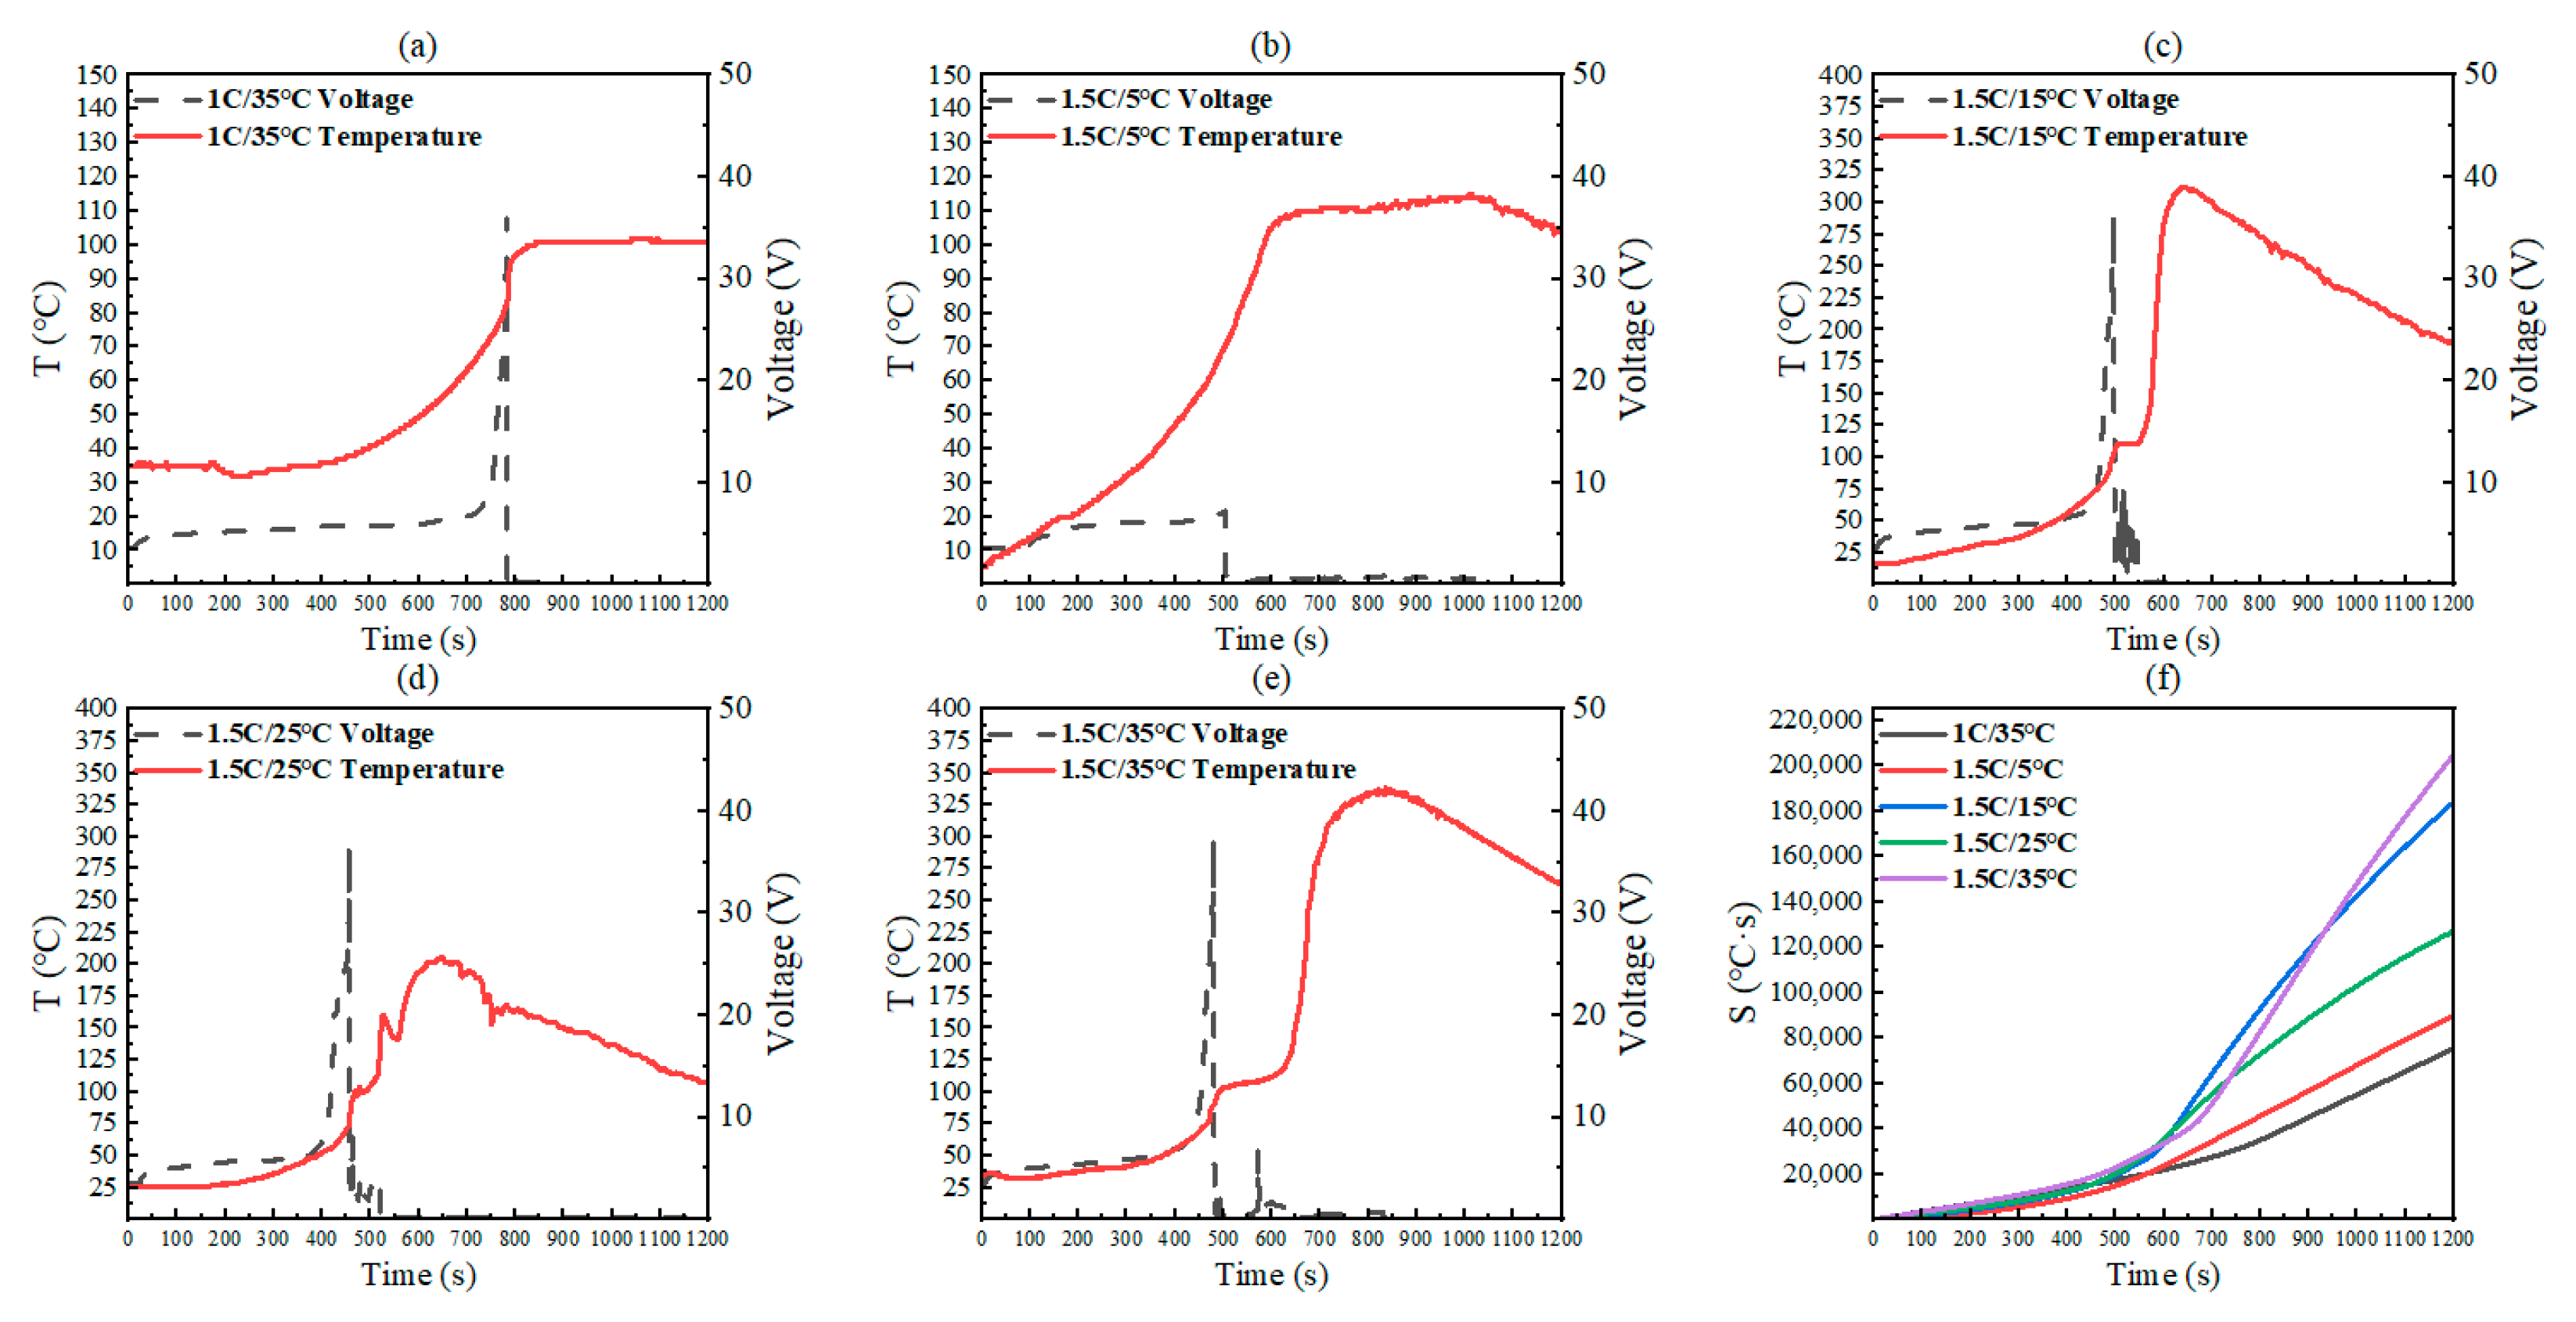
4.2. Analysis of Temperature and Voltage

The voltage and temperature changes of LFP batteries during overcharge–thermal runaway at 1.5C and 1C at different ambient temperatures are shown in Figure 5. Figure 5a–e are the temperature and voltage change curves over time for 1C/35 °C, 1.5C/5 °C, 1.5C/15 °C, 1.5C/25 °C, and 1.5C/35 °C, respectively. Figure 5a,b did not experience severe thermal runaway, while Figure 5c–e all experienced severe thermal runaway at an overcharge current of 1.5C. Figure 5f shows the integral of temperature and time under five operating conditions.

4.2.1. Changes in Complete Thermal Runaway Group

Temperature profiles of the 1.5C-rate test groups under varying ambient conditions are shown in Figure 5b–e. Comparative analysis of panels (c)–(e) reveals that higher ambient temperatures correlate with slower initial temperature progression during early-stage overcharging. This aligns with Stage I thermal runaway behavior, where reduced internal resistance at elevated temperatures diminishes Joule heating effects in high-ambient-temperature groups. Conversely, lower ambient temperatures intensify Joule heating (due to higher internal resistance), prioritizing thermal energy accumulation over electrochemical energy conversion. Notably, the 1.5C/35 °C group reached a peak temperature of 338 °C—26 °C higher than the 15 °C group.
All three severe thermal runaway groups exhibited post-voltage-plummet stabilization (0–10 V range) preceding abrupt temperature escalation. During this transitional phase, continuous energy input enabled decomposition-dominated heat generation. Subsequent separator melt/shrinkage triggered direct electrode contact, enabling rapid internal energy release that propelled the system into a catastrophic thermal runaway.
Peak temperature and voltage comparisons confirm ambient temperature’s positive correlation with thermal runaway severity: higher initial ambient temperatures yield greater peak temperatures and energy release magnitudes. This validates the critical role of ambient temperature in amplifying thermal runaway intensity during overcharge initiation.

4.2.2. Changes in Thermal Runaway Interruption Group

In Figure 5a, the 1C/35 °C group stabilized at 102 °C. A transient temperature surge (~780 s) with concurrent voltage spike indicated incipient Stage II transition. However, the low C-rate limited ohmic heating effects (primary early-stage mechanism), resulting in only 85 °C during voltage collapse. Though short-circuit-induced heating caused temporary temperature rise, insufficient energy accumulation prevented entry into Stage III, enabling eventual thermal equilibrium.
Figure 5b demonstrates that the 1.5C/5 °C group plateaued at 115 °C by 600 s without voltage surges. Cryogenic conditions increased electrolyte viscosity, inhibiting lithium dendrite growth while diverting overcharge energy to a gradual temperature increase. Low ambient temperature elevated internal resistance, further converting electrical energy to heat rather than sustaining chain reactions. Insufficient Joule heating from intermittent short circuits confined thermal runaway to Stage II.
Under identical durations, lithium batteries under 1C/35 °C conditions exhibit significantly lower thermal runaway energy than those under 1.5C/35 °C. Temperature integral calculations (Figure 5f) [27] comparing thermal energy accumulation are as follows:
k = Q 1 Q 1.5 = 0 t T 1 0 t T 1.5 = 70,000 200,000 = 35 %
Thus, reducing the charging current by 0.5C suppresses approximately 65% of lithium battery thermal runaway energy.
The comparative analysis identifies two interruption mechanisms:
Insufficient peak temperatures from slow C-rates (gentle early-stage heating) or environmental heat dissipation prevent reaction sustainability.
Cryogenic effects increase electrolyte viscosity/internal resistance, redirecting energy to temperature rise rather than decomposition.
While the C-rate primarily governs thermal runaway initiation severity, ambient temperature critically modulates reaction sustainability. Both low C-rates and low temperatures inhibit thermal runaway through distinct mechanisms—by either limiting peak temperatures or disrupting reaction pathways—ultimately arresting chain reactions.

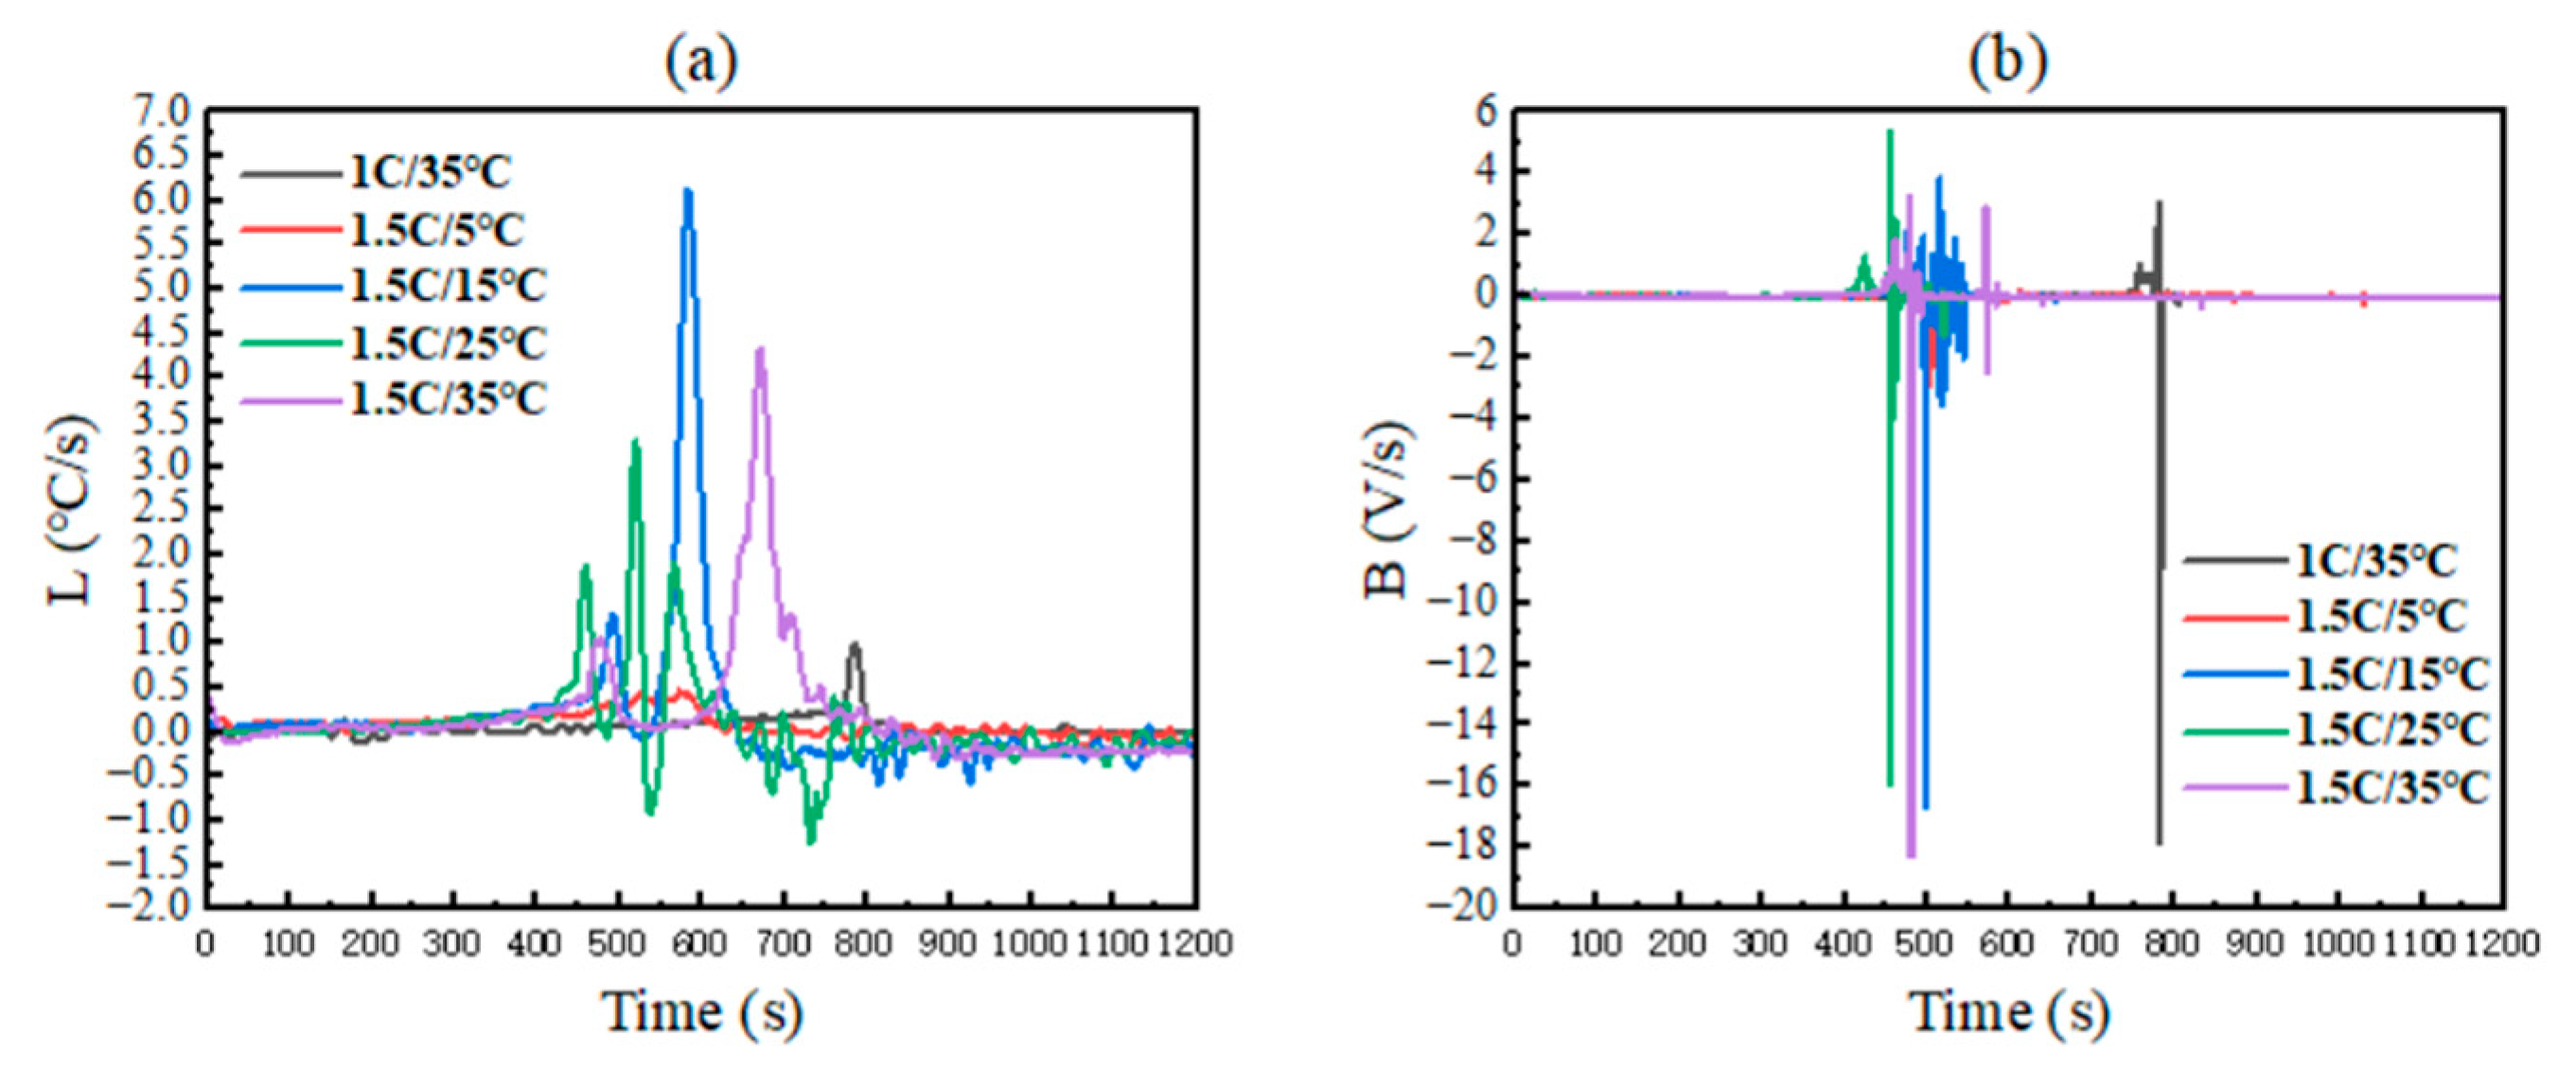
4.2.3. Change Rates of Temperature and Voltage

Temperature–time and voltage–time differential curves for all five test groups are presented in Figure 6a,b. Panel (a) reveals that severe thermal runaway groups exhibited heating rates exceeding 2 °C/s during runaway phases, while non-severe groups showed maximum rates below 1.5 °C/s. Consequently, a heating rate exceeding 2 °C/s can be established as the diagnostic threshold for severe thermal runaway (versus conventional thermal runaway), but it cannot serve as the initial warning trigger for lithium battery thermal runaway. To clarify the incipient warning signal, we theoretically analyzed charging rate effects on temperature rise kinetics. Incorporating C-rates into the dependent variable system acknowledges their critical impact on energy accumulation velocity and consequent thermal runaway initiation divergence. Among the five test groups, only Group 1 used 1C charging. Applying the energy formulation E = PT = V × I × T (with identical supply voltages), charging current emerged as the primary factor governing energy accumulation. Theoretical comparisons indicate 1C-charged batteries require 1.5 times longer energy accumulation duration than 1.5C-charged counterparts. Per the timing measurements in Figure 6, thermal runaway onset at 800 s for 1C charging corresponds to ~500 s for 1.5C charging—aligning with the first peak (not the second peak at ~700 s) in the purple curve. Hence, the initial temperature inflection peak provides superior warning accuracy. All five experiments distinctly exhibit first peaks (≈0.5 °C/s < L < 2 °C/s) and second peaks (≈L > 2 °C/s). Therefore, we designate the first peak (L > 0.5 °C/s) as the temperature-based early-warning indicator for incipient thermal runaway, and the second peak (≈L > 2 °C/s) as the diagnostic indicator for severe thermal runaway.
Notably, the duration of accelerated heating correlated positively with ambient temperature: the 1.5C/35 °C group displayed the longest heating window (600–770 s, Δt = 170 s), followed by the 25 °C and 15 °C groups. This confirms that under fixed ambient temperatures, higher C-rates intensify thermal accumulation and advance the onset of thermal runaway. Conversely, at fixed C-rates, elevated ambient temperatures also exacerbate thermal accumulation but paradoxically delay the timing of thermal runaway initiation. Experimental results confirm that high-temperature/low-current charging demonstrates greater safety compared to high-temperature/high-current conditions. However, contrary to conventional intuition, low-temperature/high-current charging accelerates thermal runaway progression more rapidly than high-temperature/high-current scenarios.
Panel (b) demonstrates that severe thermal runaway groups exhibited voltage collapse rates > 10 V/s, contrasting sharply with the 1.5C/5 °C group’s maximum rate of 2.9 V/s. The 1C/35 °C group, despite experiencing thermal runaway interruption via environmental heat dissipation, still showed a >10 V/s voltage drop—distinct from the 1.5C/5 °C interruption mechanism.
Compared with the above analysis, the following can be found:
Contrary to intuition, while high-temperature/low-current charging enhances safety versus high-current/high-temperature conditions, low-temperature/high-current charging triggers thermal runaway faster than high-current/high-temperature scenarios.
Voltage drop rates >10 V/s alone cannot guarantee severe thermal runaway, which explains the pathway-dependent interruptions observed in Section 4.2.
Dual thresholds (>0.5 °C/s temperature rise rate + >10 V/s voltage drop rate) provide more reliable thermal runaway warnings than single-parameter criteria.
This analysis systematically links dynamic electrical–thermal behavior to ultimate thermal runaway severity, validating the necessity of multi-parameter monitoring for failure prediction.

5. Conclusions

This study systematically investigated the thermal runaway behavior of prismatic lithium iron phosphate (LFP) batteries under coupled C-rate and ambient temperature conditions. Through synchronized measurements of surface deformation, mass loss, temperature evolution, and voltage dynamics, a four-stage thermal runaway progression model was proposed and experimentally validated. Based on these findings, a multi-indicator thermal runaway warning system for LFP batteries was developed to quantitatively optimize the traditional single-factor thermal runaway warning strategy.
(1) Charge rate and ambient temperature exert synergistic amplification effects on triggering thermal runaway. The synergistic effect of high charging rate and high temperature significantly intensifies the severity of thermal runaway. Compared with the low-temperature high-rate group and the high-temperature low-multiplier group, the thermal runaway of the high-charge-multiplier high-temperature group reaches higher peak temperatures, resulting in greater mass loss. The coupling effect of temperature and charge rate on reaction kinetics is emphasized.
(2) Charge rate and ambient temperature influence thermal runaway via distinct mechanisms. The charge rate has a greater impact on the intensity of energy release during thermal runaway in LFP batteries, and experiments show that at a fixed ambient temperature, a higher charge rate will exacerbate the thermal accumulation in a short period of time, and trigger the thermal runaway in advance of the time. Ambient temperature has a more significant effect on the total energy release during thermal runaway in LFP batteries, and a low-temperature environment (e.g., 5 °C) significantly inhibits the thermal runaway process; the mechanism lies in the increase in electrolyte viscosity under low temperature to inhibit the rapid growth of lithium dendrites and the risk of diaphragm piercing, and at the same time reduces the kinetic rate of the SEI membrane decomposition and the reaction of the electrolyte.
(3) Stage-based multi-indicator warning signals improve LFP battery thermal runaway early-warning precision. Within the 80–120 °C range (Stage II), gas release and voltage fluctuations serve as precursors to interface degradation. In Stage III, a temperature ramp rate > 0.5 °C/s (first peaks) and a voltage drop > 10 mV/s jointly signal imminent thermal runaway. These features enable the development of multi-dimensional, real-time monitoring strategies.
The research results provide a theoretical basis for the optimization of electric vehicle battery management systems (BMSs). It is recommended to appropriately increase the charging rate in low-temperature environments and reduce the charging rate in high-temperature environments to balance efficiency and safety. Future battery management systems (BMSs) should integrate temperature gradient monitoring, gas evolution detection, and real-time TRSI calculation to achieve intelligent, multi-parameter thermal risk control.

Author Contributions

J.S.: conceptualization, methodology, writing—review and editing. J.T.: investigation, writing—original draft. L.K.: supervision. Z.W.: funding acquisition. F.X.: writing—review and editing. X.D.: formal analysis, writing—review and editing. All authors have read and agreed to the published version of the manuscript.

Funding

The authors gratefully acknowledge that this research was funded by the Science Research Project of Hebei Education Department (Grant No. QN2025154).

Data Availability Statement

The original contributions presented in the study are included in the article, further inquiries can be directed to the corresponding author.

Conflicts of Interest

The authors declare no conflict of interest.

References

  1. Feng, X.; He, X.; Ouyang, M.; Wang, L.; Lu, L.; Ren, D.; Santhanagopalan, S. A Coupled Electrochemical-Thermal Failure Model for Predicting the Thermal Runaway Behavior of Lithium-Ion Batteries. J. Electrochem. Soc. 2018, 165, A3748. [Google Scholar] [CrossRef]
  2. Wang, Q.; Jiang, B.; Li, B.; Yan, Y. A Critical Review of Thermal Management Models and Solutions of Lithium-Ion Batteries for the Development of Pure Electric Vehicles. Renew. Sustain. Energy Rev. 2016, 64, 106–128. [Google Scholar] [CrossRef]
  3. Qasem, N.A.A.; Abdulrahman, G.A.Q. A Recent Comprehensive Review of Fuel Cells: History, Types, and Applications. Int. J. Energy Res. 2024, 2024, 7271748. [Google Scholar] [CrossRef]
  4. Chen, Y.; Kang, Y.; Zhao, Y.; Wang, L.; Liu, J.; Li, Y.; Liang, Z.; He, X.; Li, X.; Tavajohi, N.; et al. A Review of Lithium-Ion Battery Safety Concerns: The Issues, Strategies, and Testing Standards. J. Energy Chem. 2021, 59, 83–99. [Google Scholar] [CrossRef]
  5. Spotnitz, R.; Franklin, J. Abuse Behavior of High-Power, Lithium-Ion Cells. J. Power Sources 2003, 113, 81–100. [Google Scholar] [CrossRef]
  6. Larsson, F.; Mellander, B.-E. Abuse by External Heating, Overcharge and Short Circuiting of Commercial Lithium-Ion Battery Cells. J. Electrochem. Soc. 2014, 161, A1611. [Google Scholar] [CrossRef]
  7. Zhu, X.; Wang, Z.; Wang, Y.; Wang, H.; Wang, C.; Tong, L.; Yi, M. Overcharge Investigation of Large Format Lithium-Ion Pouch Cells with Li(Ni0.6Co0.2Mn0.2)O2 Cathode for Electric Vehicles: Thermal Runaway Features and Safety Management Method. Energy 2019, 169, 868–880. [Google Scholar] [CrossRef]
  8. Kumar, S.; Kim, H.-J. Recent Advances in Early Warning Methods and Prediction of Thermal Runaway Events in Li-Ion Batteries. J. Ind. Eng. Chem. 2025, 145, 63–74. [Google Scholar] [CrossRef]
  9. Feng, X.; Ouyang, M.; Liu, X.; Lu, L.; Xia, Y.; He, X. Thermal Runaway Mechanism of Lithium Ion Battery for Electric Vehicles: A Review. Energy Storage Mater. 2018, 10, 246–267. [Google Scholar] [CrossRef]
  10. Leising, R.A.; Palazzo, M.J.; Takeuchi, E.S.; Takeuchi, K.J. Abuse Testing of Lithium-Ion Batteries: Characterization of the Overcharge Reaction of LiCoO2/Graphite Cells. J. Electrochem. Soc. 2001, 148, A838. [Google Scholar] [CrossRef]
  11. Saito, Y.; Takano, K.; Negishi, A. Thermal Behaviors of Lithium-Ion Cells during Overcharge. J. Power Sources 2001, 97–98, 693–696. [Google Scholar] [CrossRef]
  12. Kang, R.; Jia, C.; Zhao, J.; Zhao, L.; Zhang, J. Effects of Capacity on the Thermal Runaway and Gas Venting Behaviors of Large-Format Lithium Iron Phosphate Batteries Induced by Overcharge. J. Energy Storage 2024, 87, 111523. [Google Scholar] [CrossRef]
  13. Meng, D.; Wang, X.; Chen, M.; Wang, J. Effects of Environmental Temperature on the Thermal Runaway of Lithium-Ion Batteries during Charging Process. J. Loss Prev. Process Ind. 2023, 83, 105084. [Google Scholar] [CrossRef]
  14. An, C.; Zhai, J.; Luo, Z.; Lei, Z. Numerical Study on Thermal Runaway of LFP Batteries Triggered by Low Temperature Heating. Fire Technol. 2024, 60, 3927–3947. [Google Scholar] [CrossRef]
  15. Santhanagopalan, S.; Ramadass, P.; Zhang, J. (Zhengming) Analysis of Internal Short-Circuit in a Lithium Ion Cell. J. Power Sources 2009, 194, 550–557. [Google Scholar] [CrossRef]
  16. Ouyang, D.; Chung, Y.-H.; Liu, J.; Bai, J.; Zhou, Y.; Chen, S.; Wang, Z.; Shu, C.-M. Characteristics and Mechanisms of as Well as Evaluation Methods and Countermeasures for Thermal Runaway Propagation in Lithium-Ion Batteries. Prog. Energy Combust. Sci. 2025, 108, 101209. [Google Scholar] [CrossRef]
  17. Ding, S.; Dong, C.; Zhao, T.; Koh, L.; Bai, X.; Luo, J. A Meta-Learning Based Multimodal Neural Network for Multistep Ahead Battery Thermal Runaway Forecasting. IEEE Trans. Ind. Inform. 2021, 17, 4503–4511. [Google Scholar] [CrossRef]
  18. Feng, X.; Wong, S.K.; Chen, T.; Ouyang, M. An Automatic Identification Method of Thermal Physical Parameter for Lithium-Ion Batteries Suffering from Thermal Runaway. J. Energy Storage 2024, 83, 110358. [Google Scholar] [CrossRef]
  19. Ren, D.; Liu, X.; Feng, X.; Lu, L.; Ouyang, M.; Li, J.; He, X. Model-Based Thermal Runaway Prediction of Lithium-Ion Batteries from Kinetics Analysis of Cell Components. Appl. Energy 2018, 228, 633–644. [Google Scholar] [CrossRef]
  20. Tang, Z.; Ji, Y.; Yu, P.; Cheng, J. Investigation on the Thermal Management Performance of a Non-Contact Flow Boiling Cooling System for Prismatic Batteries. J. Energy Storage 2023, 66, 107499. [Google Scholar] [CrossRef]
  21. Ren, D.; Feng, X.; Lu, L.; Ouyang, M.; Zheng, S.; Li, J.; He, X. An Electrochemical-Thermal Coupled Overcharge-to-Thermal-Runaway Model for Lithium Ion Battery. J. Power Sources 2017, 364, 328–340. [Google Scholar] [CrossRef]
  22. Rao, H.; Huang, Z.; Zhang, H.; Xiao, S. Study of Fire Tests and Fire Safety Measures on Lithiumion Battery Used on Ships. In Proceedings of the 2015 International Conference on Transportation Information and Safety (ICTIS), Wuhan, China, 25–28 June 2015; pp. 865–870. [Google Scholar] [CrossRef]
  23. Wang, Q.; Shao, G.; Duan, Q.; Chen, M.; Li, Y.; Wu, K.; Liu, B.; Peng, P.; Sun, J. The Efficiency of Heptafluoropropane Fire Extinguishing Agent on Suppressing the Lithium Titanate Battery Fire. Fire Technol. 2016, 52, 387–396. [Google Scholar] [CrossRef]
  24. Liu, Y.; Duan, Q.; Xu, J.; Chen, H.; Lu, W.; Wang, Q. Experimental Study on the Efficiency of Dodecafluoro-2-Methylpentan-3-One on Suppressing Lithium-Ion Battery Fires. RSC Adv. 2018, 8, 42223–42232. [Google Scholar] [CrossRef] [PubMed]
  25. Golubkov, A.W.; Scheikl, S.; Planteu, R.; Voitic, G.; Wiltsche, H.; Stangl, C.; Fauler, G.; Thaler, A.; Hacker, V. Thermal Runaway of Commercial 18650 Li-Ion Batteries with LFP and NCA Cathodes—Impact of State of Charge and Overcharge. RSC Adv. 2015, 5, 57171–57186. [Google Scholar] [CrossRef]
  26. Mao, N.; Zhang, T.; Wang, Z.; Gadkari, S.; Wang, J.; He, T.; Gao, T.; Cai, Q. Revealing the Thermal Stability and Component Heat Contribution Ratio of Overcharged Lithium-Ion Batteries during Thermal Runaway. Energy 2023, 263, 125786. [Google Scholar] [CrossRef]
  27. Jie, D.; Baohui, C.; Jiazheng, L.; Tiannian, Z.; Chuanping, W. Thermal Runaway and Combustion Characteristics, Risk and Hazard Evaluation of Lithium-iron Phosphate Battery under Different Thermal Runaway Triggering Modes. Appl. Energy 2024, 368, 123451. [Google Scholar] [CrossRef]
  28. Cui, Y.; Shi, D.; Wang, Z.; Mou, L.; Ou, M.; Fan, T.; Bi, S.; Zhang, X.; Yu, Z.; Fang, Y. Thermal Runaway Early Warning and Risk Estimation Based on Gas Production Characteristics of Different Types of Lithium-Ion Batteries. Batteries 2023, 9, 438. [Google Scholar] [CrossRef]
  29. Larsson, F.; Andersson, P.; Blomqvist, P.; Mellander, B.-E. Toxic Fluoride Gas Emissions from Lithium-Ion Battery Fires. Sci. Rep. 2017, 7, 10018. [Google Scholar] [CrossRef]
  30. Wang, K.; Wu, D.; Chang, C.; Zhang, J.; Ouyang, D.; Qian, X. Charging Rate Effect on Overcharge-Induced Thermal Runaway Characteristics and Gas Venting Behaviors for Commercial Lithium Iron Phosphate Batteries. J. Clean. Prod. 2024, 434, 139992. [Google Scholar] [CrossRef]
  31. Knott, L.M.; Long, E.; Garner, C.P.; Fly, A.; Reid, B.; Atkins, A. Insights Into Lithium-Ion Battery Cell Temperature and State of Charge Using Dynamic Electrochemical Impedance Spectroscopy. Int. J. Energy Res. 2024, 2024, 9657360. [Google Scholar] [CrossRef]
  32. Wu, T.; Chen, H.; Wang, Q.; Sun, J. Comparison Analysis on the Thermal Runaway of Lithium-Ion Battery under Two Heating Modes. J. Hazard. Mater. 2018, 344, 733–741. [Google Scholar] [CrossRef] [PubMed]
  33. Shah, K.; Chalise, D.; Jain, A. Experimental and Theoretical Analysis of a Method to Predict Thermal Runaway in Li-Ion Cells. J. Power Sources 2016, 330, 167–174. [Google Scholar] [CrossRef]
  34. Li, H.; Duan, Q.; Zhao, C.; Huang, Z.; Wang, Q. Experimental Investigation on the Thermal Runaway and Its Propagation in the Large Format Battery Module with Li(Ni1/3Co1/3Mn1/3)O2 as Cathode. J. Hazard. Mater. 2019, 375, 241–254. [Google Scholar] [CrossRef] [PubMed]
  35. Yang, X.; Wang, H.; Li, M.; Li, Y.; Li, C.; Zhang, Y.; Chen, S.; Shen, H.; Qian, F.; Feng, X.; et al. Experimental Study on Thermal Runaway Behavior of Lithium-Ion Battery and Analysis of Combustible Limit of Gas Production. Batteries 2022, 8, 250. [Google Scholar] [CrossRef]
  36. Liu, J.; Wang, Z.; Bai, J. Influences of Multi Factors on Thermal Runaway Induced by Overcharging of Lithium-Ion Battery. J. Energy Chem. 2022, 70, 531–541. [Google Scholar] [CrossRef]
  37. Wang, D.; Peng, K.; Fu, Y.; Zhu, C.; Yang, Y. Kinetics of Lithium Dendrite Growth in Garnet-Type Solid Electrolyte. J. Power Sources 2021, 487, 229421. [Google Scholar] [CrossRef]
  38. Li, S.; Zhou, S.; Zhao, S.; Jin, T.; Zhong, M.; Cen, Z.; Gao, P.; Yan, W.; Ling, M. Room Temperature Resistive Hydrogen Sensor for Early Safety Warning of Li-Ion Batteries. Chemosensors 2023, 11, 344. [Google Scholar] [CrossRef]
  39. Jin, Y.; Zheng, Z.; Wei, D.; Jiang, X.; Lu, H.; Sun, L.; Tao, F.; Guo, D.; Liu, Y.; Gao, J.; et al. Detection of Micro-Scale Li Dendrite via H2 Gas Capture for Early Safety Warning. Joule 2020, 4, 1714–1729. [Google Scholar] [CrossRef]
  40. Zhang, Y.; Cheng, S.; Mei, W.; Jiang, L.; Jia, Z.; Cheng, Z.; Sun, J.; Wang, Q. Understanding of Thermal Runaway Mechanism of LiFePO4 Battery In-Depth by Three-Level Analysis. Appl. Energy 2023, 336, 120695. [Google Scholar] [CrossRef]
  41. Kim, H.; Jung, T.; Jung, J.; Noh, Y.; Lee, B. Accurate Prediction of Electrochemical Degradation Trajectory for Lithium-Ion Battery Using Self-Discharge. Int. J. Energy Res. 2024, 2024, 1758578. [Google Scholar] [CrossRef]
  42. Chun, H.; Choi, H.; Jun, Y.; Lee, H. Comprehensive Study on Thermal Characteristics of Lithium-Ion Battery With Entropic Heat. Int. J. Energy Res. 2024, 2024, 8815580. [Google Scholar] [CrossRef]
Figure 1. LFP battery thermal runaway stage division.
Batteries 11 00253 g001
Figure 2. Experimental setup diagram.
Batteries 11 00253 g002
Figure 3. Key nodes in the test group.
Batteries 11 00253 g003
Figure 4. Infrared imaging of key nodes during thermal runaway. (a,b) The initial overcharging phase; (ce) The emergence of hotspots and heat spread; (f) Gas overflow caused by excessive internal pressure; (g) A high-pressure gas jet occurs at the safety valve.
Batteries 11 00253 g004
Figure 5. Curves of temperature and voltage changing with time under five working conditions. (a) 1C/35 °C; (b) 1.5C/5 °C; (c) 1.5C/15 °C; (d) 1.5C/25 °C; (e) 1.5C/35 °C; (f) Integral of temperature and time.
Batteries 11 00253 g005
Figure 6. Temperature and voltage change rate curves. (a) Differential of temperature and time (b) Differentiation of voltage and time.
Batteries 11 00253 g006
Table 1. Sample parameter information of lithium-ion cells.
NameParameter
Positive electrodeLithium iron phosphate (LiFePO4)
Negative electrodeGraphite
Dimensions (length × width × height)100 mm × 21 mm × 140 mm
Capacity25 Ah
Mass630 g
Nominal voltage3.2 V
Operating voltage2.3–3.65 V
Discharge temperature−30–55 °C
AC impedance0.6–1.5 mΩ
Specific heat capacity830 J kg−1 K−1 [20]
Table 2. Matrix contents.
Condition AbbreviationC-Rate (C)Ambient Temperature (°C)Initial State of Charge (SOC)
100-1.0-351.035100
100-1.5-051.505100
100-1.5-151.515100
100-1.5-251.525100
100-1.5-351.535100
Table 3. Mass and thickness of batteries in each test group before and after the experiment.
Initial1C/35 °C1.5C/5 °C1.5C/15 °C1.5C/25 °C1.5C/35 °C
mass630.0 g ± 5.0 g574.3 g580.8 g506.1 g404.2 g506.4 g
thickness21.0 mm58.4 mm54.7 mm61.1 mmExplosion54.2 mm
Disclaimer/Publisher’s Note: The statements, opinions and data contained in all publications are solely those of the individual author(s) and contributor(s) and not of MDPI and/or the editor(s). MDPI and/or the editor(s) disclaim responsibility for any injury to people or property resulting from any ideas, methods, instructions or products referred to in the content.

