Article

Advanced Algorithm for SOC, Internal Resistance, and SOH Co-Estimation of Lithium-Titanate-Oxide Batteries Using Neural Networks

1
Marelli Europe S.p.A., Via del Timavo 33, 40131 Bologna, Italy
2
Dipartimento di Ingegneria dell’Informazione, University of Pisa, Via Caruso 16, 56122 Pisa, Italy
3
Marelli Corporation, Kodama Plant, 540-7 Kyoei, Kodama-cho, Honjo-City 367-0206, Saitama, Japan
*
Author to whom correspondence should be addressed.
Batteries 2025, 11(6), 235; https://doi.org/10.3390/batteries11060235
Submission received: 8 May 2025 / Revised: 9 June 2025 / Accepted: 17 June 2025 / Published: 19 June 2025

Abstract

Lithium-titanate-oxide batteries can reduce the long charging time of electric vehicles by offering fast charging capabilities. However, high charging currents require an accurate estimation of battery internal state to prevent early aging of the battery and dangerous situations. An accurate algorithm based on neural networks for the co-estimation of state of charge, internal resistance, and capacity state of health is proposed in this work. The algorithm is trained with synthetic data generated by an electric vehicle simulation platform running seven different standard driving cycles at various settings. The algorithm is then validated using an additional standard driving cycle, achieving, for state of charge, internal resistance, and capacity state of health, a root mean square error lower than 2%, 80 μΩ, and 2.9%, and a mean absolute percentage error lower than 3.4%, 4.4%, and 3.3%, respectively. The results obtained and the comparison with literature works indicate that the co-estimation algorithm proposed is able to estimate the considered quantities with very good accuracy.

Graphical Abstract

1. Introduction

Electric vehicles (EVs) are a game-changer in the transition to sustainable transportation [1,2]. However, batteries of large capacity that require long charging times are needed to achieve adequate driving ranges and reduce drivers’ range anxiety. Lithium-titanate-oxide (LTO) batteries have emerged as a promising alternative to other lithium graphite-based technologies, offering high stability and fast charging capabilities [3]. For example, replacing the graphite of nickel-manganese-cobalt (NMC) cells with lithium-titanate nanocrystals as anode material allows LTO cells to be charged with a higher current than NMC cells without speeding up the aging processes. Therefore, the use of LTO technology may lead to EVs equipped with batteries of smaller capacity that can be charged more frequently at very high current rates, a step that reduces the gap between electric and internal combustion engine vehicles when the energy tank refill is considered [4,5].
The optimal use of high charging current rates requires in-depth knowledge of the internal states of battery cells, i.e, state of charge (SOC) and sstate of health (SOH), to avoid accelerated battery aging and potentially unsafe conditions [6,7]. For example, Epding et al. in ref. [8] and Kalk et al. in ref. [9] demonstrated that a SOC-based multi-stage constant current strategy can significantly reduce the aging of LTO and NMC cells during fast charge, when compared to the classic constant current charging profile that only considers the terminal voltages of the battery cells. Unfortunately, state estimation algorithms for LTO batteries have not yet been widely studied in the literature. However, data-driven algorithms are one of the most promising approaches to address this identification task. In fact, neural network and machine learning approaches enable the development of estimation algorithms that continuously improve accuracy over the operational life of the battery as more data become available [10,11,12,13,14,15]. Unfortunately, data-driven algorithms require a considerable volume of data for training, which is not yet available for LTO batteries. However, many works in the literature demonstrate that synthetic datasets can be an excellent alternative to measurement-based ones for training state estimation algorithms [16,17,18,19]. In fact, the use of simulation platforms to create synthetic datasets allows designers to explore a wide range of operating conditions and easily correlate measurable quantities of the cells with their internal states.
Numerous data-driven algorithms have been introduced in recent years to estimate internal state variables of NMC batteries. For instance, Tao et al. [20] present and compare SOC estimation algorithms based on the gated recurrent unit (GRU) [21], long short-term memory (LSTM) [22], bidirectional GRU (BGRU), and bidirectional LSTM (BLSTM). Moreover, fully connected neural network (FNCC), LSTM, GRU, and temporal convolutional network (TCN) approaches are used to implement algorithms for the internal state estimation of NMC batteries and are compared in ref. [23]. Identifying the best neural network architecture to estimate the battery SOC is very difficult because each architecture optimizes different metrics [20]. In addition, the accuracy of the architecture is directly related to the number of layers and nodes that make up the network. For example, the nodes of a feedforward/fully connected neural network (FNN/FCNN) are the least complex, but the network requires a larger number of nodes to obtain good accuracy in estimating SOC [20]. The temporal convolutional network (TCN) is developed from the connected neural network and generally achieves higher accuracy when processing time-series data [23]. Conversely, the LSTM and GRU networks process data step by step. They keep the state of the system in internal node variables, making them well-suited for streaming or real-time sequences. In fact, LSTM generally achieves good accuracy, and its trade-off between accuracy and complexity is generally better than that of other architectures.
To the best of our knowledge, the literature about the internal state estimation of LTO cells is rather poor. For this reason, we developed and presented in this paper a novel co-estimation algorithm based on neural network and machine learning approaches that can estimate the SOC, internal cell resistance, and SOH of LTO batteries for EV applications. As far as SOH is concerned, we will refer from now on to the capacity state of health (SOHc) that considers aging as a loss of battery capacity. The algorithm is trained and validated using a synthetic dataset generated with a simulation platform that includes a vehicle dynamic model, a battery model, and a test control block. The detailed description of the developed simulation platform is provided in the next section, which also details the synthetic dataset. Section 3 explains the proposed co-estimation algorithm and the training procedure, while Section 4 shows the test phase of the proposed co-estimation algorithm and its accuracy. Finally, the conclusions are drawn in the last section.

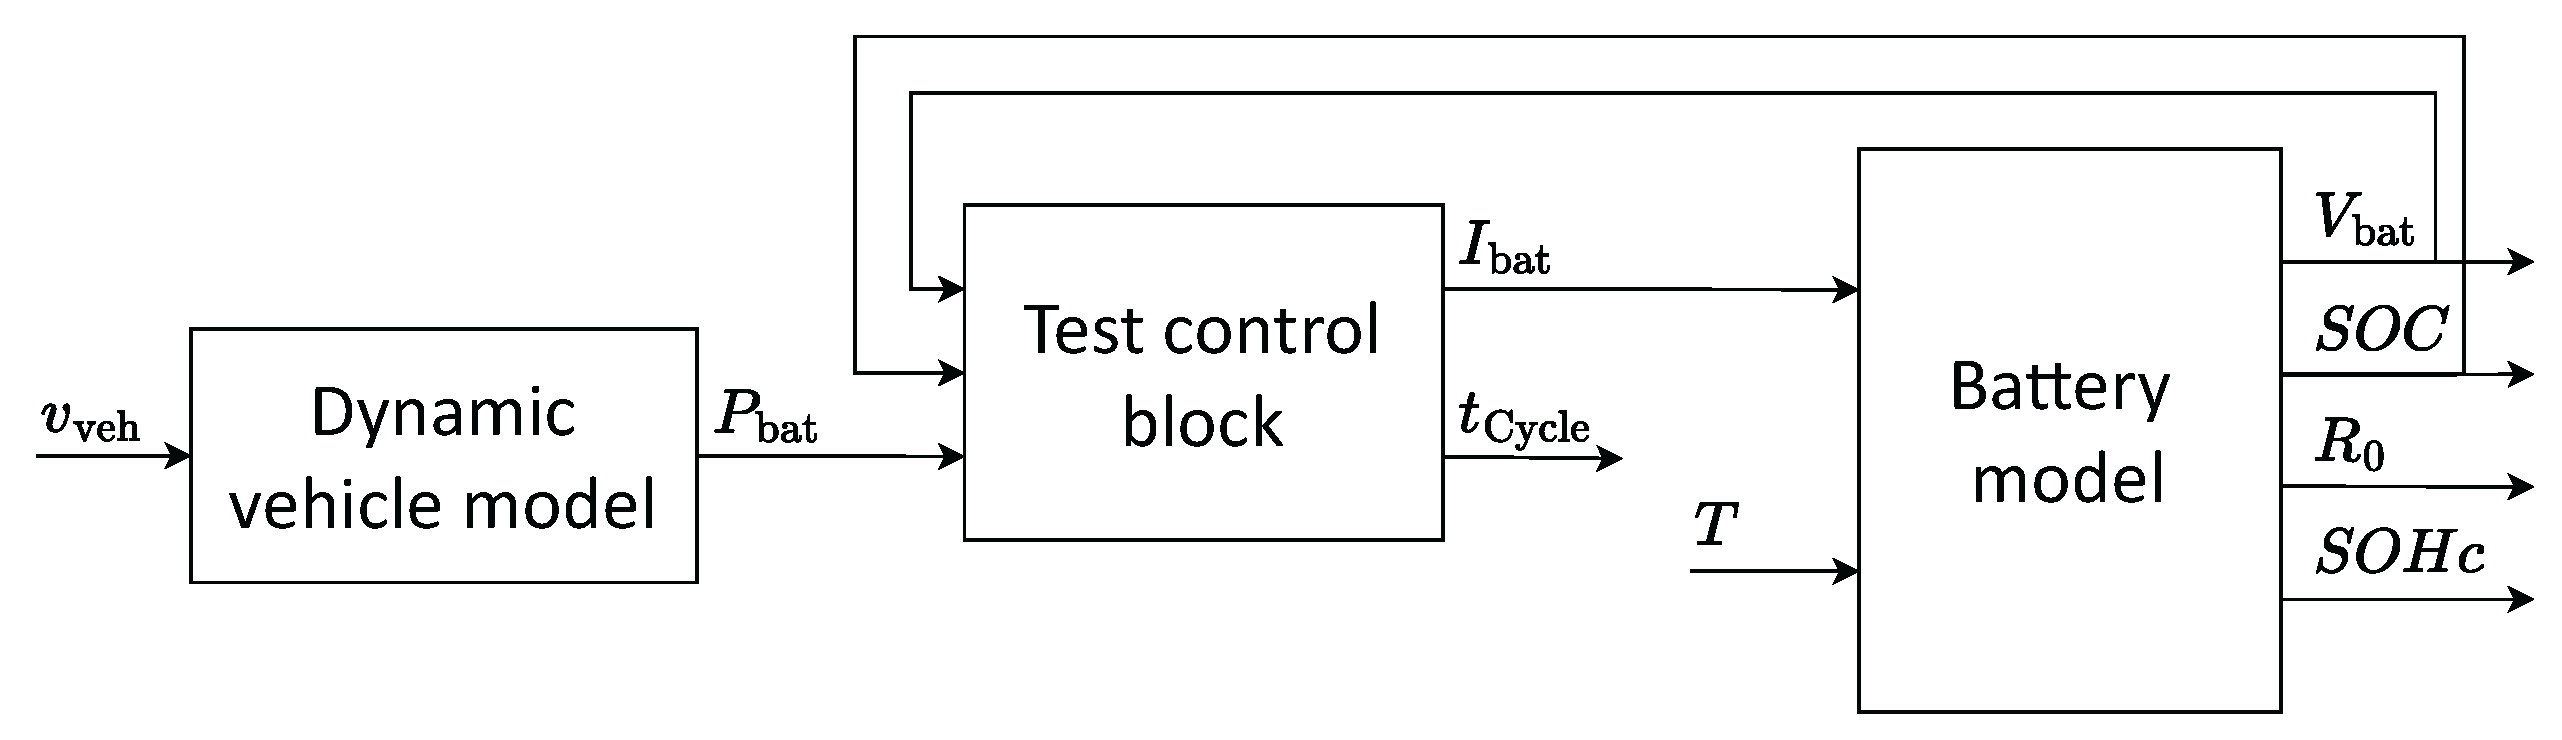
2. Simulation Platform and Synthetic Dataset Creation

The block diagram of the proposed simulation platform used to create the synthetic dataset is shown in Figure 1. In particular, the platform consists of three main blocks: the dynamic vehicle model, the battery model, and the test control block. The test control block manages the simulation platform to emulate battery usage in a real electric vehicle application. It alternates charge and discharge phases consisting of a standard charging profile and the electrical power profile calculated by the dynamic vehicle model, respectively. Specifically, the dynamic vehicle model evaluates the electrical power drawn by the vehicle from the battery during travel, based on the vehicle speed profile. Finally, the battery model emulates the electrical and aging behaviors of the battery. The following subsection provides a detailed description of these main blocks.

2.1. Dynamic Vehicle Model
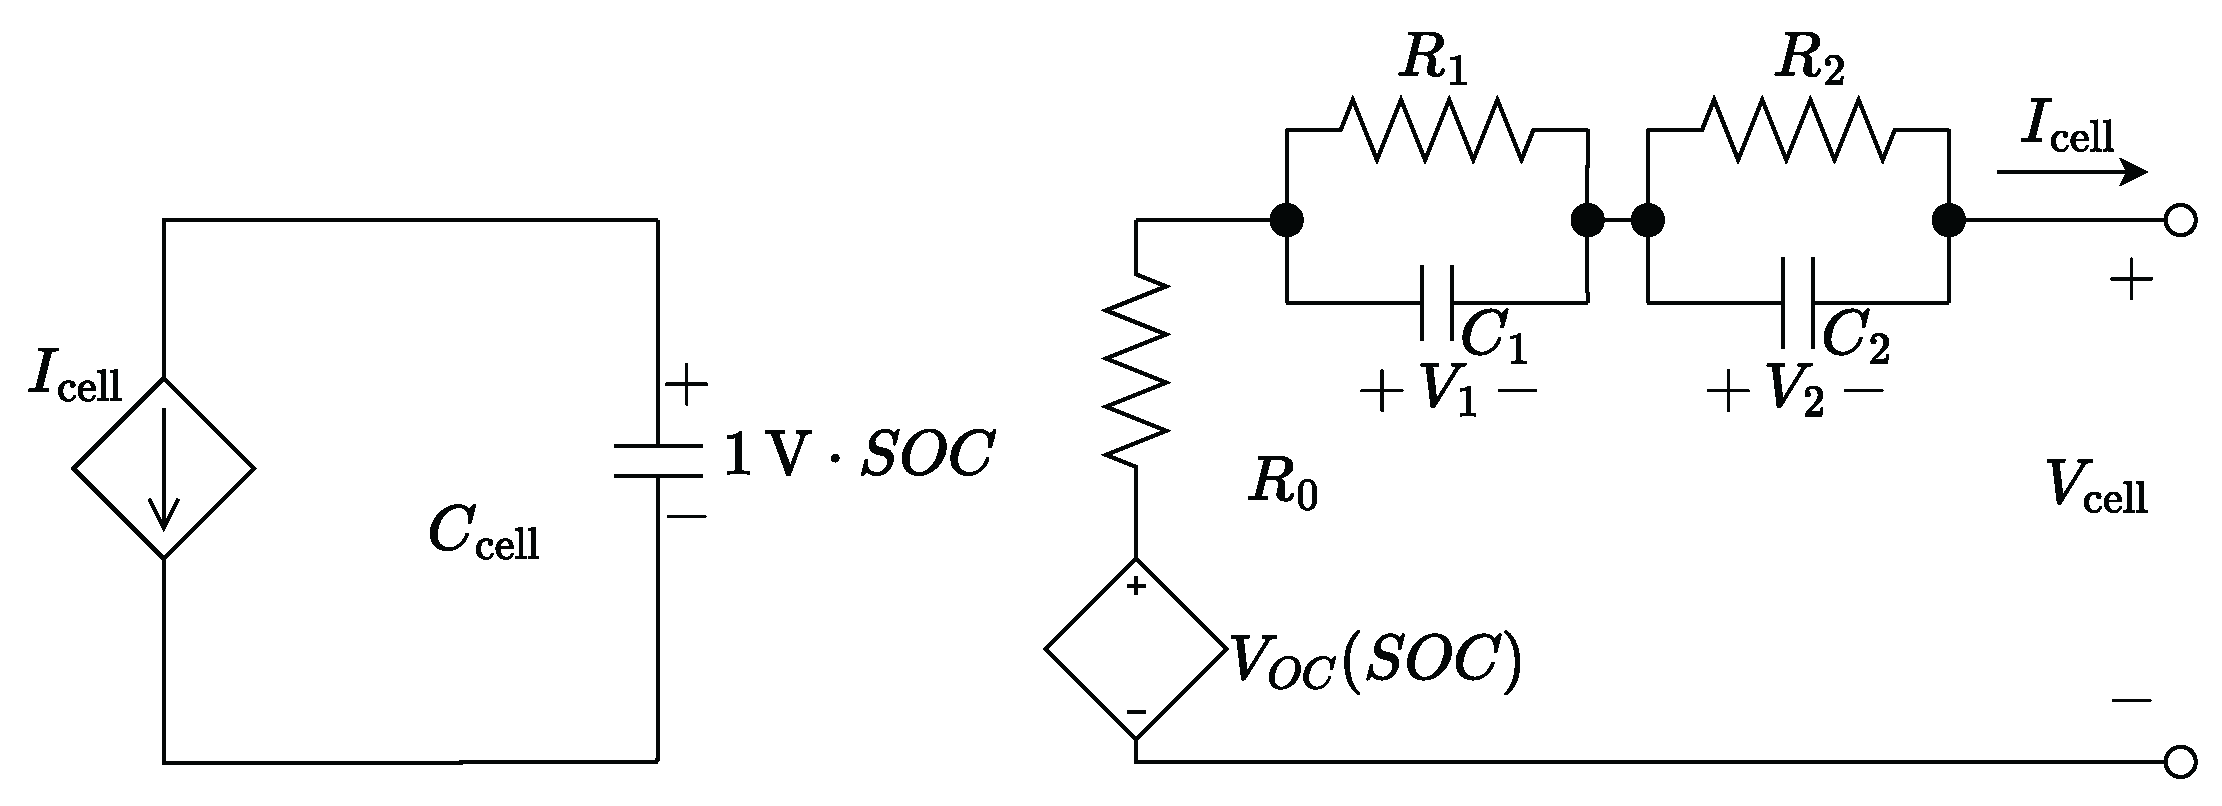
The dynamic vehicle block is based on the model presented in ref. [24] which allows us to evaluate the electric power required from the battery starting from the speed profile and the mechanical properties of the vehicle. In particular, the model calculates the total mechanical force of the vehicle F total as the sum of the accelerating force F accelerating , the aerodynamic drag force F air , the gravitational force due to the slope of the road F slope , and the rolling force F rolling . These contributions are evaluated as:
F accelerating = M a veh F air = 0.5 ρ S C x v veh 2 F slope = g M s i n ( α ) F rolling = g M R rolling F total = F accelerating + F air + F slope + F rolling
where M is the kerb weight of the vehicle, a veh is the acceleration, S is the surface area, C x is the drag coefficient, v veh is the speed, and R rolling is the rolling resistance of the vehicle. Moreover, ρ is the air density, α is the slope of the road, and g is the gravitational acceleration. Finally, the electric power required from the battery P bat is obtained by multiplying F total by the efficiency of the system η . The parameters and mechanical properties of the vehicle are obtained from ref. [25] and are summarized in Table 1.

2.2. Battery Model

The battery model block takes into account the battery behavior. For the sake of simplicity, all battery cells and their internal states are considered identical. Therefore, the battery model block evaluates the output values of a single cell and applies the results to the other cells. In particular, the 2 RC-group equivalent circuit model (ECM) shown in Figure 2 is used to evaluate the evolution of cell voltage and SOC during battery operation [26,27].
The 2 RC-group ECM is very popular in the literature and is composed of two parts. The left-hand side consists of a dependent current generator controlled by the cell current I cell and a capacitor, whose value is equal to the nominal cell capacity C cell (expressed in Coulombs) divided by 1 V . This part of the circuit models the charge stored in the cell, and the voltage value of the capacitor corresponds to the SOC multiplied by 1 V . The right-hand side of the circuit reproduces the cell terminal voltage V cell . It is the sum of the open circuit voltage V oc , the voltage drop on the internal Ohmic resistance R 0 , and a term that accounts for the relaxation phenomena that occur inside the cell. This dynamic term consists of the two voltages V 1 and V 2 that represent the effects of double layer capacitance and diffusion, respectively. These effects are modeled by the two R 1 C 1 and R 2 C 2 groups, characterized by very different time constants [28]. The cell time-domain state space is described by the following equations:
d S O C d t = I cell C cell d V 1 d t = V 1 R 1 C 1 + I cell C 1 d V 2 d t = V 2 R 2 C 2 + I cell C 2 V cell = V OC R 0 I cell V 1 V 2
The values of R 0 , R 1 , C 1 , R 2 , and C 2 depend on temperature, SOC, and the sign of the current (charge/discharge). The dependencies are not linear, and the model takes this into account with a multidimensional look-up table whose inputs are the cell temperature, the SOC, and the sign of the current, and whose outputs are the R 0 , R 1 , C 1 , R 2 , and C 2 values.
The battery block is also equipped with a cell degradation model that takes into account both calendar and cycling aging phenomena. Calendar aging occurs even when the battery is not in use and is due to unwanted side reactions [29]. The aging speed depends on storage conditions, such as the temperature and SOC of the cell, and thus the voltage. Conversely, cycling aging is caused by the current that flows in the cell. It produces many physical and chemical mechanisms that age the cell, such as local increase in temperature or electrode potential leading to unwanted side reactions, and mechanical stress occurring during the intercalation and de-intercalation of lithium ions in the electrodes. As a result, cycling aging depends on the operating condition of the cell in terms of current, temperature, SOC, and thus voltage values. As a general rule, cells age faster at higher voltages because of the electrolyte decomposition. Higher currents cause increased stress in the materials during the charging and discharging phases. A higher temperature increases the speed of unwanted side reactions. In this work, the effects of aging have been considered on both internal resistance R 0 and cell capacity C cell , according to the models described in refs. [30,31]. These models evaluate the cell degradation as the sum of the three contributions due to cell voltage, current, and temperature values according to the following system of equations:
α r ( t ) = b r V cell ( t ) + c r 1 + e r | I cell ( t ) | e q d r K b T ( t ) α c ( t ) = b c V cell ( t ) + c c 1 + e c | I cell ( t ) | e q d c K b T ( t ) R 0 R 0 fresh = 1 + 0 t α r d τ SOHc = C cell C cell fresh = 1 0 t α c d τ
where α r i and α c i represent the increase in resistance and the reduction in capacity of the cell, respectively, R 0 fresh and C cell fresh are the R 0 and C cell values of the fresh cell, and V cell , I cell , and T are the cell voltage, current, and temperature. A brief description of the other parameters of the aging model and their values is reported in Table 2.
It is important to note that the values used derive from an experimental characterization test campaign and reasonable assumptions. In particular, d c is set to have a capacity reduction of 2% per year at the constant temperature of 45 C and 0.1% per year at 0 C. Meanwhile, b c and c c are chosen to obtain a reduction of the cell capacity of 2% with a fully charged cell and of 1% with a fully discharged cell. For simplicity, b r , c r , and d r are set equal to b c , c c , and d c , respectively. Finally, e r and e c are evaluated to obtain a resistance increase of 50% per year and a reduction of the cell capacity of 10% per year, respectively, considering a cycling current of 1 C-rate and an average cell voltage of 2.4   V , i.e., the voltage of an LTO cell with 50% SOC.
Thus, the values of the aging model parameters obtained are able to model a realistic aging rate of the electric vehicle battery. However, this rate is very low and requires the simulation of hundreds of driving cycles to obtain significant battery degradation. An acceleration factor of 250 is applied to α r and α c to speed up aging processes, obtaining a reasonable trade-off between model accuracy and simulation time to generate the synthetic dataset, and dataset size.

2.3. Test Control Block

The dynamic vehicle block and the battery model block are controlled by the test control block. In particular, the test control block manages the battery block to reproduce vehicle usage, consisting of the repetition of a discharge phase followed by a charging phase. The vehicle usage profile starts with a fully charged fresh battery. The battery is then discharged with the current profile obtained by the ratio between P bat and the battery voltage generated by the battery model block. The P bat profile is obtained from the dynamic vehicle model using a standard driving cycle. Standard driving cycles are predefined speed profiles that simulate real-world driving conditions to assess fuel consumption, emissions, and energy efficiency. The driving cycles considered in this work include La92short, J1015, HWFET, ArtMw150, ArtUrban, FTP, ArtRoad, and WLTP. Their characteristics are summarized in Table 3. It can be noted that each driving cycle covers a very short distance. Therefore, it is repeated until the battery SOC reaches 20%, the point at which the charging phase starts.
The charging phase is based on a constant current–constant voltage (CC-CV) profile, where the constant current is equal to 1 C-rate of the nominal cell capacity C cell fresh and the constant voltage is equal to the V OC value at 80 % SOC. The discharge and charge phases are continuously repeated with the same current and voltage values until the battery SOHc, i.e., the ratio between C cell and C cell fresh , reaches the 60% threshold. The procedure described above was repeated for all the 8 different standard driving cycles at 25 C and 35 C to generate the synthetic dataset. Therefore, the dataset contains 16 time series that describe the life of 16 identical batteries used in different conditions.
The 12 time series obtained from the La92short, J1015, HWFET, ArtMw150, and ArtUrban driving cycles were used to train the co-estimation algorithm. The validation phase was carried out using the 4 time series obtained from the FTP and ArtRoad driving cycles. Finally, the 2 time series obtained from the WLTP driving cycle were used for the final test.

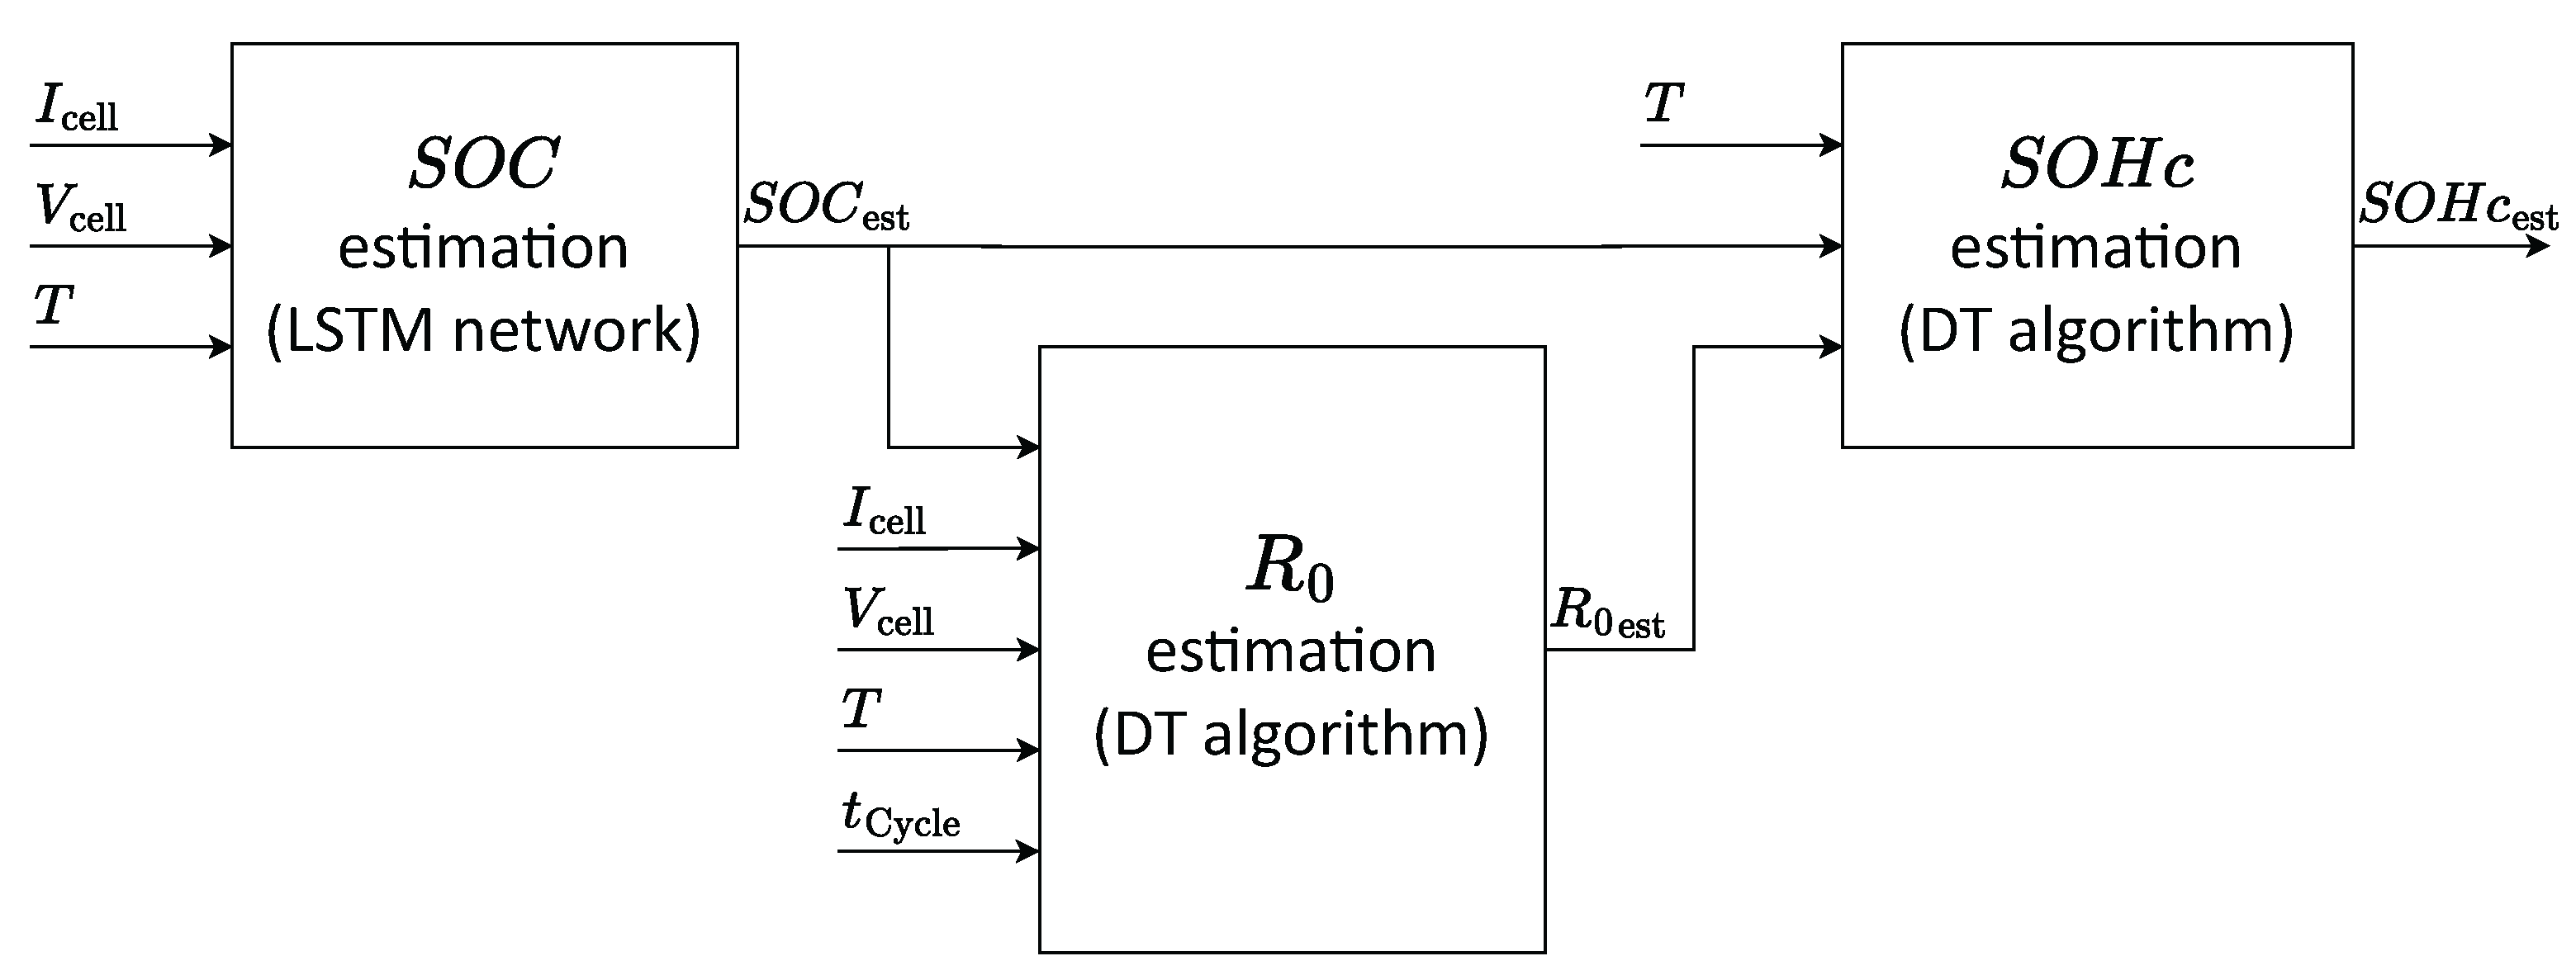
3. Co-Estimation Algorithm

The developed co-estimation algorithm aims to identify SOC, R 0 , and SOHc of an LTO cell used in electric vehicles. The algorithm is divided into three cascaded blocks that estimate SOC, R 0 , and SOHc, respectively. The block diagram of the algorithm is shown in Figure 3.
The partitioning of the co-estimation algorithm allows us to keep the system complexity low and to execute the estimation functions at different frequencies. For example, the R 0 and SOHc variables can be estimated at much lower frequencies than the SOC variable.
It is important to note that network inputs are normalized in the range from 0 to 1 using the following equation:
i n p u t N = i n p u t i n p u t min i n p u t max i n p u t min
where i n p u t N is the normalized input, i n p u t is the input value, and i n p u t min and i n p u t max are the maximum and minimum possible values of the relative input. The values of i n p u t min and i n p u t max are equal to 1.5   V and 2.7   V , 250   A and 250 A , and −20 C and 70 C for cell voltage, current, and temperature, respectively. These values are the most common safety thresholds for the LTO cell safe operating area (SOA) [32].

3.1. SOC Estimation Block

The SOC estimation block is based on an LSTM layer followed by a dropout layer and a fully connected layer. The training of this network was carried out employing the Adam optimization algorithm, which offers good efficiency and adaptability in terms of learning rate. Finally, network outputs are post-processed with a rate limiter to address the intrinsic high-frequency noise generated by the network, such as transient spikes and fluctuations.
The training and validation processes of the proposed SOC estimation network were carried out using the first discharge and charge cycle of the generated synthetic dataset, i.e., the cycle with the fresh battery. In particular, the first discharge and charge cycle of the La92short, J1015, HWFET, ArtMw150, and ArtUrban driving cycles were used in the training, while those of the FTP and ArtRoad cycles were used to validate the network.
Different combinations of the number of internal neurons, learning rate, and window size were explored to identify the best hyperparameters. The results of this analysis are reported in Table 4, which shows the root mean square error (RMSE), the mean absolute error (MAE), and the mean absolute percentage error (MAPE) obtained with the hyperparameters explored during the training phase carried out over 20 epochs. RMSE, MAE, and MAPE are evaluated with the following equations
RMSE = 1 N k = 1 N Y predicted Y true 2 MAE = 1 N k = 1 N Y predicted Y true MAPE = 100 · 1 N k = 1 N Y predicted Y true Y predicted
where N is the number of predicted points, Y predicted is the value predicted by the neural network, and Y true is the true value.
The best results were obtained with a chunk size of 1000, a learning rate equal to 0.01, and 50 hidden units. Therefore, the results presented in the next section are evaluated using the network obtained with these hyperparameters and trained with 100 epochs.

3.2. Internal Resistance and SOHc Estimation Blocks

The SOHc and R 0 estimation blocks are based on the decision tree (DT) algorithm. The proposed DT models were configured so that each node must have at least 10 observations to be considered for splitting (i.e., minParent parameter set to 10). Additionally, each leaf node must contain at least 4 observations (i.e., minLeaf parameter set to 4). These values provide an effective trade-off between complexity and accuracy, helping to prevent overfitting by ensuring that nodes are split only when there are sufficient data to support them. Both networks were trained with the same dataset composed of the time series obtained from the FPT and ArtRoad drive cycles. It is important to note that all inputs to the networks were generated using the simulation platform, ensuring that the training phase of each network remained independent. The cross-validation approach was used during the network training phase with the training dataset divided into 5 folds. The RMSE and MAE values of the R 0 estimation network are equal to 16 μΩ, and 10 μΩ, respectively. Instead, SOHc network training achieved an RMSE of 0.82% and an MAE of 0.57%.

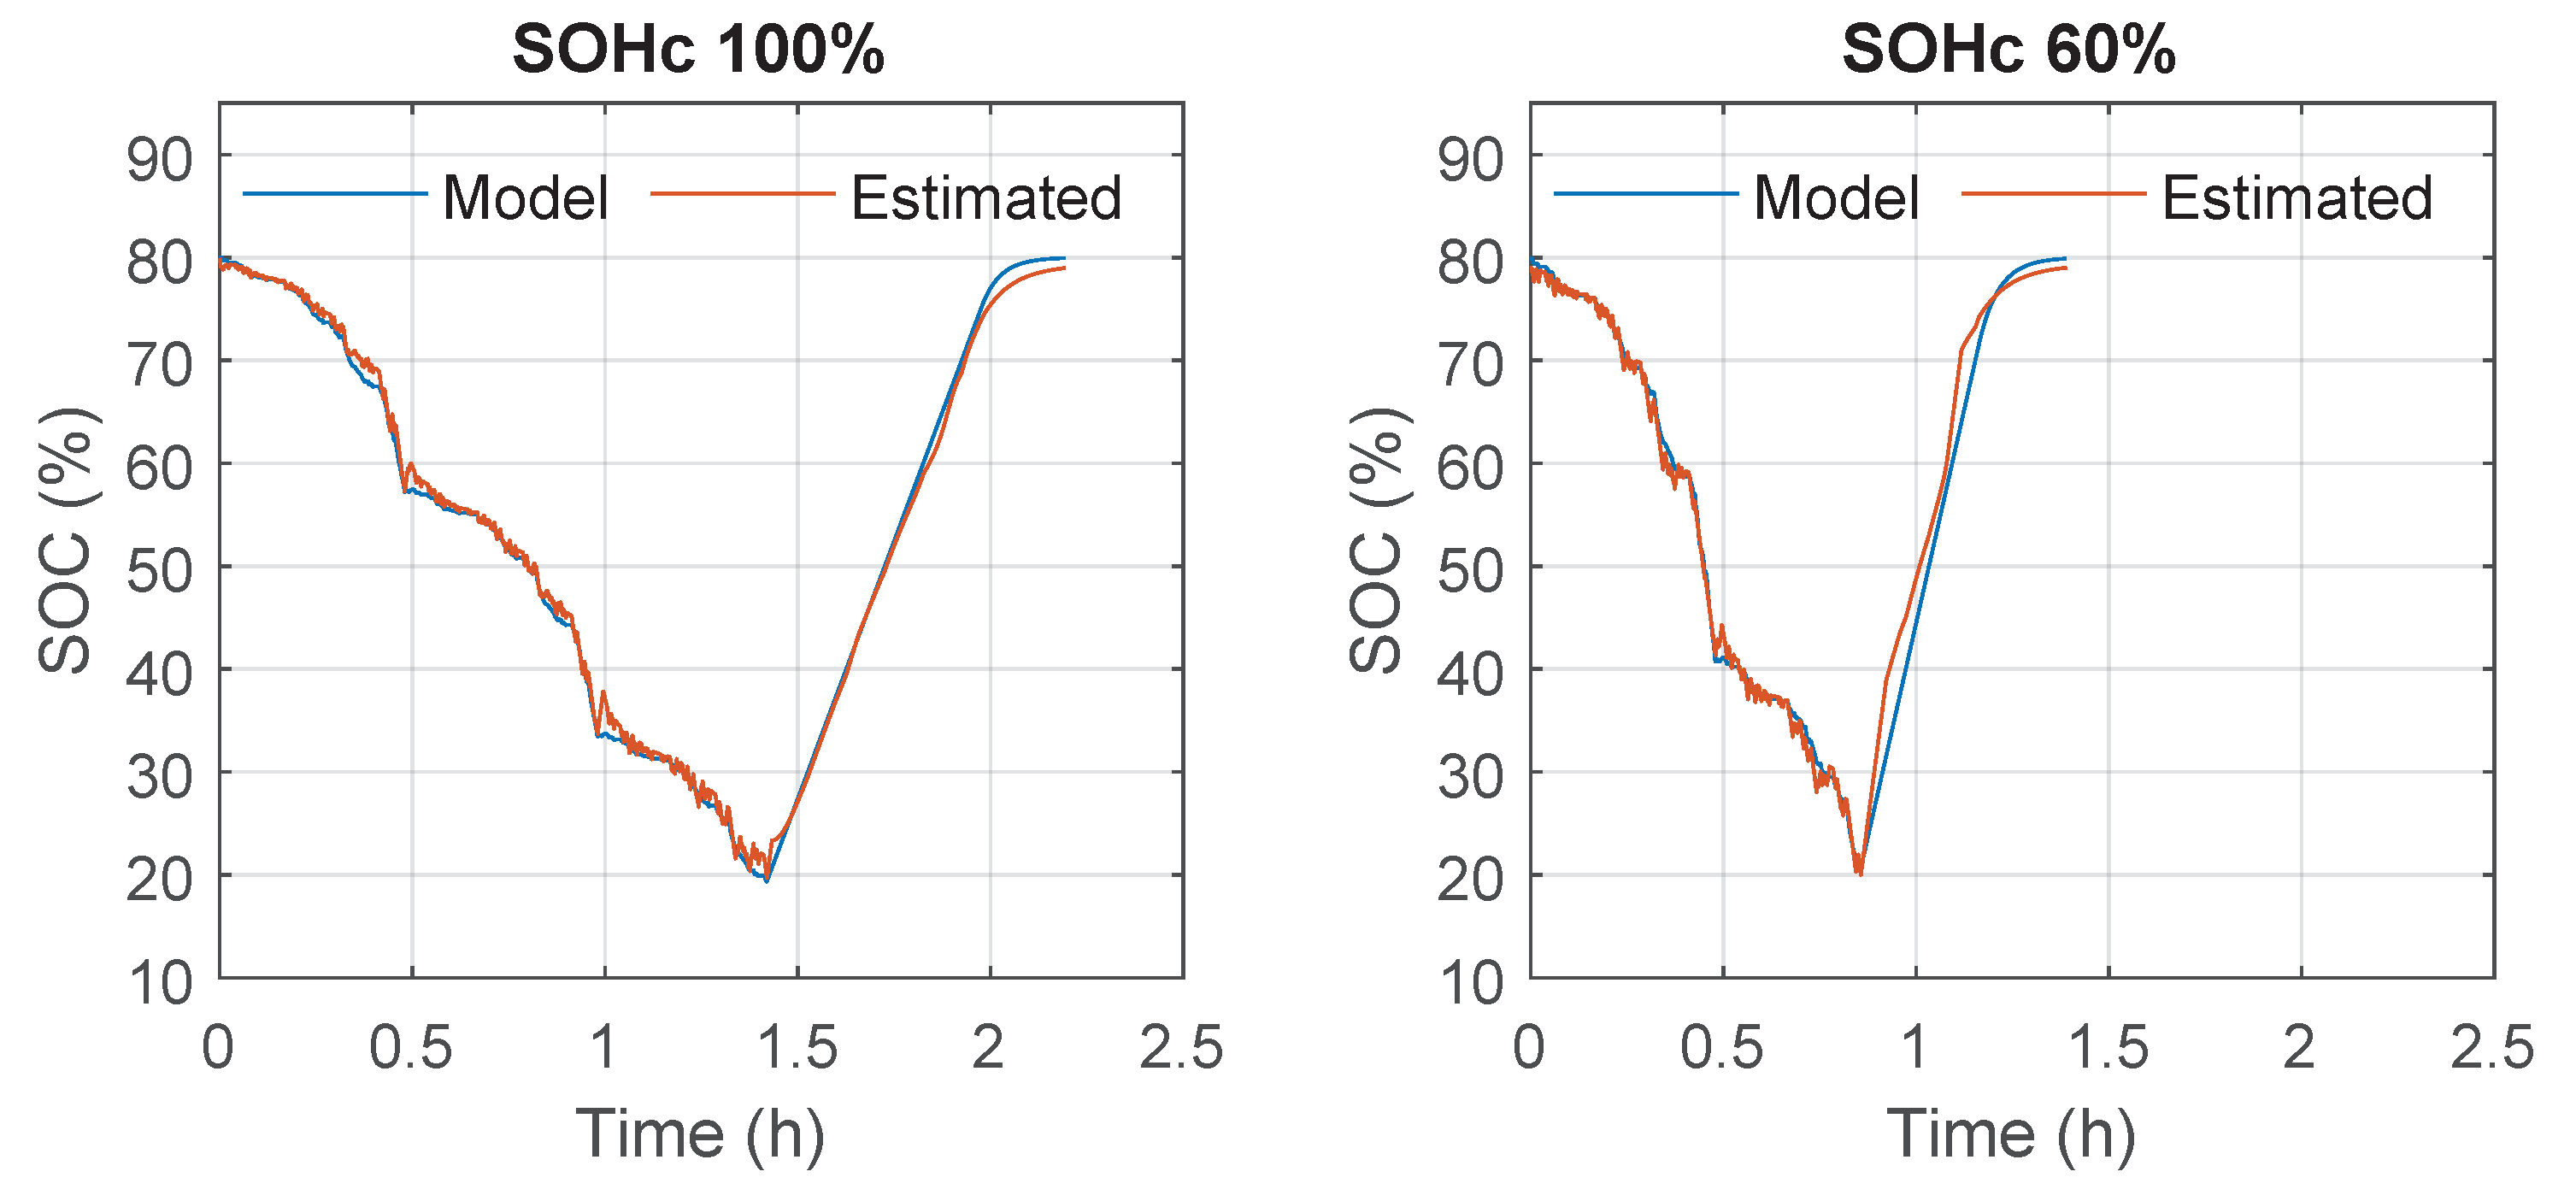
4. Test of the Developed Co-Estimation Algorithm

The developed co-estimation algorithm shown in Figure 3 has been verified using the WLTP drive cycle time series from the database. This part of the database was not used during network training to evaluate the ability of the algorithm developed to correctly estimate battery SOC, R 0 , and SOHc under new and unforeseen conditions. Moreover, the proposed co-estimation algorithm was also tested using voltage and current inputs that were made as realistic as possible by introducing a measurement error consisting of white noise with normal distribution. The mean values of both distributions were set to 0, while the values of σ were set to 2.25   m V and 0.32   m A for the voltage and current measurement system error distributions, respectively.
Figure 4 compares the estimated SOC values with those coming from the model that are used as reference. The figure shows the estimated SOC value of the first and last discharge/charge cycles with SOHc equal to 100% and 60%, respectively, considering the noise on the current and voltage measurement. As we can observe, the SOC network is capable of accurately estimating the SOC values in both cycles, even though it was trained using the first cycle of the dataset time series with a cell SOHc equal to 100%. It should also be noted that the duration of the discharge/charge cycle is reduced to less than one and a half hours when the cell is aged. This is because the levels of charge and discharge currents always refer to the capacity of the fresh cell. The available charge in aged cells is reduced and, therefore, the investigated SOC interval is covered in less time than in fresh cells. The result highlights the robustness of the developed network, which is capable of working with very different cell conditions compared to those seen during the training phase. In fact, RMSE, MAE, and MAPE are very similar for the first and last cycles going from 1.0%, 0.8%, and 1.7% to 2.9%, 2.1%, and 4.2%, respectively. It is important to note that the accuracy in SOC estimation is significantly improved when measurement noise is not introduced. Under these conditions, the mean RMSE, MAE, and MAPE are 0.29%, 0.22%, and 0.44%, respectively.
The estimated R 0 values in the first and last two discharge/charge cycles are compared with the model values in Figure 5. The estimated values follow the trend of the R 0 model, and the RMSE is only 7.6 μΩ in the first cycle and 24.4 μΩ in the last.
Finally, Figure 6 compares the estimated values of SOC, R 0 , and SOHc with the model values during all the simulated cycles. The comparison highlights the capability of the developed co-estimation algorithm to accurately estimate every quantity during the aging of the cell. The RMSE, MAE, and MAPE obtained are shown in Table 5. These results are very similar to the RMSE, MAE, and MAPE obtained in the test carried out at a temperature of 35% and reported in the same table.

5. Result Discussion and Comparison

The SOC estimation accuracies obtained by the co-estimation algorithm under different test conditions are compared in Table 6 to those reported in previous works in the literature.
Four SOC estimation neural networks, based on the GRU, LSTM, BGRU, and BLSTM architectures, were compared in ref. [20]. The authors trained and tested these networks using an experimental dataset obtained from an NMC cell discharged using the NEDC, WLTP, and UDDS driving cycles. The accuracies achieved by the networks are reported for fresh and aged cells (SOH of about 98%). A very similar study was presented in ref. [23], where the performances of FCNN-, LSTM-, GRU-, and TCN-based SOC estimation neural networks were compared. The investigation was carried out using a discharging test profile composed of a random mix of US06, HWFET, and UDD driving cycles, performed on fresh cells at various temperatures. Conversely, a synthetic dataset was used to train and test an LSTM-based SOC estimation neural network in ref. [18]. This study only considered fresh batteries and neglected the effects of voltage and current measurement noise. As observed, the network proposed in this work achieved the highest accuracy in estimating SOC for fresh cells and noiseless measurement conditions. The estimation accuracies slightly decrease when voltage and current measurement noise is introduced and highly aged cells are considered. However, the errors achieved remain comparable to or lower than those found in most of the SOC estimation algorithms reported as references.

6. Conclusions

A co-estimation algorithm based on neural networks and machine learning approaches is presented in this work to accurately estimate the state of charge, internal resistance, and capacity state of health of lithium-titanate-oxide batteries for electric vehicles. The algorithm was trained and tested using a synthetic dataset generated from a simulation platform, including a dynamic vehicle model, a battery model, and a test control block. The results demonstrate that the proposed algorithm achieves high accuracy of estimation under various driving conditions and temperatures. The robustness of the algorithm was validated using the WLTP driving cycle, showing its ability to perform well with conditions unexplored during training and also in the presence of measurement noise. The results highlight the potential of the proposed co-estimation algorithm to enhance battery management systems of lithium-titanate-oxide batteries by providing reliable and accurate state estimations. The research is now directed to the investigation of the following steps:
  • Developing a reinforcement learning algorithm to improve the algorithm performance.
  • Applying model compression and quantization techniques, which are aimed at reducing the model size and enhancing inference speed.
  • Deployment on a microcontroller for practical application to a battery management system.

Author Contributions

Conceptualization, R.D.D., R.D.R., G.A., and R.S.; methodology, R.D.D., R.D.R., G.A., D.C., and R.S.; software, R.D.D.; validation, R.D.D., R.D.R., and G.A.; formal analysis, R.D.D., R.D.R., G.A., and D.C.; investigation, R.D.D., R.D.R., and G.A.; resources, R.D.D., G.A., and D.C.; data curation, R.D.D.; writing—original draft preparation, R.D.D. and R.D.R.; writing—review and editing, R.D.D., R.D.R., G.A., D.C., and R.S.; visualization, R.D.D. and R.D.R.; supervision, G.A. and R.S.; project administration, G.A. and R.S.; funding acquisition, R.D.R., G.A., and R.S. All authors have read and agreed to the published version of the manuscript.

Funding

This study was partly carried out within the MOST-Sustainable Mobility Center and received funding from the European Union Next-GenerationEU (PIANO NAZIONALE DI RIPRESA E RESILIENZA (PNRR)-MISSIONE 4 COMPONENTE 2, INVESTIMENTO 1.4—D.D. 1033 17/06/2022, CN00000023). The project was also partially funded under the National Recovery and Resilience Plan (NRRP), Mission 4 Component 2 Investment 1.3 - Call for tender No. 1561 of 11.10.2022 of Ministero dell’Università e della Ricerca (MUR); funded by the European Union-NextGenerationEU. The work was partially supported by the Ministero dell’Università e della Ricerca (MUR) in the framework of the FoReLab project (Departments of Excellence). This manuscript reflects only the authors’ views and opinions, neither the European Union nor the European Commission can be considered responsible for them.

Data Availability Statement

The raw data supporting the conclusions of this article will be made available by the authors on request.

Conflicts of Interest

Authors Riccardo Di Dio and Gianluca Aurilio were employed by the company Marelli Europe S.p.A. Author Davide Cavaliere was employed by the company Marelli Corporation. The remaining authors declare that the research was conducted in the absence of any commercial or financial relationships that could be construed as a potential conflict of interest.

References

  1. Suganya, R.; Leo Joseph, L.M.I.; Kollem, S. Understanding lithium-ion battery management systems in electric vehicles: Environmental and health impacts, comparative study, and future trends: A review. Results Eng. 2024, 24, 103047. [Google Scholar] [CrossRef]
  2. Jia, Z.; Yin, J.; Cao, Z.; Wu, L.; Wei, N.; Zhang, Y.; Jiang, Z.; Guo, D.; Zhang, Q.; Mao, H. Regional vehicle energy consumption evaluation framework to quantify the benefits of vehicle electrification in plateau city: A case study of Xining, China. Appl. Energy 2025, 377, 124626. [Google Scholar] [CrossRef]
  3. Ding, X.; Zhou, Q.; Li, X.; Xiong, X. Fast-charging anodes for lithium ion batteries: Progress and challenges. Chem. Commun. 2024, 60, 2472–2488. [Google Scholar] [CrossRef] [PubMed]
  4. Baronti, F.; Di Rienzo, R.; Moras, R.; Roncella, R.; Saletti, R.; Pede, G.; Vellucci, F. Implementation of the fast charging concept for electric local public transport: The case-study of a minibus. In Proceedings of the 2015 IEEE 13th International Conference on Industrial Informatics (INDIN), Cambridge, UK, 22–24 July 2015; pp. 1284–1289. [Google Scholar] [CrossRef]
  5. Di Rienzo, R.; Baronti, F.; Vellucci, F.; Cignini, F.; Ortenzi, F.; Pede, G.; Roncella, R.; Saletti, R. Experimental analysis of an electric minibus with small battery and fast charge policy. In Proceedings of the 2016 International Conference on Electrical Systems for Aircraft, Railway, Ship Propulsion and Road Vehicles & International Transportation Electrification Conference (ESARS-ITEC), Toulouse, France, 2–4 November 2016; pp. 1–6. [Google Scholar] [CrossRef]
  6. He, Y.; Deng, Z.; Chen, J.; Li, W.; Zhou, J.; Xiang, F.; Hu, X. State-of-health estimation for fast-charging lithium-ion batteries based on a short charge curve using graph convolutional and long short-term memory networks. J. Energy Chem. 2024, 98, 1–11. [Google Scholar] [CrossRef]
  7. Fan, Y.; Li, Y.; Zhao, J.; Wang, L.; Yan, C.; Wu, X.; Wang, J.; Gao, G.; Ren, Z.; Li, S.; et al. A novel lithium-ion battery state-of-health estimation method for fast-charging scenarios based on an improved multi-feature extraction and bagging temporal attention network. J. Energy Storage 2024, 99, 113396. [Google Scholar] [CrossRef]
  8. Epding, B.; Rumberg, B.; Mense, M.; Jahnke, H.; Kwade, A. Aging-Optimized Fast Charging of Lithium Ion Cells Based on Three-Electrode Cell Measurements. Energy Technol. 2020, 8, 2000457. [Google Scholar] [CrossRef]
  9. Kalk, A.; Leuthner, L.; Kupper, C.; Hiller, M. An Aging-Optimized State-of-Charge-Controlled Multi-Stage Constant Current (MCC) Fast Charging Algorithm for Commercial Li-Ion Battery Based on Three-Electrode Measurements. Batteries 2024, 10, 267. [Google Scholar] [CrossRef]
  10. Zhang, D.; Zhong, C.; Xu, P.; Tian, Y. Deep Learning in the State of Charge Estimation for Li-Ion Batteries of Electric Vehicles: A Review. Machines 2022, 10, 912. [Google Scholar] [CrossRef]
  11. Hossain Lipu, M.; Ansari, S.; Miah, M.S.; Meraj, S.T.; Hasan, K.; Shihavuddin, A.; Hannan, M.; Muttaqi, K.M.; Hussain, A. Deep learning enabled state of charge, state of health and remaining useful life estimation for smart battery management system: Methods, implementations, issues and prospects. J. Energy Storage 2022, 55, 105752. [Google Scholar] [CrossRef]
  12. Li, Y.; Luo, L.; Zhang, C.; Liu, H. State of Health Assessment for Lithium-Ion Batteries Using Incremental Energy Analysis and Bidirectional Long Short-Term Memory. World Electr. Veh. J. 2023, 14, 188. [Google Scholar] [CrossRef]
  13. Tian, J.; Chen, C.; Shen, W.; Sun, F.; Xiong, R. Deep Learning Framework for Lithium-ion Battery State of Charge Estimation: Recent Advances and Future Perspectives. Energy Storage Mater. 2023, 61, 102883. [Google Scholar] [CrossRef]
  14. Zhang, Z.; Min, H.; Guo, H.; Yu, Y.; Sun, W.; Jiang, J.; Zhao, H. State of health estimation method for lithium-ion batteries using incremental capacity and long short-term memory network. J. Energy Storage 2023, 64, 107063. [Google Scholar] [CrossRef]
  15. Di Dio, R.; Aurilio, G.; Di Rienzo, R.; Saletti, R. Machine Learning for SOC Estimation in Li-Ion Batteries. In Proceedings of the 2024 Applications in Electronics Pervading Industry, Environment and Society (Applepies), Turin, Italy, 19–20 September 2024; pp. 386–391. [Google Scholar] [CrossRef]
  16. Alamin, K.S.S.; Chen, Y.; Macii, E.; Poncino, M.; Vinco, S. A Machine Learning-based Digital Twin for Electric Vehicle Battery Modeling. In Proceedings of the 2022 IEEE International Conference on Omni-layer Intelligent Systems (COINS), Barcelona, Spain, 1–3 August 2022; pp. 1–6. [Google Scholar] [CrossRef]
  17. Eleftheriadis, P.; Giazitzis, S.; Leva, S.; Ogliari, E. Data-Driven Methods for the State of Charge Estimation of Lithium-Ion Batteries: An Overview. Forecasting 2023, 5, 576–599. [Google Scholar] [CrossRef]
  18. Azkue, M.; Miguel, E.; Martinez-Laserna, E.; Oca, L.; Iraola, U. Creating a Robust SoC Estimation Algorithm Based on LSTM Units and Trained with Synthetic Data. World Electr. Veh. J. 2023, 14, 197. [Google Scholar] [CrossRef]
  19. Hattouti, L.A.; Di Rienzo, R.; Nicodemo, N.; Verani, A.; Baronti, F.; Roncella, R.; Saletti, R. Comparison of Lithium-Ion Battery SoC Estimation Accuracy of LSTM Neural Network Trained with Experimental and Synthetic Datasets. Lect. Notes Electr. Eng. 2024, 1110, 405–410. [Google Scholar] [CrossRef]
  20. Tao, S.; Jiang, B.; Wei, X.; Dai, H. A Systematic and Comparative Study of Distinct Recurrent Neural Networks for Lithium-Ion Battery State-of-Charge Estimation in Electric Vehicles. Energies 2023, 16, 2008. [Google Scholar] [CrossRef]
  21. Chung, J.; Gulcehre, C.; Cho, K.; Bengio, Y. Empirical Evaluation of Gated Recurrent Neural Networks on Sequence Modeling. arXiv 2014, arXiv:1412.3555. [Google Scholar]
  22. Hochreiter, S.; Schmidhuber, J. Long short-term memory. Neural Comput. 1997, 9, 1735–1780. [Google Scholar] [CrossRef]
  23. Guo, S.; Ma, L. A comparative study of different deep learning algorithms for lithium-ion batteries on state-of-charge estimation. Energy 2023, 263, 125872. [Google Scholar] [CrossRef]
  24. Islameka, M.; Budiman, B.A.; Juangsa, F.B.; Aziz, M. 5-Energy management systems for battery electric vehicles. In Emerging Trends in Energy Storage Systems and Industrial Applications; Prabhansu, Kumar, N., Eds.; Academic Press: Cambridge, MA, USA, 2023; pp. 113–150. [Google Scholar] [CrossRef]
  25. Morello, R.; Di Rienzo, R.; Roncella, R.; Saletti, R.; Baronti, F. Hardware-in-the-Loop Platform for Assessing Battery State Estimators in Electric Vehicles. IEEE Access 2018, 6, 68210–68220. [Google Scholar] [CrossRef]
  26. Aurilio, G.; Gallo, D.; Landi, C.; Luiso, M.; Rosano, A.; Landi, M.; Paciello, V. A battery equivalent-circuit model and an advanced technique for parameter estimation. In Proceedings of the 2015 IEEE International Instrumentation and Measurement Technology Conference (I2MTC) Proceedings, Pisa, Italy, 11–14 May 2015; pp. 1705–1710. [Google Scholar] [CrossRef]
  27. Mawuntu, N.N.; Mu, B.Q.; Doukhi, O.; Lee, D.J. Modeling of the Battery Pack and Battery Management System towards an Integrated Electric Vehicle Application. Energies 2023, 16, 7165. [Google Scholar] [CrossRef]
  28. Kim, T.; Qiao, W.; Qu, L. Real-time state of charge and electrical impedance estimation for lithium-ion batteries based on a hybrid battery model. In Proceedings of the 2013 Twenty-Eighth Annual IEEE Applied Power Electronics Conference and Exposition (APEC), Long Beach, CA, USA, 17–21 March 2013; pp. 563–568. [Google Scholar] [CrossRef]
  29. Redondo-Iglesias, E.; Venet, P.; Pelissier, S. Calendar and cycling ageing combination of batteries in electric vehicles. Microelectron. Reliab. 2018, 88–90, 1212–1215. [Google Scholar] [CrossRef]
  30. Ramadass, P.; Haran, B.; White, R.; Popov, B.N. Mathematical modeling of the capacity fade of Li-ion cells. J. Power Sources 2003, 123, 230–240. [Google Scholar] [CrossRef]
  31. Ning, G.; Haran, B.; Popov, B.N. Capacity fade study of lithium-ion batteries cycled at high discharge rates. J. Power Sources 2003, 117, 160–169. [Google Scholar] [CrossRef]
  32. Schröer, P.; van Faassen, H.; Nemeth, T.; Kuipers, M.; Sauer, D.U. Challenges in modeling high power lithium titanate oxide cells in battery management systems. J. Energy Storage 2020, 28, 101189. [Google Scholar] [CrossRef]
  33. Shi, D.; Zhao, J.; Wang, Z.; Zhao, H.; Eze, C.; Wang, J.; Lian, Y.; Burke, A.F. Cloud-Based Deep Learning for Co-Estimation of Battery State of Charge and State of Health. Energies 2023, 16, 3855. [Google Scholar] [CrossRef]
  34. Arandhakar, S.; Nakka, J. State of charge estimation of lithium ion battery for electric vehicle using cutting edge machine learning algorithms: A review. J. Energy Storage 2024, 103, 114281. [Google Scholar] [CrossRef]
Figure 1. Block diagram of the EV model used to create the synthetic database.
Batteries 11 00235 g001
Figure 2. 2 RC-group equivalent circuit model of the battery cell.
Batteries 11 00235 g002
Figure 3. Block diagram of the developed co-estimation algorithm, where DT stands for Decision Tree.
Batteries 11 00235 g003
Figure 4. Comparison between model and estimated SOC values in the first discharge and charge cycle with a fresh cell (left) and in the last discharge and charge cycle when the cell SOHc has reached 60% (right). Since the current profile does not change during battery life, the cycle time is reduced accordingly.
Batteries 11 00235 g004
Figure 5. Comparison between model and estimated R 0 values in the first discharge and charge cycle with a fresh cell (left) and in the last discharge and charge cycle, when the cell SOHc is 60% (right).
Batteries 11 00235 g005
Figure 6. Comparison between model and estimated SOC, R 0 , and SOHc values during cell aging.
Batteries 11 00235 g006
Table 1. Dynamic vehicle parameters.
ParameterValue
Kerb weight M1525 kg
Surface area S2.27 m2
Drag coefficient C x 0.29
Rolling resistance R rolling 0.01
Air density ρ 1.2 kg/m3
Road slope α 0
Gravitational acceleration g9.82 m/s2
System efficiency η 0.7
Table 2. Parameters of the aging model of the cell.
SymbolDescriptionValue
qElectron elementary charge 1.60217663 × 10 19 C
KBoltzmann constant 1.380649 × 10 23 m 2 k g s 2 K 1
b r Terminal resistance constant gain for voltage0.0594 V 1 s 1
c r Terminal resistance constant offset for voltage−0.0713 s 1
d r Terminal resistance temperature-dependent exponential increase0.4985 V
e r Terminal resistance constant gain for current2.5867 A 1
b c Terminal capacity constant gain for voltage0.0594 V 1 s 1
c c Terminal capacity constant offset for voltage−0.0713 s 1
d c Terminal capacity temperature-dependent exponential increase0.4985 V
e c Terminal capacity constant gain for current0.4533 A 1
Table 3. Standard driving cycles used to generate the synthetic dataset.
Drive CycleScenarioDistanceDurationAverage SpeedUse
(km) (min) (km/h)
La92shortUrban11.11641.8Training
J1015Urban6.41525.6Training
HWFETHighway16.81377.5Training
ArtMw150Motorway29.81899.5Training
ArtUrbanUrban5.01717.6Training
FTPUrban17.63134.1Validation
ArtRoadRural road17.21857.4Validation
WLTPMixed23.33046.5Test
Table 4. Grid search for SOC estimation network with the validation dataset. The best-performing results are highlighted in bold.
Chunk SizeLearning RateHidden UnitsMAE (%)MAPE (%)RMSE (%)
1000.01203.05537.76884.2216
1000.013227.470780.683532.9009
1000.01506.387025.102410.0717
1000.022017.278231.832219.9990
1000.023220.494333.511724.5322
10000.01501.57174.89871.8302
10000.02201.65365.11772.0221
10000.02323.95637.80925.2773
10000.025024.536544.814628.2875
Table 5. RMSE, MAE, and MAPE obtained by the co-estimation algorithm in the WLTP drive cycle at 25 C and 35 C.
TemperatureRMSEMAEMAPE
SOC25 C2.0%1.5%3.4%
35 C1.8%1.3%3.0%
R 0 25 C80 μΩ58 μΩ3.8%
35 C71 μΩ55 μΩ4.2%
SOHc25 C2.9%2.2%3.22%
35 C2.9%2.4%3.3%
Table 6. Comparison of obtained results with those in the literature.
Ref.AlgorithmConditionRMSE (%)MAE (%)MAPE (%)
ourLSTMFresh cell, 25 C0.30.20.4
Fresh cell, noise, 25 C1.00.81.7
Fresh cell, noise, 35 C0.90.71.5
SOH 60%, noise, 25 C2.92.24.2
SOH 60%, noise, 35 C2.41.93.7
[20]GRUFresh cell, 25 C6.34.915.8
SOH 98%, 25 C6.45.016.1
LSTMFresh cell, 25 C5.74.415.9
SOH 98%, 25 C5.74.516.2
BGRUFresh cell, 25 C5.44.514.7
SOH 98%, 25 C5.54.615.0
BLSTMFresh cell, 25 C4.53.614.1
SOH 98%, 25 C4.53.614.3
[23]FCNNFresh cell, 25 C3.12.34
Fresh cell, 40 C3.02.3
LSTMFresh cell, 25 C0.80.7
Fresh cell, 40 C0.60.5
GRUFresh cell, 25 C0.60.4
Fresh cell, 40 C0.50.3
TCNFresh cell, 25 C0.850.7
Fresh cell, 40 C0.60.4
[33]BERTFresh cell0.81 2.5
[34]FNNFresh cell2.24
GRUFresh cell1.13
LSTMFresh cell1.5
[18]LSTMFresh cell 1.64
Disclaimer/Publisher’s Note: The statements, opinions and data contained in all publications are solely those of the individual author(s) and contributor(s) and not of MDPI and/or the editor(s). MDPI and/or the editor(s) disclaim responsibility for any injury to people or property resulting from any ideas, methods, instructions or products referred to in the content.

