
GITT Limitations and EIS Insights into Kinetics of NMC622

 , , , , , , , , , , , , , , , , and
Abstract
1. Introduction
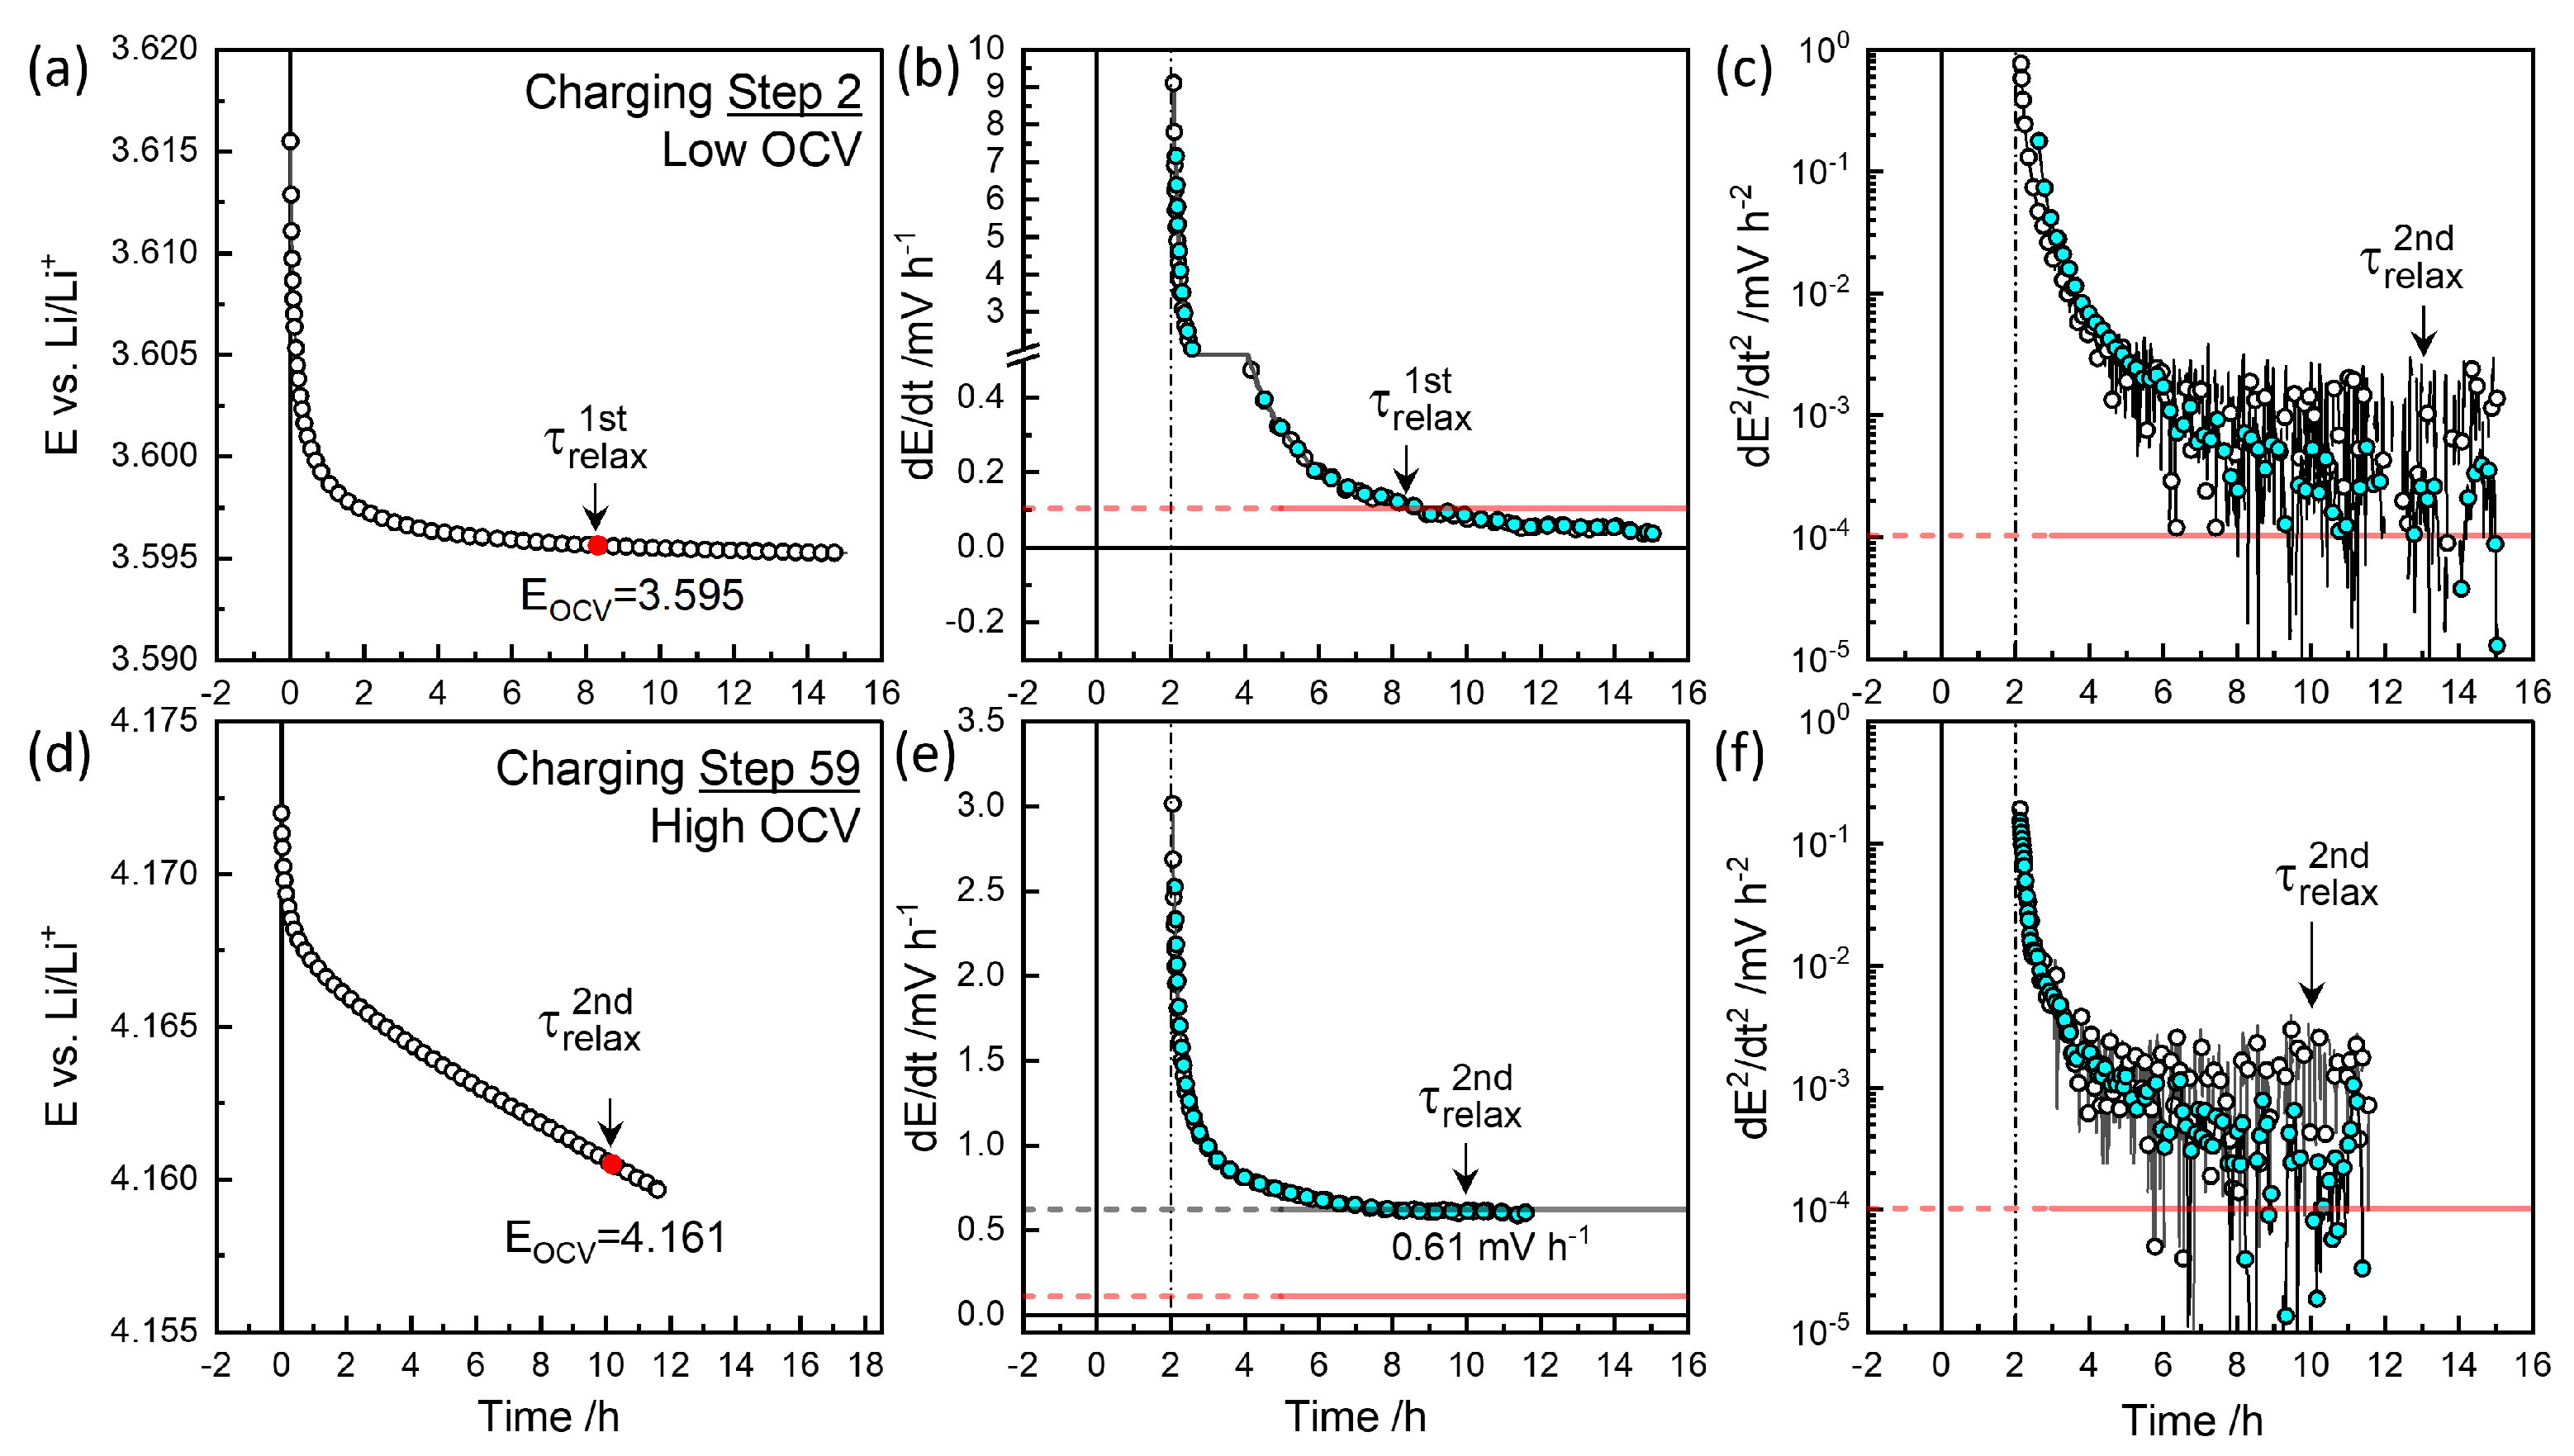
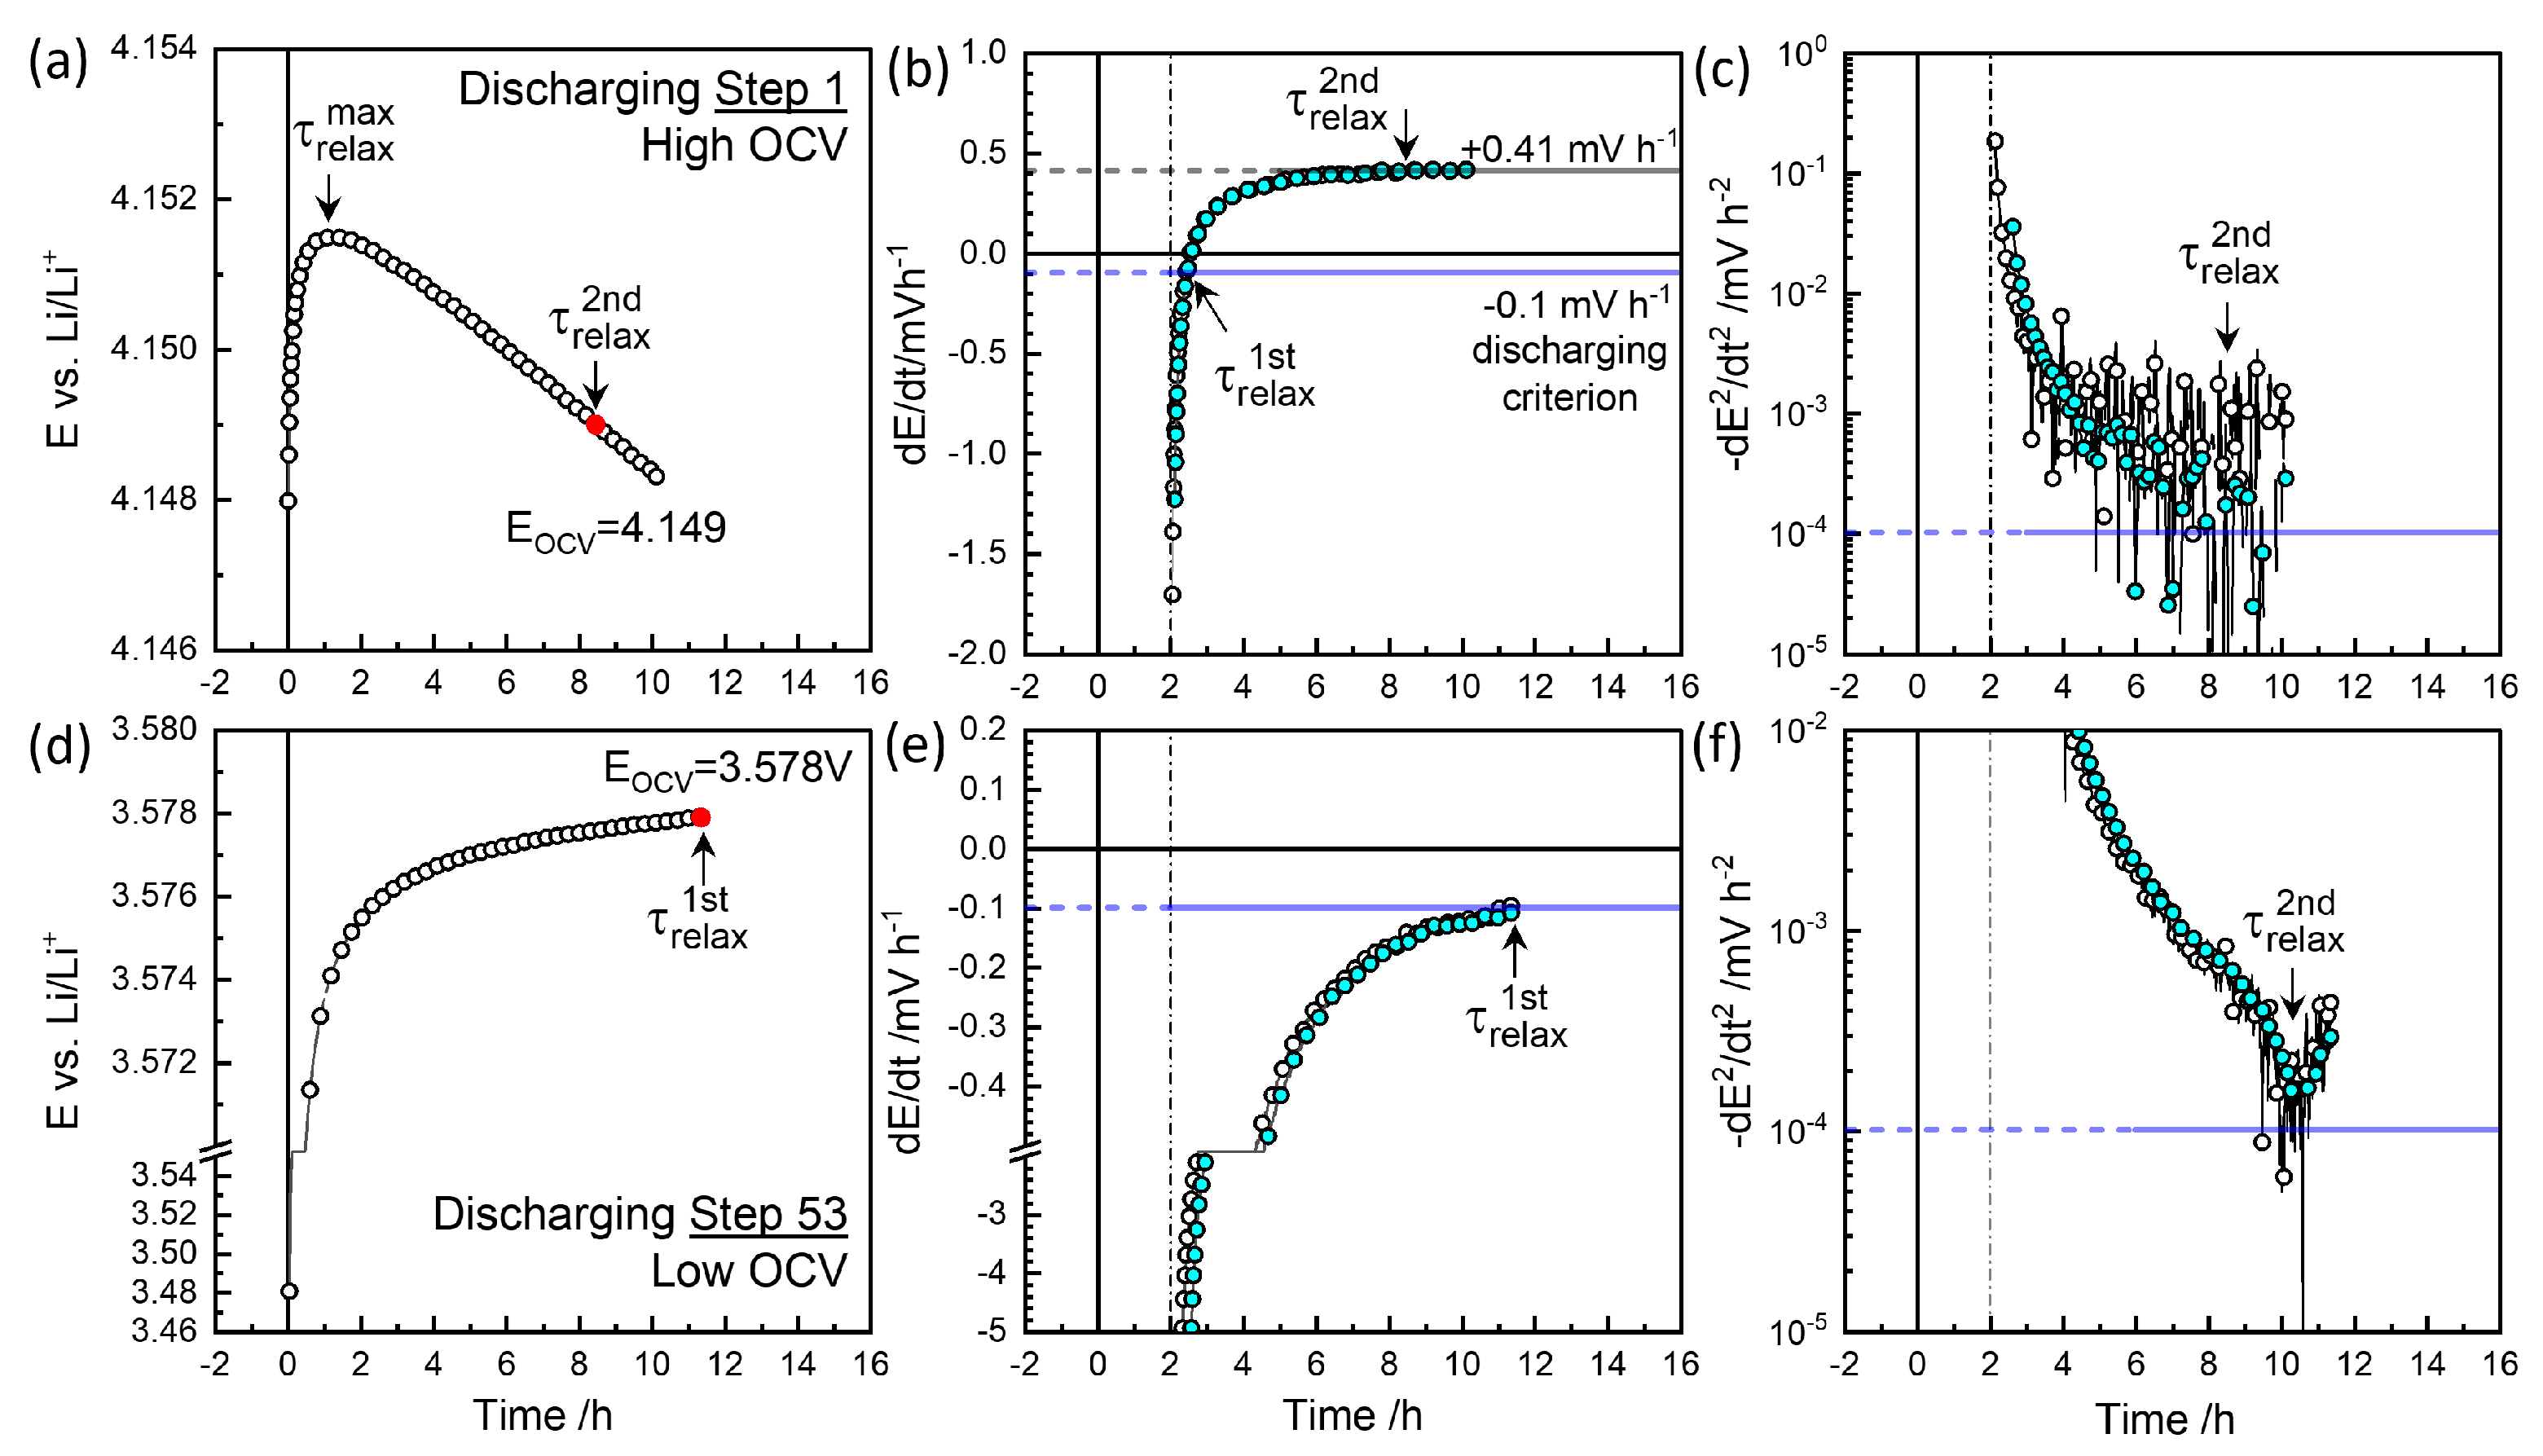
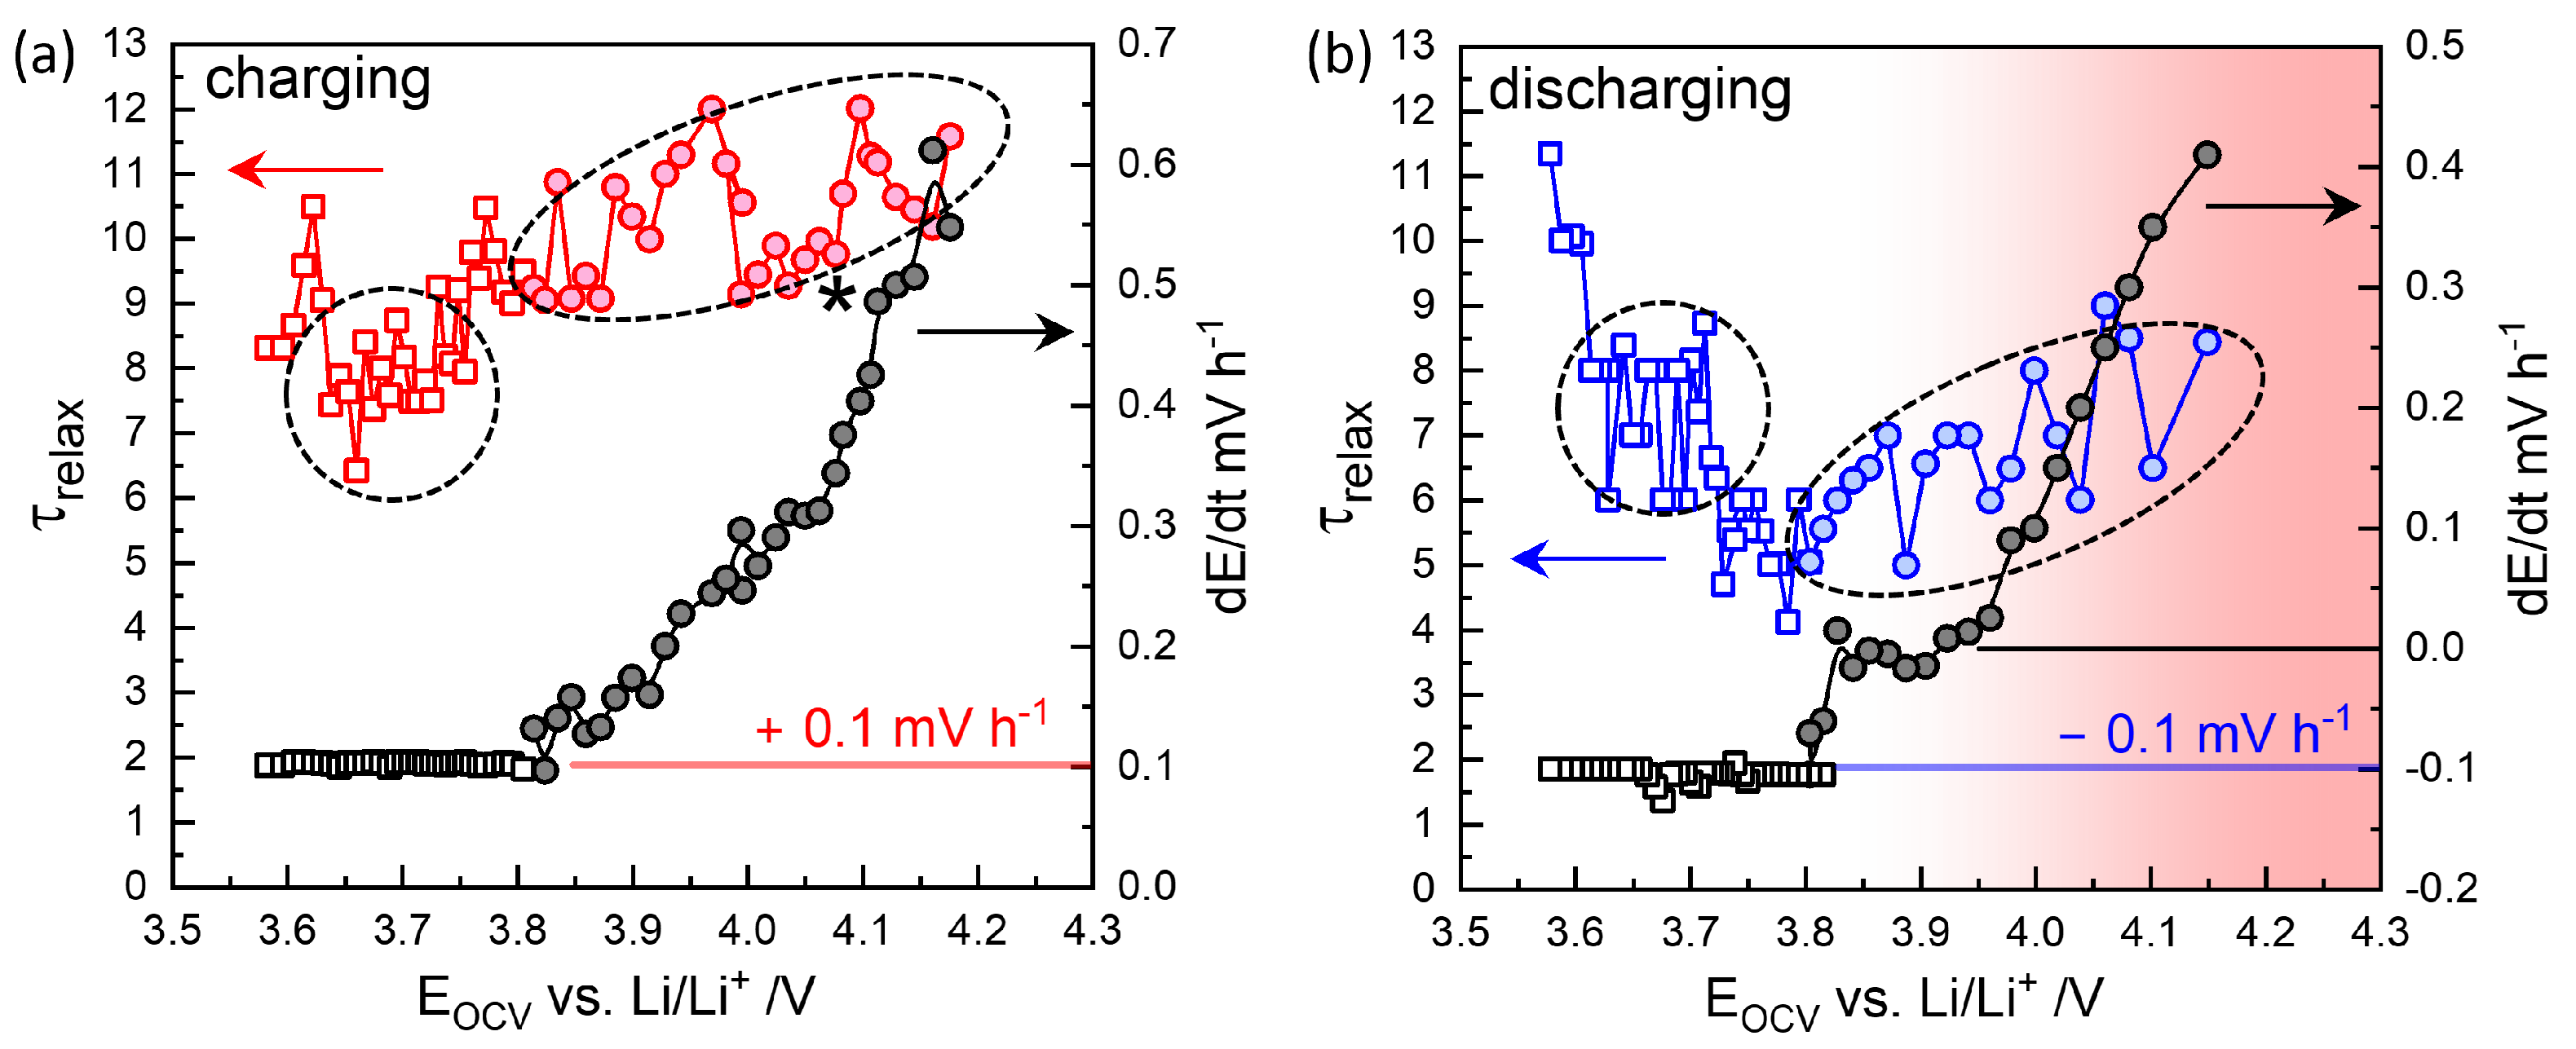
- Relaxation periods are typically set to a constant (e.g., 1 h [4,5,6,7,8]) in automated procedures provided by commercial potentio/galvanostats. However, these fixed relaxation times do not guarantee the attainment of equilibrium open-circuit voltages (OCVs), which is one of the main purposes of the GITT.
- The titration pulse must be short enough for the widely used relation from the dependence [1,3]. In many studies, the entire SOC range of battery electrodes, not the narrow regions of solid solution [1,2,3], is titrated. With a 0.1 C current, the pulse duration of 1 h requires 10 steps, 10 min 60 steps, and 1 min 600 steps. The pulse duration can be too long for the equation based on the short-time solution.
- The original GITT kinetic analysis was developed for thin-film electrodes for one-dimensional solid-state diffusion. However, the analysis has been widely used for battery electrodes, where the active material particles are dispersed and the pores between them are filled with the electrolyte. A three-dimensional spherical diffusion occurs for the individual particles, and the liquid-phase diffusion in the electrolyte is also present.
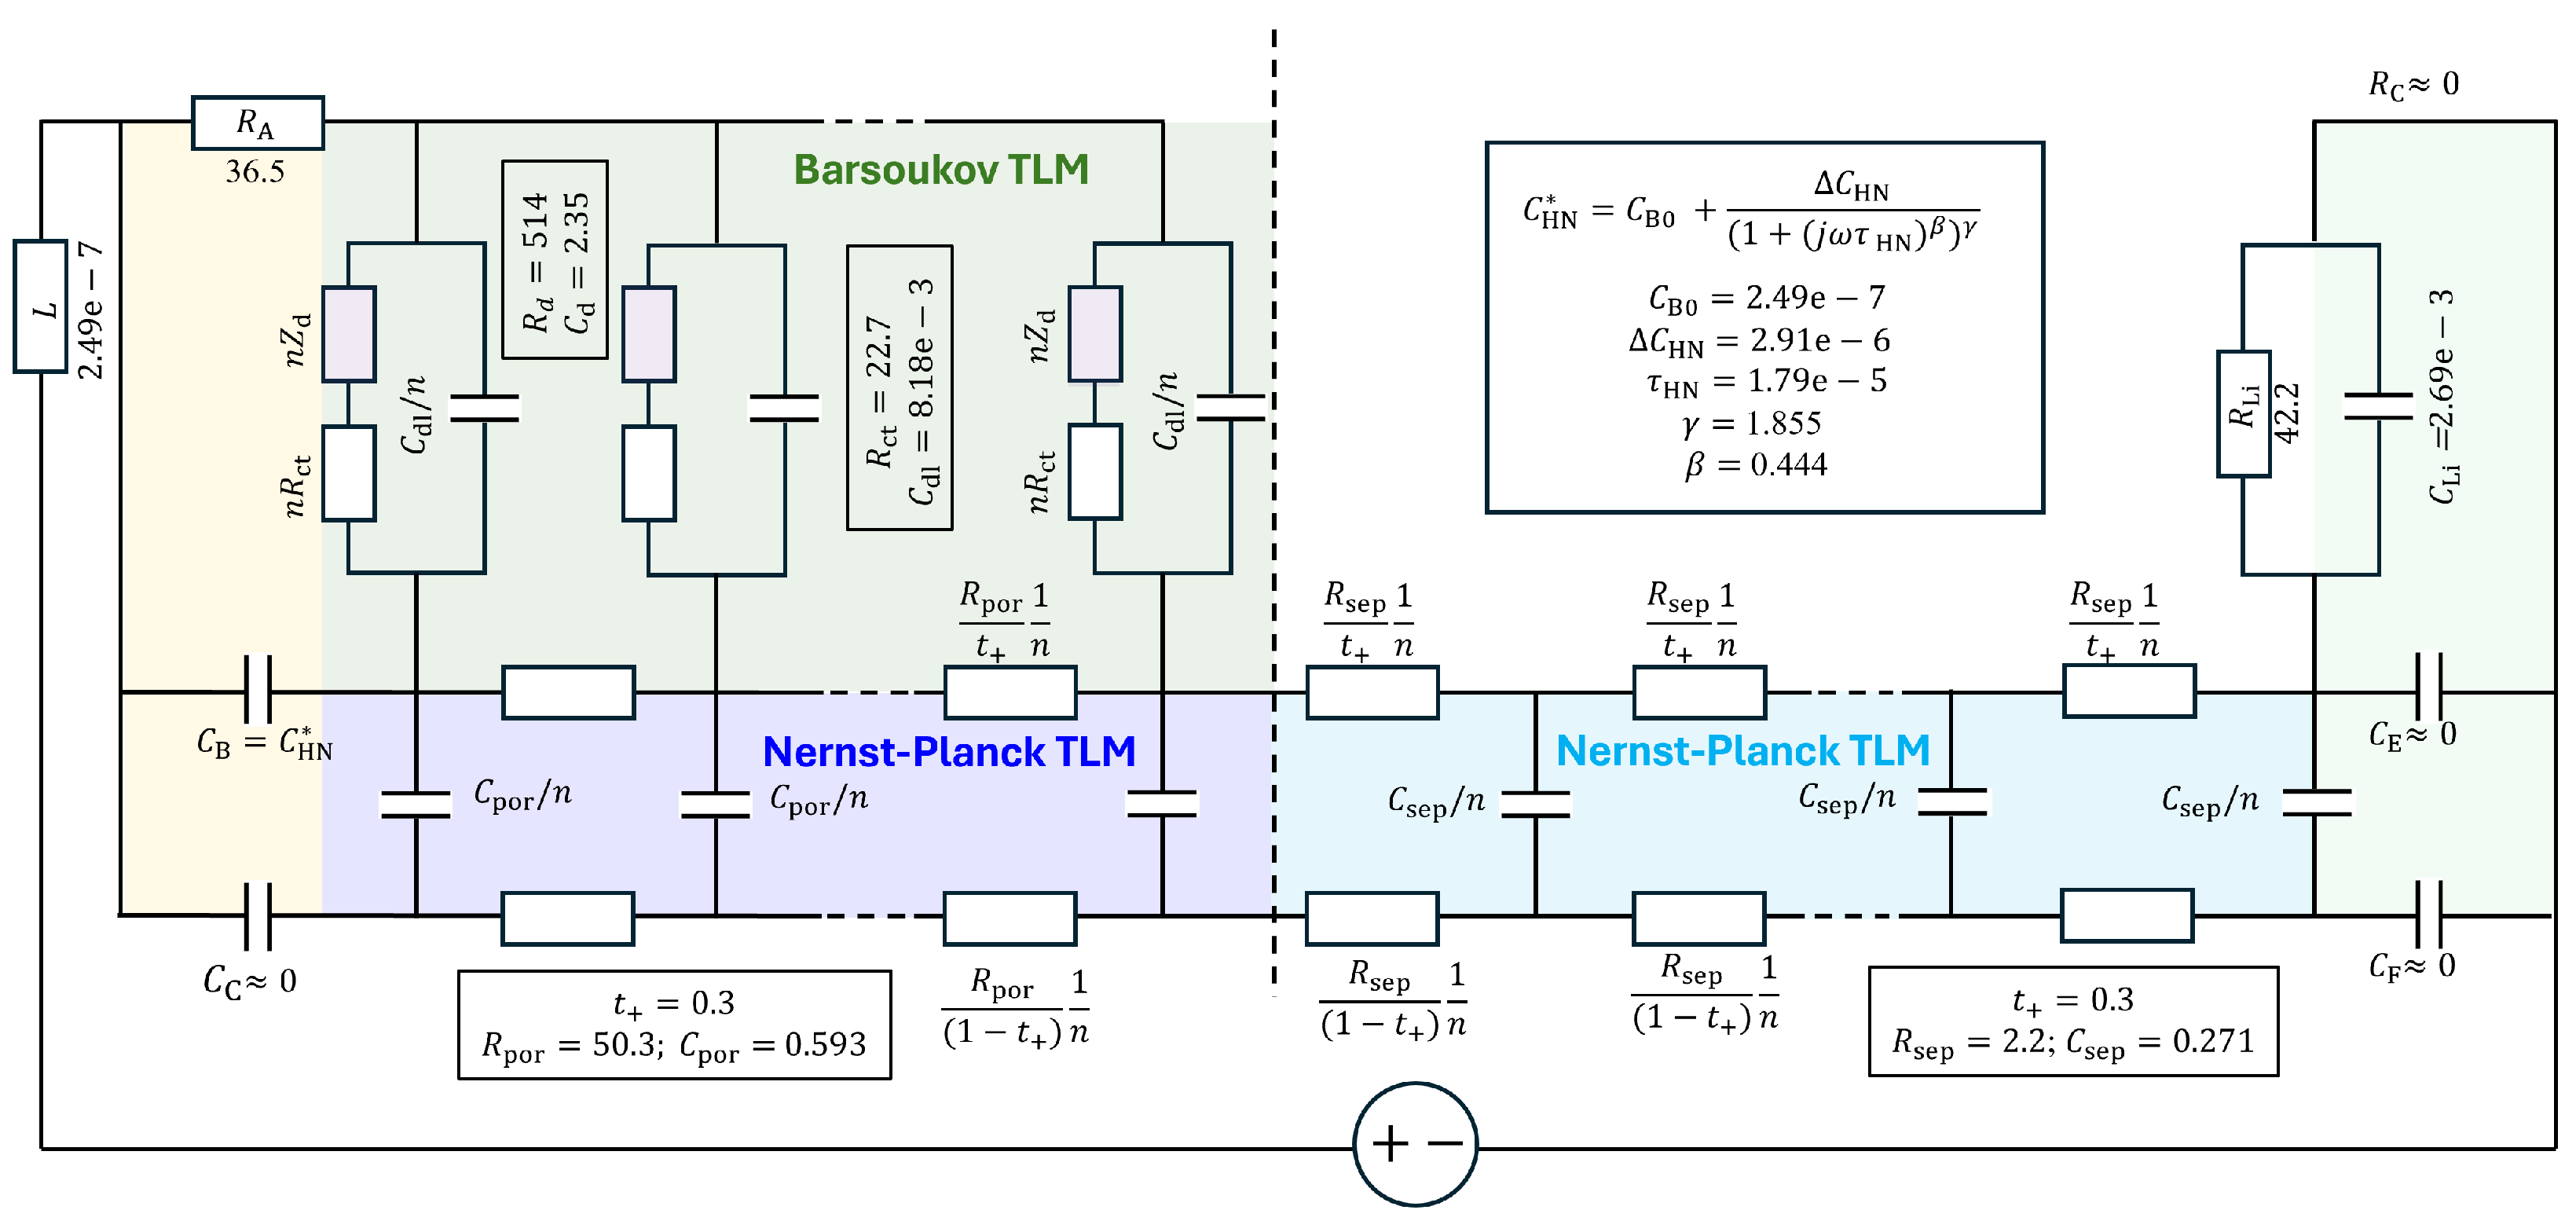
- The Randles circuit, originally used for the diffusion of redox species in the electrolyte [9], was used to determine the chemical diffusivity in thin-film electrodes by electrochemical impedance spectroscopy (EIS) [3,10]. While the Warburg response in the Randles circuit is an transmission line model (TLM) for one-dimensional diffusion in films, distributed responses in porous electrodes need to be represented by a TLM [11] that needs to incorporate solid-state diffusion in dispersed spherical particles.
2. Cell Preparation, Electrochemical Characterization, and Data Analysis
3. Galvanostatic Intermittent Titration Technique
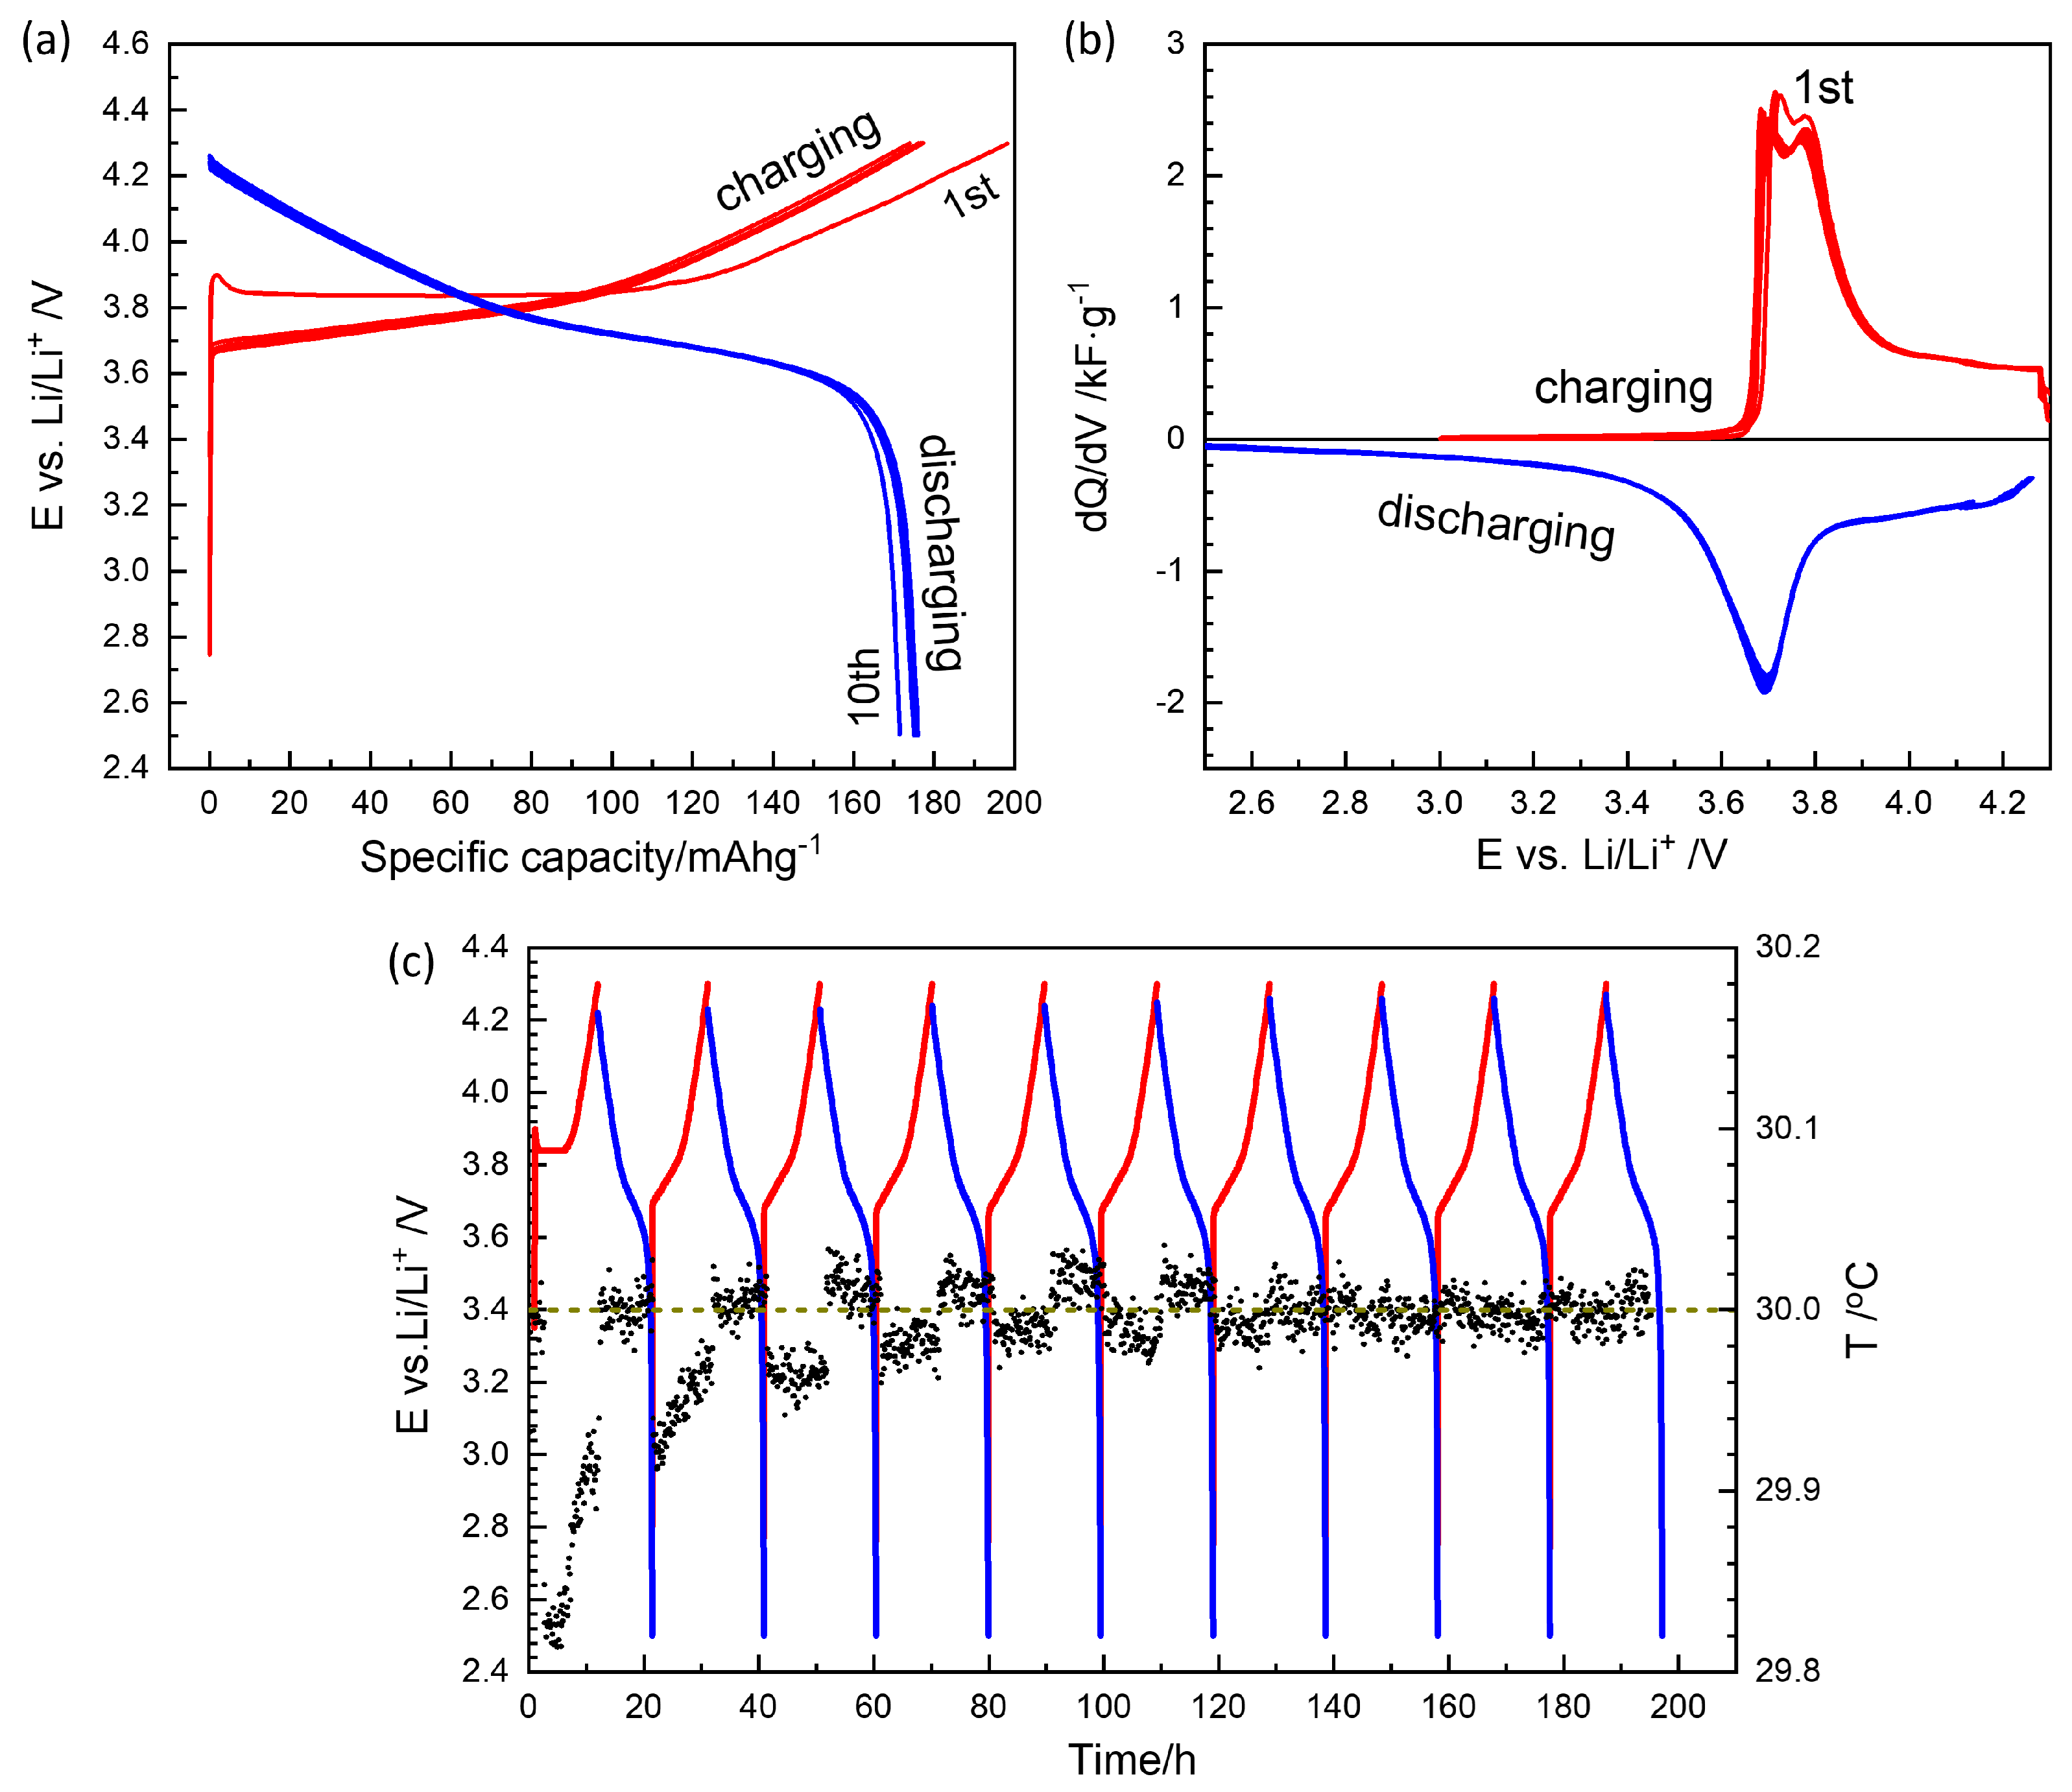
3.1. Formation Cycles
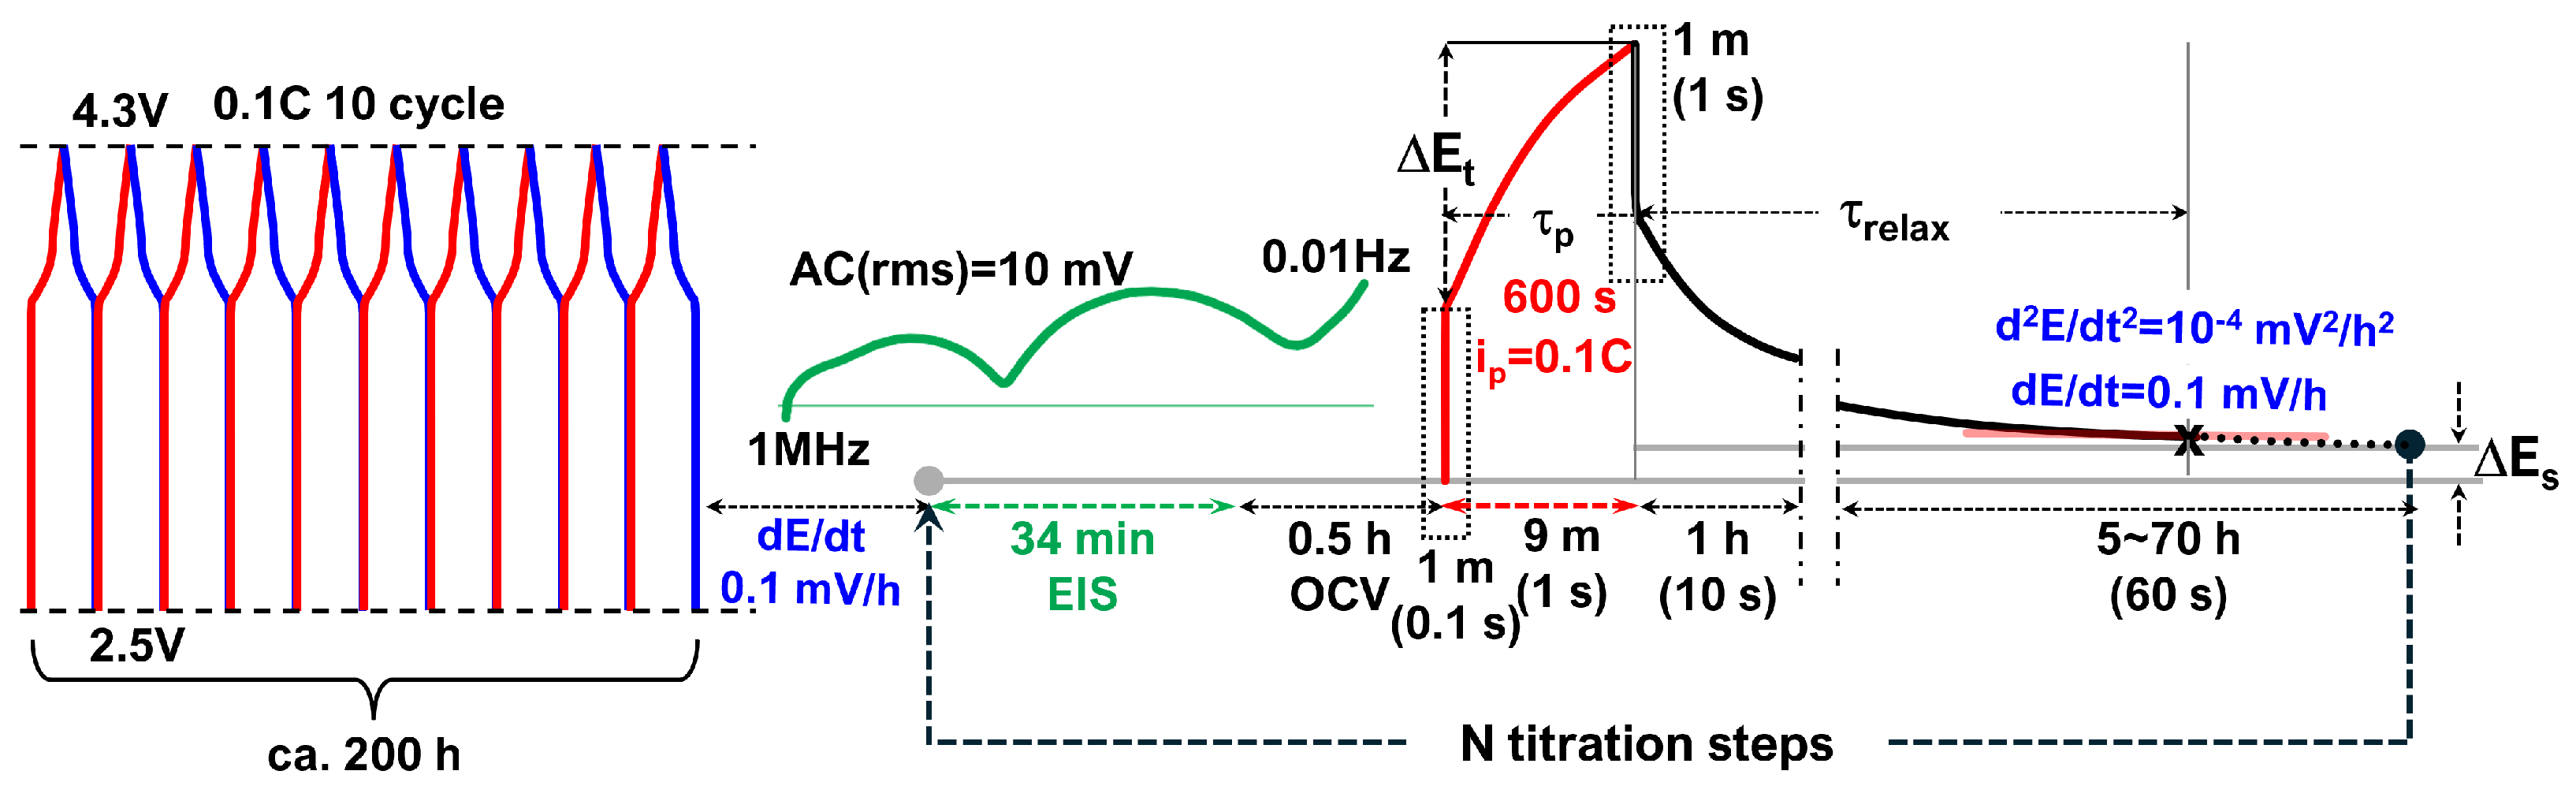
3.2. GITT Overview
- First minute: 0.1 s intervals (600 data points) to capture the fast initial voltage change.
- Next 9 min: 1 s intervals (540 points), resulting in a total of 1140 data points per titration step.
- Every second for 1 min (60 points) to capture the fast initial response.
- Every 10 s for 1 h (360 points).
- Every minute thereafter for long-term relaxation monitoring.
3.3. GITT for Equilibrium OCVs
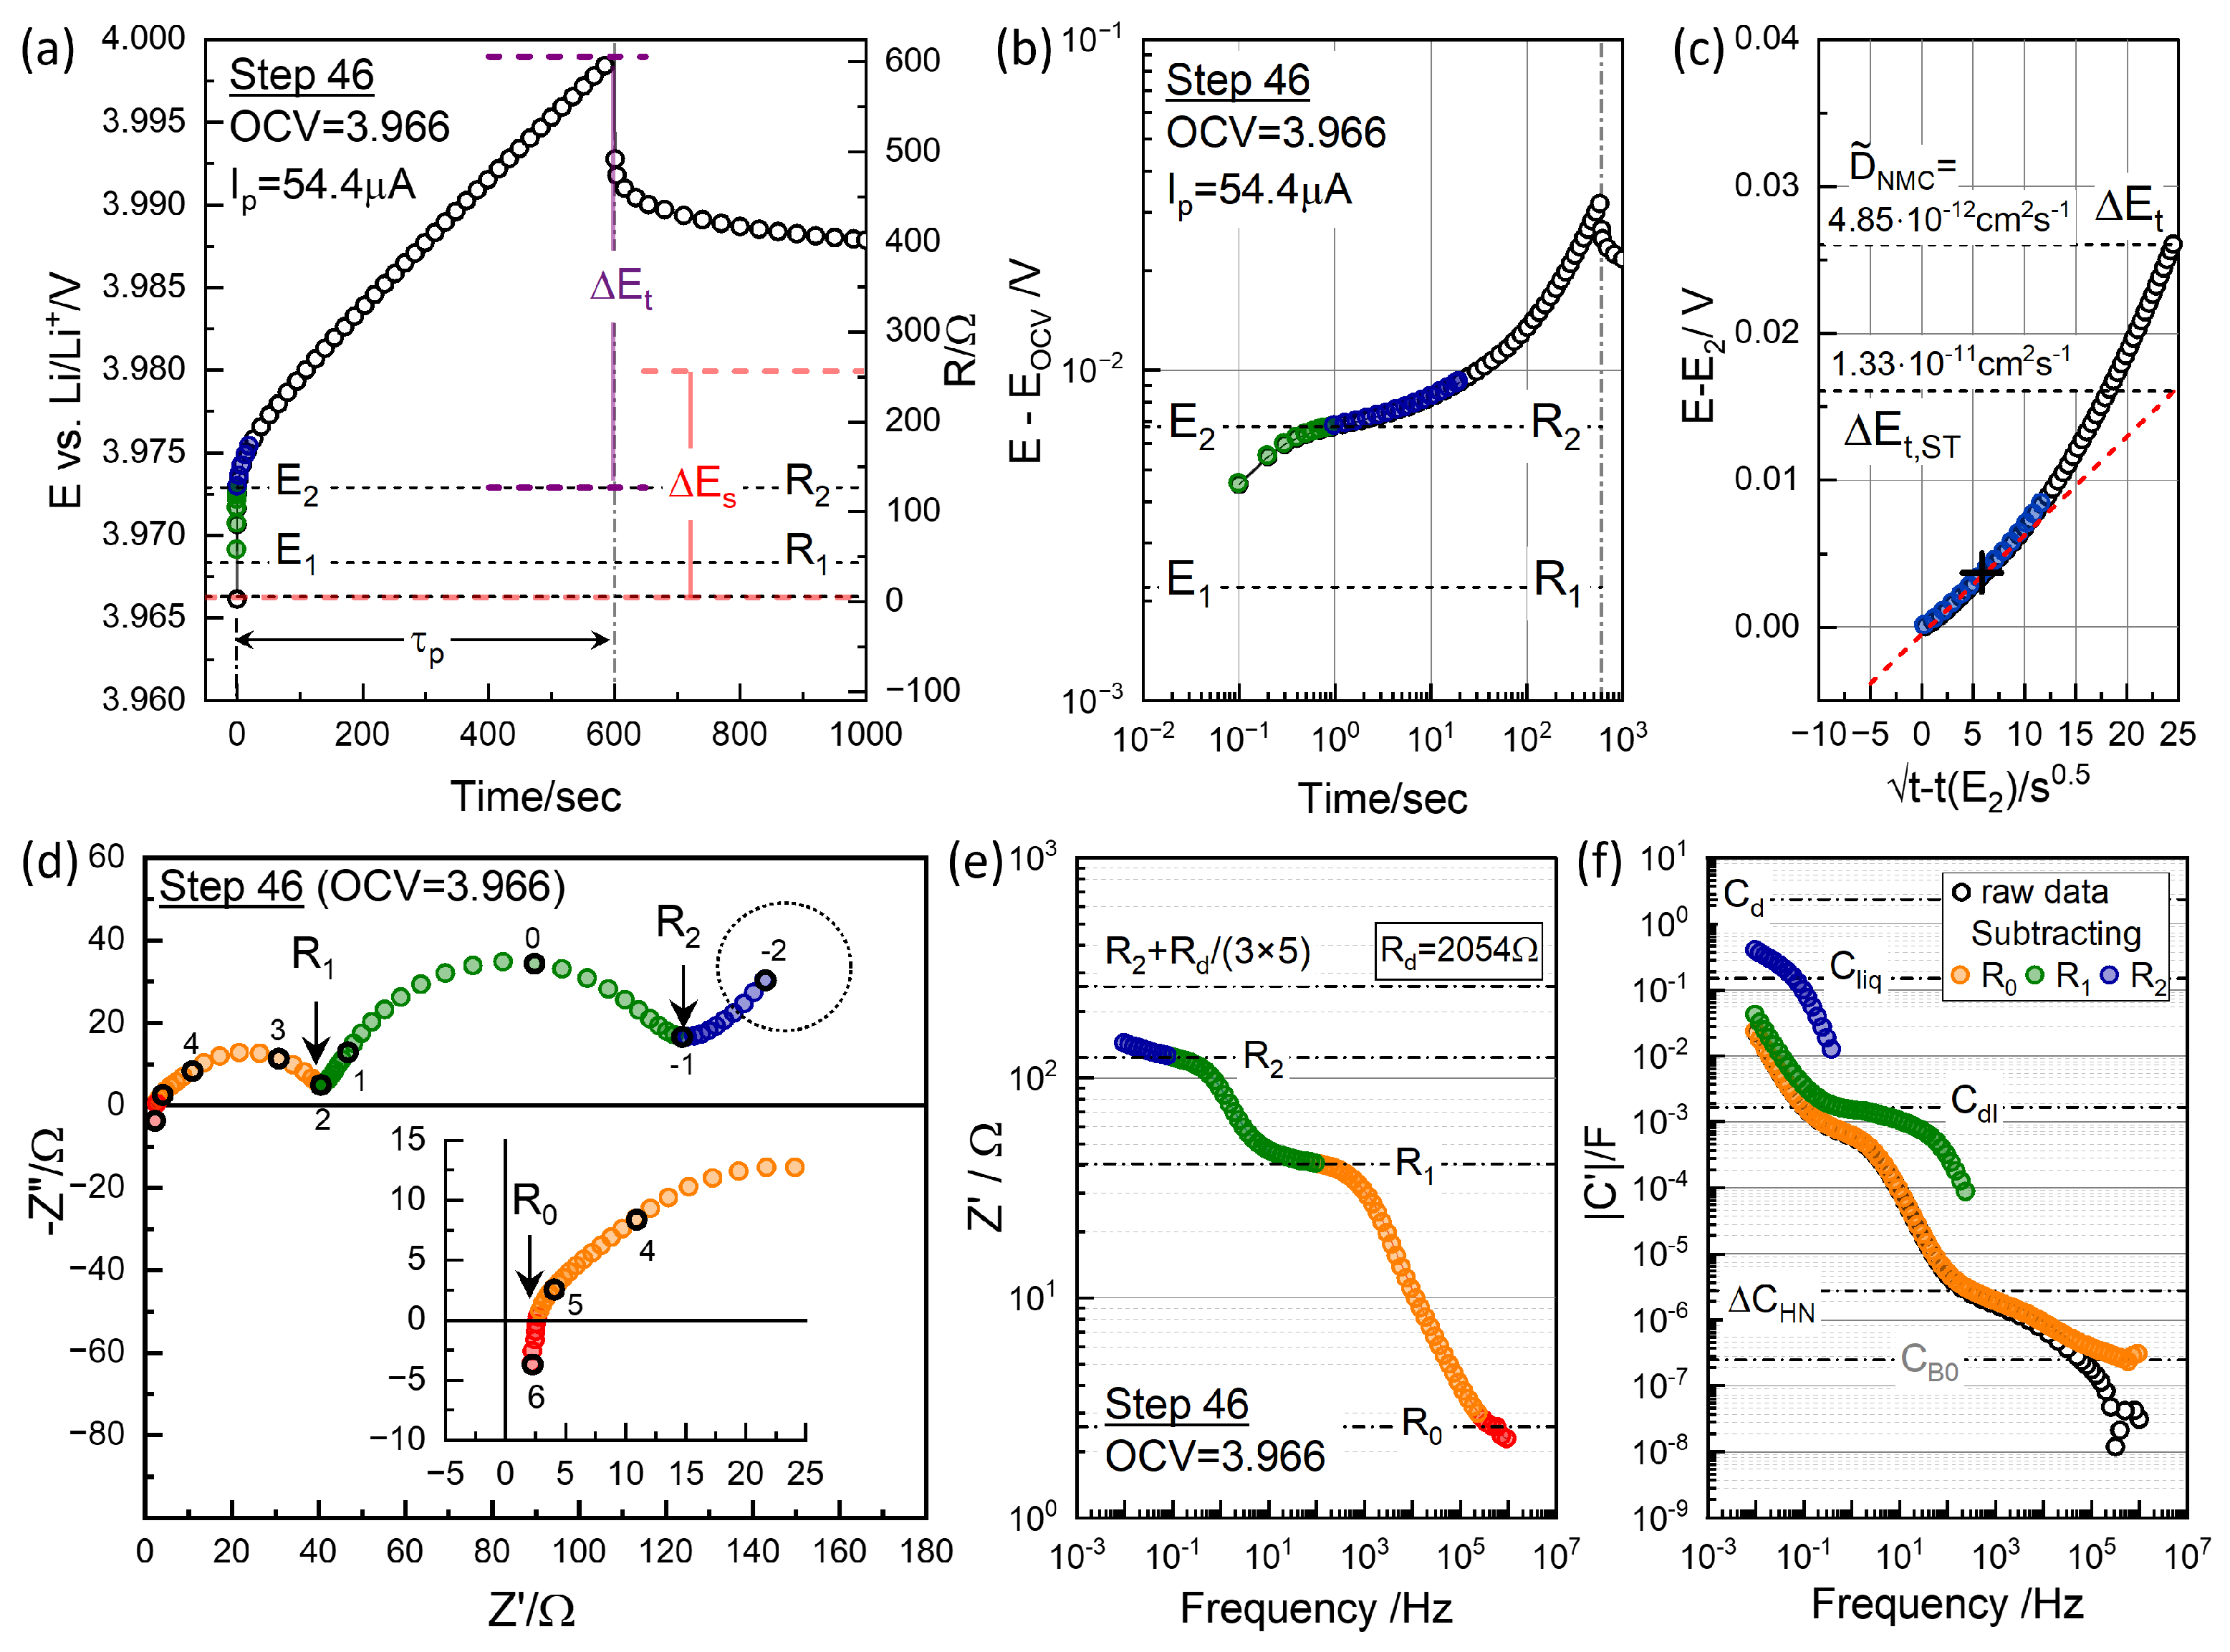
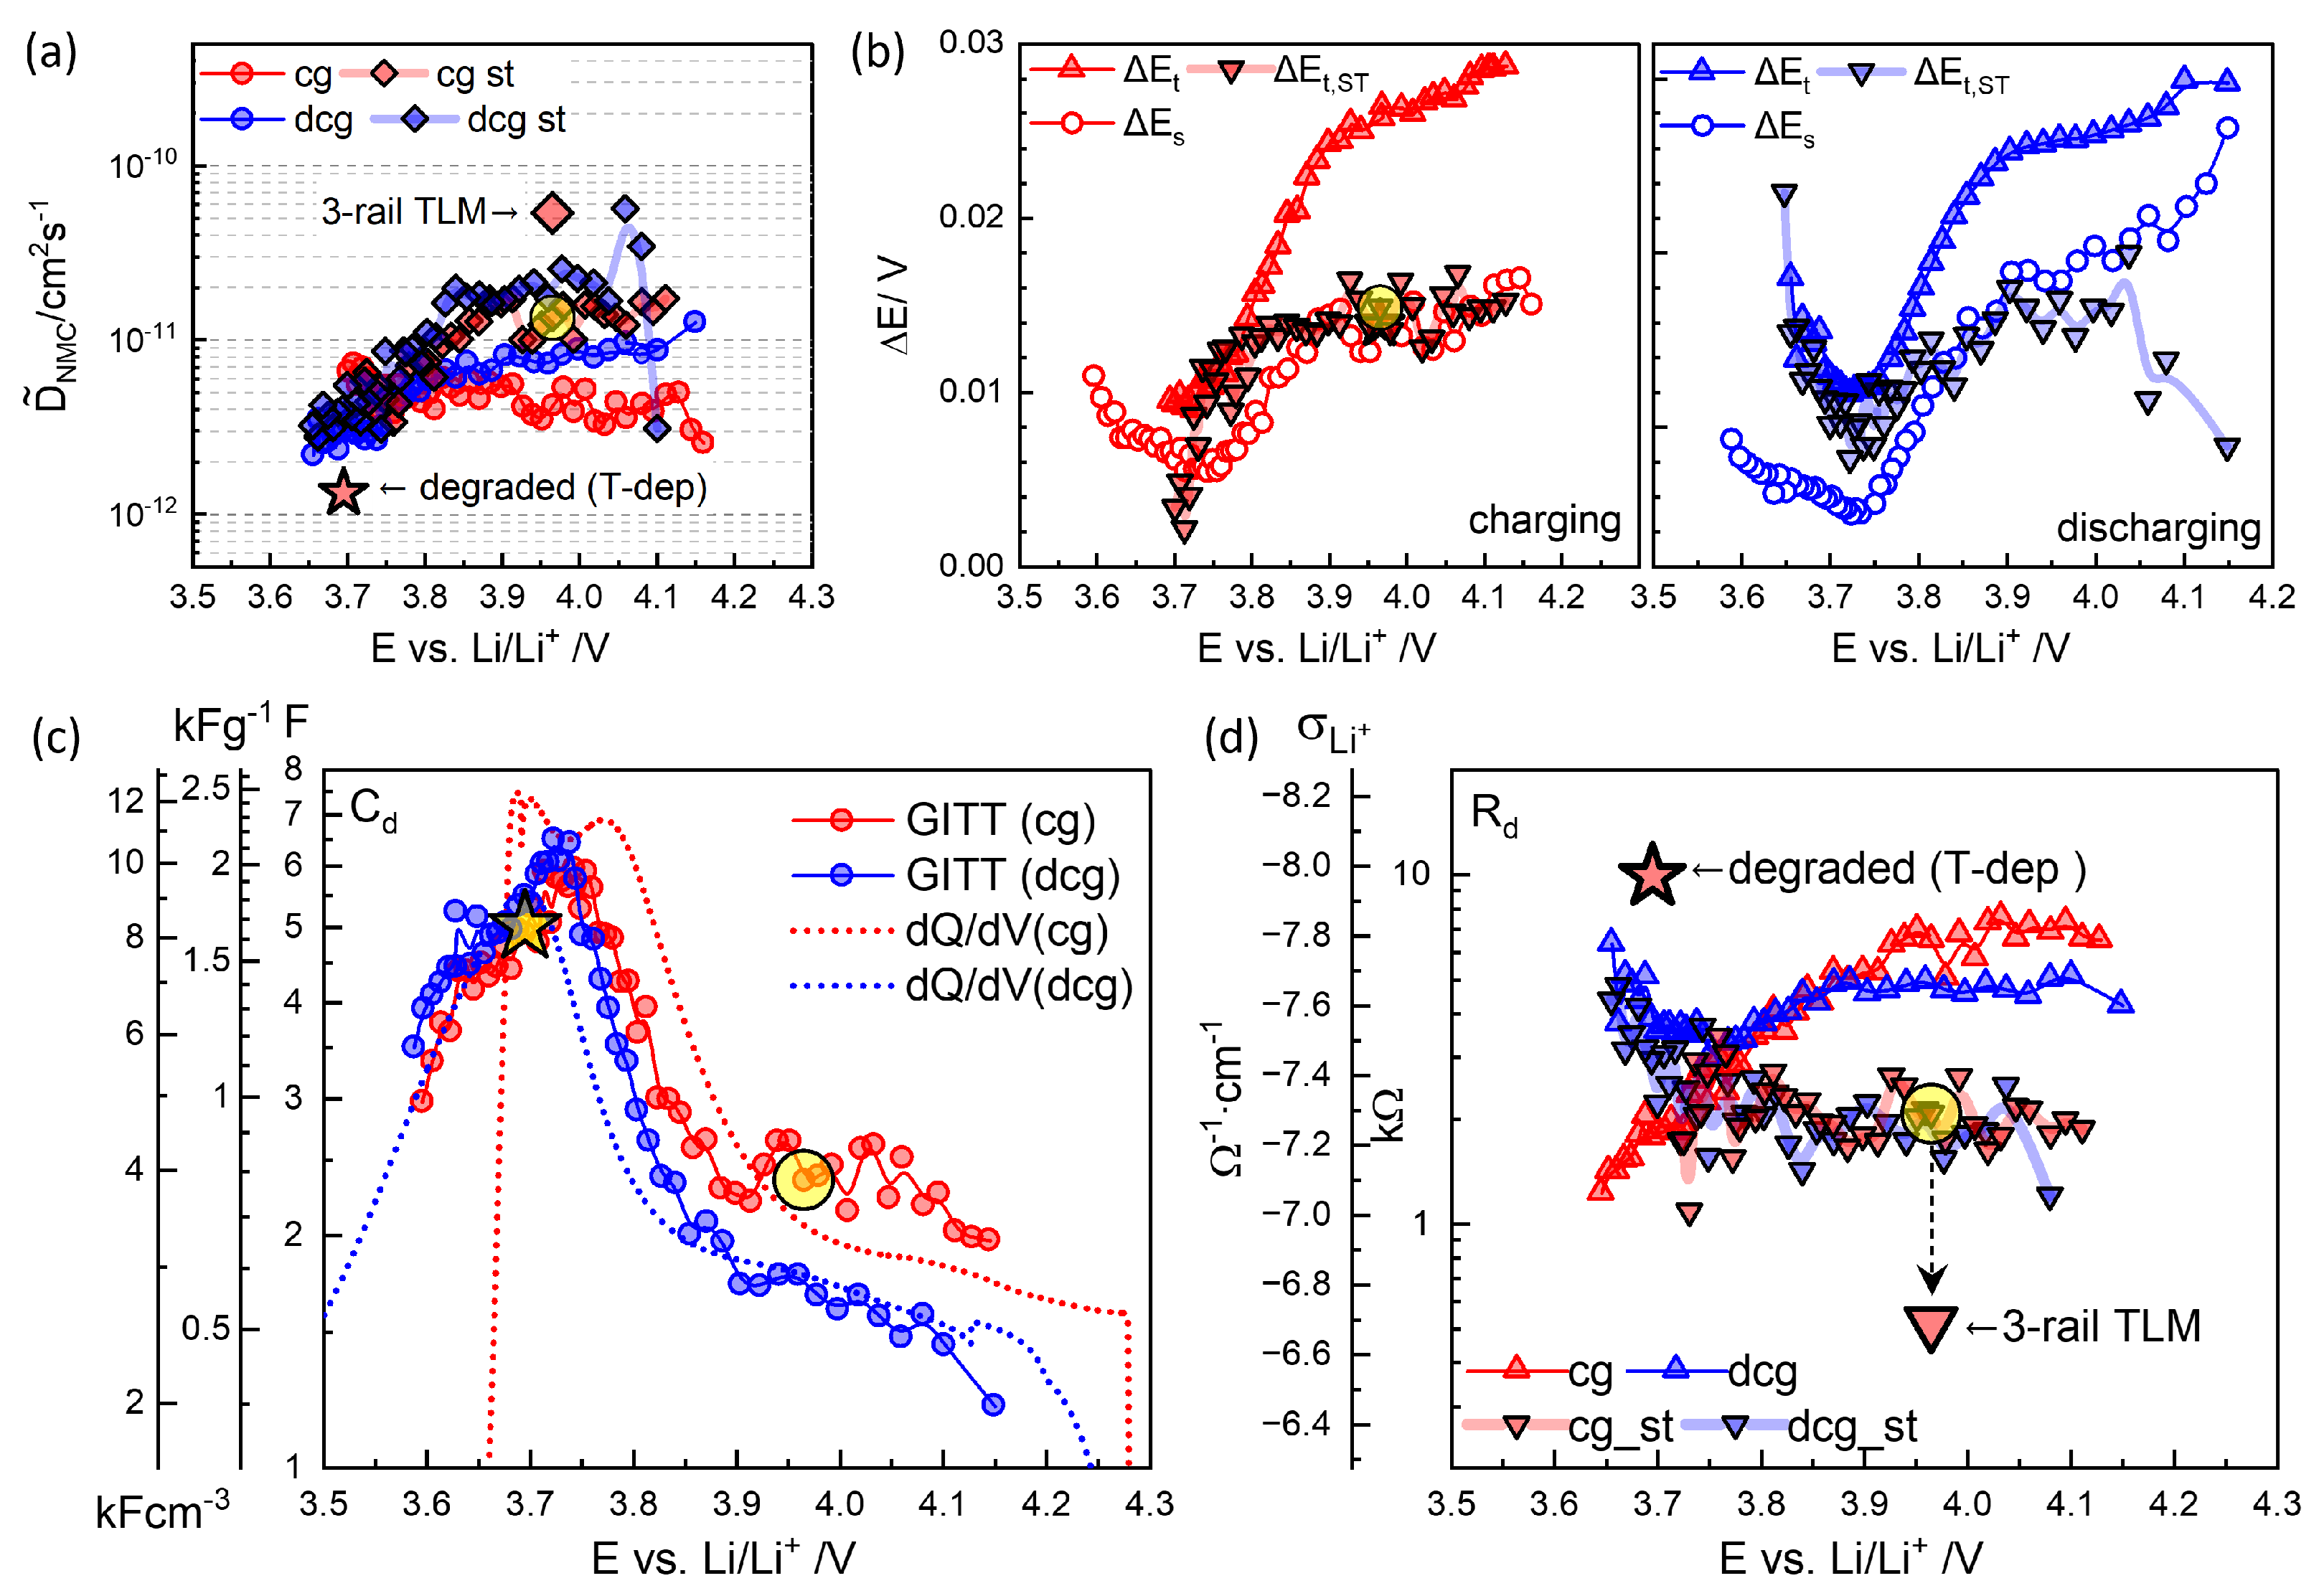
3.4. GITT for Chemical Diffusivity
4. Electrochemical Impedance Spectroscopy
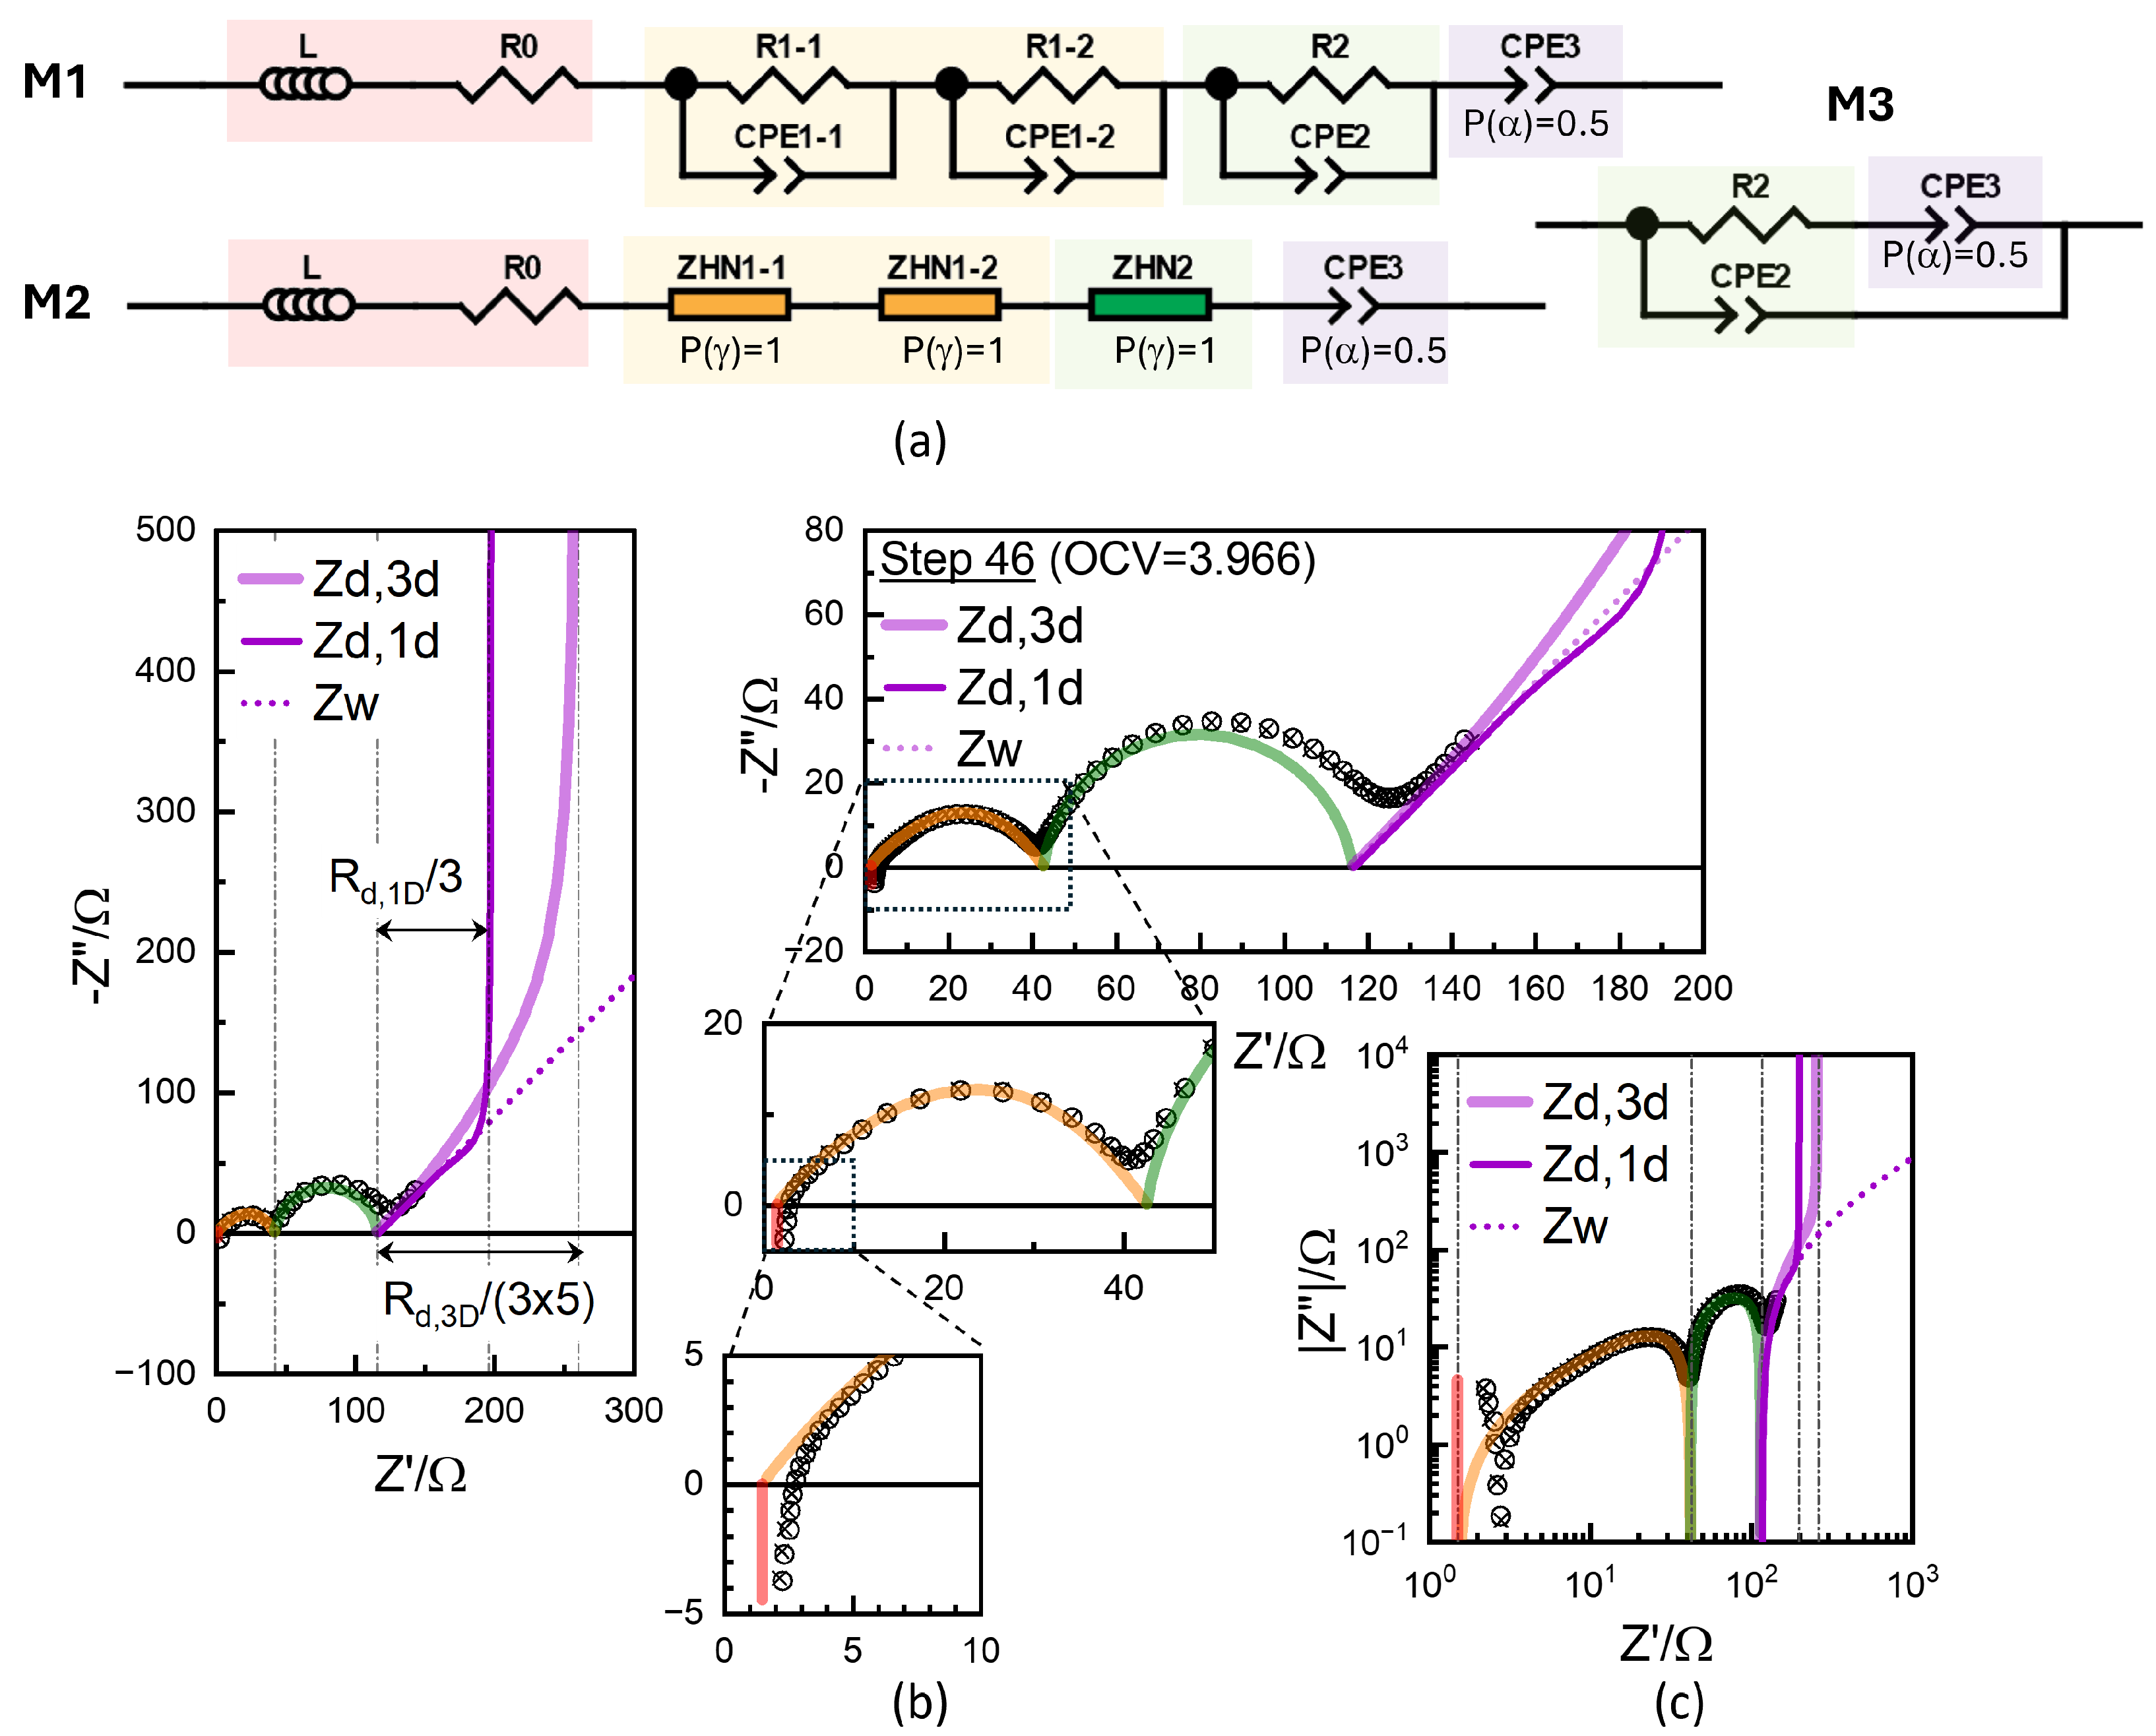
4.1. Equivalent Circuit Concept of Chemical Diffusivity
4.2. Conventional EIS Modeling
4.3. Physics-Based EIS Modeling
5. Outlook: T-Dependent EIS
6. Conclusions
Supplementary Materials
Author Contributions
Funding
Data Availability Statement
Conflicts of Interest
References
- Weppner, W.; Huggins, R.A. Electrochemical Methods for Determining Kinetic Properties of Solids. Annu. Rev. Mater. Sci. 1978, 8, 269–311. [Google Scholar] [CrossRef]
- Huggins, R. Advanced Batteries: Materials Science Aspects; Springer Science & Business Media: Berlin/Heidelberg, Germany, 2008. [Google Scholar]
- Wen, C.; Ho, C.; Boukamp, B.; Raistrick, I.; Weppner, W.; Huggins, R. Use of electrochemical methods to determine chemical-diffusion coefficients in alloys: Application to ‘LiAl’. Int. Met. Rev. 1981, 26, 253–268. [Google Scholar] [CrossRef]
- Hyun, H.; Jeong, K.; Hong, H.; Seo, S.; Koo, B.; Lee, D.; Choi, S.; Jo, S.; Jung, K.; Cho, H.H.; et al. Suppressing High-Current-Induced Phase Separation in Ni-Rich Layered Oxides by Electrochemically Manipulating Dynamic Lithium Distribution. Adv. Mater. 2021, 33, 2105337. [Google Scholar] [CrossRef]
- Chien, Y.C.; Liu, H.; Menon, A.S.; Brant, W.R.; Brandell, D.; Lacey, M.J. Rapid determination of solid-state diffusion coefficients in Li-based batteries via intermittent current interruption method. Nat. Commun. 2023, 14, 2289. [Google Scholar] [CrossRef]
- Tan, X.; Peng, W.; Wang, Z.; Guo, H.; Lu, X.; Deng, C.; Yang, S.; Wang, J. A new boundary condition forging the unprecedented self-consistence of galvanostatic intermittent titration technique. Solid State Ionics 2022, 374, 115816. [Google Scholar] [CrossRef]
- Hong, C.; Leng, Q.; Zhu, J.; Zheng, S.; He, H.; Li, Y.; Liu, R.; Wan, J.; Yang, Y. Revealing the correlation between structural evolution and Li+ diffusion kinetics of nickel-rich cathode materials in Li-ion batteries. J. Mater. Chem. A 2020, 8, 8540–8547. [Google Scholar] [CrossRef]
- Liu, Y.; Lv, H.; Mei, J.; Xia, Y.; Cheng, J.; Wang, B. In situ characterization of crystal phase evolution of the LiNi0.6Co0.2Mn0.2O2 cathode at different current densities. J. Mater. Chem. A 2023, 11, 16815–16822. [Google Scholar] [CrossRef]
- Randles, J.E.B. Kinetics of rapid electrode reactions. Discuss. Faraday Soc. 1947, 1, 11–19. [Google Scholar] [CrossRef]
- Ho, C.; Raistrick, I.; Huggins, R. Application of A-C techniques to the study of lithium diffusion in tungsten trioxide thin films. J. Electrochem. Soc. 1980, 127, 343. [Google Scholar] [CrossRef]
- Levie, D. Electrochemical response of porous and rough electrodes. Adv. Electrochem. Electrochem. Eng 1967, 6, 329. [Google Scholar]
- Moškon, J.; Žuntar, J.; Talian, S.D.; Dominko, R.; Gaberšček, M. A powerful transmission line model for analysis of impedance of insertion battery cells: A case study on the NMC-Li system. J. Electrochem. Soc. 2020, 167, 140539. [Google Scholar] [CrossRef]
- Moškon, J.; Gaberšček, M. Transmission line models for evaluation of impedance response of insertion battery electrodes and cells. J. Power Sources Adv. 2021, 7, 100047. [Google Scholar] [CrossRef]
- Firm, M.; Moškon, J.; Kapun, G.; Talian, S.D.; Kamšek, A.R.; Štefančič, M.; Hočevar, S.; Dominko, R.; Gaberšček, M. Novel Methodology of General Scaling-Approach Normalization of Impedance Parameters of Insertion Battery Electrodes–Case Study on Ni-Rich NMC Cathode: Part II. Detailed Analysis Using a Transmission Line Model. J. Electrochem. Soc. 2024, 171, 120543. [Google Scholar] [CrossRef]
- Shin, E.C.; Ryu, J.H.; Ka, B.H.; Lee, J.S.; Jeong, D.H.; Ho, K. Method and Apparatus for Lithium Ion Battery Impedance Analysis. Patent Application No: 10-2025-0001795, 6 January 2025. (In Korean). [Google Scholar]
- Park, C.W. Enhanced Battery Characterization Using Physics-Based Models for State-of-Charge and Temperature EIS with a Three-Electrode System. Ph.D. Thesis, Chonnam National University, Gwangju, Republic of Korea, 2025. [Google Scholar]
- Pham, T.L. Python-Assisted Determination of Kinetic Parameters in Oxygen-Ion Conducting Ceramic Membranes and Li-Ion Batteries. Ph.D. Thesis, Chonnam National University, Gwangju, Republic of Korea, 2021. [Google Scholar]
- Tran, T.H.T. Physics-Based Impedance Modeling of Mixed Ionic Electronic Conductors, Liquid/Polymer/Solid Electrolytes, and Human Body Segments. Ph.D. Thesis, Chonnam National University, Gwangju, Republic of Korea, 2024. [Google Scholar]
- Kim, J.H.; Park, K.J.; Kim, S.J.; Yoon, C.S.; Sun, Y.K. A method of increasing the energy density of layered Ni-rich Li [Ni1-2xCoxMnx]O2 cathodes (x = 0.05, 0.1, 0.2). J. Mater. Chem. A 2019, 7, 2694–2701. [Google Scholar] [CrossRef]
- Chen, Y.; Song, S.; Zhang, X.; Liu, Y. The challenges, solutions and development of high energy Ni-rich NCM/NCA LiB cathode materials. J. Phys. Conf. Ser. 2019, 1347, 012012. [Google Scholar] [CrossRef]
- Noh, H.J.; Youn, S.; Yoon, C.S.; Sun, Y.K. Comparison of the Structural and Electrochemical Properties of Layered Li[NixCoyMnz]O2 (x = 1/3, 0.5, 0.6, 0.7, 0.8 and 0.85) Cathode Material for Lithium-Ion Batteries. J. Power Sources 2013, 233, 121–130. [Google Scholar] [CrossRef]
- Park, J.H.; Yoon, H.; Cho, Y.; Yoo, C.Y. Investigation of Lithium Ion Diffusion of Graphite Anode by the Galvanostatic Intermittent Titration Technique. Materials 2021, 14, 4683. [Google Scholar] [CrossRef]
- Li, Z.; Du, F.; Bie, X.; Zhang, D.; Cai, Y.; Cui, X.; Wang, C.; Chen, G.; Wei, Y. Electrochemical Kinetics of the Li[Li0.23Co0.3Mn0.47]O2 Cathode Material Studied by GITT and EIS. J. Phys. Chem. C 2010, 114, 22751–22757. [Google Scholar] [CrossRef]
- Verma, A.; Smith, K.; Santhanagopalan, S.; Abraham, D.; Yao, K.P.; Mukherjee, P.P. Galvanostatic Intermittent Titration and Performance-Based Analysis of LiNi0.5Co0.2Mn0.3O2 Cathode. J. Electrochem. Soc. 2017, 164, A3380. [Google Scholar] [CrossRef]
- Geng, Z.; Chien, Y.C.; Lacey, M.J.; Thiringer, T.; Brandell, D. Validity of solid-state Li+ diffusion coefficient estimation by electrochemical approaches for lithium-ion batteries. Electrochim. Acta 2022, 404, 139727. [Google Scholar] [CrossRef]
- Juston, M.; Damay, N.; Forgez, C. Extracting the Diffusion Resistance and Dynamic of a Battery Using Pulse Tests. J. Energy Storage 2023, 57, 106199. [Google Scholar] [CrossRef]
- Shen, Z.; Cao, L.; Rahn, C.D.; Wang, C.Y. Least Squares Galvanostatic Intermittent Titration Technique (LS-GITT) for Accurate Solid Phase Diffusivity Measurement. J. Electrochem. Soc. 2013, 160, A1842. [Google Scholar] [CrossRef]
- Hess, A.; Roode-Gutzmer, Q.; Heubner, C.; Schneider, M.; Michaelis, A.; Bobeth, M.; Cuniberti, G. Determination of state of charge-dependent asymmetric Butler–Volmer kinetics for LixCoO2 electrode using GITT measurements. J. Power Sources 2015, 299, 156–161. [Google Scholar] [CrossRef]
- He, L.P.; Li, K.; Zhang, Y.; Liu, J. Structural and Electrochemical Properties of Low-Cobalt-Content LiNi0.6+xCo0.2-xMn0.2O2 (0.0 ≤ x ≤ 0.1) Cathodes for Lithium-Ion Batteries. ACS Appl. Mater. Interfaces 2020, 12, 28253–28263. [Google Scholar] [CrossRef]
- Wang, J.; Hyun, H.; Seo, S.; Jeong, K.; Han, J.; Jo, S.; Kim, H.; Koo, B.; Eum, D.; Kim, J.; et al. A Kinetic Indicator of Ultrafast Nickel-Rich Layered Oxide Cathodes. ACS Energy Lett. 2023, 8, 2986–2995. [Google Scholar] [CrossRef]
- Chaouachi, O.; Réty, J.M.; Génies, S.; Chandesris, M.; Bultel, Y. Experimental and theoretical investigation of Li-ion battery active materials properties: Application to a graphite/Ni0.6Mn0.2Co0.2O2 system. Electrochim. Acta 2021, 366, 137428. [Google Scholar] [CrossRef]
- Yang, S.; Wang, X.; Yang, X.; Bai, Y.; Liu, Z.; Shu, H.; Wei, Q. Determination of the chemical diffusion coefficient of lithium ions in spherical Li [Ni0.5Mn0.3Co0.2] O2. Electrochim. Acta 2012, 66, 88–93. [Google Scholar] [CrossRef]
- Nickol, A.; Schied, T.; Heubner, C.; Schneider, M.; Michaelis, A.; Bobeth, M.; Cuniberti, G. GITT analysis of lithium insertion cathodes for determining the lithium diffusion coefficient at low temperature: Challenges and pitfalls. J. Electrochem. Soc. 2020, 167, 090546. [Google Scholar] [CrossRef]
- Horner, J.S.; Whang, G.; Ashby, D.S.; Kolesnichenko, I.V.; Lambert, T.N.; Dunn, B.S.; Talin, A.A.; Roberts, S.A. Electrochemical modeling of GITT measurements for improved solid-state diffusion coefficient evaluation. ACS Appl. Energy Mater. 2021, 4, 11460–11469. [Google Scholar] [CrossRef]
- Kang, S.D.; Kuo, J.J.; Kapate, N.; Hong, J.; Park, J.; Chueh, W.C. Galvanostatic Intermittent Titration Technique Reinvented: Part II. Experiments. J. Electrochem. Soc. 2021, 168, 120503. [Google Scholar] [CrossRef]
- Jetybayeva, A.; Schön, N.; Oh, J.; Kim, J.; Kim, H.; Park, G.; Lee, Y.G.; Eichel, R.A.; Kleiner, K.; Hausen, F.; et al. Unraveling the state of charge-dependent electronic and ionic structure–property relationships in NCM622 cells by multiscale characterization. ACS Appl. Energy Mater. 2022, 5, 1731–1742. [Google Scholar] [CrossRef]
- Shaju, K.M.; Rao, G.V.S.; Chowdari, B.V.R. EIS and GITT Studies on Oxide Cathodes, O2-Li2/3+x(Co0.15Mn0.85)O2 (x = 0 and 1/3). Electrochim. Acta 2003, 48, 2691–2703. [Google Scholar] [CrossRef]
- Shaju, K.; Rao, G.S.; Chowdari, B. Influence of Li-Ion kinetics in the cathodic performance of layered Li (Ni1/3Co1/3Mn1/3)O2. J. Electrochem. Soc. 2004, 151, A1324. [Google Scholar] [CrossRef]
- Cui, Z.; Guo, X.; Li, H. Equilibrium Voltage and Overpotential Variation of Nonaqueous Li-O2 Batteries Using Galvanostatic Intermittent Titration Technique. Energy Environ. Sci. 2015, 8, 182–187. [Google Scholar] [CrossRef]
- Assat, G.; Delacourt, C.; Dalla Corte, D.A.; Tarascon, J.M. Practical assessment of anionic redox in Li-rich layered oxide cathodes: A mixed blessing for high energy Li-ion batteries. J. Electrochem. Soc. 2016, 163, A2965. [Google Scholar] [CrossRef]
- Chayambuka, K.; Mulder, G.; Danilov, D.L.; Notten, P.H. Determination of state-of-charge dependent diffusion coefficients and kinetic rate constants of phase changing electrode materials using physics-based models. J. Power Sources Adv. 2021, 9, 100056. [Google Scholar] [CrossRef]
- Li, A.; Pelissier, S.; Venet, P.; Gyan, P. Fast Characterization Method for Modeling Battery Relaxation Voltage. Batteries 2016, 2, 7. [Google Scholar] [CrossRef]
- Kim, J.; Park, S.; Hwang, S.; Yoon, W.S. Principles and Applications of Galvanostatic Intermittent Titration Technique for Lithium-Ion Batteries. J. Electrochem. Sci. Technol. 2022, 13, 19–31. [Google Scholar] [CrossRef]
- Ménétrier, M.; Carlier, D.; Blangero, M.; Delmas, C. On “Really” Stoichiometric LiCoO2. Electrochem. Solid-State Lett. 2008, 11, A179. [Google Scholar] [CrossRef]
- Zheng, S.; Hong, C.; Guan, X.; Xiang, Y.; Liu, X.; Xu, G.L.; Liu, R.; Zhong, G.; Zheng, F.; Li, Y.; et al. Correlation between long range and local structural changes in Ni-rich layered materials during charge and discharge process. J. Power Sources 2019, 412, 336–343. [Google Scholar] [CrossRef]
- Crank, J. The Mathematics of Diffusion; Oxford University Press: Oxford, UK, 1979. [Google Scholar]
- Kim, Y.H.; Shin, E.C.; Kim, S.J.; Park, C.N.; Kim, J.; Lee, J.S. Chemical Diffusivity for Hydrogen Storage: Pneumatochemical Intermittent Titration Technique. J. Phys. Chem. C 2013, 117, 19771–19785. [Google Scholar] [CrossRef]
- Barsoukov, E.; Macdonald, J.R. Impedance Spectroscopy: Theory, Experiment, and Applications; John Wiley & Sons: Hoboken, NJ, USA, 2018. [Google Scholar]
- Kang, S.D.; Chueh, W.C. Galvanostatic Intermittent Titration Technique Reinvented: Part I. A Critical Review. J. Electrochem. Soc. 2021, 168, 120504. [Google Scholar] [CrossRef]
- Günther, J.; Wycisk, D.; Dev, R.S.; Fill, A.; Birke, K.P.; Moos, R.; Schmidt, J.P.; Oldenburger, M. Determination of the Solid State Diffusion Coefficient of Li-ion Battery Single-Phase Materials Using Thin Model Electrodes. J. Electrochem. Soc. 2025, 172, 030525. [Google Scholar] [CrossRef]
- Schied, T.; Nickol, A.; Heubner, C.; Schneider, M.; Michaelis, A.; Bobeth, M.; Cuniberti, G. Determining the diffusion coefficient of lithium insertion cathodes from GITT measurements: Theoretical analysis for low temperatures. ChemPhysChem 2021, 22, 885–893. [Google Scholar] [CrossRef] [PubMed]
- Yang, X.; Zhang, Y.; Xiao, J.; Zhang, Y.; Dong, P.; Meng, Q.; Zhang, M. Restoring surface defect crystal of Li-lacking LiNi0.6Co0.2Mn0.2O2 material particles toward more efficient recycling of lithium-ion batteries. ACS Sustain. Chem. Eng. 2021, 9, 16997–17006. [Google Scholar] [CrossRef]
- Gao, Y.; Yan, L.; Zhao, C.; Chen, M.; Yang, S.; Shao, G.; Mao, J. Accurate calculation of solid-state Li+ diffusion coefficient and kinetic activation energies for an artificial graphite anode. J. Electrochem. Soc. 2024, 171, 020558. [Google Scholar] [CrossRef]
- Dees, D.W.; Kawauchi, S.; Abraham, D.P.; Prakash, J. Analysis of the Galvanostatic Intermittent Titration Technique (GITT) as applied to a lithium-ion porous electrode. J. Power Sources 2009, 189, 263–268. [Google Scholar] [CrossRef]
- Bard, A.J.; Faulkner, L.R.; White, H.S. Electrochemical Methods: Fundamentals and Applications; John Wiley & Sons: Hoboken, NJ, USA, 2022. [Google Scholar]
- El-Latif, E.I.A.; Kebede, M.A.; Sekar, K.; Hameed, T.A.; Yahia, I.S.; Gao, H.; Sheha, E. Modeling the Diffusion Coefficient of Charge Carriers in Metal Ion Batteries using the Randles-Sevcik Equation. Adv. Theory Simul. 2025, 2500346. [Google Scholar] [CrossRef]
- Levi, M.; Markevich, E.; Aurbach, D. Comparison between Cottrell diffusion and moving boundary models for determination of the chemical diffusion coefficients in ion-insertion electrodes. Electrochim. Acta 2005, 51, 98–110. [Google Scholar] [CrossRef]
- Newman, J.; Balsara, N.P. Electrochemical Systems; John Wiley & Sons: Hoboken, NJ, USA, 2021. [Google Scholar]
- Fuller, T.F.; Doyle, M.; Newman, J. Simulation and optimization of the dual lithium ion insertion cell. J. Electrochem. Soc. 1994, 141, 1. [Google Scholar] [CrossRef]
- Jia, M.; Zhang, W.; Cai, X.; Zhan, X.; Hou, L.; Yuan, C.; Guo, Z. Re-understanding the galvanostatic intermittent titration technique: Pitfalls in evaluation of diffusion coefficients and rational suggestions. J. Power Sources 2022, 543, 231843. [Google Scholar] [CrossRef]
- Santhanagopalan, S.; Guo, Q.; Ramadass, P.; White, R.E. Review of models for predicting the cycling performance of lithium ion batteries. J. Power Sources 2006, 156, 620–628. [Google Scholar] [CrossRef]
- Shan, S.; Rahn, C.D. Electrolyte-enhanced Single Particle Lithium Cell Models Including Electrolyte Convection. IFAC-PapersOnLine 2024, 58, 126–131. [Google Scholar] [CrossRef]
- Doyle, M.; Fuller, T.F.; Newman, J. Modeling of galvanostatic charge and discharge of the lithium/polymer/insertion cell. J. Electrochem. Soc. 1993, 140, 1526. [Google Scholar] [CrossRef]
- Doyle, M.; Meyers, J.P.; Newman, J. Computer simulations of the impedance response of lithium rechargeable batteries. J. Electrochem. Soc. 2000, 147, 99. [Google Scholar] [CrossRef]
- Huang, J.; Zhang, J. Theory of impedance response of porous electrodes: Simplifications, inhomogeneities, non-stationarities and applications. J. Electrochem. Soc. 2016, 163, A1983. [Google Scholar] [CrossRef]
- Sikha, G.; White, R.E. Analytical expression for the impedance response of an insertion electrode cell. J. Electrochem. Soc. 2006, 154, A43. [Google Scholar] [CrossRef]
- Diaz-Calleja, R. Comment on the maximum in the loss permittivity for the Havriliak- Negami equation. Macromolecules 2000, 33, 8924. [Google Scholar] [CrossRef]
- Meddings, N.; Heinrich, M.; Overney, F.; Lee, J.S.; Ruiz, V.; Napolitano, E.; Seitz, S.; Hinds, G.; Raccichini, R.; Gaberšček, M.; et al. Application of electrochemical impedance spectroscopy to commercial Li-ion cells: A review. J. Power Sources 2020, 480, 228742. [Google Scholar] [CrossRef]
- Weber, A. Impedance analysis of porous electrode structures in batteries and fuel cells. Tm-Tech. Mess. 2021, 88, 1–16. [Google Scholar] [CrossRef]
- MEISP 3.0: Multiple Electrochemical Impedance Spectra Parameterization. 2002. Available online: https://meisp.software.informer.com/3.0/ (accessed on 15 June 2025).
- Chukwu, R. FitMyEIS—Electrochemical Impedance Spectroscopy Fitting Tool. 2025. Available online: https://www.fitmyeis.com/ (accessed on 31 January 2025).
- Meyers, J.P.; Doyle, M.; Darling, R.M.; Newman, J. The impedance response of a porous electrode composed of intercalation particles. J. Electrochem. Soc. 2000, 147, 2930. [Google Scholar] [CrossRef]
- Bisquert, J. Influence of the boundaries in the impedance of porous film electrodes. Phys. Chem. Chem. Phys. 2000, 2, 4185–4192. [Google Scholar] [CrossRef]
- Costard, J.; Joos, J.; Schmidt, A.; Ivers-Tiffée, E. Charge transfer parameters of NixMnyCo1-x-y cathodes evaluated by a transmission line modeling approach. Energy Technol. 2021, 9, 2000866. [Google Scholar] [CrossRef]
- Cruz-Manzo, S.; Greenwood, P. An impedance model based on a transmission line circuit and a frequency dispersion Warburg component for the study of EIS in Li-ion batteries. J. Electroanal. Chem. 2020, 871, 114305. [Google Scholar] [CrossRef]
- Ogihara, N.; Itou, Y.; Sasaki, T.; Takeuchi, Y. Impedance spectroscopy characterization of porous electrodes under different electrode thickness using a symmetric cell for high-performance lithium-ion batteries. J. Phys. Chem. C 2015, 119, 4612–4619. [Google Scholar] [CrossRef]
- Sulzer, V.; Marquis, S.G.; Timms, R.; Robinson, M.; Chapman, S.J. Python battery mathematical modelling (PyBaMM). J. Open Res. Softw. 2021, 9, 14. [Google Scholar] [CrossRef]
- Bruce, P.G.; Evans, J.; Vincent, C.A. Conductivity and transference number measurements on polymer electrolytes. Solid State Ionics 1988, 28, 918–922. [Google Scholar] [CrossRef]
- Pesko, D.M.; Timachova, K.; Bhattacharya, R.; Smith, M.C.; Villaluenga, I.; Newman, J.; Balsara, N.P. Negative transference numbers in poly (ethylene oxide)-based electrolytes. J. Electrochem. Soc. 2017, 164, E3569. [Google Scholar] [CrossRef]
- Jamnik, J.; Maier, J.; Pejovnik, S. A powerful electrical network model for the impedance of mixed conductors. Electrochim. Acta 1999, 44, 4139–4145. [Google Scholar] [CrossRef]
- Jamnik, J.; Maier, J. Treatment of the impedance of mixed conductors equivalent circuit model and explicit approximate solutions. J. Electrochem. Soc. 1999, 146, 4183. [Google Scholar] [CrossRef]
- Siroma, Z.; Fujiwara, N.; Yamazaki, S.i.; Asahi, M.; Nagai, T.; Ioroi, T. Multi-rail transmission-line model as an equivalent circuit for electrochemical impedance of a porous electrode. J. Electroanal. Chem. 2020, 878, 114622. [Google Scholar] [CrossRef]
- Zugmann, S.; Fleischmann, M.; Amereller, M.; Gschwind, R.M.; Wiemhöfer, H.D.; Gores, H.J. Measurement of transference numbers for lithium ion electrolytes via four different methods, a comparative study. Electrochim. Acta 2011, 56, 3926–3933. [Google Scholar] [CrossRef]
- Drvarič Talian, S.; Bobnar, J.; Sinigoj, A.R.; Humar, I.; Gaberšček, M. Transmission line model for description of the impedance response of Li electrodes with dendritic growth. J. Phys. Chem. C 2019, 123, 27997–28007. [Google Scholar] [CrossRef]
- Havriliak, S.; Negami, S. A complex plane analysis of α-dispersions in some polymer systems. J. Polym. Sci. Part C Polym. Symp. 1966, 14, 99–117. [Google Scholar] [CrossRef]
- Abbas, A.; Jung, W.G.; Moon, W.J.; Uwiragiye, E.; Pham, T.L.; Lee, J.S.; Fisher, J.G.; Ge, W.; Naqvi, F.U.H.; Ko, J.H. Growth of (1 - x)(Na1/2Bi1/2)TiO3–x KNbO3 single crystals by the self-flux method and their characterisation. J. Korean Ceram. Soc. 2024, 61, 342–365. [Google Scholar] [CrossRef]
- Lee, K.; Yoon, D.; Kim, H.; Park, H.W.; Min, D.R.; Nguyen, D.T.; Shin, E.C.; Lee, J.S. TiO2 nanocone photoanodes by Ar ion-beam etching and physics-based electrochemical impedance spectroscopy. Electrochim. Acta 2024, 481, 143976. [Google Scholar] [CrossRef]
- Moon, S.H.; Kim, Y.H.; Cho, D.C.; Shin, E.C.; Lee, D.; Im, W.B.; Lee, J.S. Sodium ion transport in polymorphic scandium NASICON analog Na3Sc2 (PO4)3 with new dielectric spectroscopy approach for current-constriction effects. Solid State Ionics 2016, 289, 55–71. [Google Scholar] [CrossRef]
- Adamič, M.; Talian, S.D.; Sinigoj, A.R.; Humar, I.; Moškon, J.; Gaberšček, M. A transmission line model of electrochemical cell’s impedance: Case study on a Li-S system. J. Electrochem. Soc. 2018, 166, A5045. [Google Scholar] [CrossRef]
- Lai, W.; Ciucci, F. Mathematical modeling of porous battery electrodes—Revisit of Newman’s model. Electrochim. Acta 2011, 56, 4369–4377. [Google Scholar] [CrossRef]
- Zelič, K.; Katrašnik, T.; Gaberšček, M. Derivation of transmission line model from the concentrated solution theory (CST) for porous electrodes. J. Electrochem. Soc. 2021, 168, 070543. [Google Scholar] [CrossRef]
- Ulgut, B. Methods-employing multisine electrochemical impedance spectroscopy for batteries in galvanostatic mode. J. Electrochem. Soc. 2022, 169, 110510. [Google Scholar] [CrossRef]
- Hallemans, N.; Howey, D.; Battistel, A.; Saniee, N.F.; Scarpioni, F.; Wouters, B.; La Mantia, F.; Hubin, A.; Widanage, W.D.; Lataire, J. Electrochemical impedance spectroscopy beyond linearity and stationarity—A critical review. Electrochim. Acta 2023, 466, 142939. [Google Scholar] [CrossRef]
- Dutta, A. Dynamic Processes at the Electrode-Electrolyte Interface: Implications for Lithium Deposition Stability. ChemElectroChem 2024, 11, e202400222. [Google Scholar] [CrossRef]


| Parameter | M3 | M1 | Parameter | M2 | M4 |
|---|---|---|---|---|---|
| Chi-Sqr | 7.87e-05 | 7.08e-05 | Chi-Sqr | 7.08e-05 | 9.24e-05 |
| Sum-Sqr | 1.18e-02 | 1.06e-02 | Sum-Sqr | 7.08e-05 | 1.40e-02 |
| L | 7.17e-07 | 7.17e-07 | L | 7.17e-07 | 7.28e-07 |
| R0 | 1.51 | 1.51 | R0 | 1.51 | 1.31 |
| R1-1 | 32.57 | 30.10 | ZHN1-1-R | 30.10 | 39.14 |
| CPE1-1-T | 1.10e-04 | 1.12e-04 | ZHN1-1-T | 5.13e-05 | 1.27e-04 |
| ZHN1-1-P | 1 * | 0.614 | |||
| CPE1-1-P | 0.577 | 0.577 | ZHN1-1-U | 0.577 | 0.845 |
| C1-1 | 1.77e-06 | 1.70e-06 | C1-1 | ||
| R1-2 | 9.42 | 11.13 | ZHN1-2-R | 11.13 | |
| CPE1-2-T | 6.80e-06 | 8.10e-06 | ZHN1-2-T | 8.60e-05 | |
| ZHN1-2-P | 1 * | ||||
| CPE1-2-P | 1.028 | 0.995 | ZHN1-2-U | 0.995 | |
| C1-2 | 8.84e-06 | 7.73e-06 | C1-2 | 7.73e-06 | 1.88e-06 |
| R2 | 75.48 | 73.95 | ZHN2-R | 73.95 | 75.00 |
| CPE2-T | 1.88e-03 | 2.07e-03 | ZHN2-T | 1.23e-01 | 1.51e-01 |
| ZHN2-P | 1 | 0.822 | |||
| CPE2-P | 0.902 | 0.894 | ZHN2-U | 0.894 | 0.948 |
| C2 | 1.52e-03 | 1.66e-03 | C2 | 1.66e-03 | 1.67e-03 |
| CPE3-T | 1.03e-01 | 9.86e-02 | CPE3-T | 9.86e-02 | 9.55e-02 |
| CPE3-P | 0.5 * | 0.5 * | CPE3-P | 0.5 * | 0.5 * |
| 2000.2 | 2174.5 | 2174.5 | 2320.7 |
| Parameter | 3-Rail TLM | Barsoukov | Bisquert |
|---|---|---|---|
| T/°C | 30 | – | – |
| m/g | 3.02e-03 | – | – |
| d/g cm−3 | 4.98 | – | – |
| r/cm | 2.535e-04 | – | – |
| /V | 3.966 | – | – |
| 2.35 | – | – | |
| 0.3 | 1 | n.a. | |
| 1.855 | – | – | |
| 0.444 | – | – | |
| L | 2.49e-07 | – | – |
| 2.91e-06 | – | – | |
| 1.79e-05 | – | – | |
| 7.05e-05 | – | – | |
| 2.69e-03 | – | – | |
| 8.18e-03 | 8.07e-03 | 1.13e-02 | |
| 0.813 | n.a. | n.a. | |
| 0.593 | n.a. | n.a. | |
| (a) | 2.2 | – | – |
| (b) | 36.5 | – | – |
| 42.2 | – | – | |
| 50.3 | – | – | |
| 22.7 | 22.6 | 19.9 | |
| 514.2 | 1865.3 | 2212.8 | |
| c | 37.4 | 37.4 | 34.4 |
| d | 62.2 | n.a. | n.a. |
| e | 5.1 | n.a. | n.a. |
| 79.6 | 79.6 | 76.6 | |
| 29.9 | n.a. | n.a. | |
| f | 50.7 | 126.4 | 147.5 |
| a | 2.2 | – | – |
| 38.7 | – | – | |
| 80.9 | – | – | |
| 118.3 | 118.2 | 115.3 | |
| 123.4 | n.a. | n.a. | |
| 148.2 | n.a. | n.a. | |
| 198.8 | 244.6 | 262.8 | |
| /cm2s−1 | 5.32e-11 | 1.47e-11 | 1.24e-11 |
| /kF g−1 | 0.778 | – | – |
| 3.875 | – | – | |
| /cm−1 | 2.063-07 | 5.68e-8 | 4.79e-8 |
| cm−1) | −6.69 | −7.25 | −7.32 |
| Parameter | T-Dep | Step 46 | ||
|---|---|---|---|---|
| 3-Rail | Barsoukov | Bisquert | 3-Rail | |
| /V | 3.696 | – | – | 3.966 |
| 5 | – | – | 2.35 | |
| 2 | – | – | 1.8554 | |
| 0.5 | – | – | 0.4437 | |
| L/H | 5.37e-07 | – | – | 6.71e-07 |
| 1.93e-07 | – | – | 2.49e-07 | |
| 2.45e-06 | – | – | 2.91e-06 | |
| /s | 7.05e-05 | – | – | 1.79e-05 |
| /F | 2.16e-03 | – | – | 2.69e-03 |
| /F | 8.90 | n.a. | n.a. | 0.813 |
| /F | 0.227 | n.a. | n.a. | 0.593 |
| /F | 1.99e-02 | 1.92e-02 | 3.44e-02 | 8.18e-03 |
| / (a) | 2.9 | – | – | 2.2 |
| / (b) | 158 | – | – | 36.5 |
| / | 142.8 | – | – | 42.2 |
| / | 335.8 | – | – | 110.2 |
| / | 83.9 | 65.0 | 55.8 | 22.7 |
| / | 8787.8 | 27,512.1 | 33,112.0 | 514.2 |
| /eV | 0.087 | – | – | n.a. |
| /eV | 0.679 | – | – | n.a. |
| /eV | 0.173 | – | – | n.a. |
| /eV | 0.705 | 0.798 | 0.757 | n.a. |
| /eV | 0.466 | 0.410 | 0.362 | n.a. |
| c | 174.1 | 150.9 | 139.0 | 37.4 |
| d | 306.9 | n.a. | n.a. | 62.2 |
| e | 6.8 | n.a. | n.a. | 5.1 |
| 316.9 | 293.8 | 281.8 | 79.6 | |
| 139.5 | n.a. | n.a. | 29.9 | |
| f | 736.0 | 1860.2 | 2207.6 | 50.6 |
| a | 2.9 | – | – | 2.2 |
| 160.8 | – | – | 38.7 | |
| 303.6 | – | – | 80.9 | |
| 477.9 | 452.0 | 441.5 | 118.3 | |
| 484.7 | n.a. | n.a. | 123.4 | |
| 617.7 | n.a. | n.a. | 148.2 | |
| 1353.3 | 2314.8 | 2650.2 | 198.8 | |
| /cm2s−1 | 1.46e-12 | 4.67e-13 | 3.88e-13 | 5.32e-11 |
| /cm−1 | 1.21e-08 | 3.85e-09 | 3.20e-09 | 2.06e-07 |
Disclaimer/Publisher’s Note: The statements, opinions and data contained in all publications are solely those of the individual author(s) and contributor(s) and not of MDPI and/or the editor(s). MDPI and/or the editor(s) disclaim responsibility for any injury to people or property resulting from any ideas, methods, instructions or products referred to in the content. |
© 2025 by the authors. Licensee MDPI, Basel, Switzerland. This article is an open access article distributed under the terms and conditions of the Creative Commons Attribution (CC BY) license (https://creativecommons.org/licenses/by/4.0/).
Share and Cite
Abbas, I.; Tran, H.T.; Tran, T.T.N.; Pham, T.L.; Shin, E.-C.; Park, C.-W.; Yu, S.-B.; Lee, O.J.; Nguyen, A.-G.; Jeong, D.; et al. GITT Limitations and EIS Insights into Kinetics of NMC622. Batteries 2025, 11, 234. https://doi.org/10.3390/batteries11060234
Abbas I, Tran HT, Tran TTN, Pham TL, Shin E-C, Park C-W, Yu S-B, Lee OJ, Nguyen A-G, Jeong D, et al. GITT Limitations and EIS Insights into Kinetics of NMC622. Batteries. 2025; 11(6):234. https://doi.org/10.3390/batteries11060234
Chicago/Turabian StyleAbbas, Intizar, Huyen Tran Tran, Tran Thi Ngoc Tran, Thuy Linh Pham, Eui-Chol Shin, Chan-Woo Park, Sung-Bong Yu, Oh Jeong Lee, An-Giang Nguyen, Daeho Jeong, and et al. 2025. "GITT Limitations and EIS Insights into Kinetics of NMC622" Batteries 11, no. 6: 234. https://doi.org/10.3390/batteries11060234
APA StyleAbbas, I., Tran, H. T., Tran, T. T. N., Pham, T. L., Shin, E.-C., Park, C.-W., Yu, S.-B., Lee, O. J., Nguyen, A.-G., Jeong, D., Ka, B. H., Cho, H.-H., Lim, J., Shin, N., Gaberšček, M., Hur, S.-M., Park, C.-J., Kim, J., & Lee, J.-S. (2025). GITT Limitations and EIS Insights into Kinetics of NMC622. Batteries, 11(6), 234. https://doi.org/10.3390/batteries11060234