Review

A Review of EV Adoption, Charging Standards, and Charging Infrastructure Growth in Europe and Italy

Department of Electrical, Electronic, and Information Engineering “Guglielmo Marconi”, University of Bologna, 40136 Bologna, Italy
*
Author to whom correspondence should be addressed.
These authors contributed equally to this work.
Batteries 2025, 11(6), 229; https://doi.org/10.3390/batteries11060229
Submission received: 15 April 2025 / Revised: 19 May 2025 / Accepted: 28 May 2025 / Published: 12 June 2025

Abstract

This work analyzes the electric vehicle (EV) sales trends of plug-in hybrid electric vehicles (PHEVs) and battery electric vehicles (BEVs) and trends in the growth of Alternating Current (AC) and Direct Current (DC) charging infrastructure station scenarios in Europe and Italy. It offers a comprehensive view of market trends, technical developments, infrastructure development, and worldwide standardization initiatives for policymakers, researchers, and industry. A detailed classification of the charging technologies of EVs, i.e., conductive, wireless power transfer (WPT), battery swapping (BS), and different EV types, is presented. Finally, this work provides a comparative overview of charging standards and protocols, including the ones established by the Society of Automotive Engineers (SAE), International Electrotechnical Commission (IEC), and Standardization Administration of China (SAC), emphasizing interoperability and cross-border integration to accelerate the transition to clean transportation.

Graphical Abstract

1. Introduction

According to new reviews and investigations, internal combustion engine (ICE)-based transportation continues to overwhelm the global vehicle industry [1,2]. Fueled by population and economic expansion, this dominance strongly contributes to energy consumption growth. This industry discharges many greenhouse gases (GHGs) because it relies on fossil fuels, particularly carbon dioxide (CO2), as they play a significant role in driving global warming and influencing climate patterns [3,4,5]. Moreover, this dependence raises substantial issues, such as severe climate contamination, energy deficiencies, and a rapid decrease in global oil supplies [6].
Figure 1 shows the CO2 spread from different areas (2019–2023) [7], characterized by the International Energy Agency (IEA) and the Emissions Database for Global Atmospheric Research (EDGAR) [8]. The areas covered include power, transport, industrial, and residential. Based on data, the power production sector was the most significant contributor, emitting 14.9 billion metric tons of CO2 (Gt), accounting for 41.9% of total emissions. In 2023, the transportation sector was the second largest contributor, accounting for 8.44 Gt (23.7%) of total CO2 emissions.
The most crucial move to reduce CO2 emissions from the transportation industry is the switch to EVs from ICE vehicles [9]. EVs may operate with almost zero CO2 emissions when recharged using renewable or low-carbon energy, which makes them great for reducing emissions associated with mobility [10]. According to the European Environment Agency (EEA), EVs can reduce 50–60% CO2 emissions throughout their lifetime when implemented in combination with the typical European power system mix. Similarly, the U.S. Environmental Protection Agency (EPA) emphasizes that EVs do not emit tailpipe emissions and decrease the adverse environmental impact when renewable energy is recharged on the grid [11]. Under similar circumstances, according to the International Council on Clean Transportation (ICCT) future EVs can release 50 to 70% less CO2 than ICE vehicles over their lifetime. This reduction assumes the continued decarbonization of the electricity grid, with increasing shares of renewable energy that minimize fossil fuel use for power generation [12]. Achieving these reductions is necessary to meet global climate targets, such as the European Green Deal target of net zero emissions by 2050 [13,14].
Creating an extensive charging infrastructure, advances in battery technology for greater endurance and range, and reasonably priced vehicles are necessary to effectively adopt EV transportation [15,16]. It requires robust government support through policies, subsidies, incentives, and public awareness to address misconceptions and encourage adoption [17]. Integrating renewable energy with smart grids ensures sustainability, while collaboration among automakers, tech companies, governments, and communities drives innovation and infrastructure development [18,19]. Holistically addressing these key factors will accelerate the transition to electric vehicles and ensure economic and environmental sustainability [20].
Developing a charging infrastructure is crucial to advancing EVs, particularly in countries with well-established land and marine transportation systems [21,22,23]. However, battery technology, battery thermal stability, and, most importantly, the lack of an available charging infrastructure are significant obstacles to the widespread adoption of EVs. The growing demand for EV charging cannot be met by the current number of charging outlets and high-speed charging stations [24,25]. Due to the scarcity of charging stations, prospective EV users are deterred, which impedes the growth and uptake of EVs.
To encourage the broad adoption of EVs, national development plans must include an expanded infrastructure network for charging. The move from conventional ICE Vehicles to EVs is prompted by several reasons, including the depletion of fossil fuels, the lack of CO2 emissions, and advancements in auxiliary technologies. In addition, infrastructure advances such as Vehicle-to-Grid (V2G) and Grid-to-Vehicle (G2V) technologies enhance the system’s stability and allow for more intelligent energy management. In addition, a sustainable method of recharging EVs is made possible by the increasing usage of renewable energy sources [26]. The popularity of EVs can also be attributed to the rapid development of electronic control systems and EV charging technologies, which have made the procedure more practical and efficient.
This paper contributes to the review of electric vehicles, including market sales, charging infrastructure, standards, and technologies.
The main objectives of this paper are as follows:
(1)
Analyzing the EV market, such as sales performance and charging infrastructure, in major European countries, and focusing mainly on Italy.
(2)
Overview of international and European EV charging standards and charging levels.
(3)
Brief discussion of the novel technology of EV charging and its implications for future mobility.

2. Research Methodology

The research methodology employed in this work follows a structured and systematic approach to reviewing the existing literature, analyzing data, and synthesizing key insights into EV technology, charging standards, and market trends. This study is conducted through a comprehensive literature review utilizing qualitative and quantitative data sources.
This study follows the PRISMA methodology [27]. Initially, a selection of research papers was compiled from Scopus, Web of Science, and Google Scholar. The search query included keywords such as EV Charging Standards, EV Charging Systems, EV Charging techniques, and European EV Sales. The search was limited to publications from 2018 to 2025 to ensure relevance to the latest advances. After multiple screening stages, 113 research papers and 100 reports were included in this review, ensuring comprehensive and diverse subject matter coverage. The PRISMA diagram for the systematic literature review is shown in Figure 2.

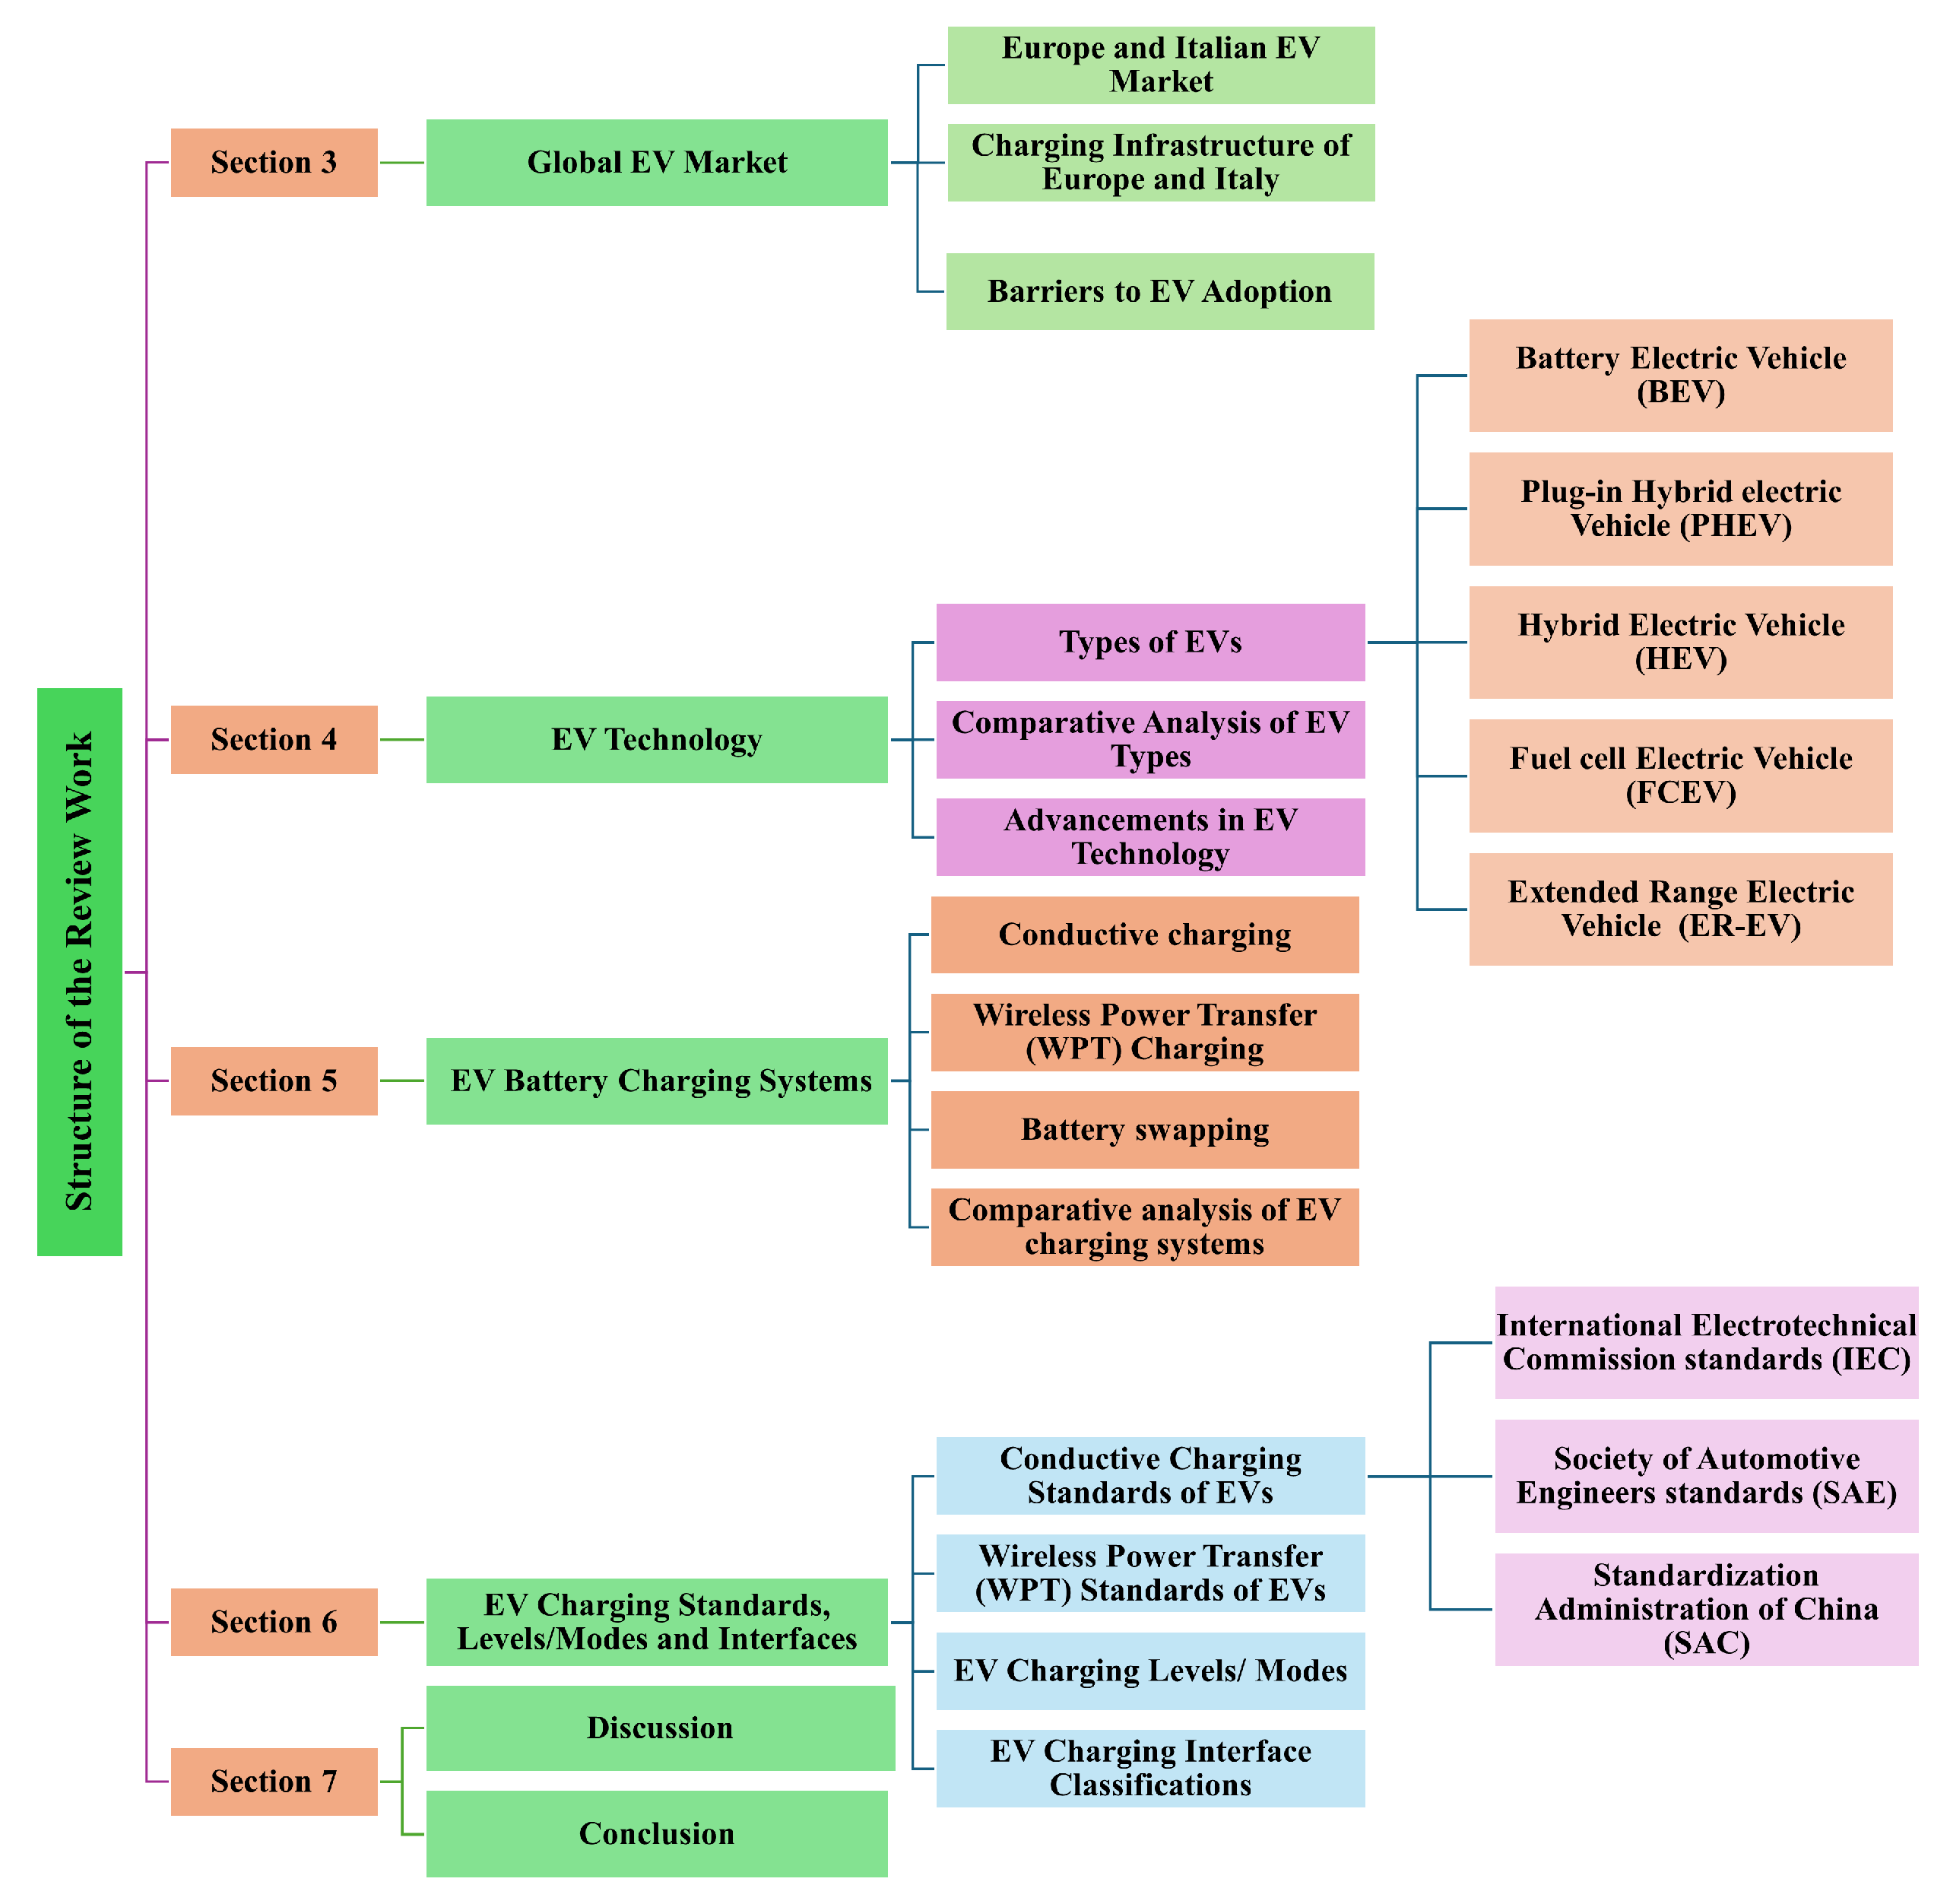
Organization of the Paper

The manuscript is structured as follows:
Section 3 analyzes the global and regional EV market, covering adoption trends, market growth in Europe and Italy, sales comparisons of BEVs and PHEVs, and charging infrastructure distribution. Section 4 classifies the EV types (BEV, PHEV, HEV, FCEV, and REX EV) and compares them based on efficiency, range, cost, and technology. Section 5 examines EV charging systems, including a comparison of conductive, WPT, and BS charging systems. Section 6 reviews global EV charging standards (IEC, SAE, and GB/T), charging levels, interface types, and interoperability challenges. Section 7 presents the Discussion and Section 8 presents the conclusion. Figure 3 shows the structure of the review work.

3. Global EV Market

The global EV market has experienced unprecedented growth in recent years, driven by technological advances, consumer interest, and supportive government policies [28]. China, Europe, and the United States (USA) are the three areas that dominate the global EV market. With more than half of all EVs sold annually, China is the largest EV market and has continuously dominated worldwide sales. Currently, it leads the market, accounting for nearly 45% of global EV sales in 2024, supported by robust domestic manufacturing, extensive government support, and a vast consumer base [29]. PHEVs are more prevalent in regions like the UK, the Netherlands, and Sweden, and BEVs are favored in markets such as France and China, with Norway and Japan maintaining a balanced mix [30].
In 2020, 3 million EVs were sold worldwide and this figure increased to more than 10 million by 2022. According to the IEA Global EV Outlook 2024, new electric car registrations in Europe reached nearly 3.2 million in 2023, marking a 20% increase from 2022. Of these, around 1.1 million were PHEVs, and 2.2 million were BEVs [15]. Countries such as Norway, Sweden, and Germany dominate Europe due to strong incentives, tax benefits, and a well-developed charging infrastructure. Norway is currently leading in Europe in the adoption of EVs, with a market share of 95.8% (8954 out of 9343 fully EVs in January 2025, up from 29% in 2016, 74.7% in 2020, and 89.3% in 2024. In 2020, it became the first country where the sales of electric cars surpassed those of ICE vehicles. It got closer to its goal of EV-only sales by the end of the year [31,32,33,34].
In 2024, worldwide sales of electric vehicles (EVs) totaled around 17.1 million units, representing a 25% rise compared to the previous year. This surge was largely fueled by substantial market growth in China, Europe, and North America. Looking ahead, forecasts suggest that annual sales of EVs could exceed 50 million units by 2030, underscoring the rapid global transition to sustainable transportation [35,36]. Technological innovations such as improved battery efficiency, faster charging, V2G integration, autonomous driving capabilities, and stricter emission regulations are expected to sustain this momentum. With Europe expected to hold a 25% market share and the US over 11% by 2024, the EV market is poised for transformative growth in the coming decade [15]. Although it has a smaller market share than China and Europe, the United States is gradually expanding due to more expenditures on infrastructure and the production of EVs. Although they make up a small portion of worldwide sales, other regions, such as South Korea and Japan, are essential to advancing EV technology. Figure 4 shows how EV sales increased significantly worldwide between 2018 and 2024.

3.1. Europe and Italian EV Market

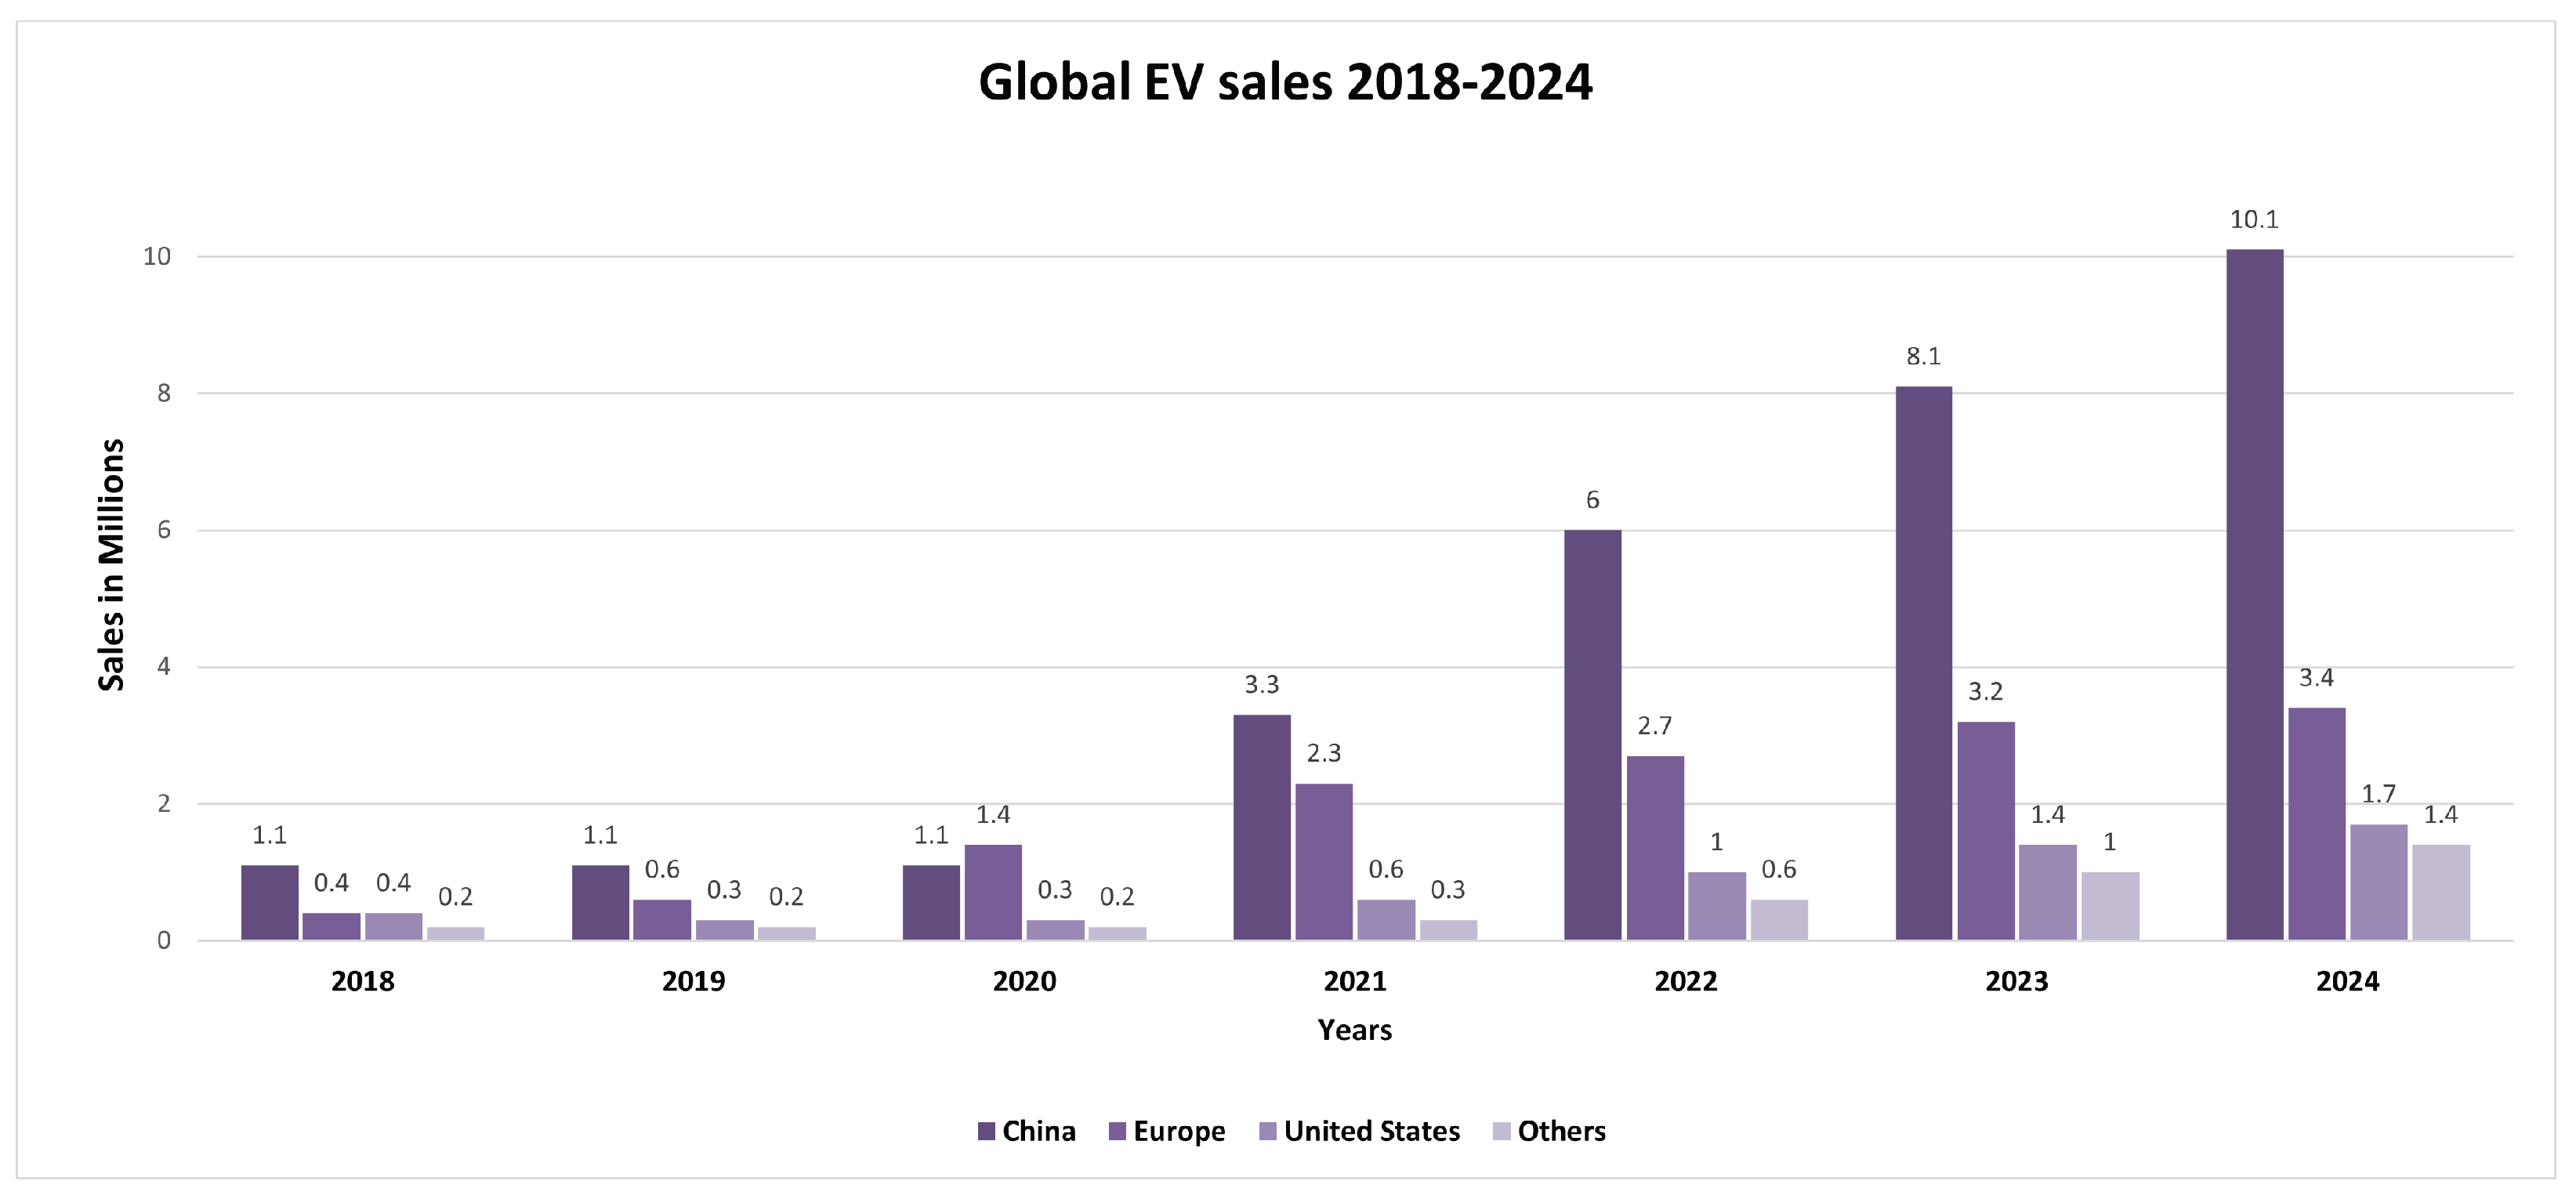
3.1.1. EV Market of Europe

With notable increases in BEV and PHEV sales between 2020 and 2024, the European EV industry has emerged as a major global player in the shift to sustainable transportation. As seen in Figure 4, Europe is growing rapidly and closing the gap with China in terms of EV market volume, despite the disruptions caused by the COVID-19 pandemic [30]. This growth reflects the success of Europe’s strong regulations promoting low-emission vehicles and indicates a broader societal shift toward greener modes of transportation.
Figure 5a shows that the number of EVs sold has increased dramatically from about 1 million in 2020 to 2.5 million in 2024. In particular, as customers choose completely electric solutions over transitional technologies, BEVs have seen a faster growth trajectory, surpassing PHEVs. This pattern shows that consumers are becoming more confident in EV technology due to improved driving ranges, declining battery prices, and the growth of fast charging networks. Despite growing more slowly than BEVs, PHEVs remain popular among drivers who want familiarity and flexibility as they move away from ICE vehicles. When taken as a whole, these patterns demonstrate how Europe is setting the stage for a future with decarbonized transportation [37].
When closely examining annual sales, the decline from 2023 to 2024 in Europe is primarily due to changes in incentives and policies in several major countries, which significantly impacted overall EV sales. This decline is explained in more detail in Section 3.1.2.
In addition to demonstrating the growing popularity of electric cars, Figure 5b, the monthly breakdown of BEV sales in Europe for 2023 and 2024 also identifies the dynamic variables influencing these trends. Sales peaks in March, June, and December most likely coincide with automotive production cycles, government budgetary deadlines for incentives, or the arrival of new models, demonstrating how outside factors influence customer behavior. Compared to 2023, BEV sales in Europe decreased in several months of 2024, mainly due to reduced government incentives, economic challenges, and increased competition from hybrid vehicles [38]. This slowdown indicates that while EVs remain a crucial part of the transition to sustainable mobility, market dynamics, and policy changes have impacted their growth [39]. The graph reflects these changes, showing that external factors have influenced consumer purchasing decisions despite continued interest in BEVs.
As seen in the monthly sales statistics for PHEVs for 2023 and 2024 in Figure 5c, PHEVs continue to play a significant role in the electrification journey of Europe, even as BEVs are at the forefront. The constant demand for PHEVs highlights their function as a bridge technology, attracting those who embrace electric mobility while desiring the security of hybrid systems. According to statistics, PHEV sales have steadily increased over time, reaching their peak in the same months as BEV sales. This concurrent expansion shows a common effect of governmental policies and promotional incentives. However, data suggest that the industry may gradually shift to electric alternatives if BEV sales increase faster. The development of the PHEV industry is consistent with the bigger picture of electrification: as the infrastructure expands, more people choose EVs, and customers become more used to electric powertrains. However, the continued interest in PHEVs underlines their importance in particular areas where the development of the charging infrastructure is still lagging behind [37].
The European Green Deal, which is attempting to achieve carbon neutrality by 2050, is also responsible for developing the European EV industry. Automakers have been encouraged to accelerate their EV offers and switch to sustainable automobile manufacturing due to this campaign [13,14]. However, this remains a highly delicate subject under intense discussion within the European Commission as policymakers debate the balance between ambitious environmental goals and economic feasibility. Key concerns include the affordability of EVs, the pace of expansion of the charging infrastructure, and the competitiveness of the European automotive industry in a rapidly evolving global market [40].

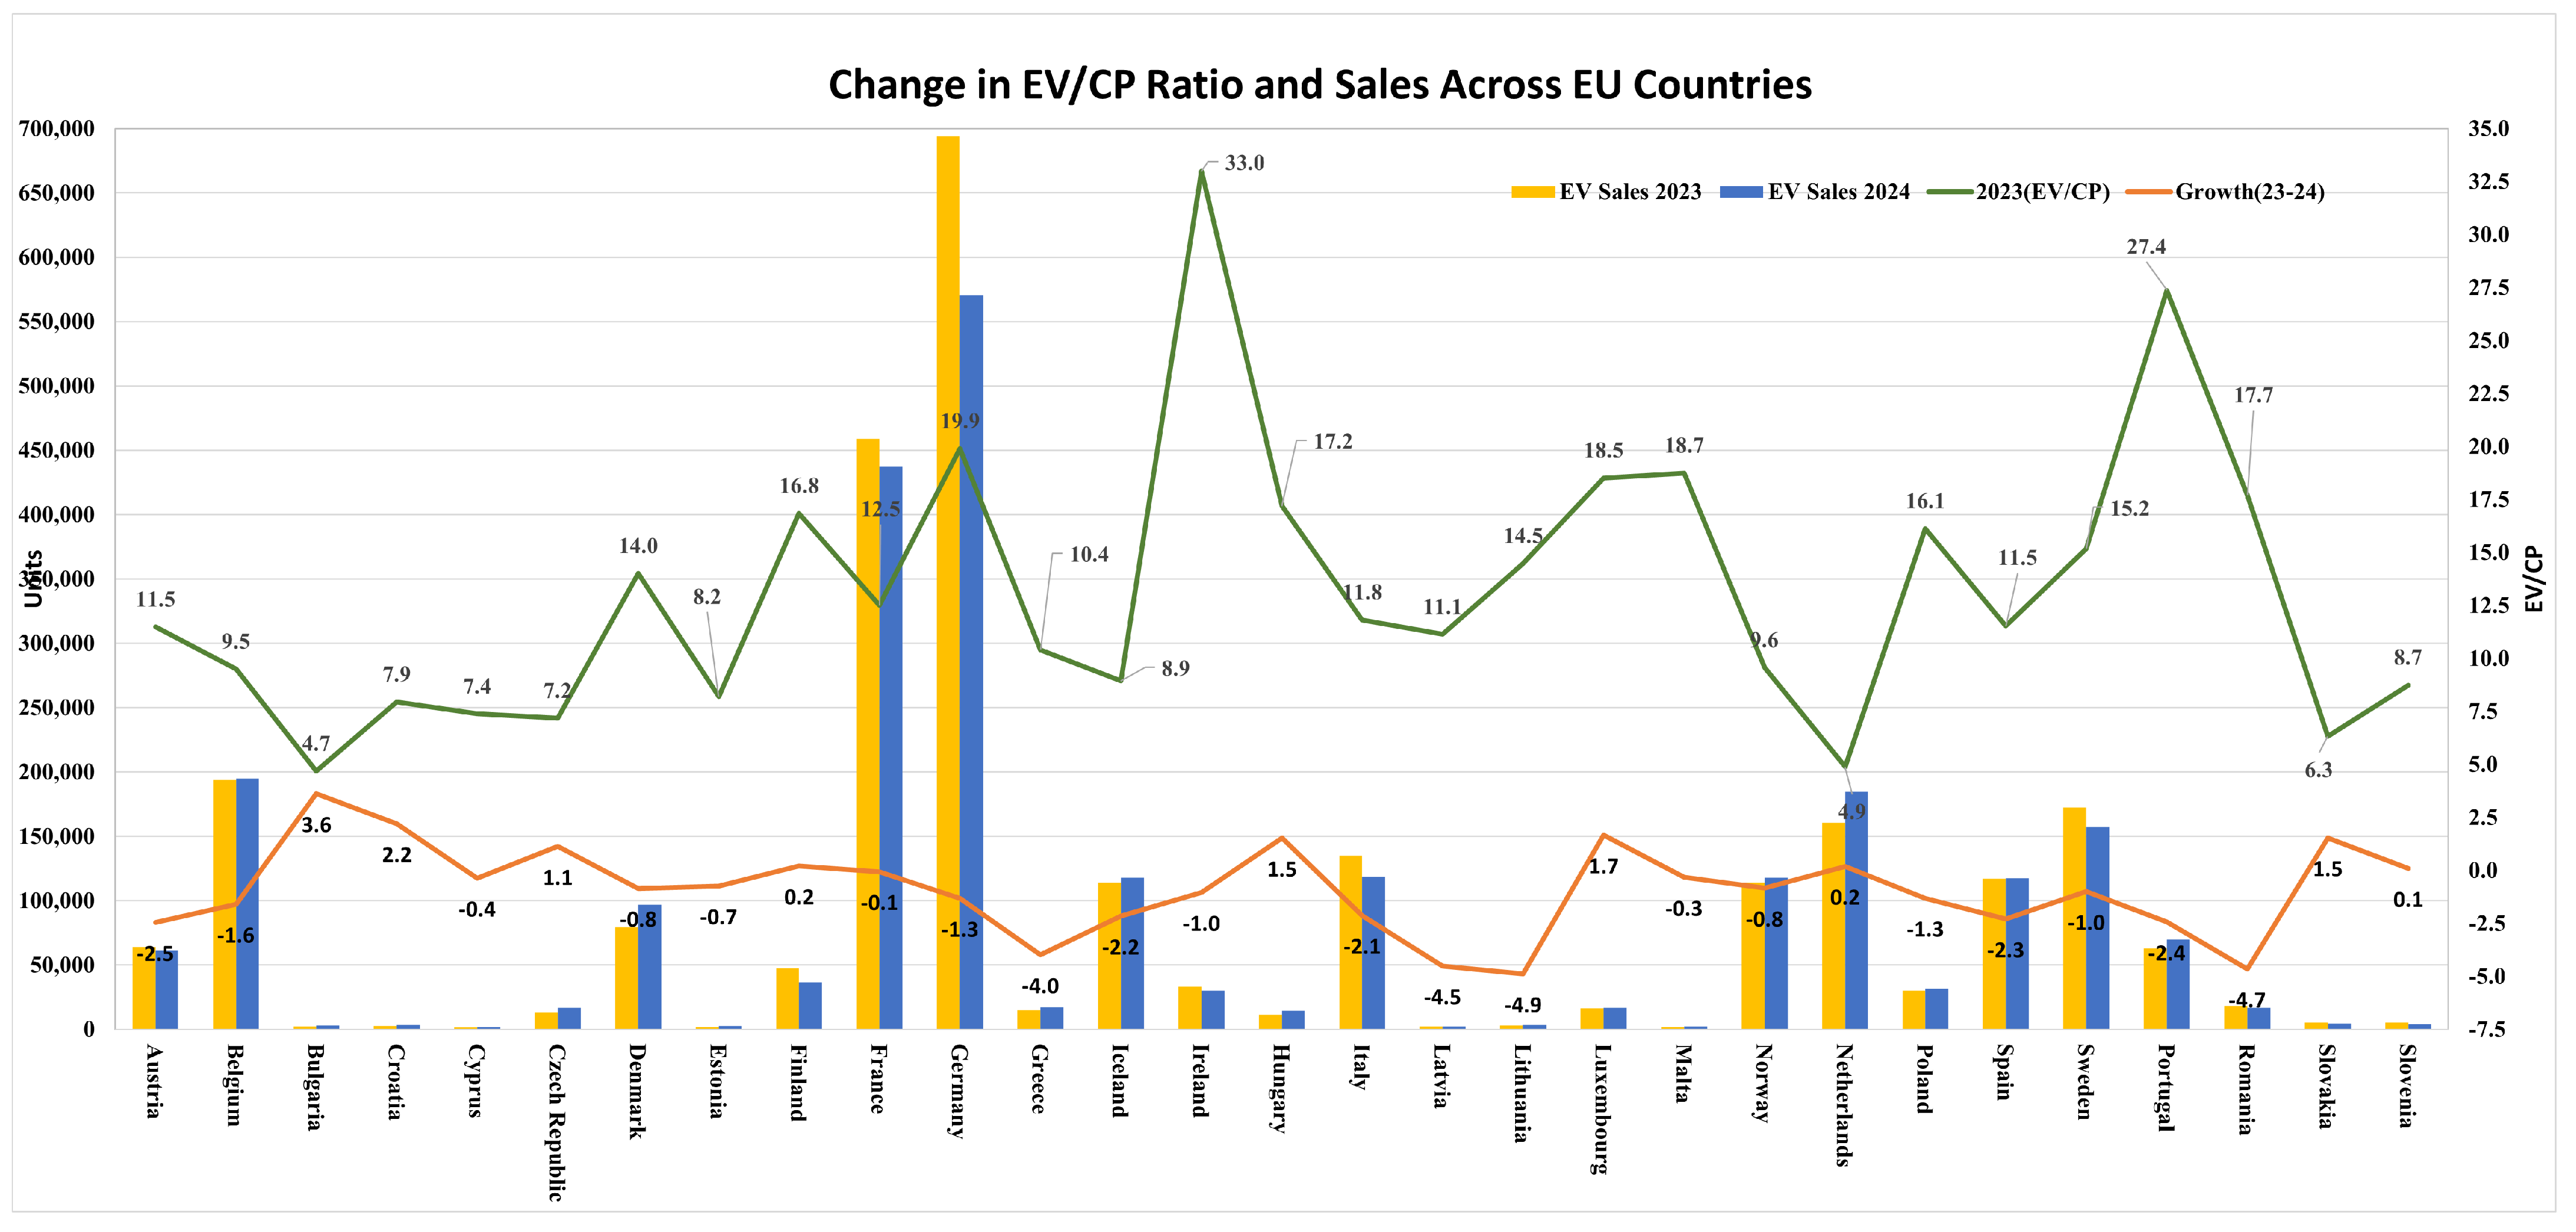
3.1.2. Ev Sales Decline in Europe (2023–2024): A Policy-Driven Trend

Between 2023 and 2024, Europe witnessed a notable decline in EV sales, specifically in BEVs and PHEVs. The combined sales dropped from 2,348,599 units in 2023 to 2,214,708 units in 2024, marking a 5.7% decrease. This trend is significant, given that EV adoption has shown consistent growth in previous years. As illustrated in Figure 6, which displays the total sales (BEV + PHEV) per country (2022–2024) data, this decline in 2024 sales is not uniform across all European markets. Instead, it is primarily driven by sharp sales contractions in a few key countries: Germany, France, Italy, Sweden, Finland, and Switzerland. These countries, traditionally among the top contributors to the European EV market, collectively account for the bulk of the decrease. The policies and incentives of the major countries that influenced 2024 EV sales in Europe are listed in Table A1.
Germany had the highest number of EV sales in 2022, then dropped in 2023 and 2024; see Figure 6a. This decline followed the gradual removal of government support, especially EV purchase incentives for private buyers at the end of 2023 Table A1. Until then, subsidies had significantly boosted consumer interest in EVs. Once removed, it sharply reduced affordability and consumer interest. Market uncertainty and concerns about energy costs compounded the effect [41].
France has been a leader in the adoption of EVs, with sales growing by 40% from 2022 to 2023, then dropping slightly in 2024, due to tighter rules and changes in who qualifies for support. Although incentives remained in place, they were tightened to exclude higher income earners and more expensive vehicle models Table A1. Furthermore, administrative hurdles and delays in EV bonus payouts discouraged buyers [42].
Between 2020 and 2025, Italy introduced some of the most generous incentives in Europe for EVs, offering purchase bonuses, 5-year tax exemptions, and 80% subsidies for charging infrastructure, but EV sales showed little progress, increasing slightly from 119,213 in 2022 to 135,108 in 2023 before falling to 118,486 in 2024, This slowdown occurred despite public awareness of EVs, and sales slowed due to the very short period availability of purchase incentives in 2024 and underwhelming incentive programs. The policy supports lagged demand Table A1 [43].
Sweden experiences a small increase in sales from 2022 to 2023, but sales decreased in 2024 Figure 6. This drop followed the end of key purchase incentives, such as the climate bonus, which had offered up to SEK 70,000 for BEVs Table A1, and its full impact was felt in 2023–2024 as buyer interest decreased. Although lower road taxes and company car tax breaks are still in place, the loss of upfront support has probably made EVs less attractive to buyers. Meanwhile, the charging infrastructure grew rapidly. The government also continued to support home charger installations through tax deductions and the “Ladda Bilen” grant [44].
Finland’s EV market also showed strong growth between 2022 and 2023, supported by strong purchase incentives and tax benefits. However, in 2024, sales dropped despite the continued expansion of the infrastructure Figure 6. This drop reflects the end of direct purchase incentives, showing that, while tax benefits and infrastructure are essential, upfront subsidies are often a decisive factor for private buyers. The case of Finland highlights the need to maintain a balance between long-term fiscal policies and short-term consumer incentives to maintain the momentum of the EV market Table A1 [45].
The 2023–2024 decline in EV sales reveals the market’s high sensitivity to policy changes. A stable and predictable policy framework is crucial to maintaining consumer trust and industry growth. Instead of abrupt incentive cuts, governments should pursue gradual phase-outs based on clear milestones such as EV cost parity or infrastructure readiness. Although targeting low-income groups ensures equity, broad middle-class participation is vital for scaling adoption and meeting climate goals. Looking ahead, a coordinated pan-European EV strategy is needed to reduce policy fragmentation. Long-term success depends on aligning incentives with parallel investment in charging networks, battery production, and supply chains. Without such an approach, the EV market may face repeated cycles of instability, slowing Europe’s transition to clean mobility.

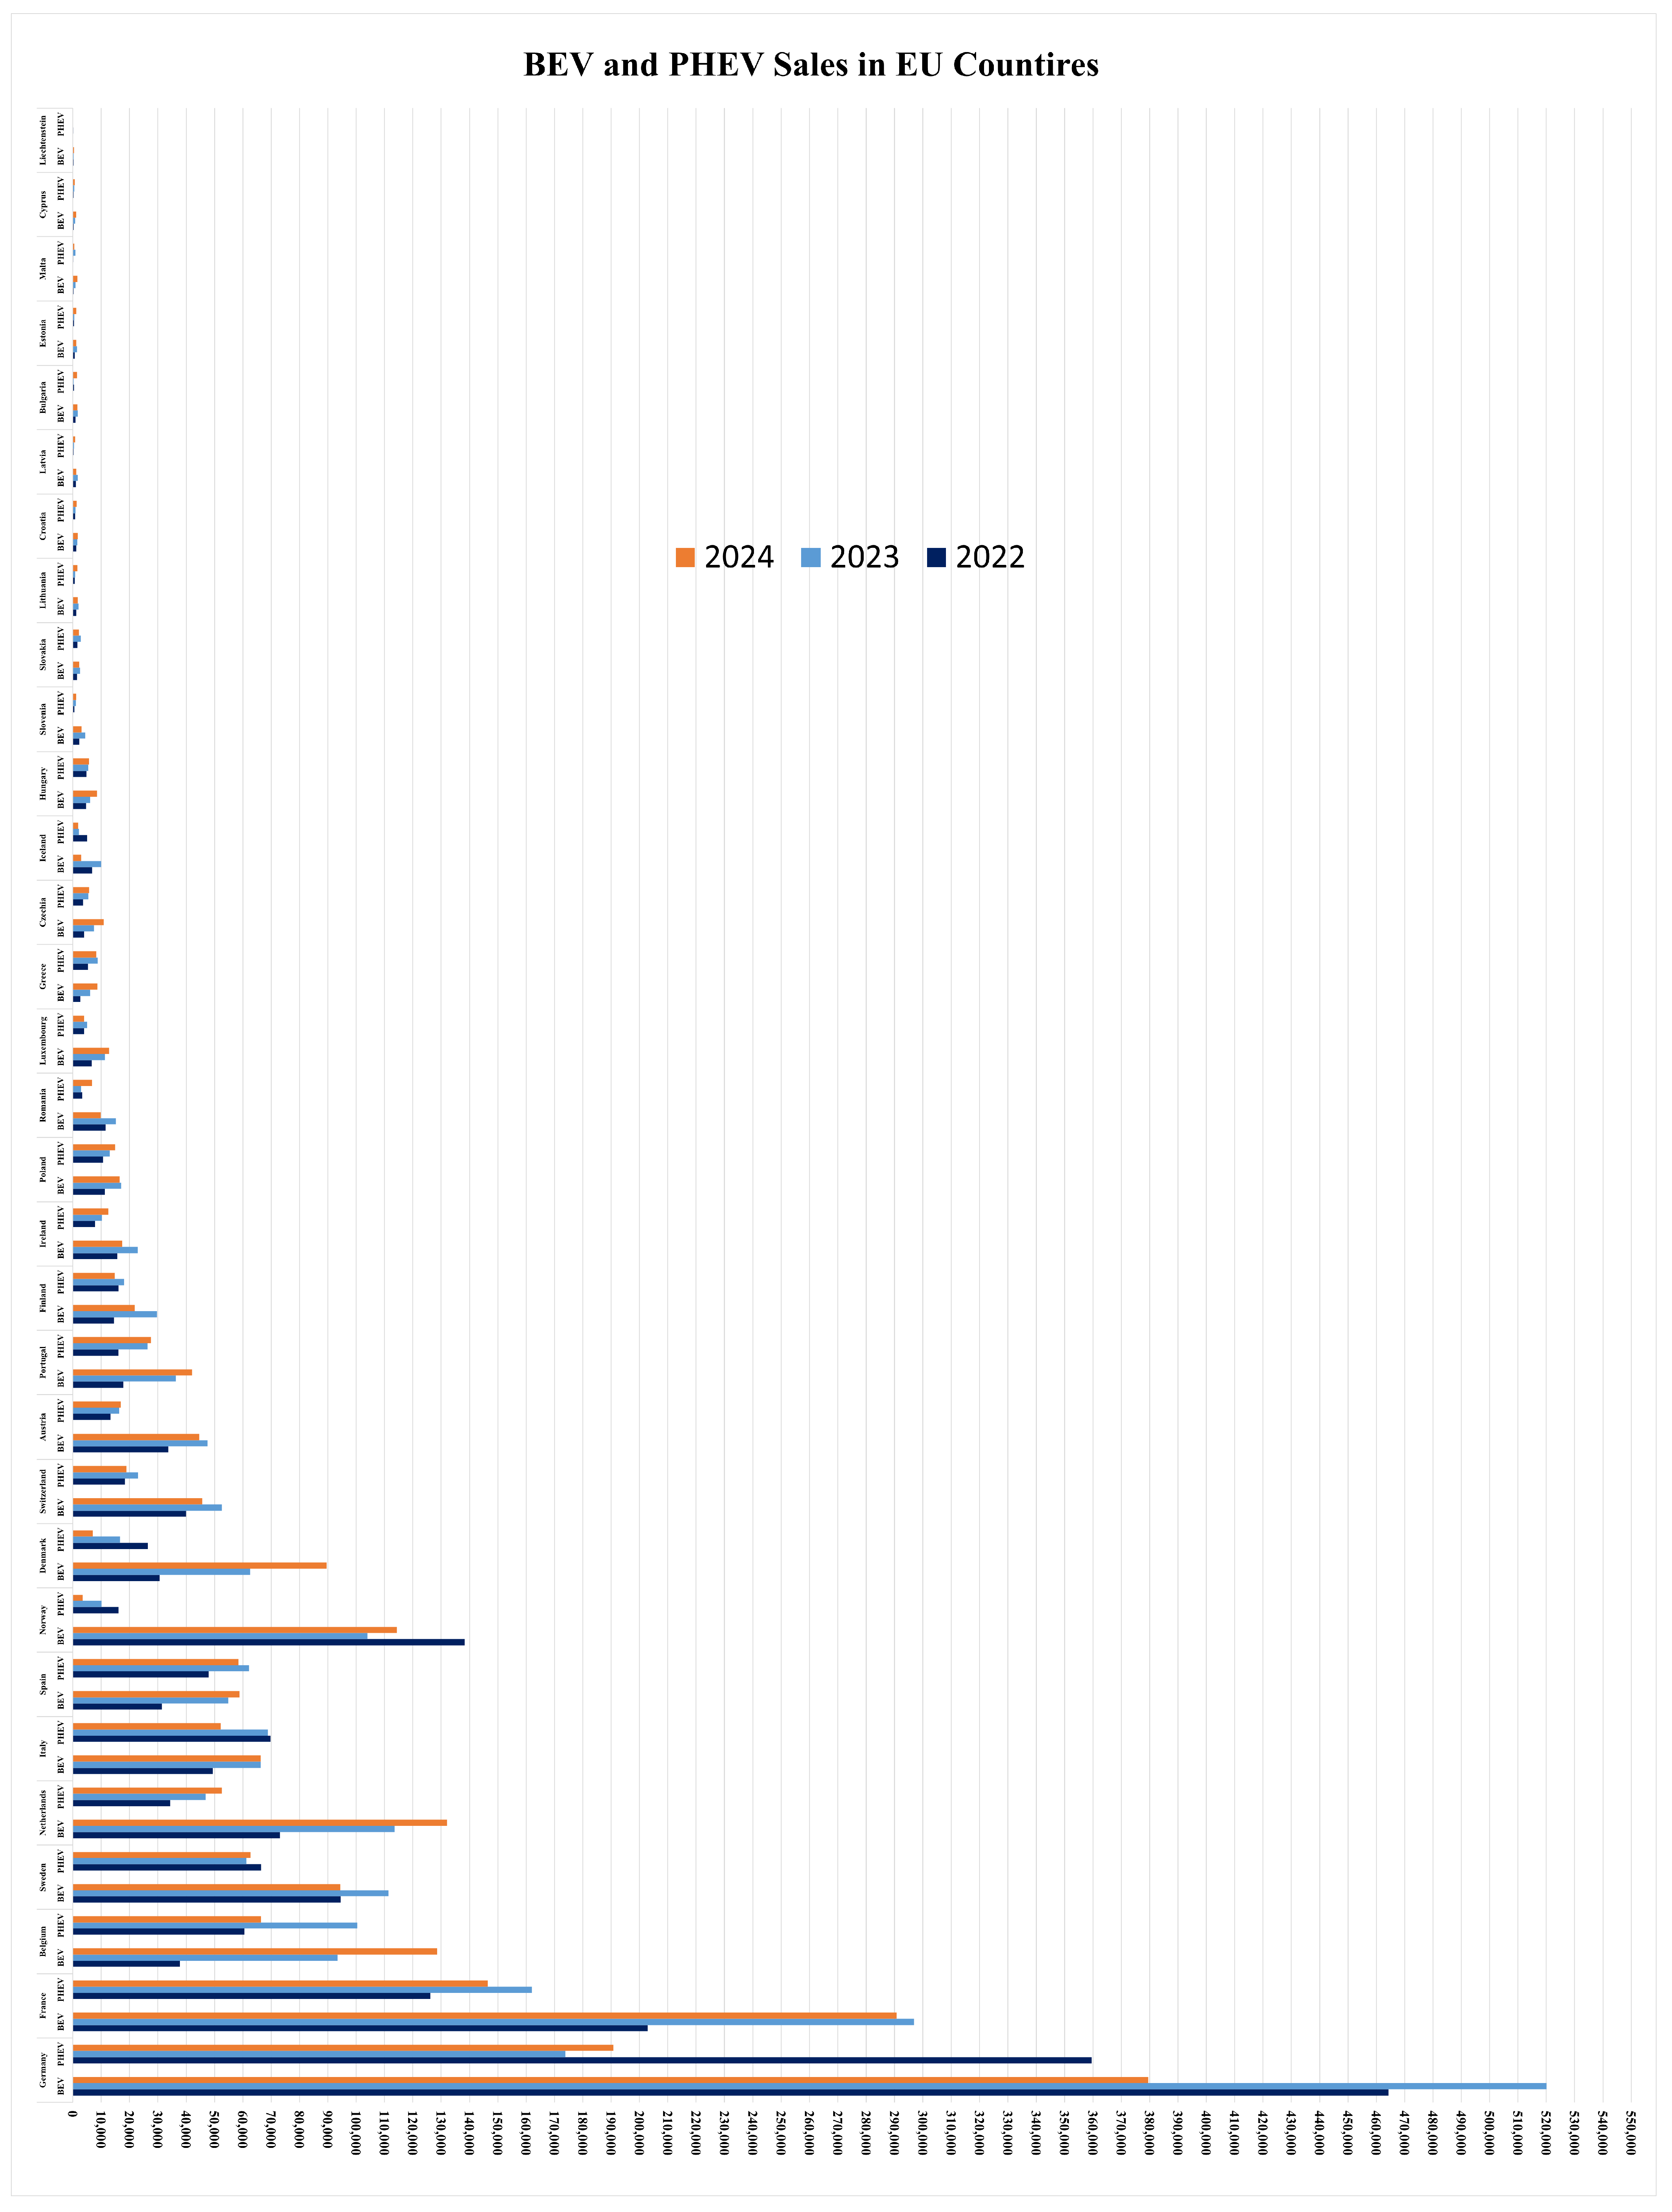
3.1.3. Analysis of Europe EV Models

Based on the EV database [46], more than 400 EV models are available on the European market. These models represent various vehicle types, manufacturers, and technological advances. There are two critical performance aspects of these EV models to analyze: (1) Energy consumption watt-hour/kilometers (Wh/km) is a metric that provides a measure of the energy efficiency of EVs, which is essential to evaluate their operational costs, environmental impact, and alignment with sustainability goals. (2) On-board charger (OBC) power ratings play a crucial role in determining the charging speed and convenience of an EV, directly impacting user satisfaction and overall adoption rates. One of the primary advantages of an OBC is its ability to recharge EVs using Alternating Current (AC) charging stations, which are the most widely available and cost-effective charging solution. EV drivers commonly adopt AC charging due to its affordability and accessibility, making it a preferred method to charge at night and at home. By supporting efficient AC charging, OBCs contribute significantly to the convenience and feasibility of EV ownership.
The analysis of 435 EV models in Europe highlights trends in energy consumption measured in Wh/km as shown in Figure 7. Most models cluster between the 155 and 185 range, with the 165–170 range being the most common in 44 models, followed by the 175–180 range in 42 models and the 180–185 range in almost 40 models. Lower consumption ranges of 130–150 are rare, while higher ranges of 185–200 gradually decline in prevalence [46]. These patterns reflect the manufacturers’ focus on balancing efficiency and performance to meet consumer demands and regulatory standards. The European EV market is a global benchmark for achieving optimal energy efficiency in advanced EV technology.
Figure 8 shows the OBC power ratings. Among the four primary OBC power levels, the 11 kW standard power is the most popular, adopted by almost 337 models in Europe, and 22 kW, 7.4 kW, and 6.6 kW are used in 39, 36, and 19 models, respectively. For optional powers, higher power ratings dominate; the 22 kW power appears in 96 models, while the 11 kW power is in 32 models. The OBC power rating determines the charging speed and efficiency of an EV, influencing affordability and convenience. Lower-power OBCs (6.6 kW, 7.4 kW) are cost-effective solutions for small EVs, suitable for home and public AC charging. Midrange OBCs (11 kW) balance speed and affordability, ideal for midsize EVs with three-phase charging access. High-power OBCs (22 kW) are found in premium EVs, enabling faster AC charging, but require specialized infrastructure [40].

3.1.4. EV Market of Italy

Between 2020 and 2024, Italy’s EV industry grew steadily, mainly due to government subsidies, increased consumer awareness, and the development of charging stations. However, compared to other key European markets, Italy has faced particular obstacles, such as delayed charging station installations and different regional acceptance rates [43].
As shown in Figure 9a, EV sales in Italy jumped from around 60,000 units in 2020 to more than 140,000 units in 2024. PHEVs and BEVs have contributed to this. Between 2020 and 2024, BEV sales in Italy tripled due to rising consumer confidence in fully EVs. This rise was made possible by government initiatives such as the Eco-bonus program, which offered financial assistance to purchase EVs and an exemption from vehicle registration payments. Given their sizable market share, PHEVs can be a transition option for customers who are not yet ready to switch to BEVs. This is particularly true in places with inadequate charging infrastructure, where dual flexibility is still favored. The rise in EV sales demonstrates Italy’s determination to reach the broader European decarbonization goals, although at a slower pace due to regional obstacles.
Figure 9b shows that the monthly breakdown of BEV sales for 2023 and 2024 exhibits notable fluctuations, and several months in 2024 recorded lower sales compared to 2023. In particular, March to August 2024 experienced significant declines, possibly due to reduced government incentives, economic uncertainties, and slower infrastructure development Table A1. However, June 2024 showed a high increase, suggesting a potential recovery or a seasonal demand shift. This pattern reflects a complex interaction of policy changes, consumer preferences, and market conditions, underscoring the need for sustained support and investment in the Italian EV sector to ensure long-term growth [47,48].
Figure 9c shows that, like BEVs, PHEV sales in Italy follow a seasonal trend, peaking in March, June, and December. PHEV sales are still smaller than those of BEVs despite this, suggesting that consumer preferences have changed. Consumers who value hybrid technology’s adaptability keep gravitating to PHEVs, particularly in suburban or rural areas with few charging outlets. As customers adjust to better infrastructure and less range anxiety, the slower increase in PHEVs in 2024 compared to BEVs points to a gradual shift toward complete EVs. Although PHEVs are still a crucial first step in the Italian EV industry, their importance is expected to decline as BEVs become more widely available and helpful.

3.2. Charging Infrastructure of Europe and Italy

3.2.1. Charging Infrastructure of Europe

The development of charging infrastructure has primarily facilitated the rapid increase in the adoption of EVs in Europe. Thanks to the concerted efforts of governments, automakers, and private firms, the area saw significant advances in AC and DC charging networks between 2020 and 2024 [49].
Between 2020 and 2024, Europe’s total number of charging stations increased dramatically as seen in Figure 10a. The extensive use of slower charging options for home and office environments was reflected in the deployment of AC charging stations, which outnumbered DC charging stations. However, the consistent expansion of DC charging stations emphasizes the growing need for quicker recharging options in cities and on the highways. Most of the installed charging stations were AC chargers, satisfying the demand of regular EV users to charge at home and at work. To fulfill the need for high-speed charging options for long-distance trips and business EV fleets, the number of DC charging stations increased gradually, although more slowly.
Figure 10b, which divides AC chargers into three categories, provides more information about the expansion of AC charging stations in Europe. Slow AC: single-phase (<7.4 kW). Due to consumers’ growing preference for fast charging options, the percentage of sluggish AC chargers stayed constant but was still relatively low. Medium-speed and fast-speed AC chargers, which accounted for a large amount of the expansion at this time, dominated the market (7.4–22 kW) and (>22 kW), respectively. These chargers are frequently seen in public areas, including parking lots, malls, and offices. The market’s desire for mid-range charging speeds that balance installation costs and charge efficiency is demonstrated by this classification.
Although they comprise a minor part of the overall infrastructure, DC charges are essential to reduce range anxiety and facilitate long-distance travel Figure 10c. There are four types of DC chargers: slow DC (<50 kW), fast DC (between 50 and 150 kW), Level 1 ultrafast DC (150–350 kW), and Level 2 Ultra-fast DC (>350 kW). Ultra-fast DC chargers have been given priority in Europe, especially for busy metropolitan areas and highway corridors. Despite the general increase, many countries have different DC charging point distribution strategies, with Germany, the Netherlands, and Norway setting the standard.

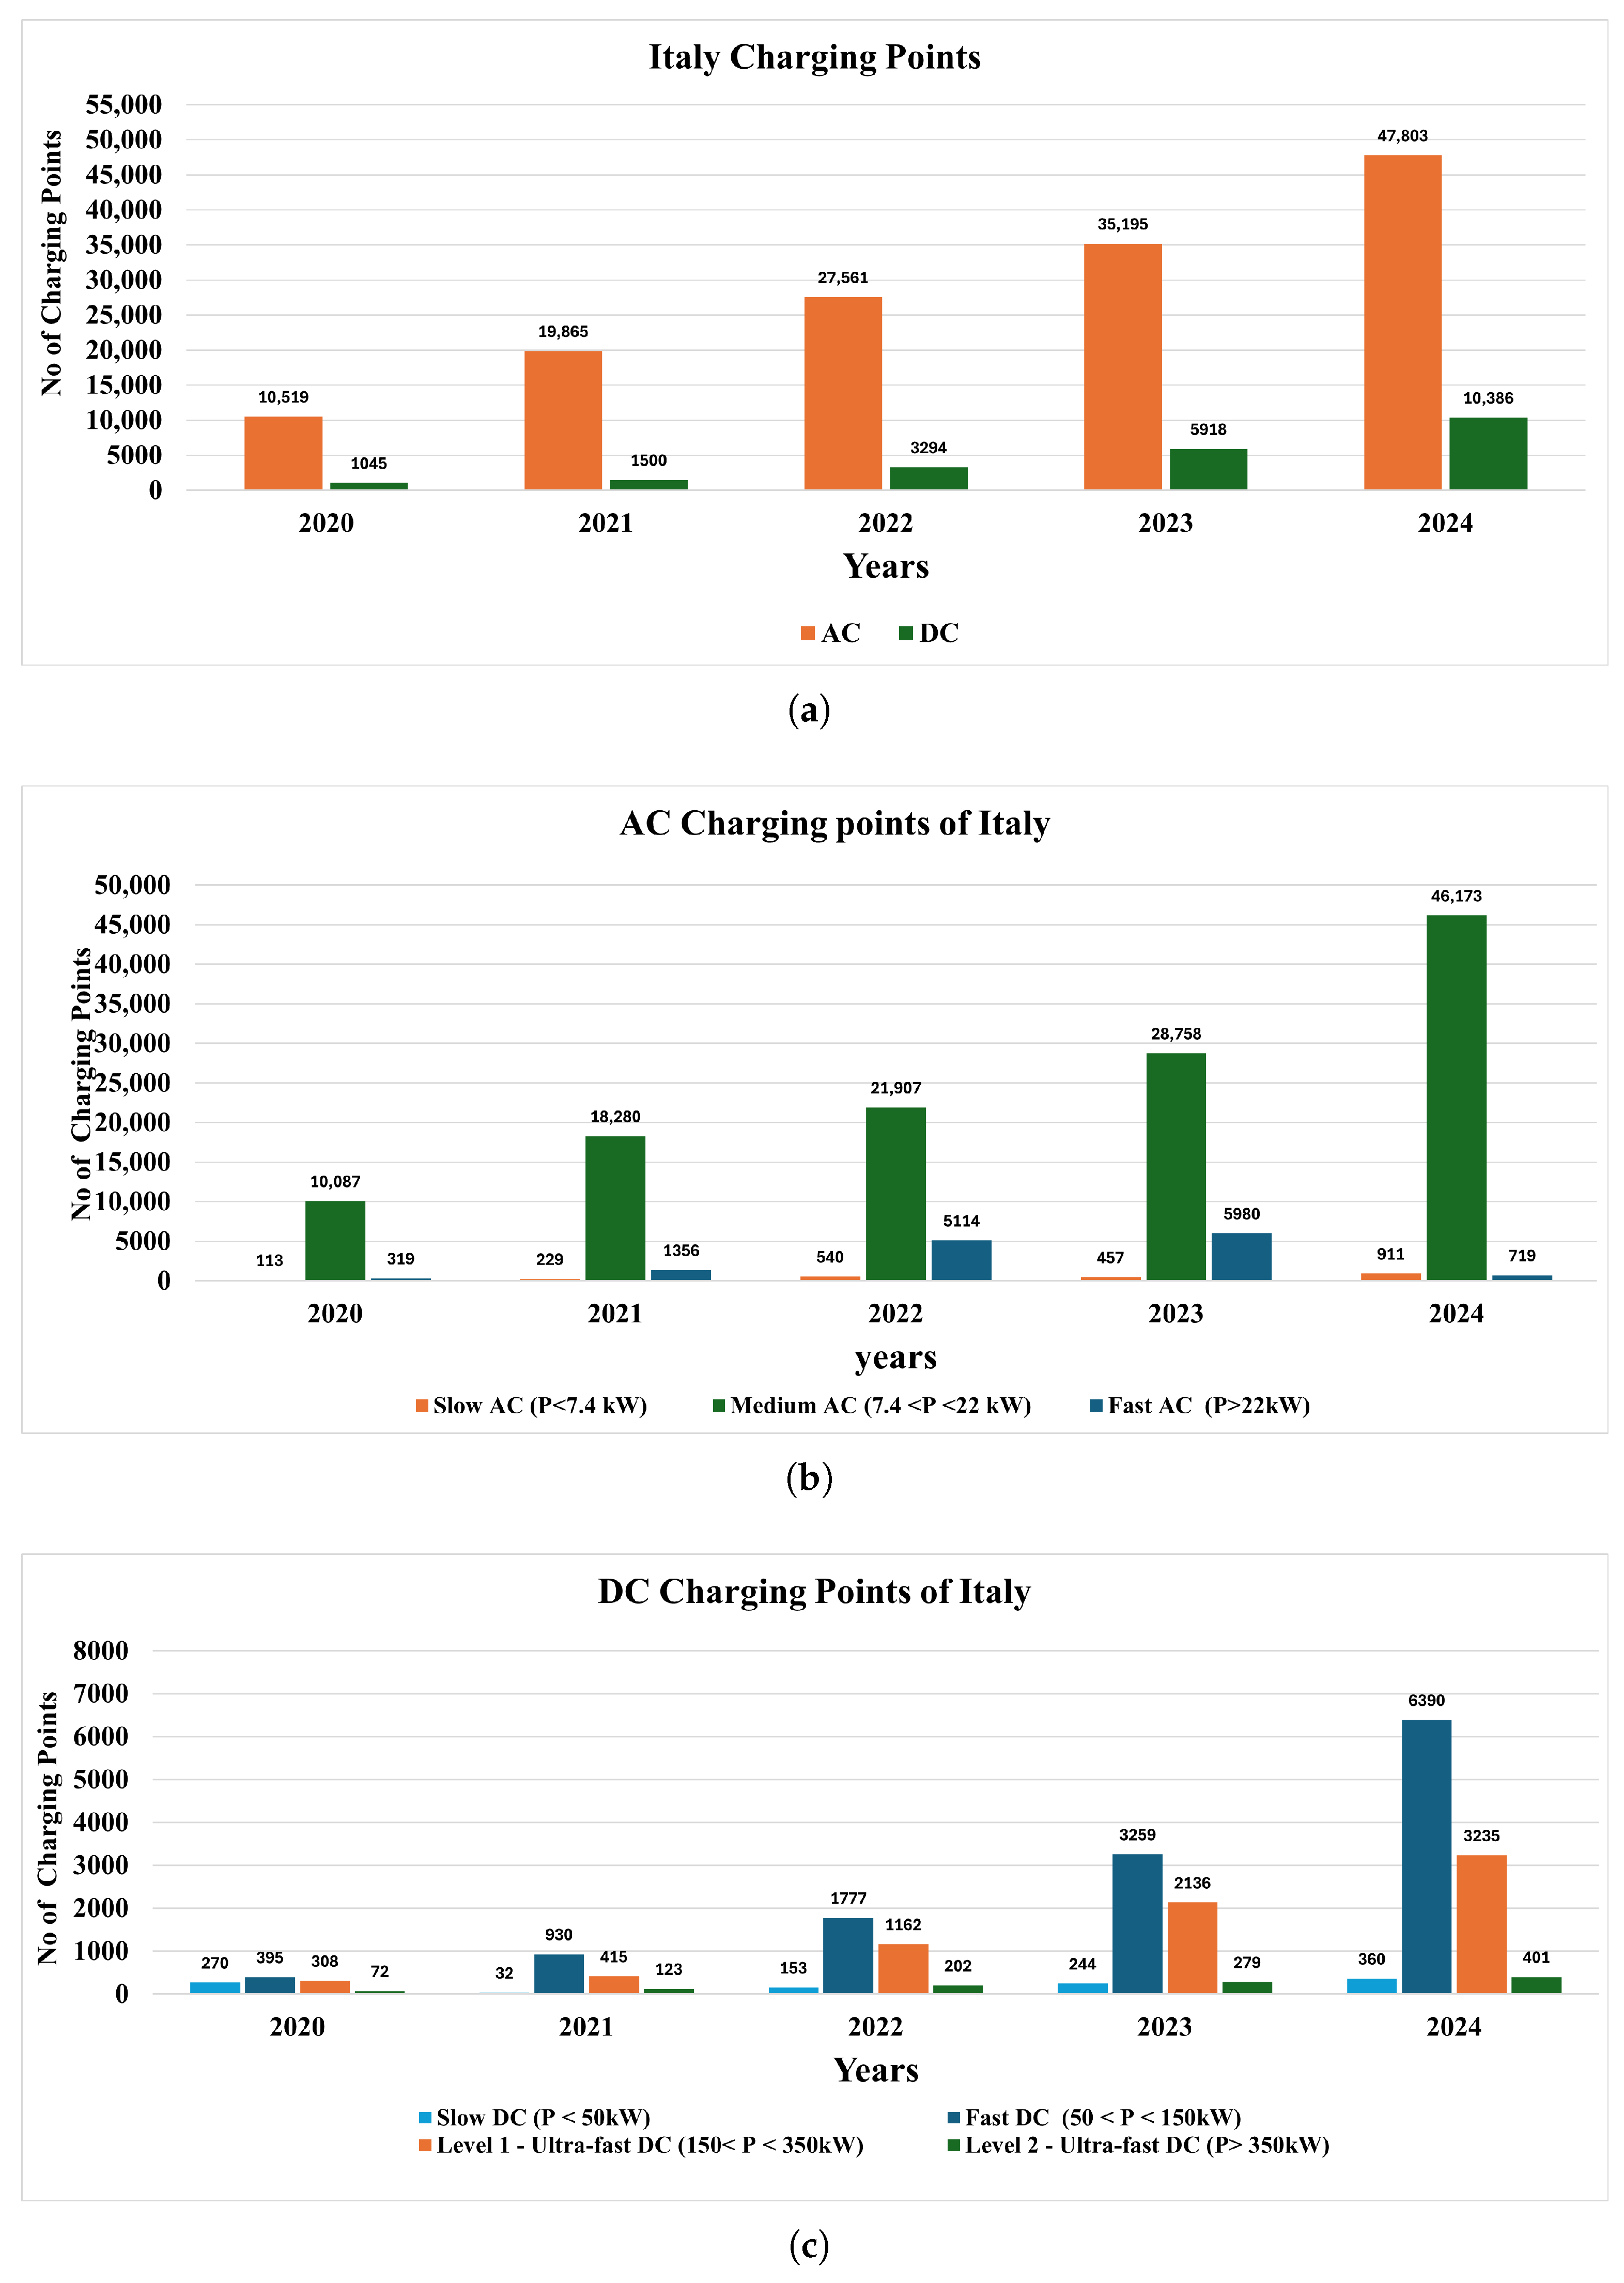
3.2.2. Charging Infrastructure of Italy

Despite regional variations in the rate of development, Italy has made notable progress in developing its EV charging infrastructure between 2020 and 2024. Private-sector investments, government-led programs, and EU-wide decarbonization objectives have primarily fueled the expansion. However, issues continue to exist, including unequal regional distribution, a lack of ultra-fast charging networks, and a slower adoption rate than nations in northern Europe. Despite these obstacles, Italy’s infrastructure for charging EVs is improving, meeting the country’s increasing demand [50].
Figure 11a illustrates how the number of charging stations in Italy gradually increased from around 20,000 in 2020 to more than 60,000 in 2024. The growth shows the nation’s commitment to creating an efficient system that can handle the growing EVs on the road. However, there is still a noticeable disparity between AC and DC chargers, and most installations are AC chargers. Due to their lower installation costs and versatility for home and office use, AC chargers are the most common in the Italian charging network. These chargers meet the demands of light car users and regular commuters who can handle extended charging durations. During this time, the number of DC chargers has increased consistently, although it makes up a lower percentage of the entire network. Long-distance travel is made possible by DC charges, which are essential to reduce range anxiety, particularly on highways and in crowded metropolitan areas. The difference between AC and DC chargers emphasizes how crucial it is to invest in high-speed charging options to satisfy the demands of business and long-distance EV customers [50].
AC charging stations are broken down by type in Figure 11b: slow AC charging points (up to 7.4 kW), medium AC charging points (7.4 –22 kW), and fast AC (P > 22 kW). This segmentation reveals interesting patterns in the development of AC infrastructure in Italy. Most of the expansion in AC infrastructure was driven by medium-speed AC chargers, which increased from 10,000 in 2020 to more than 40,000 in 2024. These chargers are perfect for installation in public areas like shopping malls, office buildings, and parking lots since they compromise price and charging speed. Slow AC chargers are helpful for home charging, where customers can leave their cars plugged in overnight, even if they constitute a smaller percentage of the overall AC infrastructure. Due to their versatility and cost, AC chargers are becoming increasingly popular for residential and business applications. As EV usage increases, medium-speed chargers are expected to continue to serve as the foundation of Italy’s charging infrastructure, facilitating a steady shift to faster charging options [50].
DC charges have grown significantly between 2020 and 2024 as Figure 11c illustrates. DC chargers are further divided into four groups: ultra-fast DC solutions (UF DC Level 1: 150–350 kW and UF DC Level 2: >350 kW), fast DC (50–150 kW), and slow DC (<50 kW). A significant percentage of DC installations are fast DC chargers, which serve EV users who need rapid recharges for business or interstate trips. Although they still have uses, slow DC chargers are losing ground to quicker options. Italy’s emphasis on facilitating long-distance EV travel and satisfying the demands of high-mileage consumers is reflected in the notable growth of ultra-fast DC chargers. UF DC Level 2 chargers have started to appear in premium areas to prepare the network for future EV technologies with higher battery capacity. In contrast, UF Level 1 chargers have been steadily adopted along essential roads and EV hubs. Rural areas are neglected by DC charger deployment, which is disproportionately concentrated in urban and industrial locations. The need for focused infrastructure initiatives to provide fair access to high-speed charging throughout the country is highlighted by this unequal distribution [50].
A thorough overview of Italy’s charging infrastructure development between September 2019 and September 2024 may be seen in the timeline in Figure 12. Three essential indicators are monitored: charging points (A fixed or mobile interface, having one or more connectors, charging only one EV at a time), charging stations (physically installed, charging more than one EV at a time), and charging pools (site, a unique address, location, where one or more charging stations are installed). From over 20,000 charging stations in 2019 to over 60,000 in 2024, the number of charging stations almost quadrupled. The efficiency of government subsidies and European Union (EU) financing initiatives meant to hasten the adoption of EVs is demonstrated by this quick rise. Peaks in the infrastructure deployment match important policy turning points, including the start of the EU’s Green Deal, which highlighted electrification as a crucial decarbonization plan of action, and the Ecobonus program, which offered incentives for establishing charging stations. The data show consistent monthly increases in charging pools, stations, and points, demonstrating the continued momentum in Italy’s EV ecosystem. Despite these developments, the relatively slow dissemination of EVs in rural and southern regions remains a significant barrier to their wider adoption [51].

3.2.3. Regional Distribution of Charging Infrastructure in Italy

The location of the charging infrastructure in Italy varies notably by region, with the northern and urban areas having a far larger number of charging stations than the rural and southern areas. This discrepancy highlights the need for targeted investments to ensure equal access to EV charging stations worldwide [52].
As seen in Figure 13a, there are notable locations. Differences in the number of public and private charging stations in Italy. Lombardia is the region with the most charging stations in the country, followed by Piemonte, Lazio, and Veneto. These regions benefit from proactive regional policies that support the infrastructure of EVs, higher urbanization rates, and improved economic conditions. Due to private investments and commercial installations in commercial buildings and residential complexes, urban areas in these regions also have higher percentages of private charging stations. There are far fewer charging stations in southern areas like Molise, Basilicata, and Valle d’Aosta, which indicates slower EV adoption rates and less infrastructure spending. The disparity between private and public stations highlights the need for concerted efforts to improve public infrastructure in areas neglected [52].
Figure 13b displays the distribution of AC charging stations by region, separating Slow, Quick, and Fast AC chargers. With the largest network of quick and fast AC chargers, Lombardia has the best infrastructure for AC charging compared to other areas. With many medium-speed chargers ideal for commuters in cities and suburbs, Piemonte, Lazio, and Veneto are the next largest donors to the AC network. Slow AC chargers are still widely used in rural areas, where overnight charging is most convenient, although their usage is largely restricted in metropolitan areas. Due to their affordability and versatility for use in public, commercial, and domestic settings, AC chargers are widely used in all locations [52].
Figure 13c displays the distribution of DC charging stations divided into Ultra-Fast and High Power Charging. Most UF DC chargers are found in areas like Lombardia, Piemonte, and Veneto, especially near major highways and metropolitan centers. These chargers ease range anxiety for the adoption of EVs by catering to long-distance and high-mileage drivers. Very few UF chargers are deployed in rural and southern areas like Molise, Basilicata, and Calabria, which have little infrastructure for DC charging. This discrepancy emphasizes the urgent need for these locations to invest in high-speed charging infrastructure. In almost every location, Ultrafast DC chargers (50–150 kW) make up a sizable amount of the DC network, serving ordinary EV consumers and business fleets [52].
In addition to demonstrating a forward-thinking strategy, the deliberate positioning of ultra-fast chargers in economic centers also identifies geographical shortages that must be filled to expand EVs nationwide. The wider socioeconomic and geographic variations throughout Italy are reflected in regional discrepancies in public and private AC and DC charging infrastructure. Important findings include the following. Due to higher EV adoption rates, improved financing sources, and more robust regional regulations, urban areas such as Lombardia, Lazio, and Piemonte have the best charging infrastructure. The lack of adequate public charging networks in rural and southern regions restricts the adoption of EVs. Public–private partnerships and particular government subsidies are required to accelerate infrastructure building. Given the increasing popularity of HPC (>150kW) in demand locations, there is an opportunity to replicate this strategy in underserved areas, especially along significant transit routes [52].

3.3. Linking EV Adoption to Charging Point Availability Across Europe

As the usage of electric vehicles increases across Europe, a suitable charging infrastructure is critical for long-term growth. Sales data illustrate market trends but may not fully reflect a country’s infrastructural readiness. The EV-to-charging-point (EV/CP) ratio provides a more precise assessment, with lower values indicating improved accessibility and less network strain. This section compares 2023–2024 EV sales to EV/CP ratio changes in European countries. As demonstrated in Figure 14, where the green line shows the 2023 EV/CP ratio and the blue one shows the improvement from 2023 to 2024, several countries strengthened their infrastructure despite dropping sales [37], emphasizing continuous investment and policy-driven expansion, regardless of short-term demand swings.
For example, in Romania, the EV/CP ratio improved from 17.7 in 2023 to 13.0 in 2024, despite a 8% decline in EV sales. Similarly, Latvia recorded a 4.5-point improvement with a drop in sales 5%. In Austria, the ratio decreased from 11.5 to 9.0, while sales decreased by 4%. Spain also demonstrated an improvement ratio of 11.5 to 9, while sales were almost the same as in 2023 [53,54,55,56].
In Italy, the ratio dropped from 11.8 to 9.7, although sales decreased almost 12%. Similarly, Germany saw an improvement in its 1.3-point ratio, but sales decreased almost drastically by 18%. France and Sweden also improved their EV/CP ratio to 1.0 point, but sales declined 5% and 9%, respectively [41,42,43,44].
However, Belgium, Iceland, Norway, and Poland also show clear improvements in infrastructure, reflected in a decreasing EV/CP ratio at 1.6, 2.2, 0.8, and 1.3, respectively, with only a minor improvement in sales at 1%, 3%, 3%, and 4%, respectively [57,58,59,60].
These findings indicate that the charging infrastructure in Europe is steadily improving, even as EV sales have declined in some countries. This suggests that the decline in sales from 2023 to 2024 is not primarily due to infrastructure limitations but is more likely driven by other factors, most notably changes in national incentive policies. As detailed in Section 3.1.2 and in Table A1, reductions in subsidies, tax benefits, or purchase incentives have significantly influenced consumer demand. Thus, while infrastructure expansion reflects ongoing policy and investment commitments, EV adoption remains highly responsive to changes in financial support mechanisms.

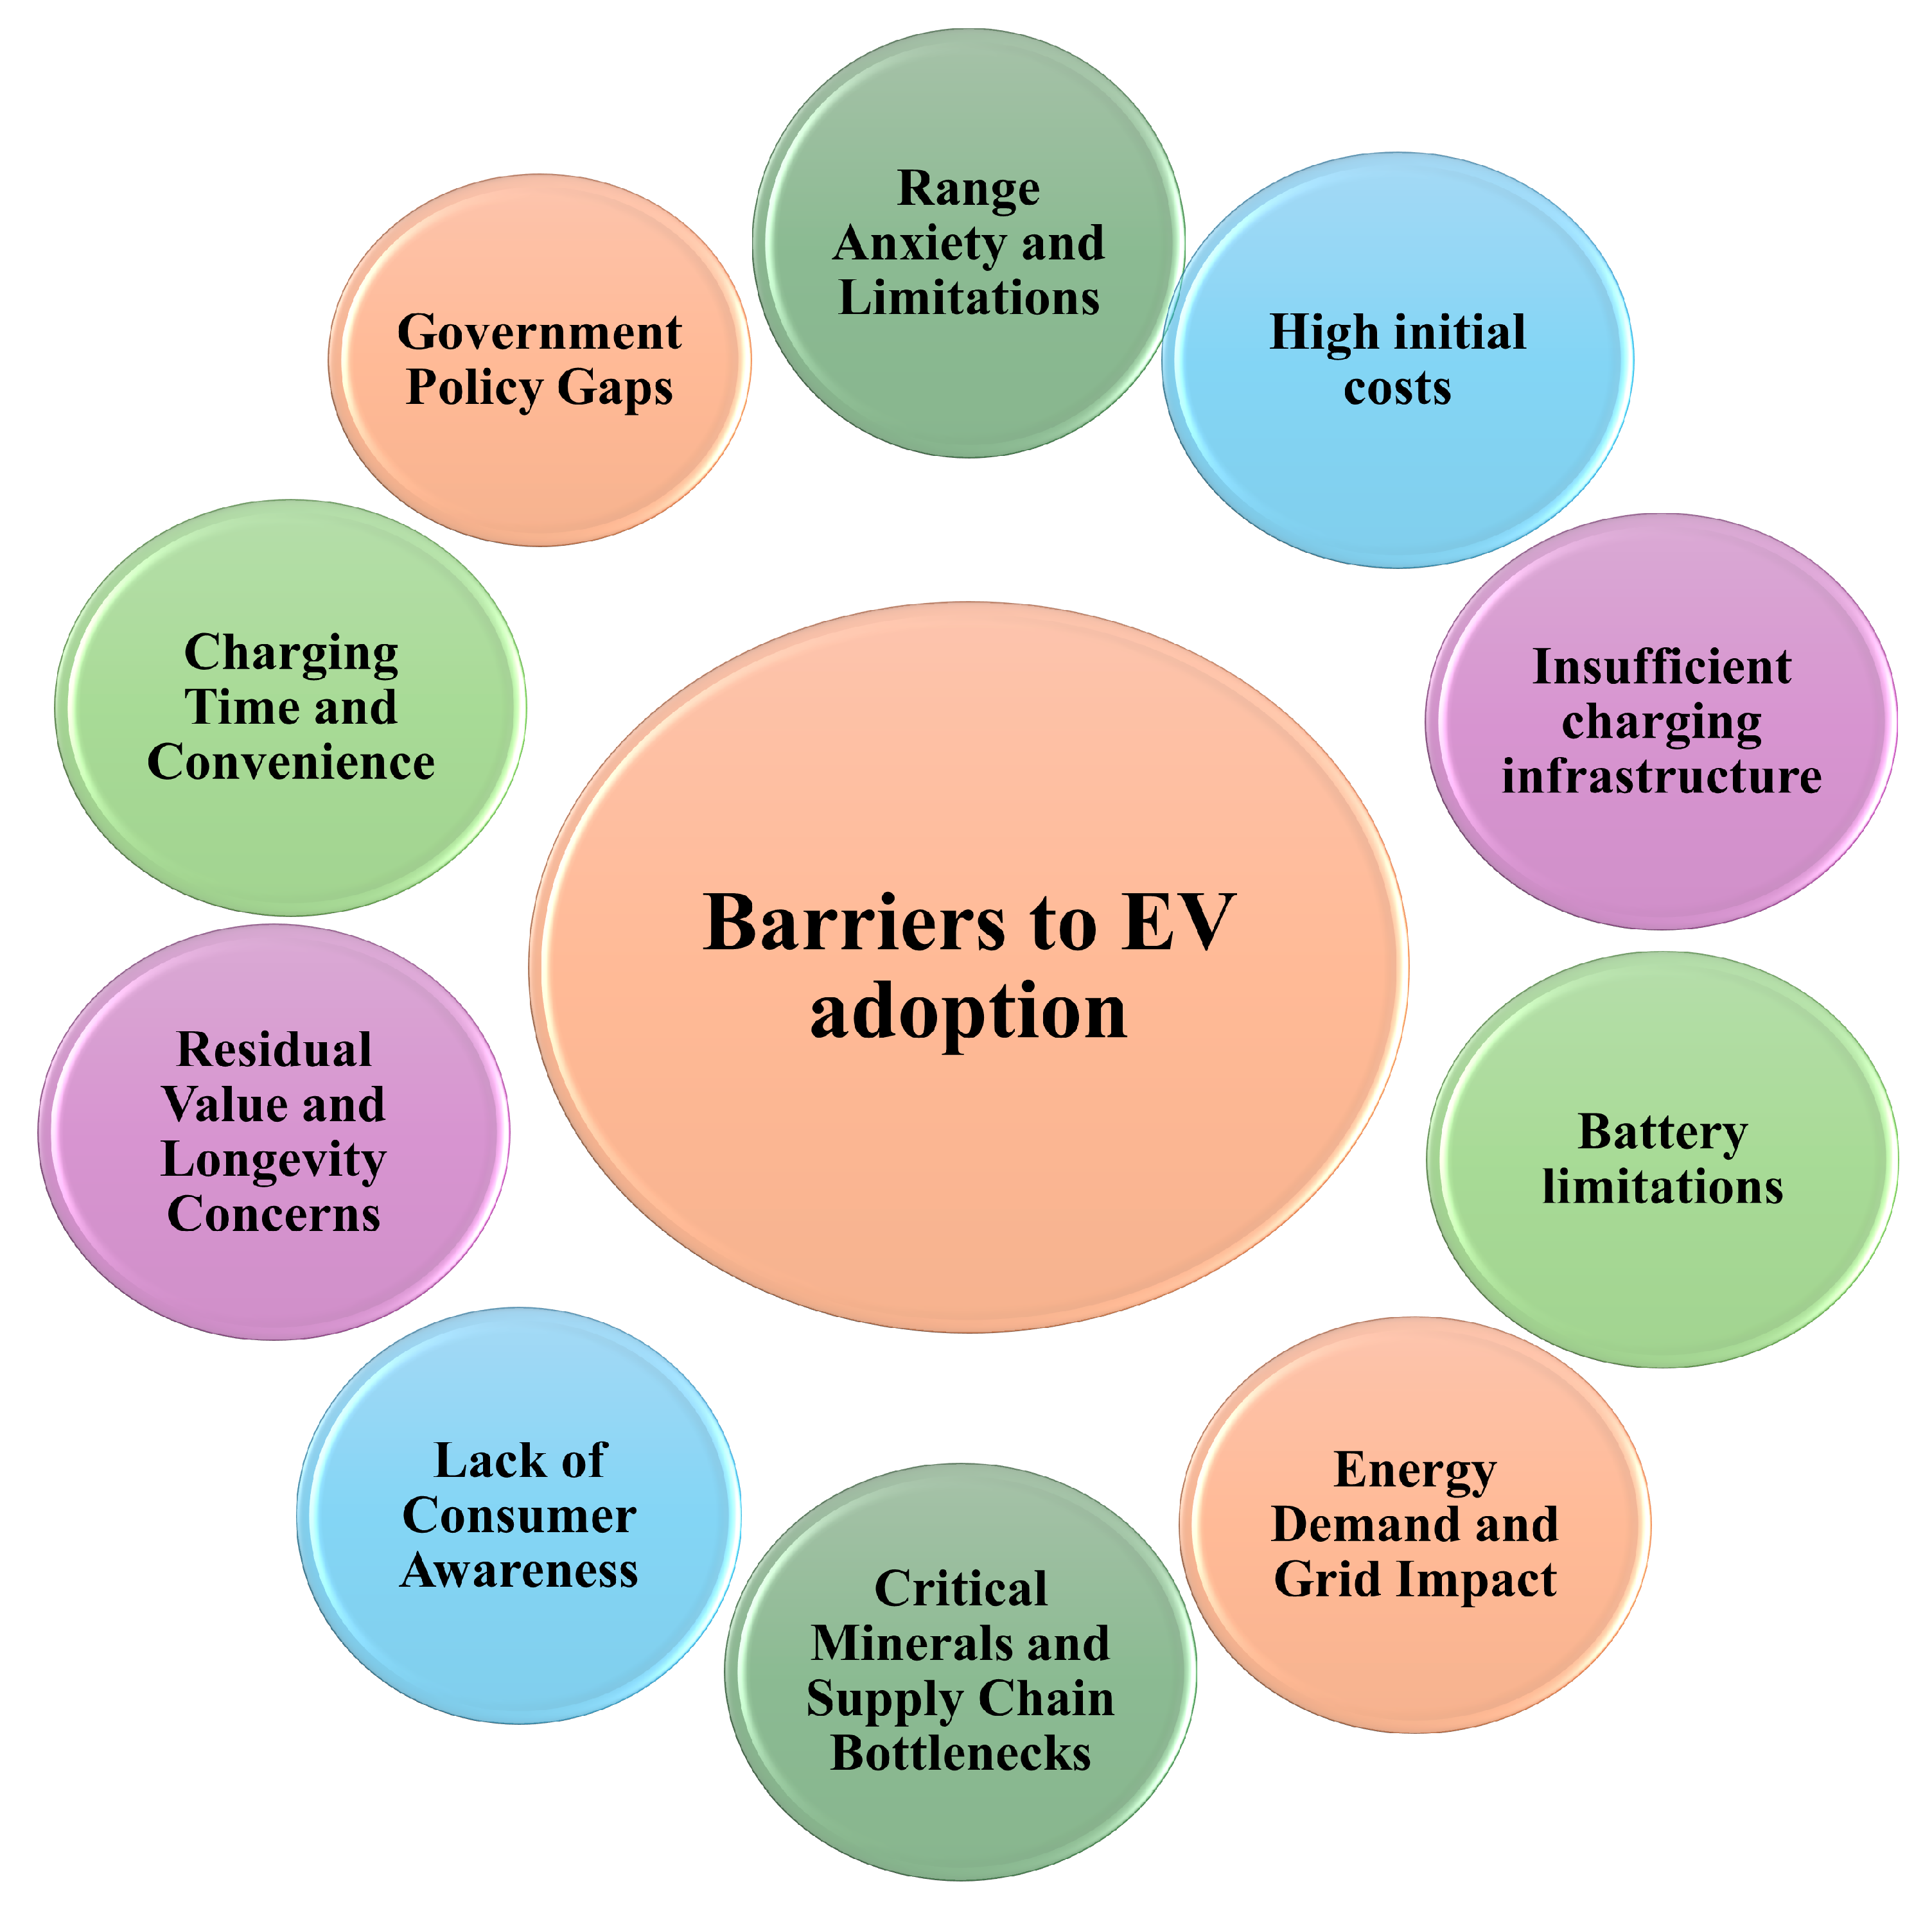
3.4. Barriers to EV Adoption

The adoption of EVs has been accelerating globally, but several key barriers continue to hinder their widespread use. These multifaceted challenges involve technical, economic, infrastructural, and behavioral factors [61,62]. Figure 15 illustrates the factors that affect the adoption of EVs.
Range anxiety and limitations: Range anxiety is one of the most significant psychological barriers to the adoption of EVs, stemming from the fear of depleting battery power before reaching a charging station or destination. Unlike ICE vehicles, which typically offer ranges greater than 500 km with quick refueling, many EVs provide shorter ranges, necessitating more frequent stops [63]. This challenge is further exacerbated by energy-intensive features (e.g., heating, cooling, and infotainment), aggressive driving habits, and extreme weather conditions that can significantly reduce battery performance. Although emerging technologies such as solid-state batteries and advances in lithium-ion chemistry hold promise for extending EV ranges, these solutions are not yet widely accessible [64].
High initial cost: Batteries, which constitute 30–50% of the EV manufacturing cost, contribute significantly to the higher initial price of EVs compared to ICE vehicles despite declining Li-ion battery prices [65]. This cost disparity mainly affects lower- and middle-income consumers, restricting market penetration and making EVs less accessible. In addition, the expense of battery repair or replacement, especially in older models, reinforces the perception of high ownership costs. In regions lacking substantial subsidies or tax incentives, the price gap between EVs and ICE vehicles becomes even more pronounced, further impeded by widespread adoption.
Insufficient charging infrastructure: Urban areas tend to have a higher concentration of charging stations, while rural and remote regions often lack sufficient infrastructure, leading to inequitable access and discouraging the adoption of EV in less populated areas [66]. The slow expansion of charging networks is further hindered by the significant investment required, and private companies are reluctant to deploy chargers in low-demand areas due to limited profitability. Furthermore, the lack of standardization between EV brands and charging networks creates interoperability issues, complicating the charging experience for drivers. Public charging reliability is another concern, as frequent malfunctions or unavailability of chargers erode consumer confidence in the system [67].
Battery limitations: EV batteries lag behind the energy density of liquid fuels, limiting their competitiveness with ICE vehicles for long-distance travel. Recharging times, even with fast chargers, range from 30 min to an hour, much longer than the few minutes needed to refuel an ICE vehicle [68]. Over time, battery degradation reduces performance, necessitating costly replacements, while battery recycling remains a complex and expensive process with potential environmental impacts. Furthermore, the increasing demand for critical materials such as lithium and cobalt places immense pressure on global supply chains, further complicating battery production and sustainability [69].
Energy demand and grid impact: The rapid growth of EV adoption risks overloading the capacity of existing power grids, particularly during peak times, creating a mismatch. Investing in grid infrastructure will help address this problem of instability. Another challenge is balancing EV charging demand with intermittent renewable energy production. In the absence of efficient load balancing and grid management, the environmental advantages of EVs can be offset by a greater dependence on fossil fuels during peak hours, undermining their sustainability goals [70].
Critical minerals and supply chain bottlenecks: Critical EV battery manufacture suffers because of the shortage of essential elements such as nickel, cobalt, and lithium, which are needed to make these batteries. Because many of these resources are available in regions with unstable governments, geopolitical risks worsen the problem by introducing liabilities within supply chains [71].
Lack of consumer awareness: Many EV consumers lack information and are unaware of reduced maintenance costs and environmental benefits. Persistent rumors further hamper adoption, such as EVs being unsuitable for cold locations or containing dangerous batteries [72].
Residual value and longevity concerns: Due to deterioration of battery life, the resale value of EVs is frequently unpredictable, discouraging interested buyers. In addition, the rapid pace with which EV technology is developing could make older models less appealing, reducing their market value, and raising consumer concerns about long-term investment.
Charging time and convenience: Even with fast chargers, charging an EV takes much longer than recharging an ICE vehicle, which might be an essential concern for specific customers. Long wait times caused by the scarcity of public charging stations during peak hours worsen this problem and further reduce the convenience and attraction of EVs for many prospective users [73].
Government policy gaps: In certain regions, inconsistent government subsidies for EVs confuse suppliers and consumers, making decision-making more difficult. In addition, the growth of the availability of EVs and the necessary charging infrastructure is slowed by the absence of clear and solid long-term EV policies, which deter automakers and infrastructure developers from making significant investments in new markets [74].

4. Electric Vehicle Technology

The transportation sector is about to undergo a revolution thanks to EVs. Advanced technologies from various engineering specialties, such as mechanical, electrical, electronics, automotive, and chemical engineering, are being integrated to drive this change. Combining these technologies increases the overall efficiency of EVs, reducing emissions and energy consumption. The electric motor (EM), power converter, and energy source are some of the essential parts of EVs that are shown in Figure 16. Each of these parts is essential for improving the sustainability and performance of the vehicle. Greener and more efficient transportation is unavoidable, given the explosive rise in the adoption of EVs, driven by ongoing advances in these interrelated technologies [75].
Numerous studies have examined the technological development of EVs from various angles, including standards, converter layouts, battery management, charging topologies, and motor types as stated in Table 1.

4.1. Types of Electric Vehicles

EVs come in a variety of forms and operate using a range of technologies. EVs can be classified into five groups according to technology. An overview of these types is explained below.

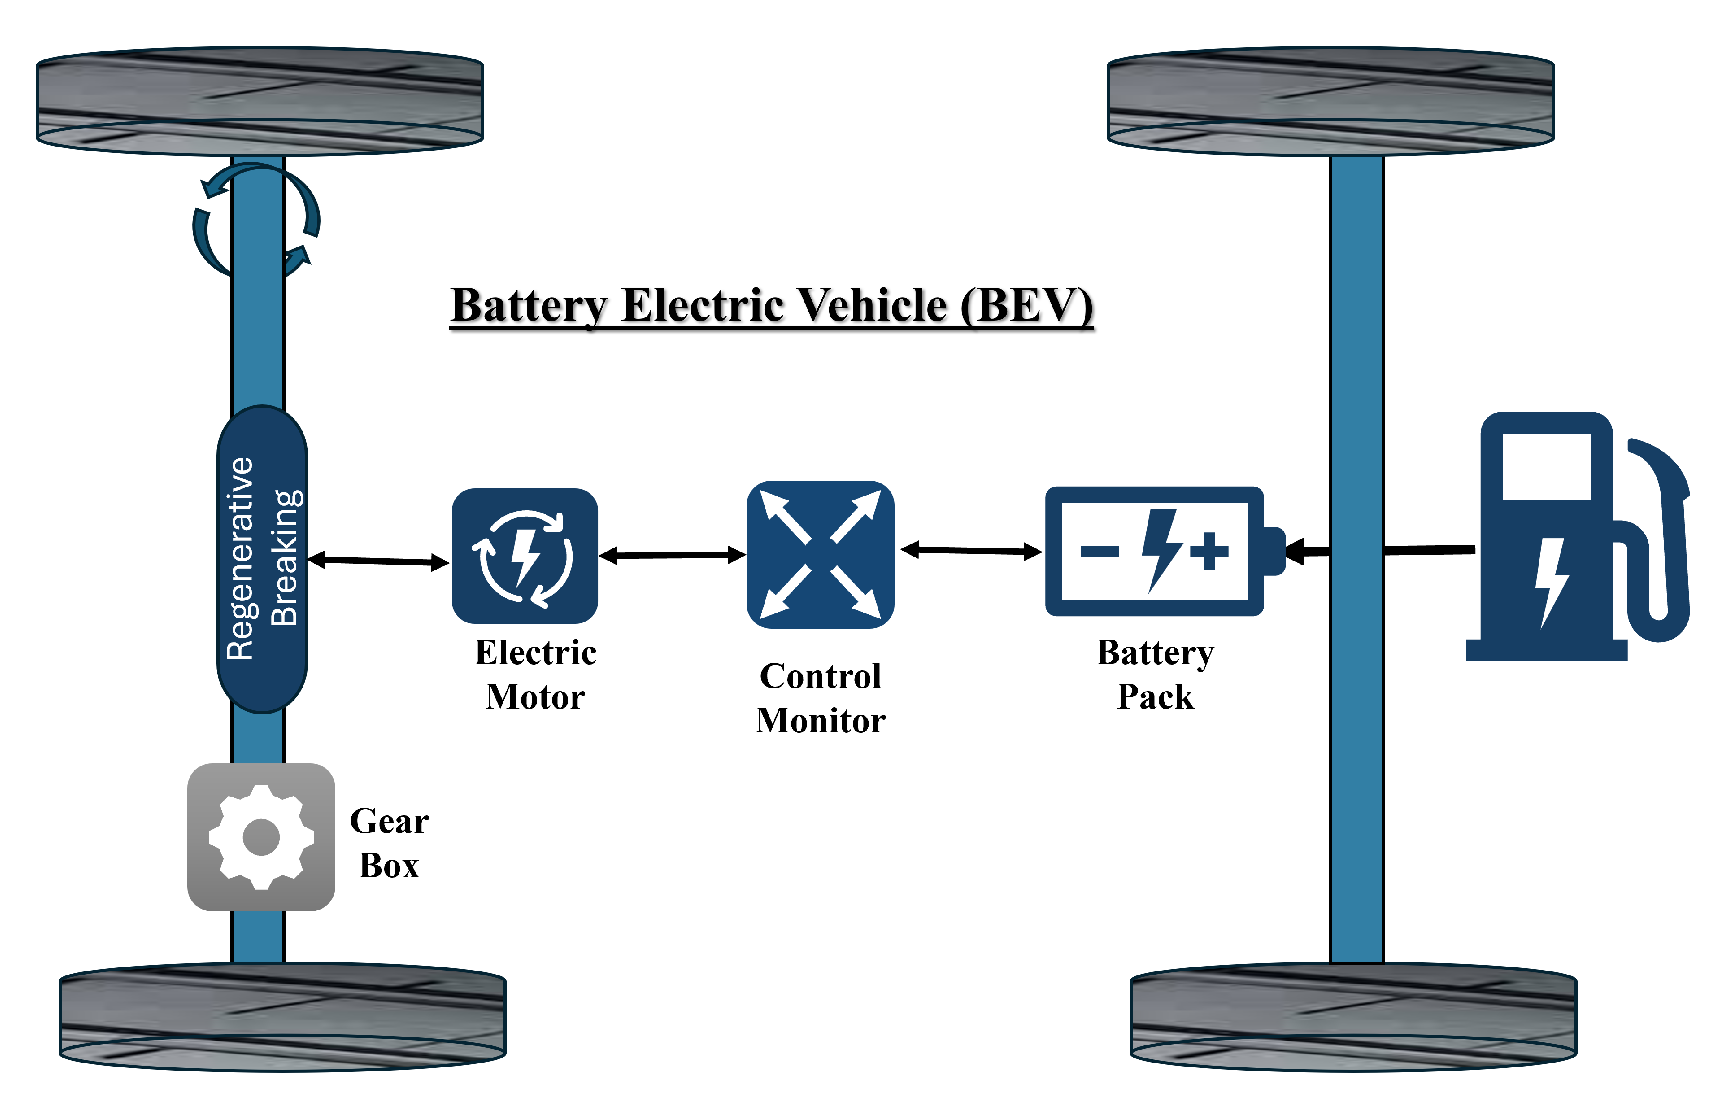
4.1.1. Battery Electric Vehicle (BEV)

With the continued advancement of battery technology and declining costs, BEVs are predicted to dominate the EV industry. BEVs are powered solely by EM and driven by a battery without ICE. The battery capacity of a vehicle directly affects its electric driving range [85]. BEVs have many advantages, including zero emissions, which makes them especially useful in cities where air quality is a big issue [78]. Although many alternative BEV layouts depend on different manufacturers’ designs, the fundamental arrangement and key parts are usually the same, illustrated in Figure 17. Although there are various EV charger options, the battery obtains power from the distribution network. When braking and decelerating, an EM turns the kinetic energy into electrical energy, known as regenerative braking, to charge the battery [86]. This technique, which is also utilized in other electrified public transportation systems, including metros and trams, is made possible by a bidirectional DC/AC converter [87]. Electricity may be transferred using this converter from the battery to the AC motor while operating and back to the battery when it stops.
Two of the main issues with BEVs are their long charging times and the lack of a public charging infrastructure [88]. However, future developments in battery technology are anticipated to alleviate this problem by increasing the range of BEVs between charges [89]. Furthermore, the extensive installation of fast charging stations in public spaces will help reduce range anxiety among EV users [90]. In the future, BS charging, a technique that quickly swaps out an empty battery for a fully charged one at designated stations, may be introduced by some BEV manufacturers. This would significantly reduce recharge downtime. Modern BEVs offer a driving range between 100 km and 700 km on a single charge [91]. You may find further information on BS technology in Section 5.3.

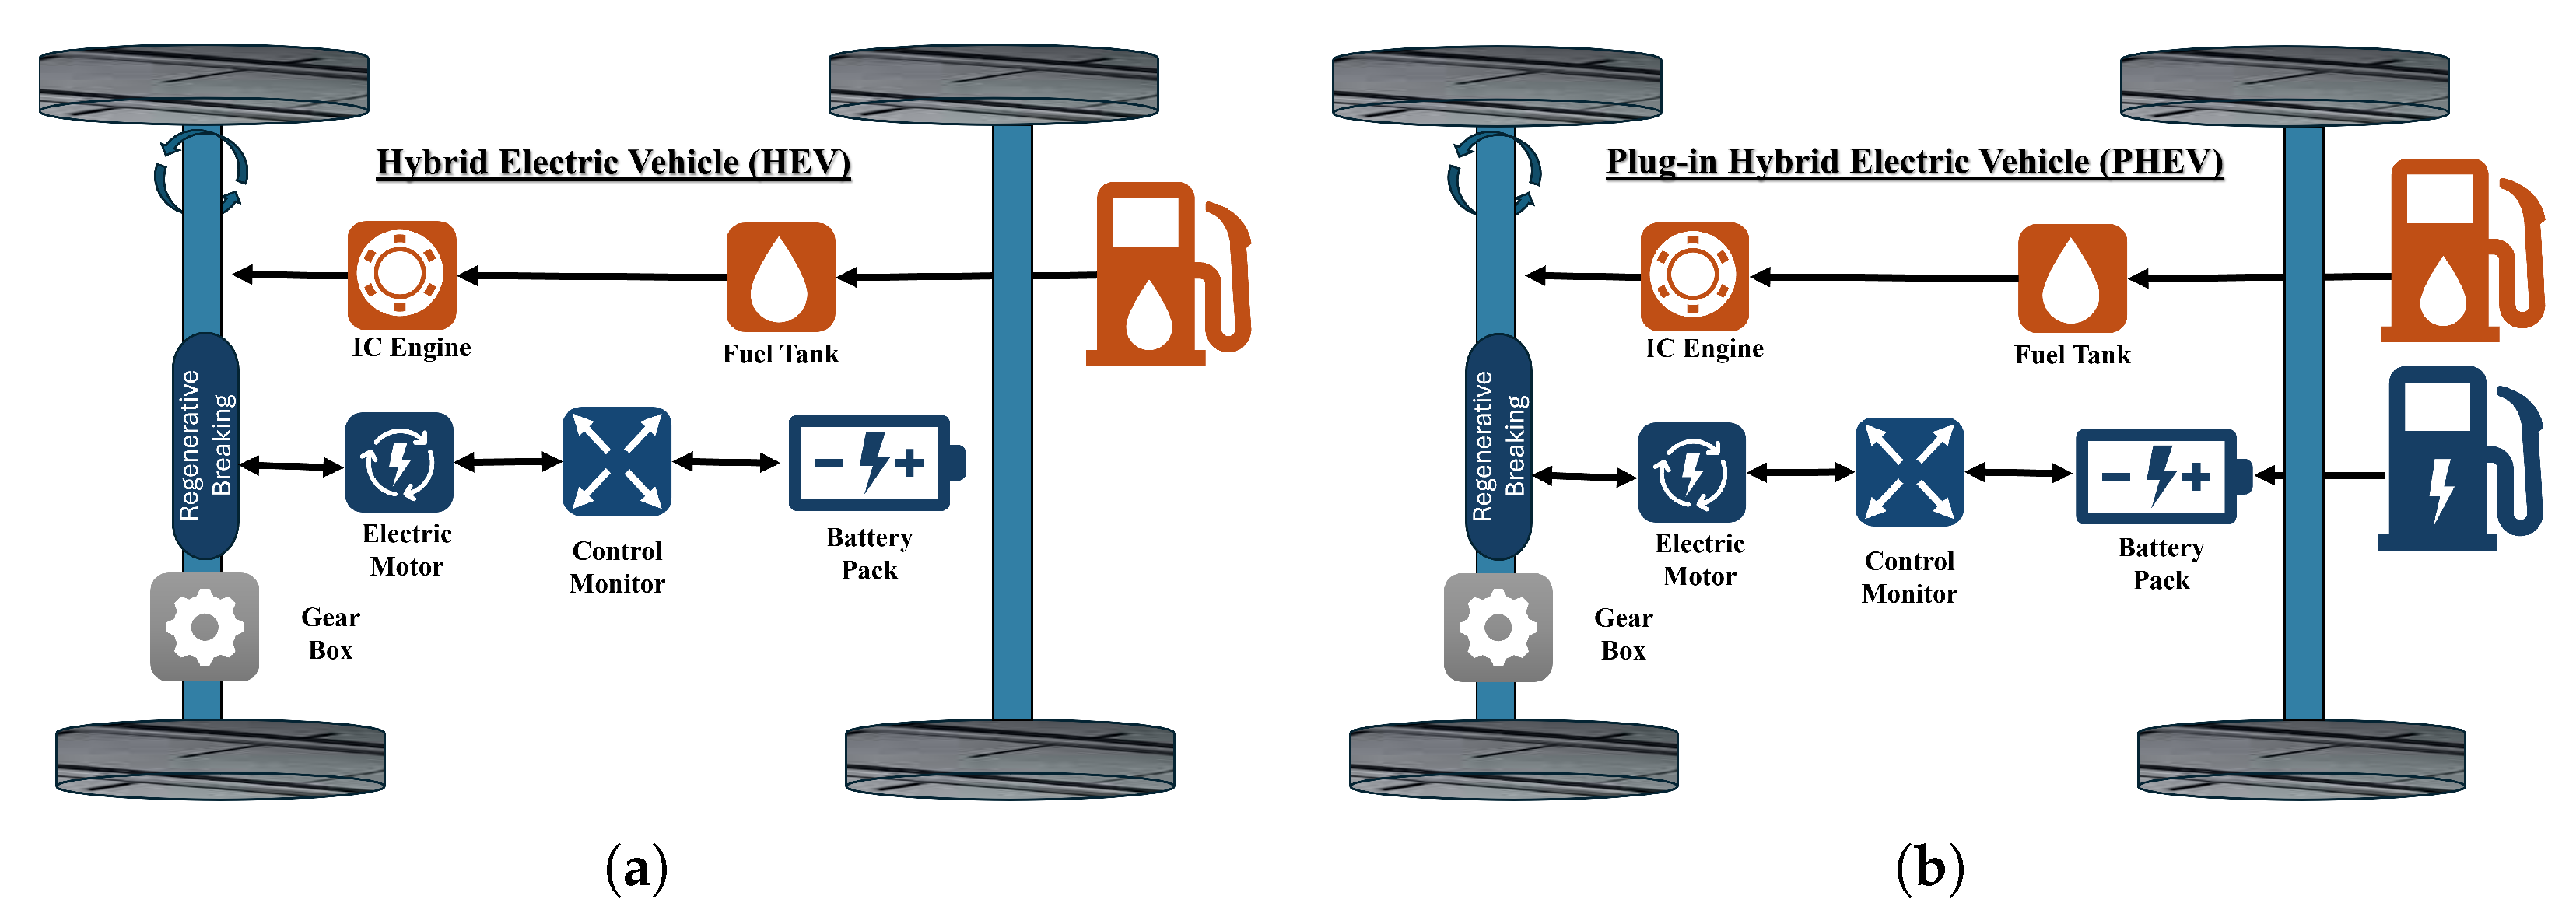
4.1.2. Hybrid Electric Vehicle (HEV)

HEVs use an ICE and an EM to improve fuel efficiency and reduce emissions. When the load is light, the ICE and regenerative braking recharges the battery. HEVs are powered by the EM and the battery at lower speeds, whereas the ICE takes control at faster speeds. In addition, EM improves performance and efficiency by helping under heavy loads. Compared to ICE cars, HEVs use less fuel and emit less GHG emissions [92,93]. HEVs do not require external charging, so they do not strain the power grid. They are more expensive than traditional gas-powered vehicles but cheaper than PHEVs. For example, in 2024, the gas-powered Toyota RAV4 started at EUR 26.829 [94], and the HEV model at EUR 29.236 [95,96]. As fuel costs increase, long-term savings can offset the higher initial price of HEVs. Figure 18a illustrates the structure of HEVs.

4.1.3. Plug-In Hybrid Electric Vehicle (PHEV)

PHEVs can charge their batteries by plugging into the power grid, using the ICE, or using regenerative braking. Unlike HEVs, they can be plugged in and drive longer distances on electric power alone [97]. They combine an EM with an ICE, allowing them to switch between or combine both power sources for better efficiency, and do not produce GHG emissions when running on electricity, making them more environmentally friendly for short trips. Once the battery is depleted, ICE takes over, providing extended range and flexibility for longer trips [98]. For example, the Toyota Prius PHEV has an 8.8 kWh battery, offering approximately 40 km of electric driving. It can cover up to 1030 km in total while using power and fuel [99]. PHEVs are a great option for drivers who want the benefits of electric driving without the risk of running out of batteries on longer trips. It is essential to remember that it may consume more gasoline than planned, depending on how they are driven [100]. They come in various types and combinations to meet individual needs and tastes. Figure 18b illustrates the structure of PHEVs.

4.1.4. Fuel Cell Electric Vehicle (FCEV)

FCEVs run on electricity from a chemical reaction between hydrogen (H2) and oxygen (O2) in a fuel cell. Unlike BEVs, FCEVs do not need to be plugged in to charge. Instead, they are refueled with hydrogen gas, similar to how gasoline cars are refueled, and the process takes only a few minutes [101]. The fuel cell transforms the chemical energy of hydrogen gas into electrical energy, which drives the motor. There are several ways to produce hydrogen for FCEVs, including using electrolysis of water or fossil fuels like natural gas. Although these vehicles are thought to be emission free, the only byproduct is water vapor, so it is important to be aware that although green hydrogen exists, most of the hydrogen used in cars is made from natural gas. Figure 19a illustrates the structure of FCEV. Since these EVs do not need to be charged by the grid, they do not affect the power supply if no battery is used [102]. They offer a long driving range and are ideal for drivers who want fast fuel and clean energy. However, hydrogen refueling stations are still limited in many areas, which can affect convenience and availability. The only FCEV on the market is the Toyota Mirai, the most recent model, which was unveiled in 2021 and has a range of 650 km between fill-ups. Its only pollutant is pure water [103].

4.1.5. Extended Range Electric Vehicle (ER-EV)

The driving range of ER-EV can be increased by an additional power source known as a range extender. Most range extenders have an electric generator that drives the motor and uses small ICEs to replenish the battery [104]. When the range extender is active, the ER-EV produces CO2 emissions, but it operates emissions-free when it is running on electric power alone. An ER-EV emits significantly less CO2 during its lifetime than a traditional ICE vehicle. The BMW i3 is a notable example of an ER-EV, with a Li-ion battery and an optional range-extending gasoline engine [105]. The essential components and assembly of an ER-EV are illustrated in Figure 19b.

4.2. Comparative Analysis of Electric Vehicle Types

EV technology has experienced significant advancements since its inception in the late nineteenth century, evolving into a diverse range of options that meet various transportation needs. Today, the market includes traditional ICE vehicles alongside more advanced systems such as BEV, HEV, PHEV, FCEV, and ER-EV [90]. Each of these types of vehicles presents unique characteristics, with different advantages and limitations, as summarized in Table 2. The selection of a suitable EV technology depends on several factors, including budget, driving patterns, lifestyle preferences, and the availability of supporting infrastructure. For example, BEVs are particularly well suited for urban commuters with shorter travel distances and access to charging networks. At the same time, PHEVs and FCEVs can better accommodate people who frequently travel long distances or require greater flexibility [106]. Regional variations in energy prices, policies, and the development of electric and hydrogen fuel stations further influence the practicality of each type. In conclusion, EV technology is not universally ideal. The optimal choice varies according to individual requirements and circumstances. As EV technologies progress and the infrastructure grows internationally, electric cars will play an increasingly important role in reducing GHG emissions and achieving sustainable transportation goals.

4.3. Advancements in Electric Vehicle Technology

Advancements in EV technology have played a significant role in making electric mobility more practical, efficient, and accessible to the public. One of the most important developments in battery technology is at the forefront of this transformation [107]. Modern lithium-ion batteries now offer a higher energy density, which means EVs can travel longer distances on a single charge, with some models reaching over 700 km. Research is also progressing on solid-state batteries, which promise faster charging, improved safety, and even longer life spans [108]. Beyond new battery designs, sustainable battery life cycle management has gained traction, with recycling technologies recovering valuable materials like lithium, cobalt, and nickel. Repurposing used EV batteries for second-life applications, such as energy storage at home and the grid, extends their utility and reduces their environmental impact [109].
In addition to battery improvements, autonomous and connected EVs are reshaping transportation. Integrating AI-driven autonomous technologies enhances safety and energy efficiency by enabling advanced driver assistance systems, optimized route planning, and predictive maintenance. These features improve the user experience and reduce energy consumption during operation [110]. Vehicle to Everything (V2X) communication further revolutionizes connectivity by allowing EVs to interact with their surroundings, including other vehicles, infrastructure, and the electric grid [111,112].
The growth of the charging infrastructure has been rapid. Fast chargers can charge an EV battery to 80% in as little as 20–30 min, and ultra-fast chargers are being developed for even quicker recharges. Furthermore, intelligent wireless charging systems integrate EVs with the grid that is the V2G technology grid, enabling dynamic load balancing to prevent grid overload during peak demand and optimizing charging schedules to take advantage of lower-cost electricity and renewable energy availability, allowing EVs to charge without cables and even supply power back to the grid [113]. EMs have become smaller, lighter, and more powerful, increasing vehicle acceleration and performance. Innovative regenerative braking technologies assist in collecting energy while slowing down, enhancing overall efficiency. Thermal management technologies have also been upgraded to ensure battery health and performance in various weather conditions [114]. On the software side, EVs now include innovative systems for scheduling routes, energy consumption monitoring, and virtual diagnostics. Many are equipped with advanced driver assistance systems (ADASs) and combined with autonomous vehicle technology, making them safer and more efficient [115]. Manufacturers are also looking for sustainable materials and environmentally friendly manufacturing procedures to reduce the overall carbon footprint of EV production.
Furthermore, the expansion of EV battery recycling programs lowers waste and enables the reuse of precious components like lithium, cobalt, and nickel [109]. These advances collectively address key challenges in the adoption of EVs, including range anxiety, charging infrastructure limitations, and sustainability concerns. Using cutting-edge technology, the EV industry is poised to play a critical role in reducing GHG emissions, promoting energy efficiency, and transforming global transportation systems into cleaner, more innovative, and more sustainable networks. Table 3 provides an overview of these key advancements, summarizing their contributions to the EV industry.

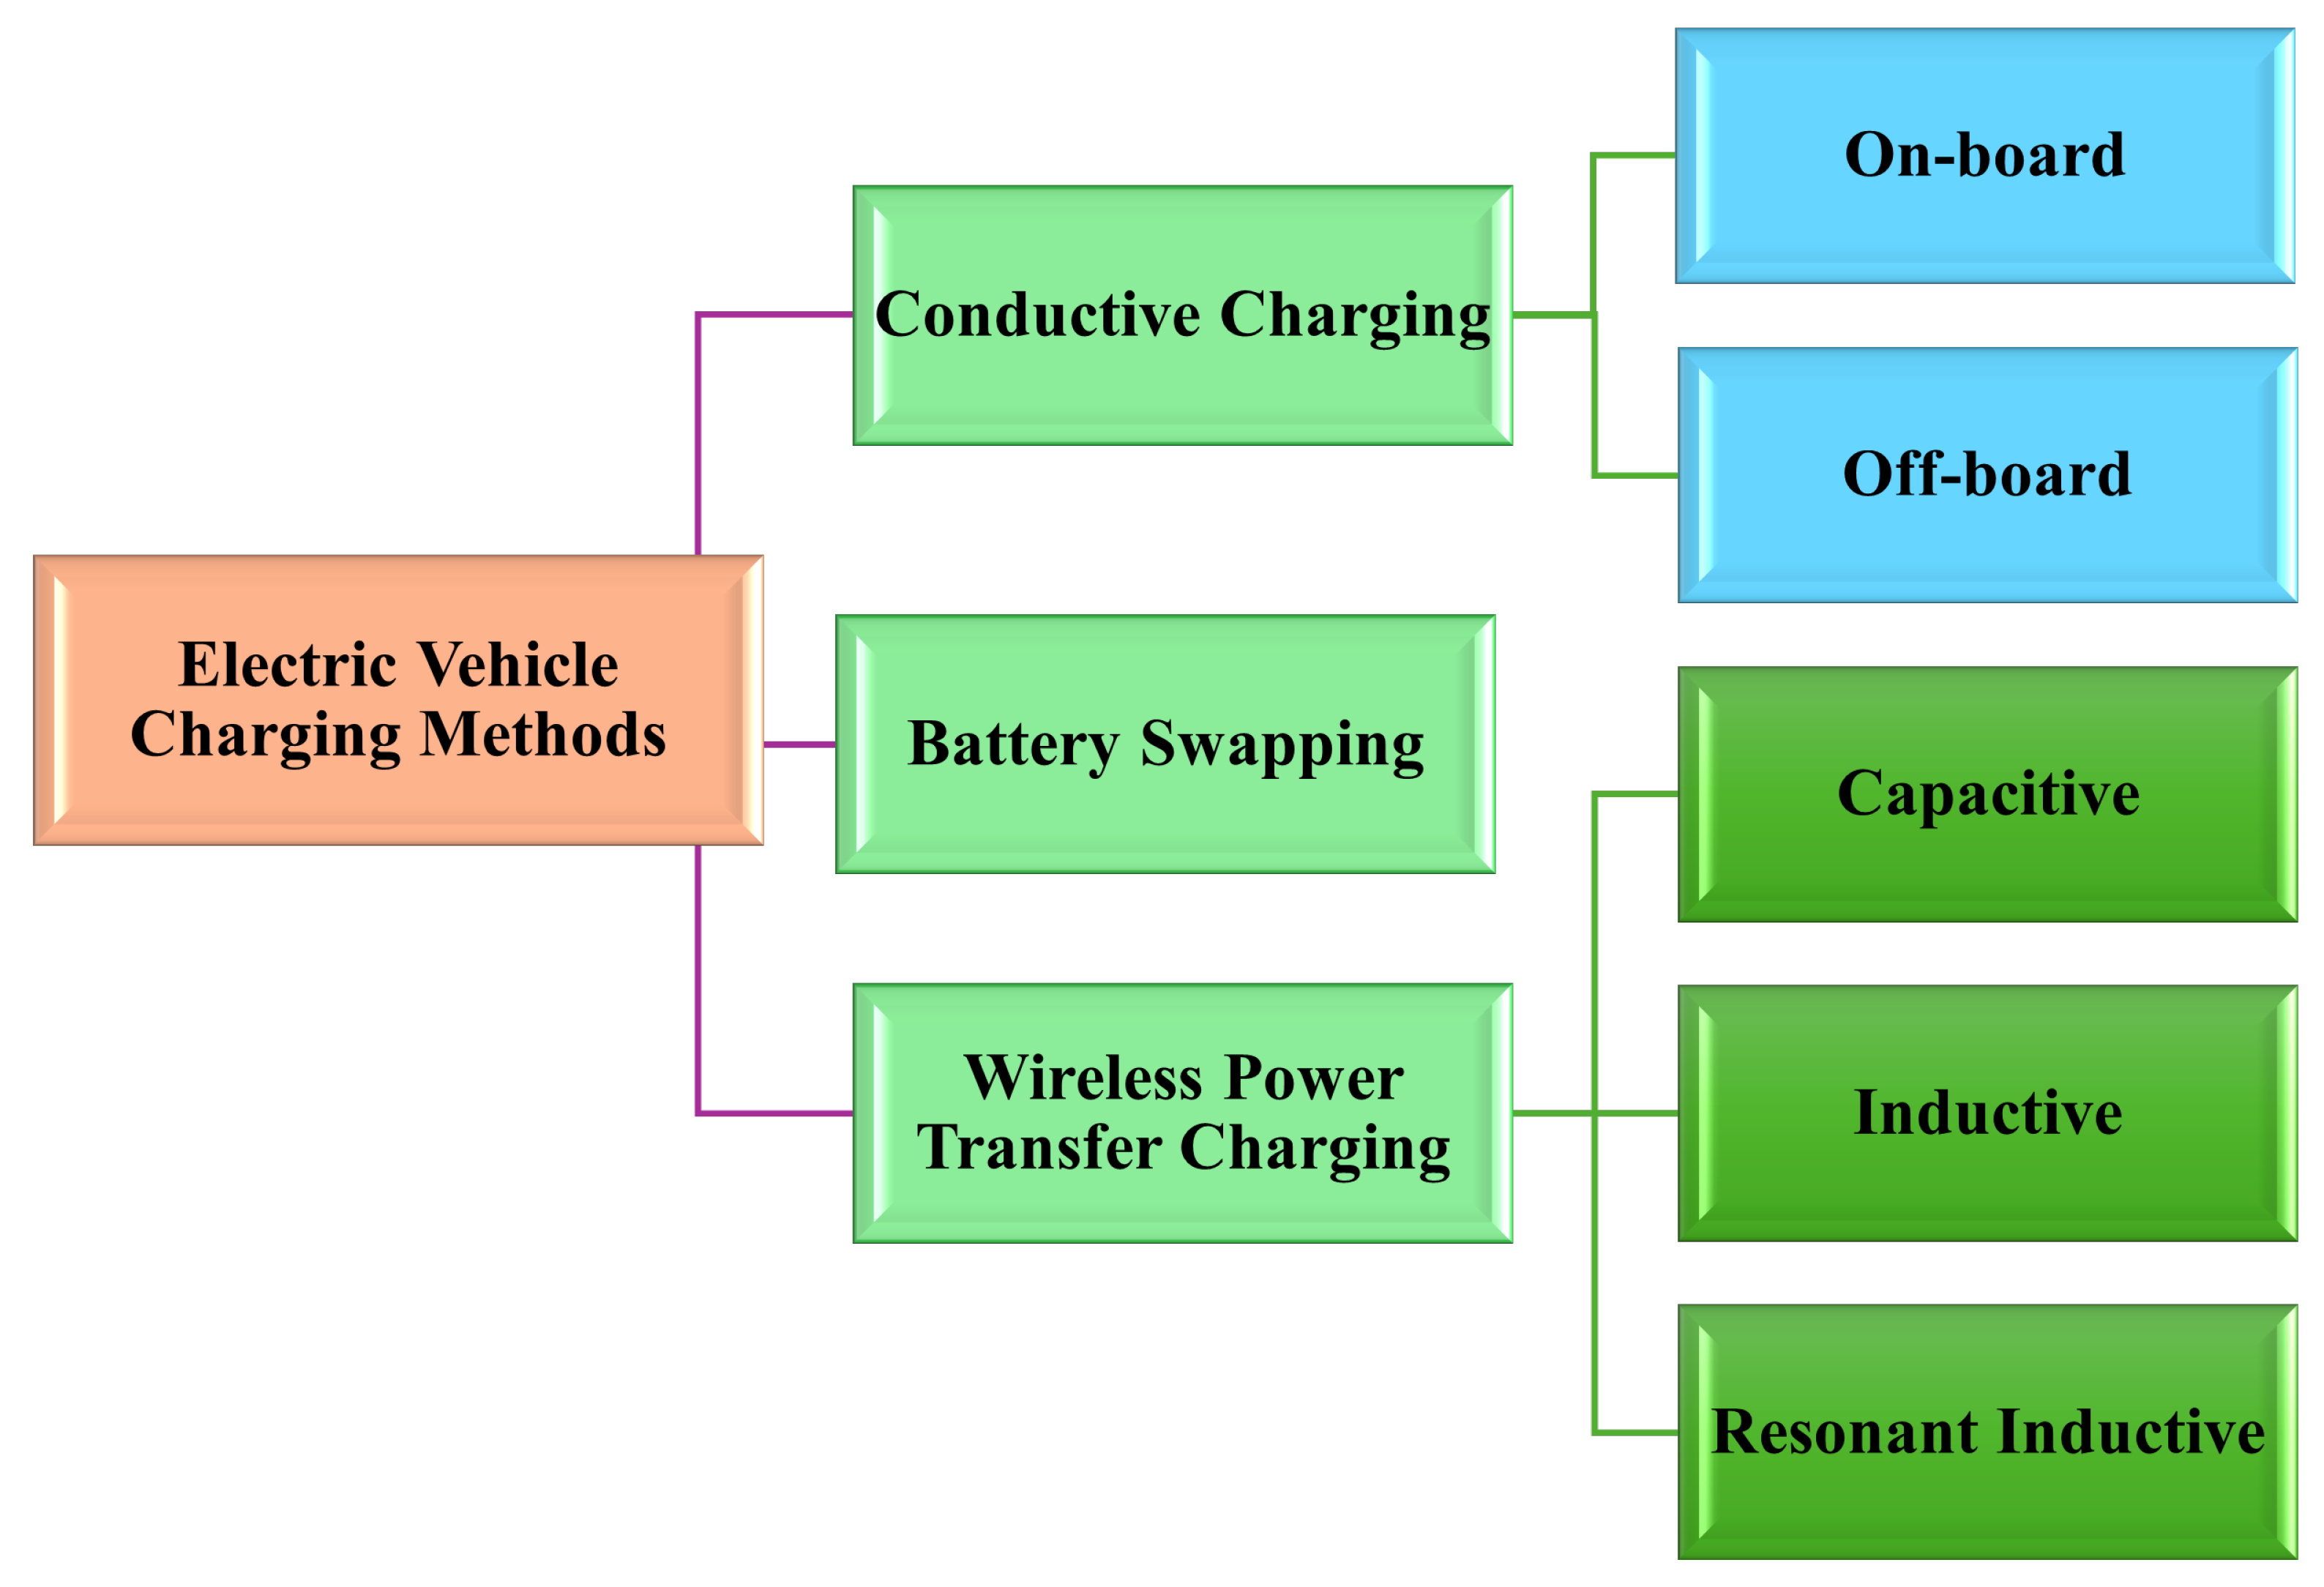
5. Electric Vehicle Battery Charging Systems

There are three main ways to charge an EV: conductive charging, WPT charging, and battery swapping station (BSS). Conductive charging is the EV industry’s most well-established and often utilized method. In contrast, inductive charging is still in the early stages of research and has not yet gained widespread use. Although they exist, battery switch stations are rarely used compared to the other two techniques. Figure 20 shows the classification of various EV charging technologies available today.

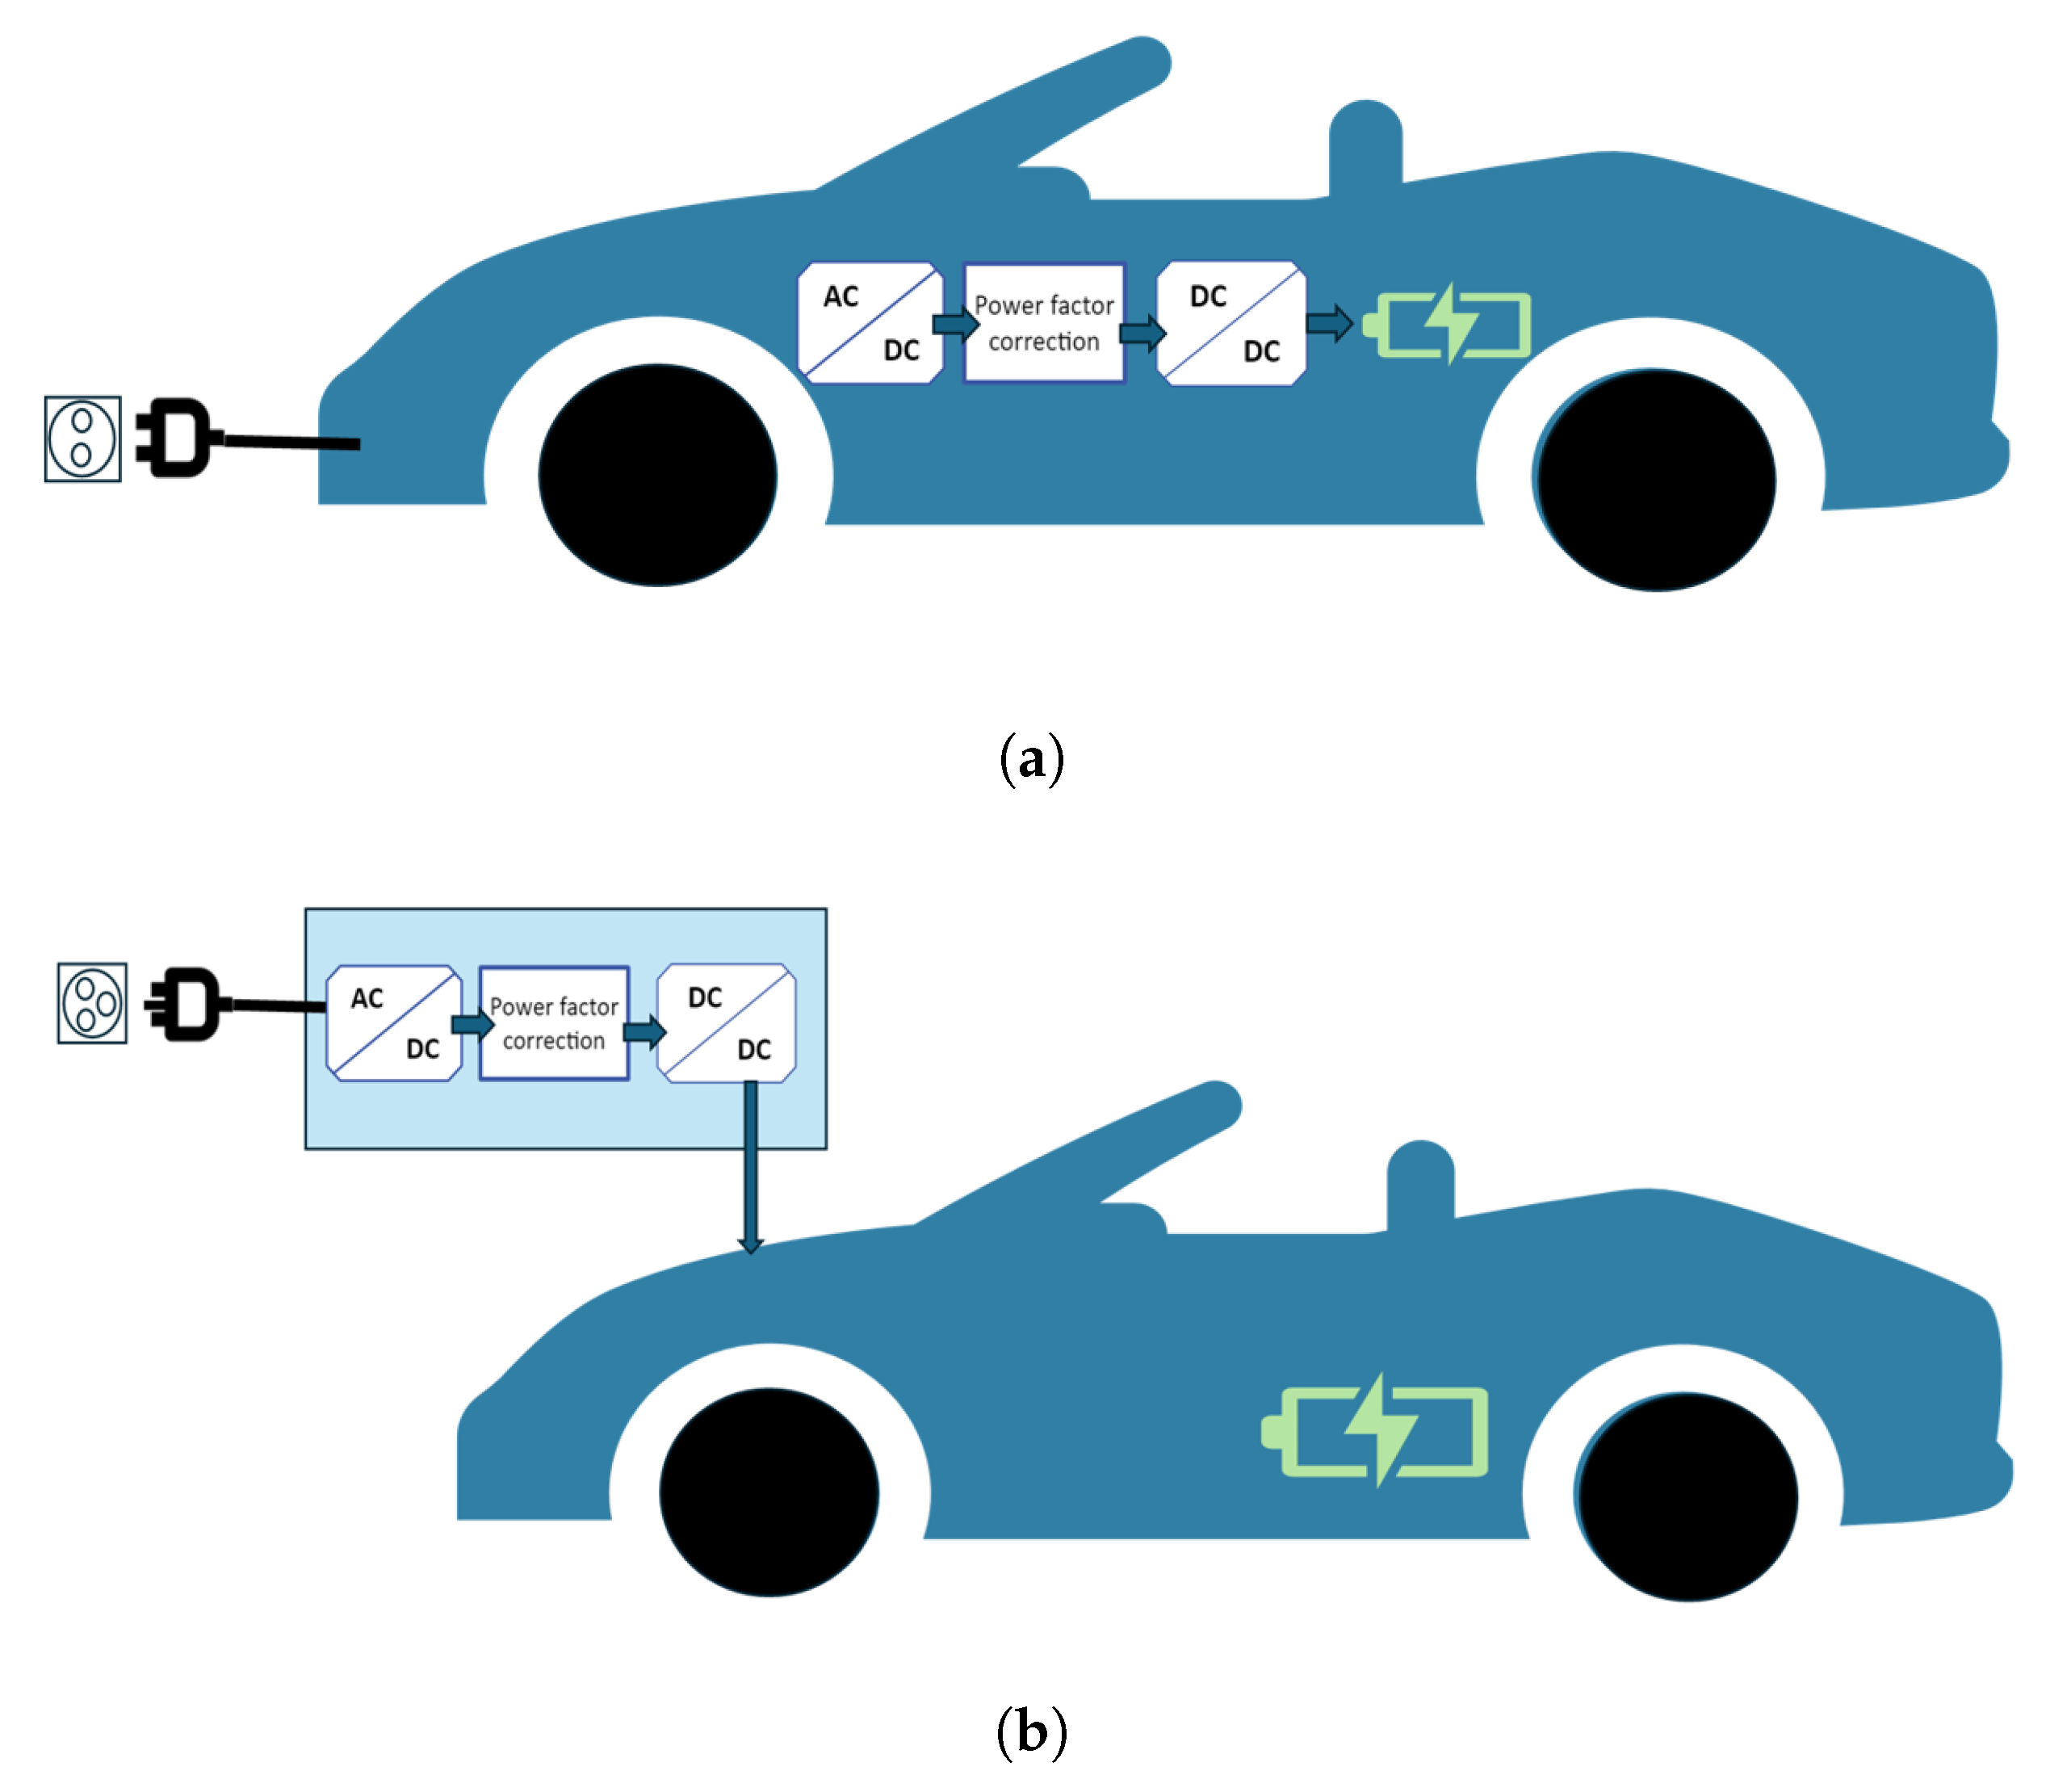
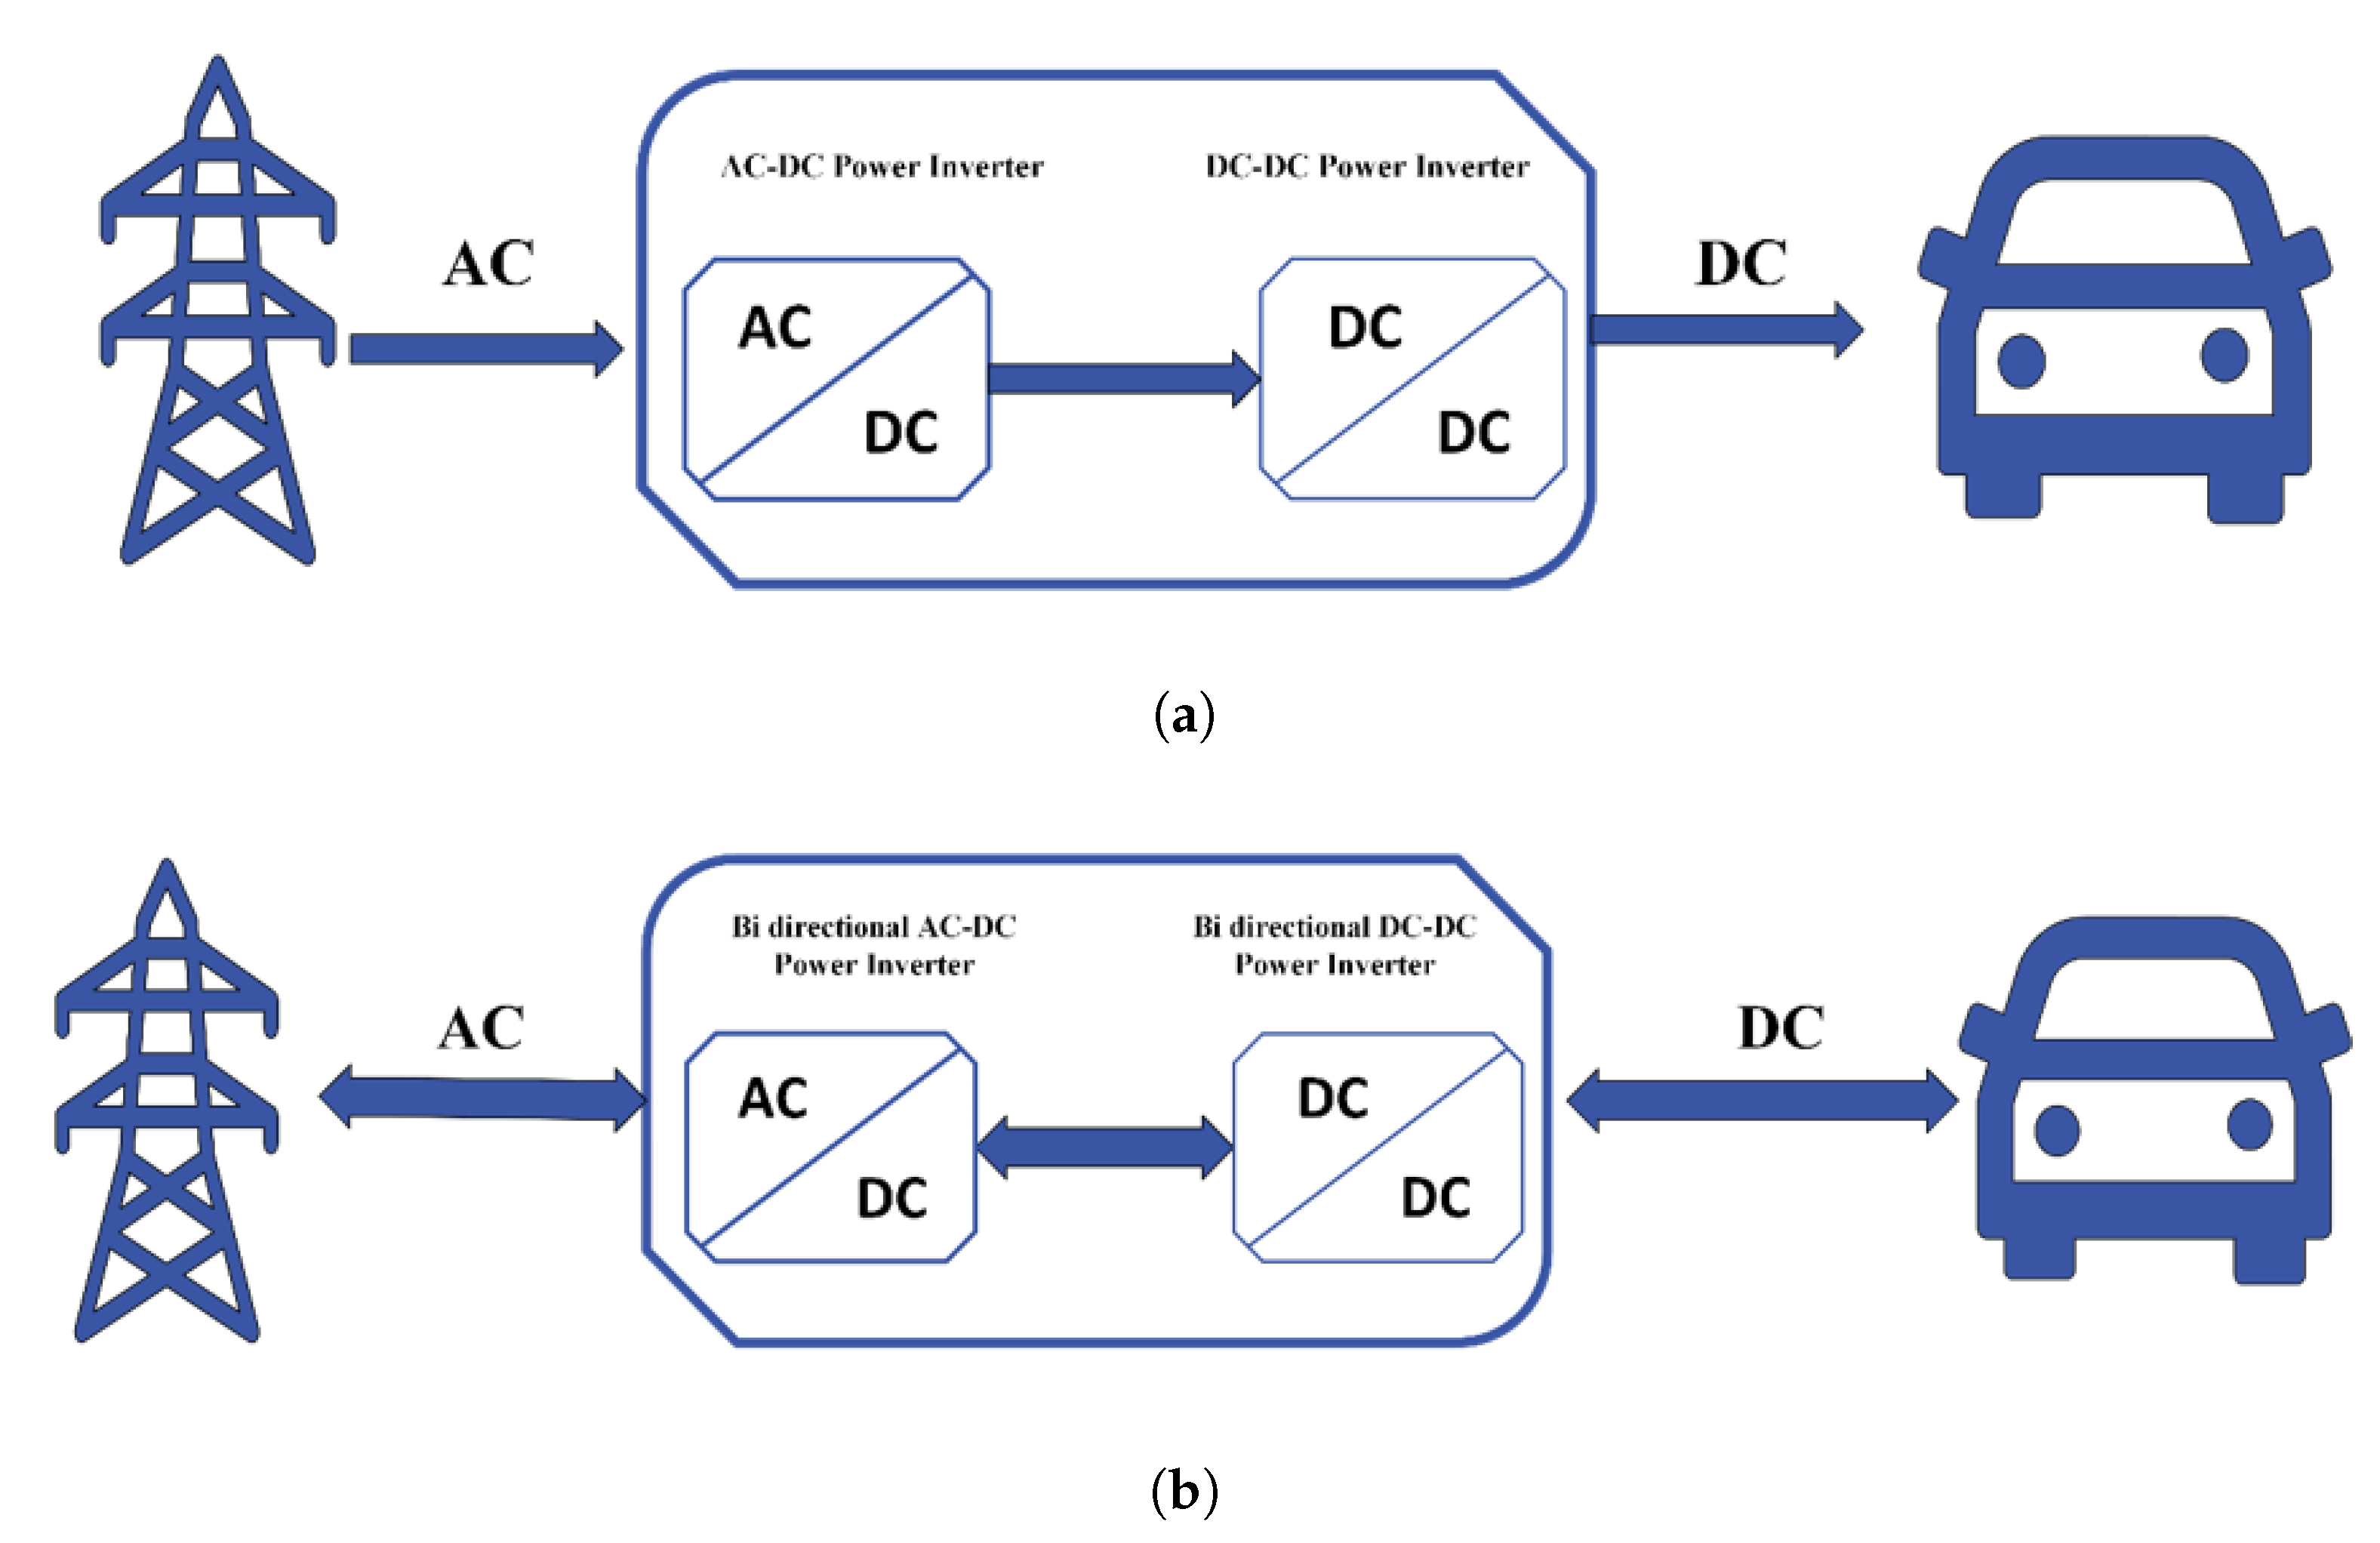
5.1. Conductive Charging System

Since the convenient availability of charging stations is a prerequisite for EV adoption and public acceptance, EV battery chargers are essential to the growth of EVs [116]. The three primary components of an EV charger are an AC/DC converter, a DC/DC converter, and a power factor correction device [79,117]. There are two primary types of chargers: on-board (placed within the vehicle for slow charging) and off-board (external, utilized for quick charging) as shown in Figure 21a and Figure 21b, respectively.
OBCs are compact, lightweight, and cost effective, allowing EV owners to charge wherever a power source is available but have limited power capacity, leading to longer charging times. Off-board chargers, less restricted by size and weight, support slow and fast charging but are more expensive to install due to their complexity [118]. Table 4 compares the on-board and off-board chargers. This chart helps you choose the best EV charger by comparing the two types of chargers.
Depending on the direction, the chargers are classified as unidirectional or bidirectional. A unidirectional EV charger uses a diode rectifier and a unidirectional DC/DC converter, making it more straightforward to control with fewer interconnection issues and reduced battery degradation. However, it cannot provide ancillary services to the grid [119]. In contrast, a bidirectional charger employs bidirectional DC/DC and AC/DC converters to enable it to function in both the charging and discharging modes. Because of this, EVs can provide grid services. Nevertheless, frequent discharging can reduce battery life; Figure 22 shows the basic setup of Unidirectional and Bidirectional chargers. Table 5 presents a comparison of unidirectional and bidirectional chargers. This comparative analysis briefly examines the distinctions between unidirectional and bidirectional chargers. Table 6 presents a wide range of novel methods and findings on the subject of inductive or wired charging. Every research contributes to the changing field of EV plug-in charging by tackling various issues, from grid stability and renewable energy integration to dynamic pricing and consumer satisfaction. Table 1 highlights the main points in the literature on plug-in EV charging.

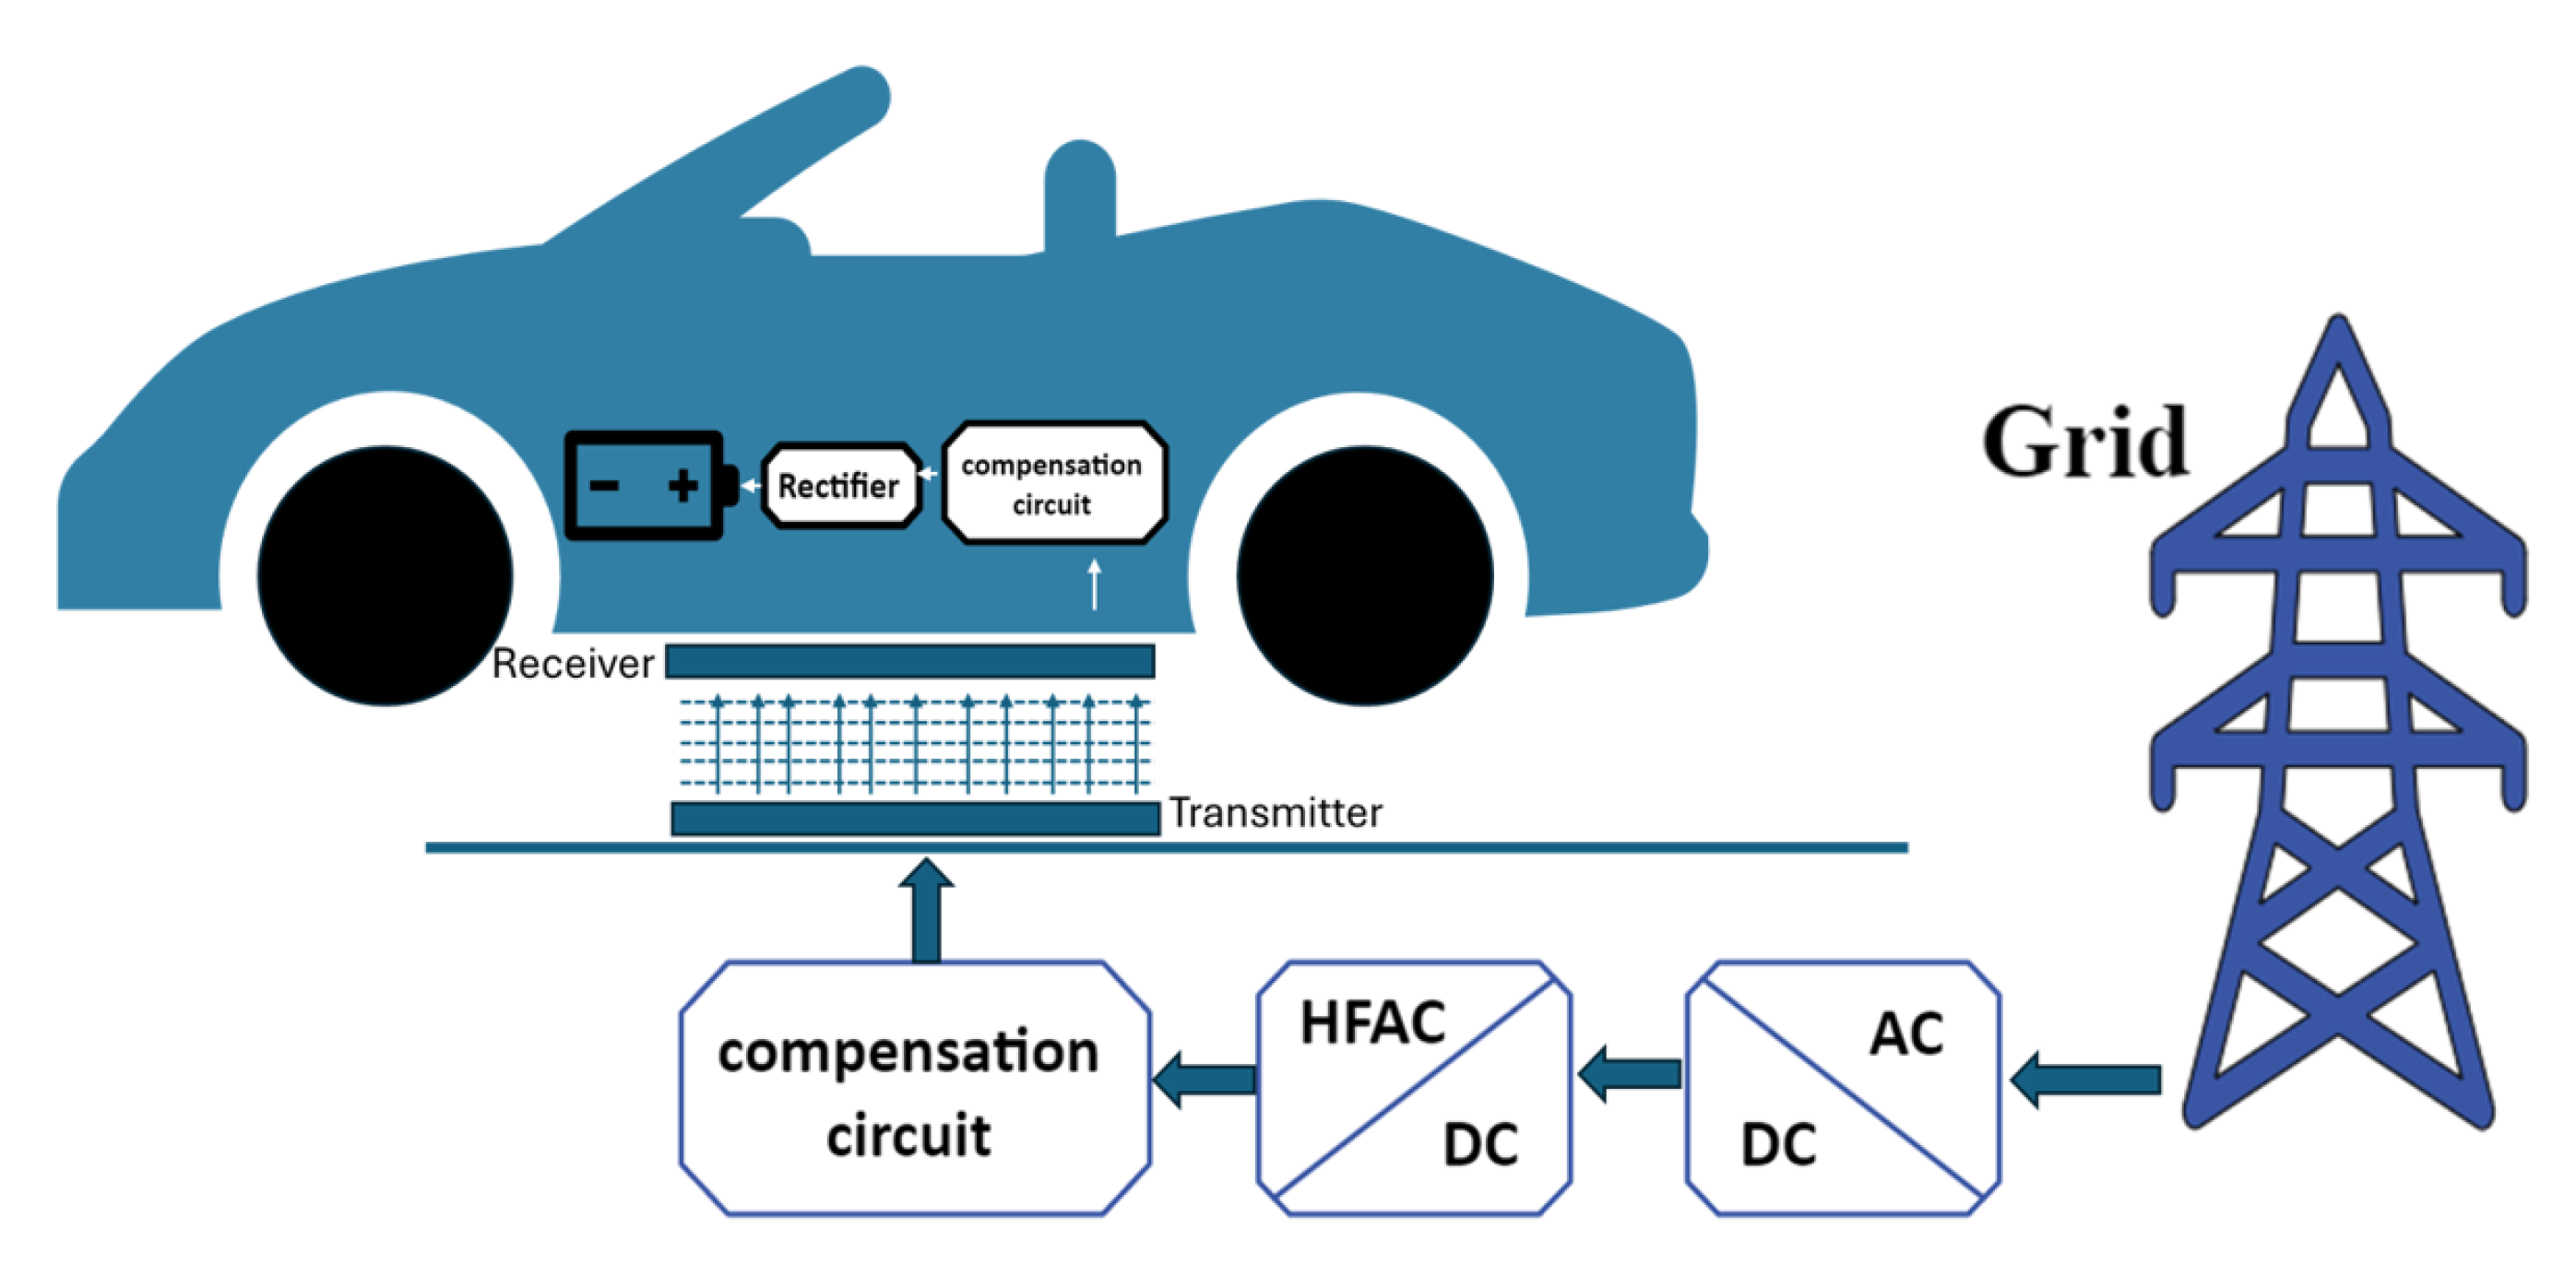
5.2. Wireless Power Transfer (WPT) Charging System

WPT charging systems are an innovation that allows batteries to be recharged without physical wires. Instead of connecting a device to a power source with a cable, electromagnetic fields transport energy wirelessly. This approach is also known as inductive charging [125]. WPT functions employ various methods, including capacitive coupling, resonant inductive coupling, and inductive coupling. It first operates using the AC/DC converter built within the WPT to convert AC power from the power grid to DC power. This DC electricity is converted back into high-frequency AC power and sent to a transmitting coil buried beneath the road. Electromagnetic induction is used by the receiving coil, which is housed within the EV, to collect power from the transmitting coil via an air gap. The battery is charged once the energy is transformed back into DC power by the internal AC/DC converter of the EV [126].
WPT is divided into two categories: inductive and resonant charging. Inductive charging is the most common and requires close contact between the charger and the device. Resonant charging, however, can work over slightly greater distances and is often used in EVs and medical devices. Other emerging technologies like radio frequency (RF) and laser charging are still in the experimental stages and aim to provide wireless power over longer ranges using waves or focused light beams [127]. Current WPT systems are designed for one-way power transfer as illustrated in Figure 23, where energy flows from the grid to an EV. However, future developments in WPT technology are expected to enable bidirectional energy flow, allowing vehicles to wirelessly return energy to the grid, supporting V2G capabilities [128].
The key benefits of WPT include user convenience and the option of seamless cable-free charging. Enhanced electrical safety, eliminating the risk of accidents from exposed wires or physical connections [125]. Despite these advantages, WPT has notable limitations. Lower power transfer efficiency leads to higher energy losses than conductive charging methods. High infrastructure costs, such as WPT, require more expensive technology and installation than traditional plug-in charging systems. In addition, most systems require precise alignment between the transmitter and receiver, and the effective charging range is usually limited [125]. Numerous cutting-edge strategies have been investigated to improve wireless charging’s practicality, system integration, and charging efficiency. Table 7 highlights the key findings and main points from the literature on WPT systems.

5.3. Battery Swapping (BS) Charging System

The rapid swapping of fully charged EV batteries for depleted batteries is possible using the BSS. This method allows for quick turnaround times by replacing the exhausted battery of the EVs with a fully charged one. The BSS or a third party must have a substantial stock of batteries, which the EV user may rent or purchase, for this technology to function. A BSS infrastructure typically consists of distribution transformers, batteries, battery-switching devices, and AC/DC converters for battery charging [136].
According to some research, BSS technology might support bidirectional charging, allowing energy to flow back into the grid and providing grid services [137]. Some authors’ works are highlighted in Table 8. However, BSSs face several challenges, including battery uniformity, infrastructure costs, and a large physical footprint. Despite these challenges, advances in BS technology continue. In 2013, Tesla introduced a BS system that can replace a battery in 90 s. In 2024, several advances in BS charging were made. Oak Ridge National Laboratory in the United States achieved a significant milestone with 100 kW wireless charging technology, reaching efficiency 96% [138], and companies such as the Chinese multinational electric vehicle manufacturer (NIO) have introduced faster and more automated stations, with their 4.0 model supporting even larger and faster swaps. BS charging is especially expanding in Asia, where companies like Vmoto and Sun Mobility are developing networks to facilitate this solution [139]. By addressing technological, financial, operational and user-centric issues, the BSS study aimed to establish BSS as a feasible, effective, and essential component of the EV ecosystem. Figure 24 shows the BSS.

5.4. Comparative Analysis of EV Charging Systems

As EVs continue to gain popularity, various charging systems have emerged to meet the various needs of users and the infrastructure. The three primary EV charging systems—conductive charging, wireless charging, and BS charging stations—each provide unique solutions with specific advantages and limitations. These systems are critical in shaping the future of EV adoption by addressing challenges related to convenience, efficiency, and scalability. A detailed comparative analysis of these systems is presented in Table 9, highlighting their key characteristics. Another Table 10 outlines the impact of each system and offers a holistic view of their feasibility and implementation challenges.

6. Electric Vehicle Charging Standards, Levels and Interfaces

The charging procedure, which requires the transfer of electricity from the grid to the EV battery at the appropriate levels, is one of the main obstacles to the widespread adoption of EVs. The charging times depend on the size of the battery and the power output of the charger [146]. Two significant hurdles are the long charging duration and the limited battery lifespan. Several EV charging sets are discussed, including both on-board and off-board chargers. The infrastructure of charging stations is also covered in this section, along with safety recommendations established by organizations such as the SAE and IEC. It also highlights the various connections and charging stations used in different countries.

6.1. Conductive Charging Standards of Electric Vehicles

The transportation and electric power industries now have new dimensions due to the development of EVs. Standardizing every component of this new technology is crucial to operating it globally in a uniform way. Table 11 lists the regulatory bodies and guidelines related to the conductive charging of EVs.

6.1.1. International Electrotechnical Commission Standards (IEC)

An international standardization organization called the IEC develops standards for technologies related to electrical, electronic, and other domains.
IEC 61851: This standard regulates how conductive charging systems for EVs operate [165]. It applies to charging equipment for both on-board and off-board applications and supports rated supply voltages up to 1500 V DC and 1000 V AC [147,166]. IEC 61851 series comprises different aspects highlighted in Table 12.
IEC 62196: This standard is for outlets, plugs, vehicle connections, and inlets used in the conductive charging of EVs. The IEC 62196 series comprises different aspects highlighted in Table 13.
IEC 63110: This standard defines communication protocols to operate and manage EVs charging and discharging systems. It enables smart charging, remote control, energy management, and interoperability between charging stations and back-end systems [151].
IEC 63119: This standard provides protocols for EV consumers to access charging services across several networks (roaming), allowing seamless authentication, authorization, and billing between service providers. This is critical to creating a consistent and user-friendly charging environment, particularly when drivers move between regions or nations and use multiple charging networks [148].
IEC 61980: This standard defines WPT systems and allows supply voltages of up to 1500 V DC and 1000 V AC. WPT systems with on-site energy storage options are also included [167,168].
Table 12. Series of IEC 61851 standard for conductive EV charging systems [169,170,171,172,173].
SeriesExplanation
61851-1Guidelines for various EV plug and charging wire layouts.
61851-21-1Guidelines of electromagnetic compatibility (EMC) requirements for on-board chargers used in EVs with conductive charging.
61851-21-2Guidelines for EMC standards for off-board chargers used in CCSs.
61851-22Guidelines for AC charging station requirements.
61851-23Guideline Covers the technical requirements for DC fast charging stations, ensuring safe and effective high-power charging.
61851-24Guidelines for digital communication between the electric vehicle supply equipment (EVSE) and the EV charging controller during DC charging.
Table 13. Series of IEC 62196 standards for EV charging connectors and interfaces [174,175,176].
SeriesExplanation
62196-1Guidelines for plugs, automotive connectors, vehicle inlets, and socket outlets required for EV conductive charging. Safety, electrical characteristics, and mechanical strength are all included.
62196-2Guidelines covers several AC charging connection types. Types 1 through 3 correspond to single- and 3 φ AC charging, respectively.
62196-3Guidelines of Connectors for DC fast charging, including CHAdeMO, CCS1, CCS2, and GB/T standards.

6.1.2. Society of Automotive Engineers Standards (SAE)

An American professional organization, the SAE, creates standards for engineering firms in various sectors.
SAE J1772: This standard defines the physical connector and communication protocol for EV charging in Level 1 and Level 2 AC charging applications. This standard is North America’s most widely adopted charging interface for AC charging [154,177].
SAE J2293: This standard defines the architecture and requirements for energy transfer systems between an EV and the electric utility, covering both AC and DC charging modes while ensuring safe, efficient, and controlled power delivery, making it a foundational standard for the overall EV charging ecosystem [178,179,180].
SAE J2847: This standard series defines a set of communication protocols between EVs and charging equipment, enabling smart charging, load management, and V2G integration services, ensuring that EVs can interact effectively with charging infrastructure and utility systems to support advanced energy management. The SAE J2847 series is listed in Table 14.
SAE J2836: This standard series defines communication between EVs and the electric grid, focusing on enabling V2G functionality and other interactive services of the grid. These standards provide the functional framework for the participation of EVs in a modern and innovative grid ecosystem [155]. Each document in series J2836 outlines specific interaction scenarios between EVs and EVSE, utilities, and grid operators listed in Table 15.
SAE J2931: This standard series enables secure and standardized communication between EVs and the power grid. Defining robust network protocols and cyber security frameworks ensures the safety, privacy, and trustworthiness of V2G interactions, a vital component of the future of the smart grid [181]. The SAE J2931 series is listed in Table 16.
SAE J2954 and SAE J2954 recommended practice (RP): This standard defines WPT for EVs, which only supports the wireless charging of level 2. However, a newly released version of the RP claims to enable level 3. In addition, the upgraded version offers a standardized testbed for validating and measuring the performance of new products from infrastructure and EV manufacturers. In addition to payment processing, autonomous charging, and driver assistance for easy parking of EVs, this standard [182,183].
SAE J1773: This standard defines the requirements for WPT charging systems of EVs. Transfer energy from a charging station to a vehicle without physical connectors by magnetic field, offering a vision of hands-free, user-friendly charging [184,185,186].
SAE J3400: This standard formalizes the NACS, originally developed by Tesla. 3400 NACS connector is compact and lightweight and supports both AC (Level 1 and Level 2) and DC fast charging, depending on vehicle and charger compatibility, through the same port, unlike the SAE J1772 (AC) and CCS1 (DC) used previously. By unifying AC and DC charging into a single connector, the J3400 reduces complexity and improves user convenience [159].
Table 14. Series of SAE J2847 standards for communication protocols [187,188,189].
SeriesExplanation
J2847-1Communication in Smart Charging of Plug-in EVs using Smart Energy Profile.
J2847-2Interaction Between Off-Board DC Chargers and Plug-in Vehicles.
J2847-3Plug-in Vehicle Communication as a Distributed Energy Source.
J2847-6Communication related to plug-in hybrid charging behavior.
Table 15. Series of SAE J2836 standard communication between plug-in vehicles and the utility grid [188,190,191,192,193,194].
SeriesExplanation
J2836-1Communication for energy services between plug-in cars and the grid.
J2836-2Communication between Off-Board DC Chargers and Plug-in Vehicles.
J2836-3WPT charging communication between infrastructure and automobiles.
J2836-4Applications of Plug-in EV Diagnostic Communication.
J2836-5Use Cases for Plug-in EV Customer Communication.
J2836-6Applications for Plug-in EV Wireless Charging Communication.
Table 16. Series of SAE J2931 standard [195,196].
SeriesExplanation
J2931-1Requirements for wired and wireless communication between EVs and the electric grid for energy management and charging.
J2931-3Diagnostic and maintenance communication requirements for PEV charging systems.
J2931-4Addresses security-related requirements and encryption for communications between EVs, charging stations, and the grid.
J2931-5Interaction between the EV and utility systems for grid stabilization, demand response, and energy storage.

6.1.3. Standardization Administration of China (SAC)

The SAC is the government authority responsible for developing and managing standards for EV charging infrastructure, assuring compatibility, safety, and interoperability across all EVs, chargers, and related systems in China.
GB/T 20234: It provides the interface requirements for EVs and charging stations (AC or DC), such as plugs, sockets, connections, and vehicle inlets. It is the main standard for the China EV charging connection system [197,198,199]. The GB/T 20234 series comprises different aspects highlighted in Table 17.
GB/T 18487: The standard addresses the complete conductive charging system, including safety, performance, and compatibility. It outlines how charging systems interact with the grid and automobiles and the infrastructure required for the significant adoption of EVs in China [200,201,202]. The GB/T 18487 series comprises different aspects highlighted in Table 18.
GB/T 27930: This protocol provides a key communication link between the charging station and the BMS of EVs, particularly during DC fast charging. It guarantees that the charging process is accurately controlled, allows real-time status updates, manages problem detection and response, and coordinates voltage and current levels to distribute power efficiently. Its position is critical to establishing compatibility between different EV brands and charging infrastructure in China, making it an essential part of the country’s electric car ecosystem [162].
GB/T 19596: The objective of this standard is to provide a standardized terminology relevant to EVs under Chinese legislation. It provides precise definitions for various categories of EVs, such as BEV, and critical components, such as motors, controllers, and BMS. This standardized terminology ensures consistent communication, documentation, and regulatory compliance in China’s rapidly expanding EV sector [163].

6.2. Wireless Power Transfer (WPT) Charging Standards of Electric Vehicles

Wireless charging for EVs is a method that transfers electricity from a charging pad on the ground to a receiver on the underside of the vehicle without the use of physical cables or connectors. This technology commonly employs inductive charging, in which an electromagnetic field is created by a coil on the ground pad and caught by a comparable coil in the car to charge the battery. WPT charging is more convenient and user friendly than CCS since it eliminates the need to plug in cables, which is especially handy in inclement weather or for people with restricted mobility. It also reduces the wear and tear on the connections. However, its drawbacks include higher installation costs, reduced efficiency compared to CCS, and the need for precise alignment of the car and the charging pad [203,204]. Table 19 describes the regulatory bodies and guidelines related to the WPT of EVs.

6.3. Electric Vehicle Charging Interface Classifications

The infrastructure required for EV charging includes components such as connectors necessary for recharge at EV charging stations. It is crucial to be thoroughly aware of the many connectors accessible worldwide since the types of connectors to charge EV batteries vary depending on the charging station, nation, and manufacturer. Depending on the charging station’s and power supply’s needs, EV connections are generally divided into AC and DC types. Table 20 outlines numerous EV connectors used in different countries, highlighting the diversity of charging infrastructure in various regions.
EV charging interfaces vary across significant regions such as China, North America, Europe, and Japan, each adopting different standards and connector types.
The national standard in China is GB/T. GB/T 20234.2 is used for AC charging, which enables both ( 1 ϕ ) and ( 3 ϕ ) charging. GB/T 20234.3 is used for DC fast charging, a distinct interface optimized for high power supply. This system is unique to China and does not have direct compatibility with standards from other areas [198,199]
In North America (US), the standard SAE J1772 is used for AC charging supporting ( 1 ϕ ) and ( 2 ϕ ). For DC fast charging, the area generally employs CCS Type 1, often known as Combo 1, which combines J1772 AC connections with two additional DC pins in a single connector. Tesla has also established a unique charging standard in the US, which has progressively been made available to other vehicles through adapters and infrastructure support [154]. In Europe, the standard IEC 62196 is used for AC charging, which supports both ( 1 ϕ ) and ( 3 ϕ ) inputs. For DC charging, CCS Type 2, also known as Combo 2, adds two DC power pins to the IEC 62196 AC connection, similar to the CCS technique used in the US [175]. SAE and IEC standards are closely related, particularly when specifying charging modes and levels. SAE J1772 correlates with IEC 62196-2 Type 1 and operates under IEC 61851 Mode 2 and 3 for AC charging. The primary distinction between SAE J1772 and IEC 61851 in AC conductive charging is phase voltage. SAE J1772 enables charging ( 1 ϕ ) and split-phase ( 2 ϕ ) charging in Level 2, but IEC 61851 supports charging ( 1 ϕ ) and ( 3 ϕ ) in modes 1, 2, and 3 [214]. The SAE standard was designed for the North American electrical grid, primarily using split-phase 120/240 V power in residential areas. In contrast, the IEC standard was intended for regions with ( 1 ϕ and 3 ϕ ) power in Europe on many international grids, including homes. This fundamental difference in the grid architecture accounts for the difference in phase voltage support between the two standards [215].
Similarly to North America, SAE J1772 type 1 ( 1 ϕ ) is used for AC charging interfaces in Japan. For DC fast charging, Japan established its standard CHAdeMO, one of the first fast charging systems recognized to offer bidirectional power flow, allowing V2G capabilities. CHAdeMO has been widely adopted in Japan and by various automakers, including Nissan [216].
NACS, developed by Tesla, is based on the North American electrical grid. SAE J3400 allows AC and DC charging via a single compact connector. For AC charging, it accepts ( 1 ϕ ) power at 120V/240V level 1/level 2. Unlike CCS, the same connector allows for high-power charging of up to 250 kW or more without needing a separate port. This single design reduces the charging interface and saves hardware complexity while providing broad compatibility with various charging speeds and applications. It does not support ( 3 ϕ ) AC like IEC Type 2 does in Europe [159].

6.4. Electric Vehicle Charging Levels/ Modes

Table 21 and Table 22 provide the charging characteristics along with the connector types as defined by the SAE, IEC, and GB/T standards for AC and DC charging, respectively. The technical standards of IEC 61851 and SAE J1772 are comparable, but their language is different. SAE refers to charging power levels as the “Level”, whereas IEC uses the “Mode”. The IEC 61851 standard is classified into four modes.
Mode 1 Standard AC charging (No Control Pilot): Figure 25a shows how an EV can relate to the basic cable using a regular outlet, without safety and communication or control between the EV and the charging source. Mode 1 is the simplest type of charging, in which the EV is plugged into a regular home or office outlet. It does not protect against electric shock. It provides charging with a maximum current rating of 16 A, voltages of 230 V 1 ϕ and 400 V 3 ϕ , and power up to 3.7 kW. Many countries prohibit this charging technique because of the safety issues it raises, despite offering little to no protection to the consumer.
Mode 2 AC Charging with Safety Features (Control Pilot Communication): Figure 25b shows that by adding safety features, including an in-cable control and protection device (IC-CPD), which adds a layer of safety, Mode 2 semi-fast charging outperforms Mode 1. This technique, which is often seen in portable EV chargers, uses a household or industrial plug with integrated safety features. With current ratings up to 32 A and voltages of 230 V 1 ϕ and 400 V 3 ϕ , power ratings up to 7.4 kW 1 ϕ or 22 kW 3 ϕ . IC-CPD provides communication between the EV and the charger, allowing for features such as load management, ensuring proper grounding, and checking for faults. Due to the cable’s safety requirements, Mode 2 charging is more expensive. It is subject to regulations in several countries, including the United States, Canada, and various European nations.
Mode 3 Dedicated AC Charging Station (Control Pilot Communication): It is the standard method for regular AC charging in Europe and other regions that follow IEC standards. In this mode, the EV communicates with a specific EVSE, such as a wall box or a public charging station. This mode provides complete digital communication between the car and the charging infrastructure, allowing features such as load management, defect detection, and safe disconnection [217]. It also provides higher power levels than Modes 1 and 2 and has standardized connections, such as Type 2 in Europe. This standard defines a current of up to 63A and voltages of 230 V 1 ϕ and 400 V 3 ϕ , with a power rating of up to 43.5kW. But it is limited to 32A, up to 22kW in the real market. It is the most commonly used mode for residential and public AC charging. Figure 25c shows the basic configuration of Mode 3.
Mode 4 DC Fast Charging (Off-board Charger with Control Communication): Figure 25d illustrates Mode 4. It is used exclusively for DC fast charging, where the EV is connected to a high-power DC charger that delivers DC to the vehicle battery. It supplies DC power and requires a much more complex system with robust communication and safety features. It ensures proper control of the charging parameters, real-time monitoring, and emergency shutdown capabilities. This mode supports high charging currents and is typically used in commercial highway fast-charging stations. Connector types for Mode 4 include CCS Combo 2 in Europe. It provides a 200 V to 1000 V DC voltage, currents up to 500 A, and a power rating of up to 350 kW (or higher with ultra-fast chargers).

7. Discussion

From 2018 to 2024, the worldwide EV market increased significantly, from approximately 2 million units sold in 2018 to approximately 17.1 million units sold in 2024, suggesting a shift towards sustainable transportation globally. Statistics on European EV sales from 2020 to 2023 show a consistent upward trend; however, from 2023 to 2024, there was a slight decline. This decrease was primarily driven by reduced sales in the major participating countries, such as Germany, where sales fell from 693,907 in 2023 to 570,373 in 2024, a decrease of 18%. Similarly, Italy also experienced a decrease from 135,108 to 118,486 units, a 12% drop. France and Sweden experienced sales decreases of 5% and 9%, respectively. This general decline in sales among key markets is largely attributed to changes in government incentive policies in European countries as detailed in Table A1.
EV sales in Italy tripled from 2020 to 2024, although growth is slower than in other European markets. Despite supporting subsidies and increasing awareness, progress remains hindered by sluggish growth in infrastructure, inconsistent regulations, and regional differences. BEV sales tripled over this period, indicating greater customer confidence. However, 2024 witnessed significant monthly swings, such as a decrease between March and August and a spike in June, which reflected the effects of shifting incentives and market uncertainty. Meanwhile, PHEV sales decreased, presumably indicating a loss of faith in hybrid solutions despite long-term electrification goals.
Europe’s EV charging network expanded exponentially between 2020 and 2024, even as sales of major European countries decreased from 2023 to 2024 as the impact of government policies and incentive programs demonstrating a strategic commitment to electric transportation. Regulatory incentives for infrastructure, public–private partnerships, and high-performance charging prompted the expansion. Almost all European countries are improving EV/CP ratio year by year.
The AC infrastructure drove the expansion, particularly medium AC chargers, which increased from 143,783 to more than 661,433 units and are now widely available in public spaces as the primary urban public charging option, offering an appropriate compromise of speed and cost. DC charging has improved, with a focus on Level 1 Ultra-Fast DC (150 > P < 350) kW for long-distance travel and reduced downtime for frequent drivers. Europe’s emphasis on high-power quick charging aligns with rising customer expectations and strengthens its position as an EV ecosystem mover.
Medium AC chargers had the greatest growth, quadrupling in quantity, and were strategically located in high-traffic areas such as commercial centers and metropolitan hubs. The DC infrastructure was also developed, with a noticeable increase in fast and ultrafast stations, particularly in urban and commercial areas, improving usability and shortening charging periods. However, there are geographical differences. The northern and urbanized regions, such as Lombardia, Piemonte, Lazio, and Veneto, have the highest density of infrastructure. In contrast, rural and southern areas such as Molise and Basilicata are not developed, reflecting more significant EV adoption and investment discrepancies. Although Europe and Italy have made considerable advances in charging infrastructure, fair distribution and speed diversity remain significant concerns, particularly in Italy. Addressing these gaps is crucial for building a scalable, inclusive, and future-ready EV ecosystem in all locations. Most European EV models have an energy consumption range of 165–185 Wh/km, which balances economy and performance. The widespread availability of 11 kW OBC power in 337 European models suggests a developing industry standard compatible with existing charging infrastructure and improves customer satisfaction by reducing charging times.
With an in-depth exploration of the EV battery charging systems—conductive, WPT, and BS—each represents a distinct approach to energy delivery and user interaction. Each charging system offers unique advantages that cater to different use cases and user expectations. Conductive charging remains the dominant practice for electric vehicles due to its efficiency, widespread infrastructure, and mature technology. However, as the EV market approaches saturation and more high-EV-density roads emerge, alternative charging options such as WPT and BS are gaining attention. These technologies offer significant potential benefits, such as less charging time, increased user convenience, and automation compatibility. The future of EV charging will likely depend on a hybrid approach that combines these technologies to fit diverse mobility ecosystems, user preferences, and regional infrastructure capabilities.

8. Conclusions

This paper analyzes the complex landscape of EVs, offering essential information on technology, the dynamics of European EV market, infrastructure and global standards that define the present and future of sustainable transportation. EV sales in Europe 2023–2024 declined, as major countries such as Germany, France, Italy, and Sweden, EV sales decreased due to the effect of policy changes in government incentives: in Germany, EV purchase incentives for private buyers were removed at the end of 2023; in France, tighter rules were implemented to exclude higher-income earners and more expensive vehicle models; and in Italy, there was a very short period of availability of purchase incentives in 2024. These reveal the market’s high sensitivity to policy changes. A stable and predictable policy framework is crucial to maintaining consumer trust and industry growth. While the government is paying more attention to infrastructure policies in European countries, resulting in the rapid spread of charging stations in Europe, from 729,737 in 2023 to 1,002,583 in 2024, the total number of charging points in Europe has increased. The EV/CP ratio is improving in almost all European countries despite a reduction in EV sales. It seems that the sales reduction is not due to the limitation of the charging infrastructure in Europe but to the government policies.
We provide an overview of the global standards, interfaces, and power levels that govern EV charging. Compiling a wide range of international standards, including those from IEC, SAE, and GB/T, into comprehensive tables and descriptions, this section serves as both an informative reference and a practical guide to understanding the technical framework of EV charging systems. The various AC and DC charging interfaces offer valuable information on the different connector types used across regions such as China, Japan, Europe, and the US. Organizing connector specifications and compatibility features into clear and accessible tables helps readers to grasp the complexity and regional diversity of global EV charging infrastructures. Finally, the coverage of charging modes and levels combines the whole picture by outlining each mode’s power, voltage, and current ratings. The EV sector has enormous potential to reduce GHG emissions and drive long-term environmental sustainability. With continued advancement and the removal of scalability barriers, EVs are poised to lead the green revolution, propelling both economic growth and ecological progress on a global scale.

Author Contributions

The review was conceptualized and outlined jointly by M.M. and C.R.; M.M. conducted the literature review and drafted and edited the manuscript. C.R. provided critical revisions and overall supervision. All authors have read and agreed to the published version of the manuscript.

Funding

This work was supported in part by the Italian MUR for financial support through MOST-Sustainable Mobility Center, Centro Nazionale per la Mobilita’ Sostenibile, Spoke 13 of the National Recovery and Resilience Plan (PNRR). Mission 4, component 2, investment 1.4 e D.D. 1033 17/06/2022, CN00000023.

Data Availability Statement

No new data were created in this study. The analysis is based on publicly available data.

Conflicts of Interest

The authors declare no conflicts of interest.

Abbreviations

ACAlternative current
BEVBattery Electric Vehicle
BSBattery Swapping
CO2Carbon Dioxide
CNGCompressed Natural Gas
CPCharging Points
DWPTDynamic Wireless Power Transfer
DCDirect Current
EDGAREmissions Database for Global Atmospheric Research
EEAEuropean Environment Agency
EMElectric Motor
EMCElectromagnetic Compatibility
EPAEnvironmental Protection Agency
ER-EVExtended Range Electric Vehicle
EUEuropean Union
EVElectric Vehicle
FCEVFuel Cell Electric Vehicle
EVSEElectric Vehicle Supply Equipment
GHGsGreenhouse Gases
HEVHybrid Electric Vehicle
IC-CPDIn-cable Control and Protection Device
ICCTInternational Council on Clean Transportation
ICEInternal combustion Engine
IEAInternational Energy Agency
IECInternational Electrotechnical Commission
wh/kmWatt-hour/kilometers
NACSNorth American Charging System
NIOWeilai (蔚来) Chinese multinational electric vehicle manufacturer
NRPNet Retail Price
OBCOn-Board Charger
PHEVPlug-in Hybrid Electric Vehicle
SACStandardization Administration of China
SAESociety of Automotive Engineers
V2GVehicle to Grid
V2LVehicle to Load
V2VVehicle to Vehicle
V2XVehicle to Everything
WPTWireless Power Transfer
ZEVsZero-Emission Vehicle
M1Passenger car
M1GPassenger off-road vehicles
M2Vehicle for carriage of passengers, mass ≤ 5 t
M3Vehicle for carriage of passengers, mass > 5 t
N1Vehicle for carriage of goods, mass ≤ 3.5 t
N2Vehicle for carriage of goods, mass > 3.5 t and ≤ 12 t
N3Vehicle for carriage of goods, mass > 12 t
NEDCNew European Driving Cycle
VATValue Added Tax
ISEEIndicator of the Equivalent Economic Situation (Italy)

Appendix A

This appendix provides a summary of the tax benefits and financial incentives offered by various European countries to promote the adoption of electric vehicles. These measures include exemptions from registration and road taxes, reduced VAT rates, and purchase subsidies.
Table A1. Overview of tax benefits and incentives for vehicles in selected European countries [38,41,42,44,218,219,220].
CountryYearTax BenefitsIncentives
AcquisitionOwnershipCompany CarsPurchaseInfrastructure
Germany2022×10-year exemption for BEVs/FCEVs registered until December 2025 (till 2030)Exemption from circulation tax for EVs < 95 g CO2/kmMore stringent for PHEVs Taxable benefit reduction:
  • 0.5–1% for BEVs/PHEVs
  • BEVs ≤ EUR 60,000: 0.25–1%
Innovation Bonus (until 31 December 2022):
  • Cars ≤ EUR 40,000: EUR 9000 (BEVs/FCEVs), EUR 6750 (PHEVs)
  • Cars > EUR 40,000: EUR 7500 (BEVs/FCEVs), EUR 5625 (PHEVs) Note: Stricter requirements under review
×
2023×Same as 2022 Ownership
  • 0.5–1% for BEVs/PHEVs
  • BEVs ≤ EUR 60,000: 0.25–1%
From January 2023: funding for new/used BEVs and FCEVs (2/3 govt + 1/3 industry)
  • Cars ≤ EUR 40,000: EUR 6750
  • Cars EUR 40k–EUR 65k: EUR 4500
  • From September 2023: private individuals only
×
2024×Same as 2022 Ownership
  • Stricter conditions for PHEVs apply
Taxable benefit reduction:
  • 0.5–1% for BEVs/PHEVs
  • BEVs ≤ EUR 60,000: 0.25–1%
No longer available funding applications closed 31 December 2023 From January 2024: funding cuts + stricter rules×
2025×Same as 2022 OwnershipTaxable benefit reduction:
  • 0.5–1% for BEVs/PHEVs
  • BEVs ≤ EUR 60,000: 0.25–1%
××
France2022Regional tax exemption (full or 50%) for EVs, hybrids, CNG, LPG, and E85 BEVs, FCEVs, and PHEVs (range > 50 km) are exempt from mass-based malus×CO2-based tax exemption (TVS) for vehicles < 60 g CO2/km (apart from diesel vehicles).Bonus to buy cars or vans with ≤20 g CO2/km:
  • Up to EUR 6000 for households (<EUR 45k vehicle)
  • Up to EUR 4000 for legal persons
  • EUR 2000 for vehicles price (EUR 45k–EUR 60k) and FCEV vans and cars (price > EUR 60,000).
  • Bous cars or vans > 21 and ≤50 g CO2/km: EUR 1000 (households, ≤EUR 50k)
  • Heavy-duty BEVs/FCEVs: EUR 50,000 (N2/N3), EUR 30,000 (M2/M3)
  • Scrappage scheme: Cars: up to EUR 5000 (income-based) and Vans: up to EUR 9000 (weight-based)
×
2023Same as 2022 Acquisition×CO2-based tax exemption (TVS) for vehicles < 60 g CO2/km (apart from diesel vehicles).
  • EUR 5000 bonus for households (vehicle ≤ EUR 47,000)
  • EUR 3000 bonus for legal persons (vehicle ≤ EUR 47,000)
  • Scrappage scheme for new/used BEV or FCEV ≤ EUR 47,000: up to EUR 6000 (income-based)
×
2024Same as 2022 Acquisition×CO2-based tax exemption (TVS) for vehicles < 60 g CO2/km (apart from diesel vehicles)Bonus for new BEV/FCEV ≤ EUR 47,000 and <2.4 t: EUR 7000 (low-income households), EUR 4000 (others) Scrappage for BEV/FCEV ≤ EUR 47,000:EUR 5000 (low-income), EUR 1500 (others/legal entity)×
2025Same as 2022 Acquisition×CO2-based tax exemption (TVS) for vehicles < 60 g CO2/km (apart from diesel vehicles).Bonus for BEV/FCEV (≤EUR 47,000 and <2.4 t):
  • EUR 4000 (income < EUR 16,300), EUR 3000 (EUR 16,300–EUR 26,200), EUR 2000 (others)
×
Italy2022×5-year exemption for Evs from registration, Then, 75% tax reduction equivalent to petrol vehicles (BEVs only).×
  • EUR 3000 (EUR 5000 w/scrappage) for EVs ≤ 20 g CO2/km and <EUR 35,000 + VAT
  • EUR 2000 (EUR 4000 w/scrappage) for EVs 21–60 g CO2/km and <EUR 45,000 + VAT
×
2023×
  • BEVs: 5-year exemption from registration, then 75% tax reduction
  • HEVs: min. flat rate (EUR 2.58/kW)
  • Regional discounts may apply
×
  • EUR 3000 (EUR 5000 w/scrappage) for BEV/PHEV ≤ 20 g CO2/km and ≤EUR 35,000 + VAT
  • EUR 2000 (EUR 4000 w/scrappage) for BEV/PHEV 21–60 g CO2/km and ≤ EUR 45,000 + VAT
80% subsidy on home charging infrastructure (max EUR 1500 per applicant)
2024×Same as 2023 Ownership×BEVs ≤ 20 g CO2/km and ≤EUR 35k + VAT:
  • EUR 6000 (no scrappage),
  • EUR 7500 bonus if ISEE < EUR 30k,
  • EUR 11,000 (w/scrappage Euro 0–2),
  • EUR 13,750 if ISEE < EUR 30k,
  • EUR 10,000 (w/Euro 3), EUR 12,500 if ISEE < EUR 30k,
  • EUR 9000 (w/Euro 4), EUR 11,250 if ISEE < EUR 30k,
  • EUR 0 (w/Euro 5), EUR 8000 if ISEE < EUR 30kPHEVs 21–60 g CO2/km and ≤EUR 45k + VAT:
  • EUR 4000 (no scrappage),
  • EUR 5000 if ISEE < EUR 30k,
  • EUR 8000 (w/Euro 0–2), EUR 10,000 if ISEE < EUR 30k,
  • EUR 6000 (w/Euro 3), EUR 7500 if ISEE < EUR 30k,
  • EUR 5500 (w/Euro 4), EUR 6875 if ISEE < EUR 30k,
  • EUR 0 (w/Euro 5), EUR 5000 if ISEE < EUR 30k
  • 80% of purchase + installation for standard recharging infrastructure (max EUR 1500 per applicant)
2025×Same as 2023 Ownership××80% reimbursement for EV charging station purchase and installation costs.Up to EUR 1500 for individuals, up to EUR 8000 for condominium common areas.Valid for expenses from January to December 2024, apply from 29 April 2025 to 27 May 2025. ×
Sweden2022×Reduced annual tax (SEK 360) for ZEVs and PHEVs (petrol).Private use of company car is taxed; green cars get a permanent tax reduction on the benefit valueClimate bonus (light vehicles):
  • SEK 70,000 (BEVs),
  • SEK 44,417 (PHEVs with 1 g CO2/km) → SEK 10,020 (≤ 60 g CO2/km)
  • Premium for electric buses and trucks Proposals (1 July 2022):
  • SEK 19,700 (PHEVs with 1 g CO2/km), SEK 5000 (≤50 g CO2/km),
  • Bonus cap at SEK 700,000 for M1/N1 vehicles
×
2023×same as 2022 Ownership
  • Taxed on private use
  • Permanent benefit reduction:SEK 350,000 for BEVs/FCEVsSEK 140,000 for PHEVs
  • Max reduction = 50% of car price
×
  • 50% tax deduction (max SEK 15,000) for household charger installation
  • Ladda bilen grant for AC charger installation in apartment buildings
2024×Same as 2022 OwnershipSame as 2023 company carsScrapping premium expected in second half of 202450% tax deduction on installation (up to SEK 50,000)“Ladda bilen” grant: 50% of AC charger cost (up to SEK 15,000)
2025×Low road tax (SEK 360) for zero-emission vehicles and PHEVs Higher taxes for new 2025 PHEVs emitting > 75 g CO2/kmSame as 2023 company carsScrapping premium (private individuals):SEK 10,000 for scrapping old combustion car and buying/leasing BEV Valid from 20 August 2024 to 19 August 202550% tax deduction (max SEK 50,000) for households installing home chargers (link)Ladda bilen grant:
  • Covers up to 50% (max SEK 15,000) per charging point
  • For apartment buildings/workplaces (link)
Finland2022Zero-emission passenger cars and vans exempt from registration tax (since 1 Oct 2021)×
  • EUR 170/month tax deduction (2021–2025)
  • Charging of Evs at workplace is exempted from income tax (2021–2025).
  • EUR 2000 incentive for purchase/lease BEVs < EUR 50,000 in class M1 and M1G (2018–2021).
  • EUR 2000–EUR 6000 for electric vans (2022–2025)
  • EUR 6000–EUR 50,000 for electric trucks (2022–2025)
×
2023Zero-emission passenger cars and vans exempt from registration tax (since 1 Oct 2021)×Same as 2022 (Company Cars)××
2024Same as 2022 Acquisition×
  • EUR 170/month income tax deduction for BEVs (2021–2025)
  • EUR 85/month for cars emitting 1–100 g CO2/km (2022–2025)
  • EV workplace charging is income tax exempt (2021–2025)
××
2025Same as 2022 AcquisitionTax exemption for BEVsSame as 2024 (Company Cars)×30% subsidy for public charging stations (>11 kW)35% subsidy for fast charging stations (>22 kW)
Switzerland2023Electric cars are exempt from the automobile tax.Various cantons reduce or exempt traffic tax over time based on CO2/km.The same ownership applies to company cars.×Various cantons and municipalities contribute to installation costs for electromobility.
2024×Various cantons reduce or exempt the traffic tax over time based on CO2/kmSame ownership applies to company cars.×Cantons and municipalities support electromobility installation costs
2025×Various cantons reduce or exempt traffic tax over a certain period, depending on CO2/kmSame ownership applies to company cars.×Various cantons and municipalities contribute to the installation costs for electromobility
Norway2024BEVs and FCEVs:
  • No VAT ≤ NOK 500,000
  • 25% VAT > NOK 500,000
  • Tax deduction for cars emitting <70 g CO2/km
××××
2025
  • VAT exemption (25%) for BEVs < NOK 500,000 (EUR 44,000)
  • Exempt from vehicle weight tax
  • Tax deduction for cars emitting <70 g CO2/km
  • Scrapping fee only: EUR 249
  • Minimum annual road tax: NOK 455 (EUR 48)
  • BEVs pay 70% of road toll
20% reduction in company car tax×
  • Grants from municipalities for recharging infrastructure
  • 6% minimum of parking/new buildings must be allocated to electric vehicles

References

  1. Labatt, S.; White, R.R. Carbon Finance: The Financial Implications of Climate Change; John Wiley & Sons: Hoboken, NJ, USA, 2011; 889p. [Google Scholar]
  2. Kanellos, F.D.; Grigoroudis, E.; Hope, C.; Kouikoglou, V.S.; Phillis, Y.A. Optimal GHG emission abatement and aggregate economic damages of global warming. IEEE Syst. J. 2014, 11, 2784–2793. [Google Scholar] [CrossRef]
  3. Hao, H.; Liu, Z.; Zhao, F.; Li, W.; Hang, W. Scenario analysis of energy consumption and greenhouse gas emissions from China’s passenger vehicles. Energy 2015, 91, 151–159. [Google Scholar] [CrossRef]
  4. UNFCCC. Adoption of the Paris Agreement; Proposal by the President. UN Document FCCC/CP/2015/L.9/Rev.1; UNFCCC: New York, NY, USA, 2015. [Google Scholar]
  5. Fontaras, G.; Zacharof, N.G.; Ciuffo, B. Fuel consumption and CO2 emissions from passenger cars in Europe–Laboratory versus real-world emissions. Prog. Energy Combust. Sci. 2017, 60, 97–131. [Google Scholar] [CrossRef]
  6. Gao, J.; Chen, H.; Li, Y.; Chen, J.; Zhang, Y.; Dave, K.; Huang, Y. Fuel consumption and exhaust emissions of diesel vehicles in worldwide harmonized light vehicles test cycles and their sensitivities to eco-driving factors. Energy Convers. Manag. 2019, 196, 605–613. [Google Scholar] [CrossRef]
  7. International Energy Agency (IEA). CO2 Emissions in 2023; IEA: Paris, France, 2023.
  8. Statista. GHG Emissions of All World Countries; Statista: Hamburg, Germany, 2023. [Google Scholar]
  9. International Council on Clean Transportation. Decarbonizing Road Transport by 2050: Zero-Emission Pathways for Passenger Vehicles. 2021. Available online: https://theicct.org/publication/decarbonizing-road-transport-by-2050-zero-emission-pathways-for-passenger-vehicles/ (accessed on 16 November 2024).
  10. Ghosh, A. Possibilities and challenges for the inclusion of the electric vehicle (EV) to reduce the carbon footprint in the transport sector: A review. Energies 2020, 13, 2602. [Google Scholar] [CrossRef]
  11. European Environment Agency. Climate Change Mitigation: Reducing Emissions. 2020. Available online: https://www.eea.europa.eu/en/topics/in-depth/climate-change-mitigation-reducing-emissions (accessed on 16 November 2024).
  12. Bieker, G. A Global Comparison of the Life-Cycle Greenhouse Gas Emissions of Combustion Engine and Electric Passenger Cars; Technical Report, White Paper; International Council on Clean Transportation: San Francisco, CA, USA, 2021. [Google Scholar]
  13. U.S. Environmental Protection Agency (EPA). Electric Vehicles: Reducing Emissions. 2021. Available online: https://nepis.epa.gov/Exe/ZyPURL.cgi?Dockey=900L1O00.txt (accessed on 16 June 2024).
  14. European Commission. European Green Deal and the Transition to Net-Zero Emissions by 2050; European Commission: Brussels, Belgium, 2019. [Google Scholar]
  15. International Energy Agency (IEA). Global EV Outlook 2024; IEA: Paris, France, 2024.
  16. Bloomberg New Energy Finance (BNEF). Electric Vehicle Outlook 2024; BNEF: London, UK, 2024. [Google Scholar]
  17. United Nations Environment Programme (UNEP). Electric Mobility; UNEP: Nairobi, Kenya, 2024. [Google Scholar]
  18. World Resources Institute (WRI). Integrated Transport; WRI: Washington, DC, USA, 2023. [Google Scholar]
  19. McKinsey & Company. The Future of EV Charging Infrastructure: Executive Perspectives; McKinsey & Company: Hong Kong, China, 2021. [Google Scholar]
  20. World Economic Forum (WEF). High-Emitting Sectors: Challenges and Opportunities for Low-Carbon Suppliers; WEF: Beijing, China, 2024. [Google Scholar]
  21. Liang, H.; Liu, Y.; Li, F.; Shen, Y. Dynamic economic/emission dispatch including PEVs for peak shaving and valley filling. IEEE Trans. Ind. Electron. 2018, 66, 2880–2890. [Google Scholar] [CrossRef]
  22. Xie, R.; Wei, W.; Wu, Q.; Ding, T.; Mei, S. Optimal service pricing and charging scheduling of an electric vehicle sharing system. IEEE Trans. Veh. Technol. 2019, 69, 78–89. [Google Scholar] [CrossRef]
  23. Bernard, M.R.; Hall, D.; Lutsey, N. Update on Electric Vehicle Uptake in European Cities; International Council on Clean Transportation (ICCT): Hungary, Budapest, 2021. [Google Scholar]
  24. Barsari, V.Z.; Thrimawithana, D.J.; Covic, G.A. An inductive coupler array for in-motion wireless charging of electric vehicles. IEEE Trans. Power Electron. 2021, 36, 9854–9863. [Google Scholar] [CrossRef]
  25. Liu, C.; Chau, K.T.; Wu, D.; Gao, S. Opportunities and challenges of vehicle-to-home, vehicle-to-vehicle, and vehicle-to-grid technologies. Proc. IEEE 2013, 101, 2409–2427. [Google Scholar] [CrossRef]
  26. Sarker, M.T.; Haram, M.H.S.M.; Shern, S.J.; Ramasamy, G.; Al Farid, F. Second-life electric vehicle batteries for home photovoltaic systems: Transforming energy storage and sustainability. Energies 2024, 17, 2345. [Google Scholar] [CrossRef]
  27. PRISMA—Preferred Reporting Items for Systematic Reviews and Meta-Analyses. PRISMA Statement. 2020. Available online: https://www.prisma-statement.org/prisma-2020-flow-diagram (accessed on 15 February 2025).
  28. International Energy Agency (IEA). Global EV Outlook 2019: Analysis; IEA: Paris, France, 2019.
  29. International Energy Agency (IEA). Global EV Outlook 2017: Analysis; IEA: Paris, France, 2017.
  30. International Energy Agency (IEA). Electric Car Sales, 2012–2024; IEA: Paris, France, 2024.
  31. Reuters. Norway: Nearly All New Cars Sold in 2024 Were Fully Electric. 2025. Available online: https://www.reuters.com/business/autos-transportation/norway-nearly-all-new-cars-sold-2024-were-fully-electric-2025-01-02/ (accessed on 14 February 2025).
  32. New Mobility News. Norway Nears 100% EV Adoption with New Sales Record. 2025. Available online: https://newmobility.news/2025/02/04/norway-nears-100-ev-adoption-with-new-sales-record/ (accessed on 14 February 2025).
  33. Bhatti, H.J.; Danilovic, M.; Nåbo, A. A multidimensional readiness index for the electrification of the transportation system in China, Norway, and Sweden. Future Transp. 2023, 3, 1360–1384. [Google Scholar] [CrossRef]
  34. Wikipedia. Plug-in Electric Vehicles in Norway. 2025. Available online: https://en.wikipedia.org/wiki/Plug-in_electric_vehicles_in_Norway (accessed on 14 February 2025).
  35. Lead Intelligent. Global EV Record-Breaking Sales in 2024 and Outlook for 2025. 2024. Available online: https://www.leadintelligent.com/en/global-ev-record-breaking-sales-in-2024-and-outlook-for-2025/ (accessed on 8 May 2025).
  36. Rho Motion. Over 17 Million EVs Sold in 2024: Record Year. 2024. Available online: https://rhomotion.com/news/over-17-million-evs-sold-in-2024-record-year/ (accessed on 8 May 2025).
  37. Alternative Fuels Observatory. European Union (EU27)—Road Transport. 2025. Available online: https://alternative-fuels-observatory.ec.europa.eu/transport-mode/road/european-union-eu27 (accessed on 24 January 2025).
  38. European Automobile Manufacturers’ Association. Electric Cars: Tax Benefits and Incentives in the EU in 2024. 2024. Available online: https://www.acea.auto/fact/electric-cars-tax-benefits-and-incentives-2024/ (accessed on 15 May 2025).
  39. Motor Trader. EV Sales Across Europe Fall 1.1% in 2024 Amid Concerns over Pricing and Infrastructure. 2025. Available online: https://www.motortrader.com/motor-trader-news/automotive-news/ev-sales-across-europe-fall-1-1-2024-amid-concerns-pricing-infrastructure-30-01-2025 (accessed on 15 February 2025).
  40. European Court of Auditors. Special Report on Electrical Recharging. 2021. Available online: https://www.eca.europa.eu/en/publications/SR21_05 (accessed on 15 February 2025).
  41. European Alternative Fuels Observatory. Germany—Vehicles and Fleet. 2025. Available online: https://alternative-fuels-observatory.ec.europa.eu/transport-mode/road/germany/vehicles-and-fleet (accessed on 15 May 2025).
  42. European Alternative Fuels Observatory. France—Vehicles and Fleet. 2025. Available online: https://alternative-fuels-observatory.ec.europa.eu/transport-mode/road/france/vehicles-and-fleet (accessed on 15 May 2025).
  43. Alternative Fuels Observatory. Italy—Vehicles and Fleet. 2025. Available online: https://alternative-fuels-observatory.ec.europa.eu/transport-mode/road/italy/vehicles-and-fleet (accessed on 24 January 2025).
  44. European Alternative Fuels Observatory. Sweden—Vehicles and Fleet. 2025. Available online: https://alternative-fuels-observatory.ec.europa.eu/transport-mode/road/sweden/vehicles-and-fleet (accessed on 15 May 2025).
  45. European Alternative Fuels Observatory. Finland—Vehicles and Fleet. 2025. Available online: https://alternative-fuels-observatory.ec.europa.eu/transport-mode/road/finland/vehicles-and-fleet (accessed on 15 May 2025).
  46. Electric Vehicle Database. 2024. Available online: https://ev-database.org (accessed on 15 August 2024).
  47. Powy Energy. 2024 Electric Car Incentives. 2024. Available online: https://powy.energy/en/news/evolution-news/2024-electric-car-incentives/ (accessed on 15 February 2025).
  48. Powy Energy. Electric Car Incentives Italy 2025. 2025. Available online: https://powy.energy/en/news/evolution-news/electric-car-incentives-italy-2025/ (accessed on 15 February 2025).
  49. Alternative Fuels Observatory. European Union (EU27)—Infrastructure. 2025. Available online: https://alternative-fuels-observatory.ec.europa.eu/transport-mode/road/european-union-eu27/infrastructure (accessed on 24 January 2025).
  50. Alternative Fuels Observatory. Italy—Infrastructure. 2025. Available online: https://alternative-fuels-observatory.ec.europa.eu/transport-mode/road/italy/infrastructure (accessed on 24 January 2025).
  51. MOTUS-E. Dicembre 2024—Mercato Auto in Calo Nel 2024: È il Momento di una Nuova Politica Industriale per Rilanciare l’Automotive e l’Elettrico, 2024. Available online: https://www.motus-e.org/analisi-di-mercato/dicembre-2024-mercato-auto-in-calo-nel-2024-e-il-momento-di-una-nuova-politica-industriale-per-rilanciare-lautomotive-e-lelettrico/ (accessed on 24 January 2025).
  52. Piattaforma Unica Nazionale. Territory—IDR. 2025. Available online: https://www.piattaformaunicanazionale.it/territory-idr (accessed on 24 January 2025).
  53. European Alternative Fuels Observatory. Vehicles and Fleet—Romania. 2025. Available online: https://alternative-fuels-observatory.ec.europa.eu/transport-mode/road/romania/vehicles-and-fleet (accessed on 17 May 2025).
  54. European Alternative Fuels Observatory. Vehicles and Fleet—Latvia. 2025. Available online: https://alternative-fuels-observatory.ec.europa.eu/transport-mode/road/latvia/vehicles-and-fleet (accessed on 17 May 2025).
  55. European Alternative Fuels Observatory. Vehicles and Fleet—Austria. 2025. Available online: https://alternative-fuels-observatory.ec.europa.eu/transport-mode/road/austria/vehicles-and-fleet (accessed on 17 May 2025).
  56. European Alternative Fuels Observatory. Vehicles and Fleet—Spain. 2025. Available online: https://alternative-fuels-observatory.ec.europa.eu/transport-mode/road/spain/vehicles-and-fleet (accessed on 5 May 2025).
  57. European Alternative Fuels Observatory. Vehicles and Fleet—Belgium. 2025. Available online: https://alternative-fuels-observatory.ec.europa.eu/transport-mode/road/belgium/vehicles-and-fleet (accessed on 17 May 2025).
  58. European Alternative Fuels Observatory. Iceland—Road Transport Data. 2025. Available online: https://alternative-fuels-observatory.ec.europa.eu/transport-mode/road/iceland (accessed on 17 May 2025).
  59. European Alternative Fuels Observatory. Vehicles and Fleet—Poland. 2025. Available online: https://alternative-fuels-observatory.ec.europa.eu/transport-mode/road/poland/vehicles-and-fleet (accessed on 17 May 2025).
  60. European Alternative Fuels Observatory. Norway—Road Transport Data. 2025. Available online: https://alternative-fuels-observatory.ec.europa.eu/transport-mode/road/norway (accessed on 17 May 2025).
  61. Egbue, O.; Long, S. Barriers to widespread adoption of electric vehicles: An analysis of consumer attitudes and perceptions. Energy Policy 2012, 48, 717–729. [Google Scholar] [CrossRef]
  62. Panossian, N.; Muratori, M.; Palmintier, B.; Meintz, A.; Lipman, T.; Moffat, K. Challenges and opportunities of integrating electric vehicles in electricity distribution systems. Curr. Sustain. Energy Rep. 2022, 9, 27–40. [Google Scholar] [CrossRef]
  63. Gallina, A. The Transition to the Electric Car: Timing and Reasons. Università Ca’ Foscari Venezia, 2023. Available online: https://unitesi.unive.it/handle/20.500.14247/10694 (accessed on 17 May 2025).
  64. Senecal, P.K.; Leach, F. Diversity in transportation: Why a mix of propulsion technologies is the way forward for the future fleet. Results Eng. 2019, 4, 100060. [Google Scholar] [CrossRef]
  65. Berckmans, G.; Messagie, M.; Smekens, J.; Omar, N.; Vanhaverbeke, L.; Van Mierlo, J. Cost projection of state of the art lithium-ion batteries for electric vehicles up to 2030. Energies 2017, 10, 1314. [Google Scholar] [CrossRef]
  66. He, S.Y.; Kuo, Y.H.; Sun, K.K. The spatial planning of public electric vehicle charging infrastructure in a high-density city using a contextualised location-allocation model. Transp. Res. Part A Policy Pract. 2022, 160, 21–44. [Google Scholar] [CrossRef]
  67. Ma, R.; Huang, A.; Cui, H.; Yu, R.; Peng, X. Spatial heterogeneity analysis on distribution of intra-city public electric vehicle charging points based on multi-scale geographically weighted regression. Travel Behav. Soc. 2024, 35, 100725. [Google Scholar] [CrossRef]
  68. Olabi, A.G.; Abdelkareem, M.A.; Wilberforce, T.; Alkhalidi, A.; Salameh, T.; Abo-Khalil, A.G.; Hassan, M.M.; Sayed, E.T. Battery electric vehicles: Progress, power electronic converters, strength (S), weakness (W), opportunity (O), and threats (T). Int. J. Thermofluids 2022, 16, 100212. [Google Scholar] [CrossRef]
  69. Mayyas, A.; Steward, D.; Mann, M. The case for recycling: Overview and challenges in the material supply chain for automotive Li-ion batteries. Sustain. Mater. Technol. 2019, 19, e00087. [Google Scholar] [CrossRef]
  70. Goncearuc, A.; De Cauwer, C.; Sapountzoglou, N.; Van Kriekinge, G.; Huber, D.; Messagie, M.; Coosemans, T. The barriers to widespread adoption of vehicle-to-grid: A comprehensive review. Energy Rep. 2024, 12, 27–41. [Google Scholar] [CrossRef]
  71. Habib, K.; Hansdóttir, S.T.; Habib, H. Critical metals for electromobility: Global demand scenarios for passenger vehicles, 2015–2050. Resour. Conserv. Recycl. 2020, 154, 104603. [Google Scholar] [CrossRef]
  72. Shetty, D.K.; Shetty, S.; Raj Rodrigues, L.; Naik, N.; Maddodi, C.B.; Malarout, N.; Sooriyaperakasam, N. Barriers to widespread adoption of plug-in electric vehicles in emerging Asian markets: An analysis of consumer behavioral attitudes and perceptions. Cogent Eng. 2020, 7, 1796198. [Google Scholar] [CrossRef]
  73. D’Souza, A. Comparison: Real World Cost of Fueling EVs and ICE Vehicles; Anderson Economic Group, LLC: East Lansing, MI, USA, 2021. [Google Scholar]
  74. Srivastava, A.; Kumar, R.R.; Chakraborty, A.; Mateen, A.; Narayanamurthy, G. Design and selection of government policies for electric vehicles adoption: A global perspective. Transp. Res. Part E Logist. Transp. Rev. 2022, 161, 102726. [Google Scholar] [CrossRef]
  75. Gnanavendan, S.; Selvaraj, S.K.; Dev, S.J.; Mahato, K.K.; Swathish, R.S.; Sundaramali, G.; Accouche, O.; Azab, M. Challenges, solutions and future trends in EV-technology: A review. IEEE Access 2024, 12, 17242–17260. [Google Scholar] [CrossRef]
  76. Hasan, M.K.; Mahmud, M.; Habib, A.A.; Motakabber, S.; Islam, S. Review of electric vehicle energy storage and management system: Standards, issues, and challenges. J. Energy Storage 2021, 41, 102940. [Google Scholar] [CrossRef]
  77. Ntombela, M.; Musasa, K.; Moloi, K. A comprehensive review for battery electric vehicles (BEV) drive circuits technology, operations, and challenges. World Electr. Veh. J. 2023, 14, 195. [Google Scholar] [CrossRef]
  78. Ehsani, M.; Singh, K.V.; Bansal, H.O.; Mehrjardi, R.T. State of the art and trends in electric and hybrid electric vehicles. Proc. IEEE 2021, 109, 967–984. [Google Scholar] [CrossRef]
  79. Acharige, S.S.; Haque, M.E.; Arif, M.T.; Hosseinzadeh, N.; Hasan, K.N.; Oo, A.M.T. Review of electric vehicle charging technologies, standards, architectures, and converter configurations. IEEE Access 2023, 11, 41218–41255. [Google Scholar] [CrossRef]
  80. Thangavel, S.; Mohanraj, D.; Girijaprasanna, T.; Raju, S.; Dhanamjayulu, C.; Muyeen, S. A comprehensive review on electric vehicle: Battery management system, charging station, traction motors. IEEE Access 2023, 11, 20994–21019. [Google Scholar] [CrossRef]
  81. Sanguesa, J.A.; Torres-Sanz, V.; Garrido, P.; Martinez, F.J.; Marquez-Barja, J.M. A review on electric vehicles: Technologies and challenges. Smart Cities 2021, 4, 372–404. [Google Scholar] [CrossRef]
  82. Fesli, U.; Ozdemir, M.B. Electric vehicles: A comprehensive review of technologies, integration, adoption, and optimization. IEEE Access 2024, 12, 140908–140931. [Google Scholar] [CrossRef]
  83. Zaino, R.; Ahmed, V.; Alhammadi, A.M.; Alghoush, M. Electric vehicle adoption: A comprehensive systematic review of technological, environmental, organizational and policy impacts. World Electr. Veh. J. 2024, 15, 375. [Google Scholar] [CrossRef]
  84. Habib, S.; Khan, M.M.; Abbas, F.; Sang, L.; Shahid, M.U.; Tang, H. A comprehensive study of implemented international standards, technical challenges, impacts and prospects for electric vehicles. IEEE Access 2018, 6, 13866–13890. [Google Scholar] [CrossRef]
  85. Seo, J.; Vijayagopal, R.; Kim, N.; Rousseau, A.; Stutenberg, K. Effects of ambient temperature on electric vehicle range considering battery performance, powertrain efficiency, and HVAC load. Energy Convers. Manag. 2025, 326, 119493. [Google Scholar] [CrossRef]
  86. Hamada, A.T.; Orhan, M.F. An overview of regenerative braking systems. J. Energy Storage 2022, 52, 105033. [Google Scholar] [CrossRef]
  87. Kaleybar, H.J.; Brenna, M.; Foiadelli, F.; Dezza, F.C. Sustainable electrified transportation systems: Integration of EV and E-bus charging infrastructures to electric railway systems. In Electric Transportation Systems in Smart Power Grids; CRC Press: Boca Raton, FL, USA, 2023; pp. 237–267. [Google Scholar]
  88. Greene, D.L.; Kontou, E.; Borlaug, B.; Brooker, A.; Muratori, M. Public charging infrastructure for plug-in electric vehicles: What is it worth? Transp. Res. Part D Transp. Environ. 2020, 78, 102182. [Google Scholar] [CrossRef]
  89. Olabi, A.G.; Abbas, Q.; Shinde, P.A.; Abdelkareem, M.A. Rechargeable batteries: Technological advancement, challenges, current and emerging applications. Energy 2023, 266, 126408. [Google Scholar] [CrossRef]
  90. Chakraborty, P. Addressing the range anxiety of battery electric vehicles with charging en route. Sci. Rep. 2022, 12, 5588. [Google Scholar] [CrossRef]
  91. EV Database. Range of Full Electric Vehicles; EV Database: Amsterdam, The Netherlands, 2023. [Google Scholar]
  92. Tie, S.F.; Tan, C.W. A review of energy sources and energy management system in electric vehicles. Renew. Sustain. Energy Rev. 2013, 20, 82–102. [Google Scholar] [CrossRef]
  93. Un-Noor, F.; Padmanaban, S.; Mihet-Popa, L.; Mollah, M.N.; Hossain, E. A comprehensive study of key electric vehicle (EV) components, technologies, challenges, impacts, and future direction of development. Energies 2017, 10, 1217. [Google Scholar] [CrossRef]
  94. Toyota. 2024 RAV4; Toyota: Toyota City, Japan, 2024. [Google Scholar]
  95. Toyota. 2024 RAV4 Hybrid; Toyota: Toyota City, Japan, 2024. [Google Scholar]
  96. Toyota. 2024 RAV4 Prime; Toyota: Toyota City, Japan, 2024. [Google Scholar]
  97. Yang, C.; Zha, M.; Wang, W.; Liu, K.; Xiang, C. Efficient energy management strategy for hybrid electric vehicles/plug-in hybrid electric vehicles: Review and recent advances under intelligent transportation system. IET Intell. Transp. Syst. 2020, 14, 702–711. [Google Scholar] [CrossRef]
  98. Bai, Y.; Li, J.; He, H.; Dos Santos, R.C.; Yang, Q. Optimal design of a hybrid energy storage system in a plug-in hybrid electric vehicle for battery lifetime improvement. IEEE Access 2020, 8, 142148–142158. [Google Scholar] [CrossRef]
  99. Wikipedia Contributors. Toyota Prius Plug-In Hybrid. Available online: https://en.wikipedia.org/wiki/Toyota_Prius_Plug-in_Hybrid (accessed on 29 January 2025).
  100. Plötz, P.; Moll, C.; Bieker, G.; Mock, P. From lab-to-road: Real-world fuel consumption and CO2 emissions of plug-in hybrid electric vehicles. Environ. Res. Lett. 2021, 16, 054078. [Google Scholar] [CrossRef]
  101. Bhagwat, A.; Kumar Tiwari, R. Intermediate Temperature Fuel Cell Electric Vehicles: Simulation Study. Master’s Thesis, Chalmers University of Technology, Gothenburg, Sweden, 2023. [Google Scholar]
  102. Sorlei, I.S.; Bizon, N.; Thounthong, P.; Varlam, M.; Carcadea, E.; Culcer, M.; Iliescu, M.; Raceanu, M. Fuel cell electric vehicles—A brief review of current topologies and energy management strategies. Energies 2021, 14, 252. [Google Scholar] [CrossRef]
  103. Toyota Europe. Fuel Cell Electric Vehicles: The Toyota Mirai. 2023. Available online: https://www.toyota-europe.com/electrification/fcev (accessed on 15 March 2024).
  104. Xiao, B.; Ruan, J.; Yang, W.; Walker, P.D.; Zhang, N. A review of pivotal energy management strategies for extended range electric vehicles. Renew. Sustain. Energy Rev. 2021, 149, 111194. [Google Scholar] [CrossRef]
  105. Chen, J.; Wang, R.; Ding, R.; Luo, D. Matching design and numerical optimization of automotive thermoelectric generator system applied to range-extended electric vehicle. Appl. Energy 2024, 370, 123637. [Google Scholar] [CrossRef]
  106. Aguilar, P.; Groß, B. Battery electric vehicles and fuel cell electric vehicles: An analysis of alternative powertrains as a means to decarbonise the transport sector. Sustain. Energy Technol. Assess. 2022, 53, 102624. [Google Scholar]
  107. Popa, N.S.; Popa, C.; Mocanu, V.; Popa, L.M. State of the art in battery technology: Innovations and advancements. J. Mar. Technol. Environ. 2023, 2, 81–85. [Google Scholar] [CrossRef]
  108. Kalnaus, S.; Dudney, N.J.; Westover, A.S.; Herbert, E.; Hackney, S. Solid-state batteries: The critical role of mechanics. Science 2023, 381, eabg5998. [Google Scholar] [CrossRef]
  109. Dai, H.; Jiang, B.; Hu, X.; Lin, X.; Wei, X.; Pecht, M. Advanced battery management strategies for a sustainable energy future: Multilayer design concepts and research trends. Renew. Sustain. Energy Rev. 2021, 138, 110480. [Google Scholar] [CrossRef]
  110. Goriparthi, R.G. AI-driven predictive analytics for autonomous systems: A machine learning approach. Rev. Intel. Artif. Med. 2024, 15, 843–879. [Google Scholar]
  111. Khezri, R.; Steen, D.; Tuan, L.A. Willingness to participate in vehicle-to-everything (V2X) in Sweden, 2022—Using an electric vehicle’s battery for more than transport. Sustainability 2024, 16, 1792. [Google Scholar] [CrossRef]
  112. Guo, H.; Zhou, X.; Liu, Z. Advanced lightweight structural materials for automobiles: Properties, manipulation, and perspective. Sci. Adv. Mater. 2024, 16, 563–580. [Google Scholar] [CrossRef]
  113. Raimi, D.; Newell, R.G. Global Energy Outlook Comparison Methods: 2023 Update. 2024. Available online: https://www.iea.org/reports/world-energy-outlook-2023 (accessed on 15 February 2025).
  114. Khan, M.Y.A. Enhancing electric vehicle performance: A case study on advanced motor drive systems, integration, efficiency, and thermal management. Control Syst. Optim. Lett. 2025, 3, 20–27. [Google Scholar] [CrossRef]
  115. Zhao, W.; Gong, S.; Zhao, D.; Liu, F.; Sze, N.N.; Quddus, M.; Huang, H. Developing a new integrated advanced driver assistance system in a connected vehicle environment. Expert Syst. Appl. 2024, 238, 121733. [Google Scholar] [CrossRef]
  116. Tijani, H.O.; Tan, C.W.; Bashir, N. Techno-economic analysis of hybrid photovoltaic/diesel/battery off-grid system in northern Nigeria. J. Renew. Sustain. Energy 2014, 6, 033103. [Google Scholar] [CrossRef]
  117. Abualsaud, A.; Taghizadeh, F.; Deilami, S.; Hossain, J.; Lu, J. Smart electric vehicle charging system with flexible charging and voltage stabilisation service for Australian household network. In Proceedings of the 2023 IEEE International Conference on Energy Technologies for Future Grids (ETFG), Wollongong, Australia, 3–6 December 2023; IEEE: Piscataway, NJ, USA, 2023; pp. 1–6. [Google Scholar] [CrossRef]
  118. Lee, C.S.; Jeong, J.B.; Lee, B.H.; Hur, J. Study on 1.5 kW battery chargers for neighborhood electric vehicles. In Proceedings of the 2011 IEEE Vehicle Power and Propulsion Conference, Chicago, IL, USA, 6–9 September 2011; IEEE: Piscataway, NJ, USA, 2011; pp. 1–4. [Google Scholar] [CrossRef]
  119. Ullah, Z.; Hussain, I.; Mahrouch, A.; Ullah, K.; Asghar, R.; Ejaz, M.T.; Aziz, M.M.; Naqvi, S.F.M. A survey on enhancing grid flexibility through bidirectional interactive electric vehicle operations. Energy Rep. 2024, 11, 5149–5162. [Google Scholar] [CrossRef]
  120. Zhao, Z.; Lee, C.K. Dynamic pricing for EV charging stations: A deep reinforcement learning approach. IEEE Trans. Transp. Electrif. 2021, 8, 2456–2468. [Google Scholar] [CrossRef]
  121. Saner, C.B.; Trivedi, A.; Srinivasan, D. A cooperative hierarchical multi-agent system for EV charging scheduling in presence of multiple charging stations. IEEE Trans. Smart Grid 2022, 13, 2218–2233. [Google Scholar] [CrossRef]
  122. Zeng, B.; Dong, H.; Xu, F.; Zeng, M. Bilevel programming approach for optimal planning design of EV charging station. IEEE Trans. Ind. Appl. 2020, 56, 2314–2323. [Google Scholar] [CrossRef]
  123. Mokhtar, M.; Shaaban, M.F.; Zeineldin, H.; El-Saadany, E.F. A customer-centered smart charging strategy considering virtual charging system. IEEE Access 2021, 9, 117993–118004. [Google Scholar] [CrossRef]
  124. Márquez-Fernández, F.J.; Bischoff, J.; Domingues-Olavarría, G.; Alaküla, M. Assessment of future EV charging infrastructure scenarios for long-distance transport in Sweden. IEEE Trans. Transp. Electrif. 2021, 8, 615–626. [Google Scholar] [CrossRef]
  125. Venkatesan, R.; Dominic, A.S.; Balaji, C.; Narayanamoorthi, R.; Kotb, H.; ELrashidi, A.; Nureldeen, W. A comprehensive review on efficiency enhancement of wireless charging system for an electric vehicles application. IEEE Access 2024, 12, 46967–46994. [Google Scholar]
  126. Rabih, M.; Takruri, M.; Al-Hattab, M.; Alnuaimi, A.A.; Bin Thaleth, M.R. Wireless charging for electric vehicles: A survey and comprehensive guide. World Electr. Veh. J. 2024, 15, 118. [Google Scholar] [CrossRef]
  127. Xue, W. Summary of wireless charging technology for electric vehicles. Acad. J. Sci. Technol. 2024, 12, 253–256. [Google Scholar] [CrossRef]
  128. Wu, Y. A review of research related to wireless charging technology for electric vehicles. Sci. Technol. Eng. Chem. Environ. Prot. 2024, 1. [Google Scholar] [CrossRef]
  129. Amjad, M.; Farooq-i Azam, M.; Ni, Q.; Dong, M.; Ansari, E.A. Wireless charging systems for electric vehicles. Renew. Sustain. Energy Rev. 2022, 167, 112730. [Google Scholar] [CrossRef]
  130. Tan, Z.; Liu, F.; Chan, H.K.; Gao, H.O. Transportation systems management considering dynamic wireless charging electric vehicles: Review and prospects. Transp. Res. Part E Logist. Transp. Rev. 2022, 163, 102761. [Google Scholar] [CrossRef]
  131. Shi, K.; Tang, C.; Long, H.; Lv, X.; Wang, Z.; Li, X. Power fluctuation suppression method for EV dynamic wireless charging system based on integrated magnetic coupler. IEEE Trans. Power Electron. 2021, 37, 1118–1131. [Google Scholar] [CrossRef]
  132. Mubarak, M.; Üster, H.; Abdelghany, K.; Khodayar, M. Strategic network design and analysis for in-motion wireless charging of electric vehicles. Transp. Res. Part E Logist. Transp. Rev. 2021, 145, 102179. [Google Scholar] [CrossRef]
  133. Zhang, Y.; Wu, Y.; Shen, Z.; Pan, W.; Wang, H.; Dong, J.; Mao, X.; Liu, X. Integration of onboard charger and wireless charging system for electric vehicles with shared coupler, compensation, and rectifier. IEEE Trans. Ind. Electron. 2022, 70, 7511–7514. [Google Scholar] [CrossRef]
  134. Ramezani, A.; Narimani, M. Optimal design of fully integrated magnetic structure for wireless charging of electric vehicles. IEEE Trans. Transp. Electrif. 2021, 7, 2114–2127. [Google Scholar] [CrossRef]
  135. Tavakoli, R.; Dede, E.M.; Chou, C.; Pantic, Z. Cost-efficiency optimization of ground assemblies for dynamic wireless charging of electric vehicles. IEEE Trans. Transp. Electrif. 2021, 8, 734–751. [Google Scholar] [CrossRef]
  136. Olt, J.; Ihnatiev, Y.; Lillerand, T.; Virro, I. Development of a battery swapping and charging unit in servicing station for farming robot: A review. In Proceedings of the International Symposium on Farm Machinery and Processes Management in Sustainable Agriculture, Lublin, Poland, 12–14 June 2024; Springer: Berlin/Heidelberg, Germany, 2024; pp. 333–345. [Google Scholar]
  137. Murugan, M.; Marisamynathan, S. Investigating the potential of a battery swapping method at refuel stations for electric vehicle: A case study of India. Transp. Res. Part F Traffic Psychol. Behav. 2024, 107, 254–274. [Google Scholar] [CrossRef]
  138. Oak Ridge National Laboratory. Novel Technology Reaches 100-kW Wireless Power Transfer for Passenger Vehicle. 2023. Available online: https://www.ornl.gov/news/charging-commute (accessed on 15 February 2025).
  139. NIO. NIO’s New Battery Swap Station 4.0 Is Faster, Bigger and Automatic; NIO: Shanghai, China, 2023. [Google Scholar]
  140. Cui, D.; Wang, Z.; Liu, P.; Wang, S.; Dorrell, D.G.; Li, X.; Zhan, W. Operation optimization approaches of electric vehicle battery swapping and charging station: A literature review. Energy 2023, 263, 126095. [Google Scholar] [CrossRef]
  141. Zeng, B.; Luo, Y.; Liu, Y. Quantifying the contribution of EV battery swapping stations to the economic and reliability performance of future distribution system. Int. J. Electr. Power Energy Syst. 2022, 136, 107675. [Google Scholar] [CrossRef]
  142. Tarar, M.O.; Hassan, N.U.; Naqvi, I.H.; Pecht, M. Techno-economic framework for electric vehicle battery swapping stations. IEEE Trans. Transp. Electrif. 2023, 9, 4458–4473. [Google Scholar] [CrossRef]
  143. Zhang, N.; Zhang, Y.; Ran, L.; Liu, P.; Guo, Y. Robust location and sizing of electric vehicle battery swapping stations considering users’ choice behaviors. J. Energy Storage 2022, 55, 105561. [Google Scholar] [CrossRef]
  144. You, P.; Pang, J.Z.; Low, S.H. Online station assignment for electric vehicle battery swapping. IEEE Trans. Intell. Transp. Syst. 2020, 23, 3256–3267. [Google Scholar] [CrossRef]
  145. Shalaby, A.A.; Abdeltawab, H.; Mohamed, Y.A.R.I. Model-free dynamic operations management for EV battery swapping stations: A deep reinforcement learning approach. IEEE Trans. Intell. Transp. Syst. 2023, 24, 8371–8385. [Google Scholar] [CrossRef]
  146. Dixon, J.; Bell, K. Electric vehicles: Battery capacity, charger power, access to charging and the impacts on distribution networks. ETransportation 2020, 4, 100059. [Google Scholar] [CrossRef]
  147. Wikipedia Contributors. IEC 61851 Standard for Electric Vehicle Conductive Charging Systems. *Wikipedia, The Free Encyclopedia*, 2017. Available online: https://en.wikipedia.org/w/index.php?title=IEC_61851&oldid=1249297268 (accessed on 22 September 2024).
  148. Wikipedia Contributors. IEC 63119 Protocol for Information Exchange for Electric Vehicle Charging Roaming Services. *Wikipedia, The Free Encyclopedia*, 2019. Available online: https://en.wikipedia.org/wiki/IEC_63119 (accessed on 22 September 2024).
  149. Wikipedia Contributors. IEC 62196: Plugs, Socket-Outlets, Vehicle Connectors and Vehicle Inlets. *Wikipedia, The Free Encyclopedia*, 2003. Available online: https://en.wikipedia.org/wiki/IEC_62196 (accessed on 22 September 2024).
  150. Wikipedia Contributors. IEC 63110: Protocol for the Management of Electric Vehicles Charging and Discharging Infrastructures. *Wikipedia, The Free Encyclopedia*. Available online: https://en.wikipedia.org/wiki/IEC_63110 (accessed on 22 September 2024).
  151. International Electrotechnical Commission. Protocol for Management of Electric Vehicles Charging and Discharging Infrastructures—Part 1: Basic Definitions, Use Cases and Architectures; International Electrotechnical Commission: Geneva, Switzerland, 2022. [Google Scholar]
  152. Kumar, G.; Mikkili, S. Advancements in EV international standards: Charging, safety and grid integration with challenges and impacts. Int. J. Green Energy 2024, 21, 2672–2698. [Google Scholar] [CrossRef]
  153. Wikipedia Contributors. Society of Automotive Engineers J1772. *Wikipedia, The Free Encyclopedia*. 2009. Available online: https://en.wikipedia.org/wiki/SAE_J1772 (accessed on 31 May 2025).
  154. SAE International. J1772 Electric Vehicle and Plug-In Hybrid Electric Vehicle Conductive Charge Couple; Online; SAE International: Warrendale, PA, USA, 2024. [Google Scholar]
  155. SAE International. J2836: Instructions for Using Plug-In Electric Vehicle (PEV) Communications, Interoperability and Security Documents; SAE International: Warrendale, PA, USA, 2018. [Google Scholar]
  156. SAE International. J1766: Recommended Practice for Electric, Fuel Cell and Hybrid Electric Vehicle Crash Integrity Testing; SAE International: Warrendale, PA, USA, 2014. [Google Scholar]
  157. SAE International. J2344: Guidelines for Electric Vehicle Safety; SAE International: Warrendale, PA, USA, 2020. [Google Scholar]
  158. SAE International. J2578: Recommended Practice for General Fuel Cell Vehicle Safety; SAE International: Warrendale, PA, USA, 2023. [Google Scholar]
  159. SAE International. SAE J3400: North American Charging System (NACS) for Electric Vehicles; SAE International: Warrendale, PA, USA, 2024. [Google Scholar]
  160. Wikipedia Contributors. GB/T Charging Standard. *Wikipedia, The Free Encyclopedia*, 2015. Available online: https://en.wikipedia.org/wiki/GB/T_charging_standard#cite_note-1 (accessed on 31 November 2024).
  161. Wikipedia Contributors. Standardization Administration of China (SAC). *Wikipedia, The Free Encyclopedia*, 2001. Available online: https://en.wikipedia.org/wiki/Standardization_Administration_of_China (accessed on 31 May 2025).
  162. GB/T 27930; Digital Communication Protocols Between Off-Board Conductive Charger and Electric Vehicle. State Administration for Market Regulation: Beijing, China, 2023.
  163. GB/T 19596; Terminology of Electric Vehicles. State Administration for Market Regulation: Beijing, China, 2017.
  164. GB/T 37293; Urban Public Facilities—Specification for Operation Management and Service of Electric Vehicle Charging/Battery Swap Infrastructure. State Administration for Market Regulation: Beijing, China, 2019.
  165. Yilmaz, M.; Krein, P.T. Review of battery charger topologies, charging power levels, and infrastructure for plug-in electric and hybrid vehicles. IEEE Trans. Power Electron. 2012, 28, 2151–2169. [Google Scholar] [CrossRef]
  166. SAE International; International Electrotechnical Commission. IEC 61851 Conform Charging: Accident or Purpose; SAE International: Warrendale, PA, USA, 2023. [Google Scholar]
  167. International Electrotechnical Commission. Electric Vehicle Wireless Power Transfer (WPT) Systems—Part 1: General Requirements; International Electrotechnical Commission: Geneva, Switzerland, 2020. [Google Scholar]
  168. International Electrotechnical Commission. Electric Vehicle Wireless Power Transfer (WPT) Systems—Part 2: Specific Requirements for MF-WPT System Communication and Activities; International Electrotechnical Commission: Geneva, Switzerland, 2023. [Google Scholar]
  169. International Electrotechnical Commission. Electric Vehicle Conductive Charging System—Part 1: General Requirements; International Electrotechnical Commission: Geneva, Switzerland, 2017. [Google Scholar]
  170. International Electrotechnical Commission. Electric Vehicle Conductive Charging System—Part 21-1: Electric Vehicle on-Board Charger EMC Requirements for Conductive Connection to AC/DC Supply; International Electrotechnical Commission: Geneva, Switzerland, 2017. [Google Scholar]
  171. International Electrotechnical Commission. Electric Vehicle Conductive Charging System—Part 21-2: Electric Vehicle Requirements for Conductive Connection to an AC/DC Supply—EMC Requirements for Off-Board Electric Vehicle Charging Systems; International Electrotechnical Commission: Geneva, Switzerland, 2018. [Google Scholar]
  172. International Electrotechnical Commission. Electric Vehicle Conductive Charging System—Part 23: DC Electric Vehicle Supply Equipment; International Electrotechnical Commission: Geneva, Switzerland, 2023. [Google Scholar]
  173. International Electrotechnical Commission. Electric Vehicle Conductive Charging System—Part 24: Digital Communication Between a DC EV Supply Equipment and an Electric Vehicle for Control of DC Charging; International Electrotechnical Commission: Geneva, Switzerland, 2023. [Google Scholar]
  174. International Electrotechnical Commission. Plugs, Socket-Outlets, Vehicle Connectors and Vehicle Inlets—Conductive Charging of Electric Vehicles—Part 1: General Requirements; International Electrotechnical Commission: Geneva, Switzerland, 2022. [Google Scholar]
  175. International Electrotechnical Commission. Plugs, Socket-Outlets, Vehicle Connectors and Vehicle Inlets—Conductive Charging of Electric Vehicles—Part 2: Dimensional Compatibility Requirements for AC Pin and Contact-Tube Accessories; International Electrotechnical Commission: Geneva, Switzerland, 2022. [Google Scholar]
  176. International Electrotechnical Commission. Plugs, Socket-Outlets, Vehicle Connectors and Vehicle Inlets—Conductive Charging of Electric Vehicles—Part 3: Dimensional Compatibility Requirements for DC and AC/DC Pin and Contact-Tube Vehicle Couplers; International Electrotechnical Commission: Geneva, Switzerland, 2022. [Google Scholar]
  177. Zahedmanesh, A.; Sutanto, D.; Muttaqi, K.M. Analyzing the impacts of charging plug-in electric vehicles in low voltage distribution networks: A case study of utilization of droop charging control system based on the SAE J1772 Standard. In Proceedings of the 2017 Australasian Universities Power Engineering Conference (AUPEC), Melbourne, Australia, 19–22 November 2017; IEEE: Piscataway, NJ, USA, 2017; pp. 1–6. [Google Scholar] [CrossRef]
  178. Taghizad-Tavana, K.; Alizadeh, A.A.; Ghanbari-Ghalehjoughi, M.; Nojavan, S. A comprehensive review of electric vehicles in energy systems: Integration with renewable energy sources, charging levels, different types, and standards. Energies 2023, 16, 630. [Google Scholar] [CrossRef]
  179. Shareef, H.; Islam, M.M.; Mohamed, A. A review of the state-of-the-art charging technologies, placement methodologies, and impacts of electric vehicles. Renew. Sustain. Energy Rev. 2016, 64, 403–420. [Google Scholar] [CrossRef]
  180. Hariri, A.O.; El Hariri, M.; Youssef, T.; Mohammed, O.A. A bilateral decision support platform for public charging of connected electric vehicles. IEEE Trans. Veh. Technol. 2018, 68, 129–140. [Google Scholar] [CrossRef]
  181. Toyota. Toyota Prius Plug-in Hybrid. 2023. Available online: https://www.toyota.com/priusprime (accessed on 15 March 2024).
  182. SAE International. J2954: Wireless Power Transfer for Light-Duty Plug-In/Electric Vehicles and Alignment Methodology; SAE International: Warrendale, PA, USA, 2024. [Google Scholar]
  183. Mitikiri, S.B.; Babu, K.; Dwivedi, D.; Srinivas, V.L.; Chakraborty, P.; Yemula, P.K.; Pal, M. Modelling of the electric vehicle charging infrastructure as cyber physical power systems: A review on components, standards, vulnerabilities and attacks. arXiv 2023, arXiv:2311.08656. [Google Scholar]
  184. Khaligh, A.; D’Antonio, M. Global trends in high-power on-board chargers for electric vehicles. IEEE Trans. Veh. Technol. 2019, 68, 3306–3324. [Google Scholar] [CrossRef]
  185. von Bonin, M.; Dörre, E.; Al-Khzouz, H.; Braun, M.; Zhou, X. Impact of dynamic electricity tariff and home PV system incentives on electric vehicle charging behavior: Study on potential grid implications and economic effects for households. Energies 2022, 15, 1079. [Google Scholar] [CrossRef]
  186. SAE International. J1773 Electric Vehicle Inductively Coupled Charging; Online; SAE International: Warrendale, PA, USA, 2014. [Google Scholar]
  187. SAE J2847-1; Communication for Smart Charging of Plug-In Electric Vehicles Using Smart Energy Profile 2.0. SAE International: Warrendale, PA, USA, 2019.
  188. SAE J2847-2; Communication Between Plug-In Vehicles and off-Board DC Chargers. SAE International: Warrendale, PA, USA, 2023.
  189. SAE J2847-3; Communication for Plug-In Vehicles as a Distributed Energy Source. SAE International: Warrendale, PA, USA, 2023.
  190. SAE J2836-1; Use Cases for Communication Between Plug-In Vehicles and the Utility Grid. SAE International: Warrendale, PA, USA, 2019.
  191. SAE J2836-3; Use Cases for Plug-In Vehicle Communication as a Distributed Energy Resource. SAE International: Warrendale, PA, USA, 2024.
  192. SAE J2836-4; Use Cases for Diagnostic Communication for Plug-In Electric Vehicles. SAE International: Warrendale, PA, USA, 2021.
  193. SAE J2836-5; Use Cases for Customer Communication for Plug-In Electric Vehicles. SAE International: Warrendale, PA, USA, 2021.
  194. SAE J2836-6; Use Cases for Wireless Charging Communication for Plug-In Electric Vehicles. SAE International: Warrendale, PA, USA, 2021.
  195. SAE J2931-1; Digital Communications for Plug-In Electric Vehicles. SAE International: Warrendale, PA, USA, 2023.
  196. SAE J2931-4; Broadband PLC Communication for Plug-In Electric Vehicles. SAE International: Warrendale, PA, USA, 2023.
  197. GB/T 20234.1-2023; Connection Set for Conductive Charging of Electric Vehicles—Part 1: General Requirements. Standardization Administration Committee: Beijing, China, 2023.
  198. GBT20234.2-2015e; Connection Set for Conductive Charging of Electric Vehicles—Part 2: AC Charging Coupler. Standardization Administration Committee: Beijing, China, 2015.
  199. GBT20234.3-2023; Connection Set for Conductive Charging of Electric Vehicles—Part 3: DC Charging Coupler. Standardization Administration Committee: Beijing, China, 2023.
  200. GBT18487.1-2023; Electric Vehicle Conductive Charging System—Part 1: General Requirements. Standardization Administration Committee: Beijing, China, 2023.
  201. GBT18487.2-2017; Electric Vehicle Conductive Charging System—Part 2: EMC Requirements for Off-Board Electric Vehicle Supply Equipment. Standardization Administration Committee: Beijing, China, 2017.
  202. GB/T 18487.3-2001; Electric Vehicle Conductive Charging System AC/DC Electric Vehicle Charging Station. Standardization Administration Committee: Beijing, China, 2001.
  203. Maxwell, J. Why Wireless EV Charging is Superior to Plugged EV Charging. 2024. Available online: https://www.inductev.com/blog/why-wireless-ev-charging-is-superior-to-plugged-ev-charging-rmf44 (accessed on 3 April 2025).
  204. Morris, C. SAE International Publishes New Standard for Wireless Light-Duty EV Charging. Available online: https://chargedevs.com/newswire/sae-international-publishes-new-standard-for-wireless-light-duty-ev-charging/ (accessed on 3 April 2025).
  205. IEC 61980-3:2022; Electric Vehicle Wireless Power Transfer (WPT) Systems—Part 3: Specific Requirements for Magnetic Field Wireless Power Transfer Systems. International Electrotechnical Commission: Geneva, Switzerland, 2022.
  206. SAE J2847/6_202009; Communication for Wireless Power Transfer Between Light-Duty Plug-in Electric Vehicles and Wireless EV Charging Stations. SAE International: Warrendale, PA, USA, 2020.
  207. SAE J2931/6_202208; Signaling Communication for Wirelessly Charged Electric Vehicles. SAE International: Warrendale, PA, USA, 2022.
  208. GB/T 38775.1-2020; Wireless Charging System for Electric Vehicles Part 1: General Requirements. Standardization Administration Committee: Beijing, China, 2020.
  209. GB/T 38775.2-2020; Wireless Charging System for Electric Vehicles Part 2: Communication Protocol Between On-Board Charger and Wireless Charging Device. Standardization Administration Committee: Beijing, China, 2020.
  210. GB/T 38775.3-2020; Wireless Charging System for Electric Vehicles Part 3: Special Requirements. Standardization Administration Committee: Beijing, China, 2020.
  211. GB/T 38775.4-2020; Wireless Charging System for Electric Vehicles Part 4: Electromagnetic Environment Limits and Test Methods. Standardization Administration Committee: Beijing, China, 2020.
  212. GB/T 38775.5-2021; Wireless Charging System for Electric Vehicles Part 5: Electromagnetic Compatibility Requirements and Test Methods. Standardization Administration Committee: Beijing, China, 2021.
  213. GB/T 38775.6-2021; Electric Vehicle Wireless Charging System Part 6: Interoperability Requirements and Test Ground Side. Standardization Administration Committee: Beijing, China, 2021.
  214. Smart Grids: Advanced Technologies and Solutions, 2nd ed.; CRC Press: Boca Raton, FL, USA, 2017. [CrossRef]
  215. Ashfaq, M.; Butt, O.; Selvaraj, J.; Rahim, N. Assessment of electric vehicle charging infrastructure and its impact on the electric grid: A review. Int. J. Green Energy 2021, 18, 657–686. [Google Scholar] [CrossRef]
  216. Wikipedia Contributors. CHAdeMO—Wikipedia, The Free Encyclopedia. 2025. Available online: https://en.wikipedia.org/wiki/CHAdeMO (accessed on 29 January 2025).
  217. Bahrami, A. EV charging definitions, modes, levels, communication protocols and applied standards. Changes 2020, 1, 1–10. [Google Scholar]
  218. European Automobile Manufacturers’ Association. Overview—Electric Vehicles: Tax Benefits & Purchase Incentives in the European Union (2022). 2022. Available online: https://www.acea.auto/fact/overview-electric-vehicles-tax-benefits-purchase-incentives-in-the-european-union-2022/ (accessed on 15 May 2025).
  219. European Automobile Manufacturers’ Association. Electric Cars: Tax Benefits & Purchase Incentives in the EU in 2023. 2023. Available online: https://www.acea.auto/fact/electric-cars-tax-benefits-purchase-incentives-2023/ (accessed on 15 May 2025).
  220. European Automobile Manufacturers’ Association. Electric Cars: Tax Benefits and Incentives (2025). 2025. Available online: https://www.acea.auto/fact/electric-cars-tax-benefits-and-incentives-2025/ (accessed on 15 May 2025).
Figure 1. Global CO2 emissions (2019–2023).
Batteries 11 00229 g001
Figure 2. PRISMA diagram of systematic literature review.
Batteries 11 00229 g002
Figure 3. Schematic diagram of the electric vehicle.
Batteries 11 00229 g003
Figure 4. Global electric vehicles (EVs) sales (2018–2024).
Batteries 11 00229 g004
Figure 5. Europe EV market: (a) Total EV sales (2020–2024). (b) Monthly BEV sales (2023–2024). (c) Monthly PHEV sales (2023–2024).
Batteries 11 00229 g005
Figure 6. Total (BEV + PHEV) sales of European countries 2022–2024.
Batteries 11 00229 g006
Figure 7. Energy consumption (Wh/km) of European EV models.
Batteries 11 00229 g007
Figure 8. On-board charger (OBC) power ratings of European EV models.
Batteries 11 00229 g008
Figure 9. Italy EV market: (a) Total EV sales (2020–2024). (b) Monthly BEV sales (2023–2024). (c) Monthly PHEV sales (2023–2024).
Batteries 11 00229 g009
Figure 10. Charging infrastructure of Europe (2020–2024): (a) Total AC and DC charging points, (b) AC charging points, (c) DC charging points.
Batteries 11 00229 g010
Figure 11. Charging infrastructure of Italy (2020–2024): (a) Total AC and DC charging points, (b) AC charging points, (c) DC charging points.
Batteries 11 00229 g011
Figure 12. Monthly distribution of Italy charging points.
Batteries 11 00229 g012
Figure 13. Charging infrastructure of Italy by Regions: (a) public and private charging points, (b) AC charging points, (c) DC charging points.
Batteries 11 00229 g013
Figure 14. Comparative analysis of EV infrastructure adequacy and sales trends in Europe (2023–2024).
Batteries 11 00229 g014
Figure 15. Barriers to EV adoption.
Batteries 11 00229 g015
Figure 16. Main parts of the electric vehicle.
Batteries 11 00229 g016
Figure 17. Battery electric vehicle (BEV).
Batteries 11 00229 g017
Figure 18. (a) Hybrid electric vehicle (HEV), (b) plug-in hybrid electric vehicle (PHEV).
Batteries 11 00229 g018
Figure 19. (a) Fuel Cell Electric Vehicle (FCEV). (b) Extended Range Electric Vehicle (ER-EV).
Batteries 11 00229 g019
Figure 20. Classification of electric vehicle battery charging technology.
Batteries 11 00229 g020
Figure 21. (a) On-board charging. (b) Off-board charging.
Batteries 11 00229 g021
Figure 22. (a) Uni-directional power flow. (b) Bi-directional power flow.
Batteries 11 00229 g022
Figure 23. Wireless power transfer (WPT) charging system.
Batteries 11 00229 g023
Figure 24. Battery swapping (BS) charging.
Batteries 11 00229 g024
Figure 25. Charging Modes (a) Mode 01 (b) Mode 02 (c) Mode 03 (d) Mode 04.
Batteries 11 00229 g025
Table 1. Review of studies conducted on electric vehicle (EV) technology.
Focus AreaStrengthsLimitations
Lithium-ion batteries for EVs: Energy management challenges [76].Comprehensive review of challenges, issues, and research directions in EV energy management.Limited discussion on battery safety, recycling, and environmental impacts.
Replacing ICE vehicles with EVs: Battery technologies and efficiency [77].Broad examination of EV drive circuits, battery types, and motor drive.Insufficient coverage of autonomous driving technologies and limited analysis of EV adoption impact on energy infrastructure.
EVs and HEVs optimization: Traction motors, converters, and energy management [78].Focused on advancements in traction motor drives, reliability, and converter evaluation.Minimal discussion of emerging battery technologies.
EV charging technologies, standards, and grid integration [79].Covers on-board/off-board chargers, converter configurations, and future challenges.Limited exploration of advancements in EV battery technologies and grid integration challenges.
Environmental benefits of EVs: GHG emissions reduction [10].Highlights role of EVs in reducing carbon footprint and promoting sustainable mobility.Focuses primarily on emissions without addressing EV components and configurations.
Battery Management Systems: Traction motors, charging stations [80].Recommends optimal battery and motor technologies: Identifies EV drawbacks.Lacks detailed discussion on control techniques and comparative analyses between EVs and HEVs.
Global EV market: Battery technology trends, charging methods [81].Discusses evolution from lead–acid to Li-ion batteries and various charging techniques.Limited insight into renewable energy integration for charging and economic implications of widespread EV adoption.
Battery technologies: EV energy management, grid integration [82].Addresses challenges in EV-grid integration.A cursory examination of consumer behavior and market dynamics is crucial for adoption patterns.
EV impacts: Technological, environmental, and policy aspects [83].Emphasizes advancements, environmental benefits, and policy frameworks.Lacks thorough investigation of long-term battery material sustainability and lifecycle environmental impacts.
Techniques and prospects of EVs: Sustainable development [84].Highlights EV viability and efficiency in achieving clean environments.Lacks detailed exploration of economic implications and renewable energy integration for EV charging.
Table 2. Overview of various electric vehicle (EV) types and their characteristics.
TechnologyDescriptionAdvantagesDisadvantages
BEVs Rechargeable batteries are the only source of electric power.  
  • Zero emissions.
  • Lower operating and fuel costs.
  • Quiet operation.
  • High manufacturing costs.
  • Limited range compared to ICE vehicles,
  • Charging infrastructure dependency.
HEVs  Combines an EM and battery with a traditional IC engine.  
  • Greater fuel efficiency compared to gasoline
  • Reduced emissions.
  • Lower fuel costs
  • Limited electric-only driving range.
  • Higher manufacturing and maintenance costs.
PHEVsCombines a rechargeable battery that may be charged by electric power with an ICE and an EM with an IC engine.
  • Extended battery range compared to HEVs.
  • Low fuel consumption.
  • Rechargeable battery.
  • Limited charging infrastructure.
  • Higher initial cost compared to traditional vehicles.
FCEVs  Uses hydrogen to power an EM, generating energy through a chemical reaction between hydrogen and oxygen and a Battery to recharge. 
  • Long driving range.
  • High efficiency.
  • Zero harmful emissions.
  • Expensive production and fueling systems.
  • Limited availability of hydrogen fueling stations.
ER-EVs Equipped with an EM powered by a battery and an auxiliary power unit (typically a small gasoline engine) that recharges the battery when depleted.  
  • Eliminates range anxiety with a backup gasoline generator.
  • Better battery performance for short trips.
  • Reduced fuel dependency.
  • Still relies partially on fossil fuels.
  • A more complex system than BEVs.
  • Higher initial cost.
Table 3. Emerging research and development areas in EVs.
CategoryAdvancementDescription
Battery Innovations 
  • Solid State Batteries
  • Recycling and second-life battery
  • Alternative Chemistries
  • Improved safety, higher energy density, and faster charging capabilities.
  • Recovery of materials and repurposing of used batteries for energy storage.
  • Exploration of sodium-ion and lithium–sulfur batteries for cost efficiency.
Autonomous and connected EVs  
  • Integration with AI
  • V2X Communication
  • Autonomous technologies improve safety, efficiency, and energy optimization.
  • Enables EVs to interact with infrastructure, other vehicles, and the grid
Lightweight Materials 
  • Advanced Lightweight Materials
  • Use carbon fiber, aluminum alloys, and high-strength steel to reduce weight.
Charging Infrastructure 
  • Ultra-Fast Chargers
  • Smart Charging
  • Bidirectional Charging (V2G)
  • Delivers a significant charge within minutes, minimizing downtime for drivers.
  • Integration with grids for energy optimization and alignment with renewables.
  • Allows EVs to supply energy back to the grid, supporting renewable energy goals.
Electric Powertrain 
  • Electric motors
  • Regenerative braking
  • Thermal management
  • Compact and powerful motors boost performance.
  • Regenerative braking saves energy.
  • Thermal technologies improve battery capacity in any environment.
Software and AI  
  • Smart systems
  • ADAS
  • Autonomous driving technology
  • EVs have advanced route planning and monitoring.
  • Enhanced driver assistance increases safety.
  • Autonomous technology adds convenience.
Sustainability 
  • Sustainable materials
  • Environmentally friendly production
  • Recycling schemes
  • Using sustainable materials and green production cuts emissions, while battery recycling eliminates waste and reuses important metals.
Table 4. Key differences between on-board and off-board electric vehicle charging systems.
On-Board ChargerOff-Board Charger
InstallationSimpler, in-car configurationAn external, more intricate configuration
CostLess ExpensiveMore Expensive
SpaceSpace for vehicles is necessaryThere is no need for a vehicle spot
EfficiencyLessMore
MaintenanceLess frequent but difficultMore frequent but easier
Pros:  
  • Simple installing and maintaining
  • More secure as it is integrated into the car.
  • Convenient: No extra wires or cords are required.
  • Less expensive than off-board chargers.
  • Adaptable, capable of charging several batteries at once.
  • Usable and portable anywhere.
  • More potent, allowing for quicker charging times.
Cons:  
  • Difficult to replace or access in the event of problems.
  • Only able to charge one battery at a time; less adaptable.
  • More costly than on-board chargers.
  • less secure.
  • Necessitates external connections or cords, which might be annoying
Table 5. Key differences between unidirectional and bidirectional electric vehicle charging systems.
Power FlowProscons
Unidirectional Charger One-way flow of electric power 
  • Reduced complexity of the circuit.
  • Small in size and reduced volume.
  • Long-lasting and very dependable battery.
  • The G2V function does not support item The smart grid function.
  • Conduction losses in the PFC converter.
  • V2G methods aren’t feasible.
Bidirectional Charger Two-way communication and flow of electric power  
  • Low input supply harmonics
  • Makes G2V, V2G, V2L, and V2V possible.
  • Adverse effect on the power density of the charger.
  • Low battery life and repeated cycles of charging and draining.
  • Problems with circuit complexity and dependability.
  • The charger’s volume increases.
Table 6. Summary of studies concluded on conductive charging systems.
Key AreaFocus
Adaptive pricing and user contentmentUsing methods like fuzzy-based response indicators and deep reinforcement learning to maximize charging station economics and customer happiness [120].
Effective scheduling and security of the systemRecommending mechanisms to reduce energy consumption and operational expenses, schedule EV charging effectively, and maintain system security [121].
Integration of renewable energy and grid stabilityPlanning EV charging stations as efficiently as possible while emphasizing renewable energy sources and improving grid reliability [122].
Incentive-based and behavioral strategiesIntroducing novel price-incentive and behavioral tactics to improve EV routing according to driver priorities and charging station usage [123].
Innovations in technology and operationsInvestigating cutting-edge techniques to control power distribution and infrastructure requirements, such as agent-based simulations and game-theory-based systems [124].
Table 7. Summary of studies concluded on wireless power transfer (WPT) charging systems.
Key AreaFocus
Control systems and comparative analysesReview of wireless charging techniques with a focus on control systems for dynamic charging efficiency, contrasting capacitive and inductive power transfer [129].
Dynamic wireless power transfer (DWPT) charging system integrationExamine WPT lane design, its effects on EV energy usage and traffic management, and the best places and costs for DWPT links. Pay particular attention to DWPT in transportation networks [130].
Improving the efficiency of wireless chargingPutting forth techniques like mesh-based tactics and multi-coupling to reduce power fluctuations and increase the efficiency of power transfer in dynamic wireless charging systems [131].
Improving the transmission of powerAddressing in-motion wireless charging network architecture and implementing fixes like magnetic couplers to get consistent output power and economical deployment [132].
Optimization of costsResearching cost and efficiency optimization techniques for ground assembly, as well as creating integrated systems and designs to minimize the size, complexity, and expense of wireless EV charging systems while preserving efficiency [133,134,135].
Table 8. Summary of studies concluded on battery swapping (BS) charging systems.
Key AreaFocus
Optimization of OperationsReviewing operating modes, recognizing obstacles, and proposing future research paths are some new strategies and decision-making scenarios that will help BSS operate more efficiently [140].
Impact on the Economy and ReliabilityExamining how BSS contributes to power distribution dependability and economic sustainability, with a focus on V2G interactions and improved network performance [141,142].
Energy Management and ResilienceExamining how to integrate BSS into residential energy systems to improve energy resilience, manage the usage of renewable energy sources, and lower expenses in a range of grid scenarios [143].
User Behavior and ChoiceAnalyzing how EV owners’ preferences affect BSS placement, size, and functionality, including using predictive modeling of user behavior for planning and operation [144].
Models and Innovations in TechnologyIntroducing cutting-edge models and techniques to improve BSS efficacy and efficiency, such as deep reinforcement learning and integration with power generation scheduling [145].
Table 9. Characteristics of different EV charging systems.
FeaturesConductive ChargingWireless Power Transfer (WPT) ChargingBattery Swapping (BS) Charging
Technology typePlug-in cable connectionInductive or resonant magnetic fieldBattery replacement
ConvenienceModerate (requires manual connection)High (no cables)Very High (quick battery exchange)
EfficiencyHighModerate (Lower than conductive)Moderate (centralized charging control)
Infrastructure CostModerateHighVery High
Charging TimeFast (with fast chargers)Moderate to slowVery fast
scalabilityHighLow to moderateModerate
ApplicationUrban area, parking lots, public areas, highwaysUrban areasCommercial fleets, high-use scenarios
ChallengesCable wear, user dependency, station availabilityEnergy loss, slower speed, Alignment issuesStandardization, battery management, cost
Table 10. Comparison of conductive, wireless power transfer (WPT) and battery swapping (BS) charging technologies.
Type of ChargingAdvantagesDisadvantagesSolutions
Conductive Charging System 
  • Efficiency and fast charging speed
  • Established infrastructure
  • Cheaper than WPT system
  • Widely adopted
  • Physical connection required
  • Wear and tear of connectors
  • Use durable connectors
  • Improve connector design for longevity
Wireless Power Transfer (WPT) Charging System  
  • No physical connection Convenient
  • Safer in adverse weather
  • Expensive infrastructure
  • Lower efficiency compared to conductive charging
  • Research to improve efficiency
  • Incentives for infrastructure development
Battery swapping (BS) charging system  
  • Fast battery replacement
  • Reduces downtime
  • Standardized battery sizes possible
  • Requires battery standardization
  • High infrastructure cost
  • Develop battery standardization policies
  • Improve battery management systems
Table 11. Standard list of regulatory bodies related to conductive charging.
OrganizationStandardDescription
International Electrotechnical Commission (IEC) (EU, Australia, Asia) [147,148,149,150,151]IEC 61851
Table 12
Guidelines releted to conductive charging systems of EVs.
IEC 62196
Table 13
Guidelines about Plugs, sockets, and connection for conductive EV charging.
IEC 63110Guidelines about the process for managing the infrastructure used for EV charging and discharging.
IEC 63119Guidelines related to information-sharing methods for EV charging and roaming services.
Society of Automotive Engineers (SAE) (US, North American) [152,153,154,155,156,157,158,159]SAE J1772Standards for electrical connections used in conductive charging of EV/PHEV.
SAE J2293Standards Covers the electric energy transfer system architecture for both AC and DC charging.
SAE J2847
Table 14
Standards regarding off-board DC chargers, the utility grid, and EVs communication protocols.
SAE J2836
Table 15
Standards regarding V2G, charging, and other communication between EVs and the grid.
SAE J2931
Table 16
Standards for EV communication protocols, emphasizing safe and dependable charging communication.
SAE J3400Standards for technical requirements for North American Charging System (NACS), supporting AC and DC fast charging, ensuring compatibility across charging stations.
Standardization Administration of China (SAC) [160,161,162,163,164]GB/T 20234 Table 17Interface for CCSs of EVs, including connectors and charging cables.
GB/T 18487 Table 18Guidelines for general specifications and security precautions for EV CCSs.
GB/T 27930Protocols for information sharing during charging between the charging station and the EV’s Battery Management System (BMS), primarily for DC fast charging.
GB/T 19596Standardized glossary of EV-related terms in Chinese regulations.
Table 17. Series of GB/T 20234 standard for EV charging interfaces in China (AC/DC plugs, sockets, connectors, and vehicle inlets) [197,198,199].
SeriesExplanation
GB/T 20234-1General requirements: general definitions, structure, and testing conditions for connectors used in CCS of EVs.
GB/T 20234-2AC charging coupler: Specifies the interface for AC charging, including the plug, socket-outlet, vehicle coupler, and vehicle inlet.
GB/T 20234-3DC charging coupler: Specifies the interface for DC charging, including high-power connectors and vehicle inlets designed for fast charging.
Table 18. Series of GB/T 18487 standard for general specifications and safety requirements of EV CCSs in China [200,201,202].
SeriesExplanation
GB/T 18487-1General requirements: Specifies the general characteristics of CCSs, including performance, protection, operating conditions, and safety measures.
GB/T 18487-2AC Charging System Communication: Currently not as widely referenced or may align with future communication protocols.
GB/T 18487-3Safety requirements and DC Charging System Communication: Specifies communication protocols and control mechanisms between EV and charger during DC charging. It’s critical for ensuring proper voltage/current negotiation and safety during fast charging.
Table 19. Standard list of regulatory bodies related to wireless power transfer (WPT).
OrganizationStandardDescription
International Electrotechnical Commission (IEC) (EU, Australia, Asia) [167,168,205]IEC 61980Guidelines for WPT charging for EVs.
IEC 61980-1General requirements for WPT systems for EVs.
IEC 61980-2Communication between EV and WPT system.
IEC 61980-3Specific magnetic field power transfer requirements are required.
Society of Automotive Engineers (SAE) (US, North American) [182,186,206,207]SAE J2954Standardizes WPT via magnetic resonance, including power levels up to 11 kW, alignment, safety, and interoperability.
SAE J1773Standards for EVs that need contactless (wireless) charging.
SAE J2847-6Communication for WPT between Plug-in Vehicles and Wireless EVSE.
SAE J2931-2High-level communication protocols for wireless charging.
SAE J2931-6Digital Communication for WPT.
Standardization Administration of China (SAC) [208,209,210,211,212,213]GB/T 38775-1General Requirements of WPT: Defines the overall system design, important components, nomenclature, safety rules, and fundamental technical specifications for WPT of EVs.
GB/T 38775-2Communication protocols between OBC and WPT device.
GB/T 38775-3Specific Requirements for Magnetic Inductive Systems.
GB/T 38775-4Specifies mechanisms for aligning the vehicle with the ground pad to optimize energy transfer.
GB/T 38775-5EMC and Electromagnetic field Safety.
GB/T 38775-6Interoperability Requirements between chargers and EVs from different manufacturers.
GB/T 37293Standard for testing and evaluating the safety and performance of EV’s charging cables.
GB/T 24368Standard for testing and evaluating the safety and performance of EV’s charging cables.
Table 20. Charging interfaces of various countries in the world.
Type of ConnectorChinaNorth AmericaEuropeJapanAll Market Except EU
Batteries 11 00229 i001Batteries 11 00229 i002Batteries 11 00229 i003Batteries 11 00229 i004Batteries 11 00229 i005
AC connectorGB/T 20234.2SAE J1772 Type-1IEC 62196-2 Type-2SAE J1772 Type-1SAE J3400 (NACS)
Batteries 11 00229 i006Batteries 11 00229 i007Batteries 11 00229 i008Batteries 11 00229 i009Batteries 11 00229 i010
DC connectorGB/T 20234.3SAE J1772 CCS Combo 1IEC 62196 CCS Combo 2IEC 62196 CHAdeMOSAE J3400 (NACS)
Table 21. Summary of AC charging.
StandardLevelType of ConnectorAC Voltage (V)Current (A)Power (kW)
GB/T 20234.2 (China) [198].Slow ACAC connector250 V ( 1 ϕ )16/32 A8 kW (Max)
Fast ACAC connector440 V ( 3 ϕ )32/63 A48 kW (Max)
SAE J1772 (US/Canada) [154,154]Level 1Type 1120 V ( 1 ϕ )16 A1.9 kW
Level 2Type 1208–240 V ( 2 ϕ )80 A19.2 kW
IEC 61851-1 (EU/Asia) [169]Mode 1No specific plug230 V ( 1 ϕ )/ 400 V ( 3 ϕ )16 AUp to 3.7 kW
Mode 2Type 2230 V ( 1 ϕ )/ 400 V ( 3 ϕ )Up to 32 AUp to 7.4 kW ( 1 ϕ ) or 22 kW ( 3 ϕ )
Mode 3Type 2230 V ( 1 ϕ )/ 400 V ( 3 ϕ )Up to 63 AUp to 43.5kW
Table 22. Summary of DC charging.
StandardLevelType of ConnectorDC Voltage (V)Current (A)Power (kW)
GB/T 20234.3 (China) [199].fast DCDC Connector700–1000 V200/250 AUp to 250 kW
SAE J1772 (US/Canada) [154,154]Level 3CCS combo 1200–1000V500A350 kW
IEC 61851-1 (EU/Asia) [169]Mode 4CCS combo 2200–1000 V150–500 AUp to 350 kW
Disclaimer/Publisher’s Note: The statements, opinions and data contained in all publications are solely those of the individual author(s) and contributor(s) and not of MDPI and/or the editor(s). MDPI and/or the editor(s) disclaim responsibility for any injury to people or property resulting from any ideas, methods, instructions or products referred to in the content.

