Article

Measurement of Battery Aging Using Impedance Spectroscopy with an Embedded Multisine Coherent Measurement System

by
Jorge Lourenço
1,†,
Luis S. Rosado
1,†,
Pedro M. Ramos
1,*,† and
Fernando M. Janeiro
2,*,†
1
Instituto de Telecomunicações, Instituto Superior Técnico, Universidade de Lisboa, 1049-001 Lisboa, Portugal
2
Instituto de Telecomunicações, Universidade de Évora, Escola de Ciências e Tecnologia, 7004-516 Évora, Portugal
*
Authors to whom correspondence should be addressed.
These authors contributed equally to this work.
Batteries 2025, 11(6), 227; https://doi.org/10.3390/batteries11060227
Submission received: 14 April 2025 / Revised: 4 June 2025 / Accepted: 6 June 2025 / Published: 10 June 2025

Abstract

:
This work describes the development of an embedded standalone measurement system that monitors the aging of batteries using impedance spectroscopy. The system generates a multisine stimulus that contains the frequency components at which the battery impedance is measured. Coherent generation and sampling is assured, and Goertzel filters, one for each measurement frequency, are updated with each new sample. This architecture reduces memory requirements because the current and voltage of the measured samples are discarded after processing. Aging is monitored, as the system is able to automatically perform complete or partial charge/discharge cycles as well as measurement cycles without requiring user interaction.

1. Introduction

Since their first commercialization by Sony Corporation in 1991 [1], Lithium-Ion Batteries (LIBs) have become an indispensable part of modern technology. Their widespread use has been driven by their characteristics, including their high energy density, low self-discharge rate, reduced memory effect, and excellent cycling performance [2,3]. LIBs play an important role in a vast range of applications, from consumer electronics (such as smartphones, tablets, and wearable devices) to industrial power tools, medical equipment, and electric vehicles (EVs). Additionally, they serve as crucial energy storage solutions in renewable energy systems, helping to manage the intrinsic fluctuations in solar and wind power generation [4,5,6].
The increasing demand for LIBs is reflected in market trends, with battery production reaching 780 GWh in 2023, marking a 25   % increase from the previous year, and projections indicating a rise to 9 TWh by 2030 [7]. The shift toward electric vehicles (EVs), driven by strict emission standards and governmental incentives, highlights the critical role of battery performance, energy density, and cycle life in ensuring the sustainability and efficiency of these vehicles. As EV sales increases, with 14 million new EVs sold in 2023, comprising 18   % of total car sales [7], efficient Battery Management Systems (BMSs) are becoming essential for optimizing battery lifespan, safety, and performance [8,9]. A BMS consists of hardware and software designed for the real-time monitoring of battery voltage, current, and temperature, ensuring operation within safe limits. Without a BMS, batteries could suffer from overcharging, deep discharging, or thermal runaway, which could lead to reduced lifespan and, in extreme situations, severe failures. However, due to the nonlinear and complex electrochemical behavior of batteries, especially under varying environmental and operational conditions, sophisticated estimation algorithms are required for the accurate estimation of State-of-Charge ( S o C ) and State-of-Health ( S o H ), which are critical battery parameters for energy management and performance optimization [10,11,12].
The S o C represents the remaining battery capacity, providing users and control systems with an indication of how much energy is left before the battery needs to be recharged. The S o H indicates the battery’s overall condition and degradation over time, reflecting how much of the battery’s original capacity remains after prolonged use. In some systems, when the S o H drops below a certain threshold, typically around 80   % of the original capacity, the battery is considered to have reached the end of its useful life [12,13]. Adequate estimation of these parameters allows for better maintenance strategies, extended battery lifespan, and optimized energy usage, particularly in large-scale applications such as electric vehicles and grid storage [14].
Since direct measurement of a battery’s stored chemical energy is not feasible [3], S o C and S o H estimation relies on indirect methods using battery voltage, current, and temperature data processed through mathematical models [15,16]. Common estimation techniques include Coulomb counting [17], open-circuit voltage (OCV) [18], Kalman filtering [19,20], machine learning-based approaches [21], and curve fitting on the voltage relaxation time [22]. However, these methods have inherent specific limitations, such as reliance on accurate initial conditions, computational complexity, and sensitivity to aging effects [23]. Additionally, uncertainty in these estimation methods can lead to inefficient battery usage, premature charging cycles, and reduced overall lifespan of battery packs, which increase costs and environmental impact.
Electrochemical Impedance Spectroscopy (EIS) is a promising alternative for battery monitoring, allowing for the characterization of battery health and behavior [24,25,26]. EIS measures the frequency-dependent battery impedance, offering detailed insights into charge transfer resistance, electrolyte diffusion, and other electrochemical phenomena, making it a versatile non-invasive tool for the characterization of overall battery condition. By analyzing these impedance characteristics, EIS can provide accurate estimations of S o C and S o H [27]. Despite its potential, the practical implementation of EIS in real-time applications remains challenging due to the need for specialized measurement hardware, substantial computational resources, and the difficulty of performing accurate measurements under normal operating conditions [28,29]. In [30], a battery characterization system is proposed, to be used in satellites, using curve fitting of the different ECM component parameters, thus resulting in a large number of estimated parameters. A comprehensive review of different estimation methods for electrochemical models can also be found in [31].
This paper presents the development of a proof-of-concept battery impedance measurement system, capable of measuring impedance across a wide range of S o C and S o H conditions. The system uses a Pulse Width Modulation (PWM)-generated multisine current signal composed of 15 frequencies spanning from 50 mHz to 1 kHz to capture key electrochemical phenomena. With coherent signal generation and Goertzel-based filtering, there is no spectral leakage, therefore providing accurate estimation of voltage and current frequency components. The architecture is designed to minimize memory usage by discarding data samples immediately after they are processed. In addition, the system is capable of performing full or partial charge/discharge measurement cycles, enabling the continuous monitoring of battery aging without the need for user intervention. Finally, the developed system offers a practical solution that can be integrated into a wide range of applications. This includes everything from small consumer electronics to large-scale renewable energy storage and electric mobility, helping to improve efficiency, sustainability, and the overall reliability of battery-powered systems. Although different commercial EIS solutions are available on the market, recent research has also focused on microcontroller-based EIS systems as cost-effective and customizable alternatives for battery monitoring applications [32,33,34]. A comparison between these systems is shown in Table 1 to highlight the differences relative to the proposed system. The system presented here offers the flexibility for further studies and the optimization of frequency and amplitude choices, as well as for the analysis of different estimation algorithms.
The aim of this paper is to present a proof-of-concept embedded battery impedance measurement system that enables accurate and automated impedance analysis across a wide range of battery conditions. Accurate measurements are ensured by avoiding spectral leakage through the use of multisine excitation and Goertzel-based filtering. The main advantages of the system are low memory usage, autonomous operation, and flexibility for further optimization, making it a valuable tool for the development of battery monitoring systems in both small- and large-scale applications.

2. Electrochemical Impedance Spectroscopy

Electrochemical Impedance Spectroscopy (EIS) [35] is a useful technique for characterizing the behavior of interfaces such as electrodes and electrolytes in batteries. The technique provides insight into processes such as charge transfer reactions, diffusion, and other electrochemical phenomena, making it a versatile and non-invasive tool for the characterization of LIBs. EIS data may be used to analyze and estimate several crucial parameters that describe battery condition, including the S o C and the S o H , potentially solving the problems that conventional estimation methods face. In general, S o C ( t ) is defined as the ratio between the present cell charge, Q ( t ) , and the maximum cell capacity at a given state of aging, Q m a x ( t ) , and is typically represented as a percentage
S o C ( t ) = Q ( t ) Q m a x ( t ) × 100 [ % ] .
This definition ensures a 100 % S o C after each complete charge. An alternate definition relates the present cell charge Q ( t ) with the nominal capacity of the battery Q n , defined by the battery manufacturer. The S o H has been defined in the literature [12] as
S o H ( t ) = Q m a x ( t ) Q n × 100 [ % ] .
The estimation of both S o C and S o H often relies on voltage measurements, Coulomb counting, or model-based estimations. However, Electrochemical Impedance Spectroscopy (EIS) provides an alternative, physics-based approach to estimating S o C and S o H by considering the internal electrochemical processes of the battery [36,37]. The EIS method works by applying a small-amplitude periodic perturbation, which can be either the current (Galvanostatic Electrochemical Impedance Spectroscopy—GEIS) or voltage (Potentiostatic Electrochemical Impedance Spectroscopy—PEIS), to the system under analysis. The reaction of the battery is measured, through the acquisition of its voltage and current, which are then processed to obtain its impedance frequency response. In this paper GEIS will be used with a multisine current signal to capture relevant electrochemical characteristics across a broad relevant frequency range—50 mHz to 1 kHz.

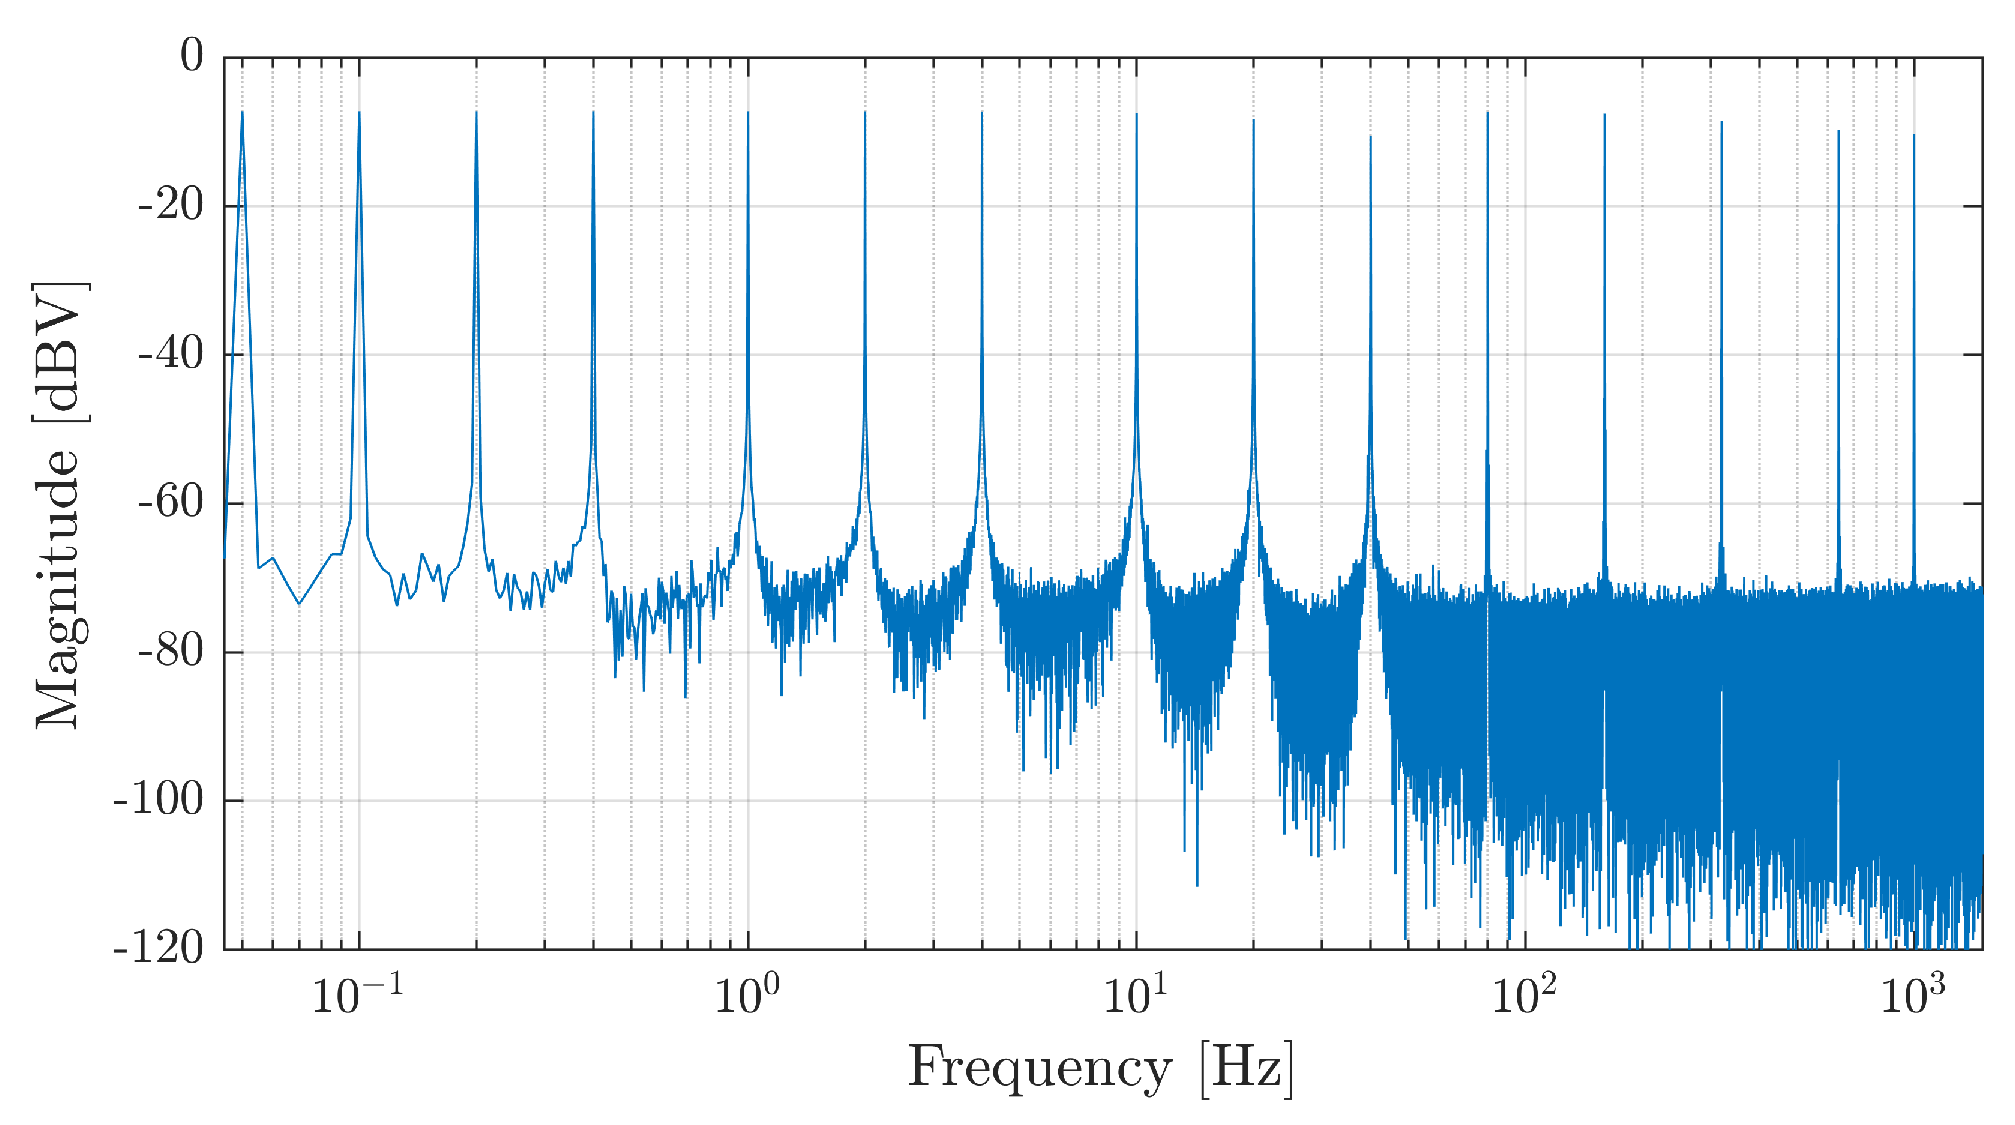
Excitation Signal Design

Broadband multisine signals as a source of excitation for EIS systems provide simultaneous measurement results at all frequencies of interest. This method considerably reduces the testing time needed to obtain an EIS frequency response [38]. The system generates a voltage multisine signal which is then converted to a current injected into the battery. The designed voltage consists on the sum of sinusoidal components with a quasi-logarithmic spacing, as in most EIS systems [32,38,39,40]. In this work 15 frequency components are used, and their values f k are 0.05, 0.1, 0.2, 0.4, 1, 2, 4, 10, 20, 40, 80, 160, 320, 640, and 1000 Hz. The voltage is
V IN ( t ) = k = 1 15 A k cos ( 2 π f k t + ϕ k )
where ϕ k is the phase of each sinewave and their amplitude A k is the same for all components.
The phase of each sinewave plays a pivotal role in the design of the voltage waveform and needs to be selected to minimize the voltage’s crest factor ( C F ), defined as
C F = | V p k | V R M S
where V p k is the voltage peak value and V R M S is its RMS value. Minimizing the C F ensures that the signal-to-noise ratio ( S N R ) of the excitation voltage is optimized. Phases can be randomly assigned, but generally this approach produces high peak values of the waveform and poor C F values [41]. This is extremely relevant because a lower C F leads to a higher S N R of the excitation voltage, which provides higher accuracy for EIS measurements. The purpose of using 15 frequency components is therefore to achieve a balance between the number of impedance frequency measurements that can be obtained from a single acquisition process and the computational cost required to process these components. In addition, if more components are added, another difficulty arises from the obtainable signal-to-noise ratio ( S N R )—more components will reduce the S N R and cause an increase in the standard deviations of the estimated impedance component values.
The combination of phases that minimize the C F for a multisine signal is an open research optimization problem [41,42,43], and in this work, the clipping algorithm is used for minimization of the voltage’s C F . It is an iterative process starting with randomly assigned phase values for each frequency bin, and is processed offline to design the voltage to be used in the measurement system. After obtaining the initial time-domain voltage from the first set of phases, the following steps are executed:
  • Clip the time-domain voltage such that its amplitude is limited to a specified percentage of the current absolute peak value—the percentage starts at 75 % and is gradually increased to 99 % during the iterations, thus reducing the clipping.
  • Determine the Discrete Fourier Transform (DFT) of the clipped voltage.
  • Restore the amplitudes to the initial desired values A k while keeping the phases from the DFT result.
  • Compute a new time-domain voltage using the Inverse DFT.
  • Determine the new C F .
  • If the C F reaches a desirable value, or there is no significant improvement, or the maximum number of iterations is reached, the algorithm is stopped. Otherwise, the algorithm returns to step 1.
The clipping algorithm is performed beforehand on a computer to optimize the multisine signal. After the optimized signal is obtained, the signal sequential amplitudes are programmed in the embedded measurement system. During the measurements, these amplitude values are used to generate the voltage V IN ( t ) .
Figure 1 illustrates the resulting excitation voltage after optimization. The multisine voltage period is 20 s, which corresponds to the period of the lowest frequency component, 50 mHz. It has a C F of 2.96 which is within reasonable limits for a multisine broadband signal with 15 quasi-logarithm frequency bins. The measured spectrum of the optimized voltage is shown in Figure 2.
To comply with the sampling theorem, the sampling frequency should be at least twice the highest frequency component, i.e., f s m i n = 2 kHz. A sampling rate of 10 kHz allows for 10 samples per period for the highest frequency component while keeping the memory requirements to store the excitation voltage reasonable.
The signal stimulus generation and acquisition sampling rate are obtained from the same clock source, ensuring that, when a full period of the voltage and current are acquired, there is no spectral leakage in the computation of the DFT [39]—which, in turn, enables the use of Goertzel filters to accurately estimate individual frequency components of the measured battery current and voltage.
Since a higher amplitude of the excitation signal improves the S N R , and following the conclusions derived in [38], a current amplitude of 50 mA is used in this work.

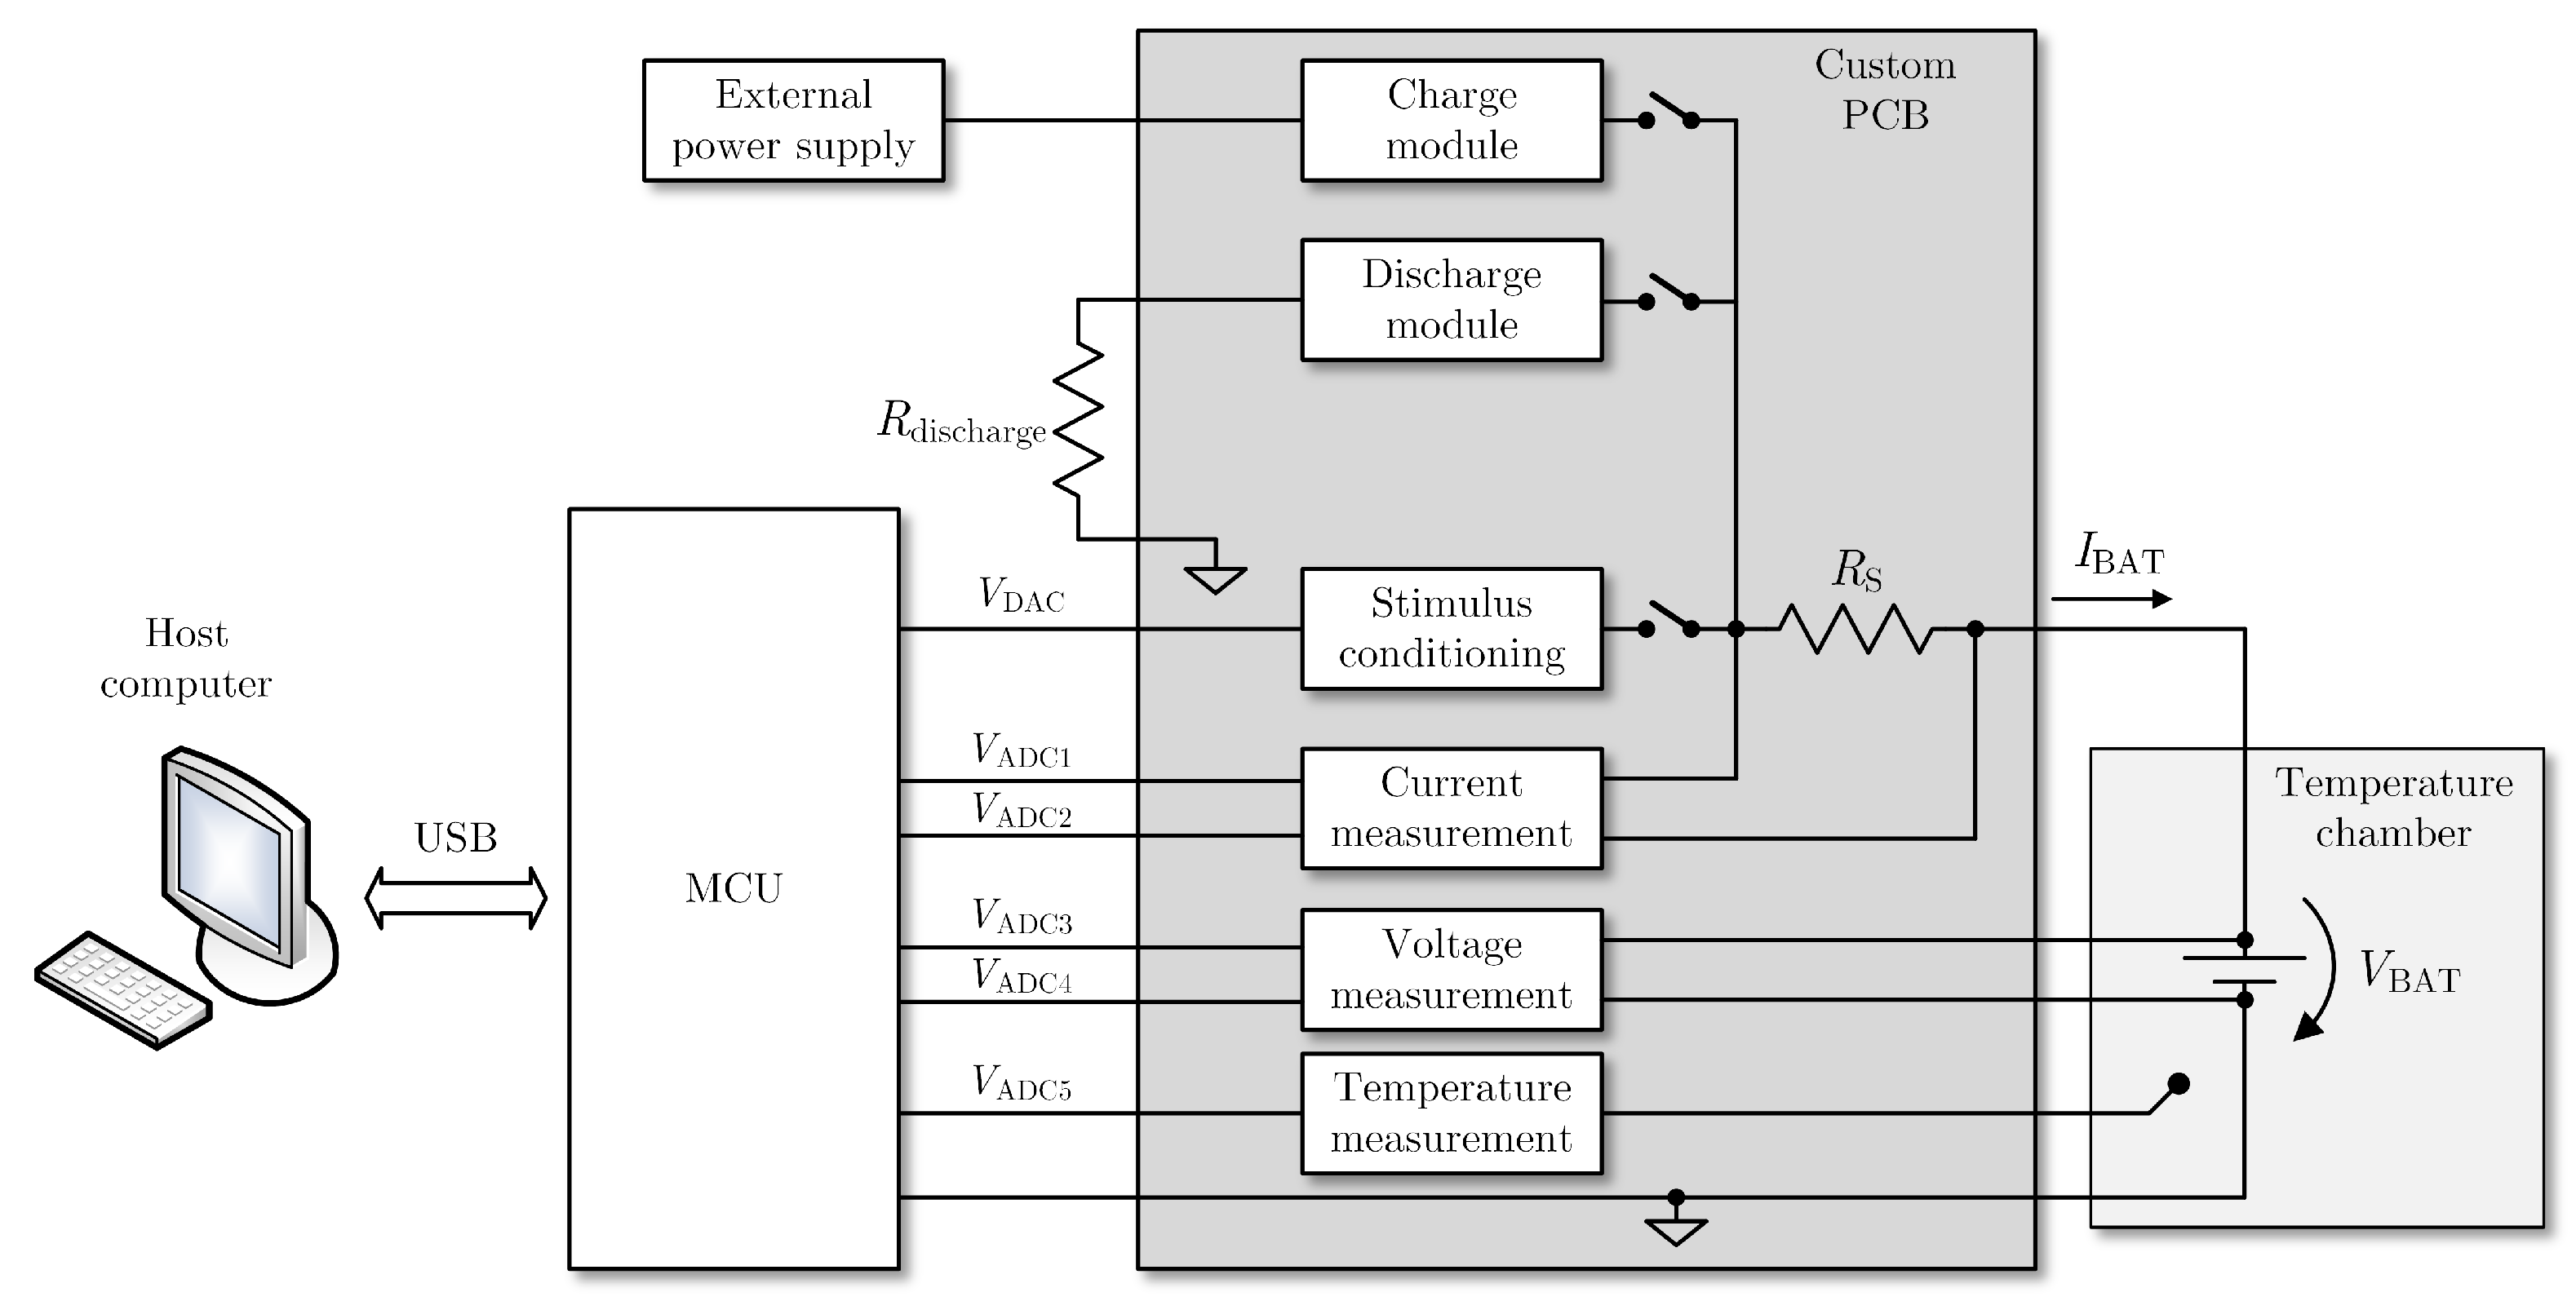
3. Embedded System Overview

The developed embedded system includes three key features: (i) EIS measurements tailored for LIB technology; (ii) the capability to characterize an LIB using EIS across different temperatures, charge levels, and life cycles to develop accurate S o C and S o H estimation methods; and (iii) a possible platform for the future implementation of different methods for on-line estimations of S o C and S o H when connected to any LIB. The architecture of the developed system is shown in Figure 3. A four-wire connection is used to connect the system to the battery being tested.
In Figure 4 the flowchart of the implemented algorithm for EIS measurement is shown. It illustrates the generation of the multisine stimulus, configuration of the ADC for the measurement of voltage and current, calculation of the Goertzel filters, estimation of the impedance, and application of the calibration coefficients to estimate the battery impedance.
A custom PCB, shown in Figure 5, was designed for compactness and increased flexibility and includes the following: (i) a shunt current measurement resistor; (ii) a stimulus conditioning module which converts voltage to current; (iii) separate charge-and-discharge circuits for a 3 A maximum current (corresponding to a 1 C-rate for 3 A·h batteries); and (iv) connection to an external temperature sensor.

3.1. Microcontroller Unit

The STMicroelectronics STM32F407G-DISC1 development board is used for computational power. It includes a high-performance ARM Cortex-M4 processor with a clock speed of up to 168 MHz. Its set of peripherals and interfaces includes a 16-channel 12-bit ADC module, two 12-bit DACs with DMA, 1 MB of flash memory, and a USB interface. Microcontrollers from the same family have been used in several experimental setups for battery state estimation and EIS instrumentation [32,44,45,46].

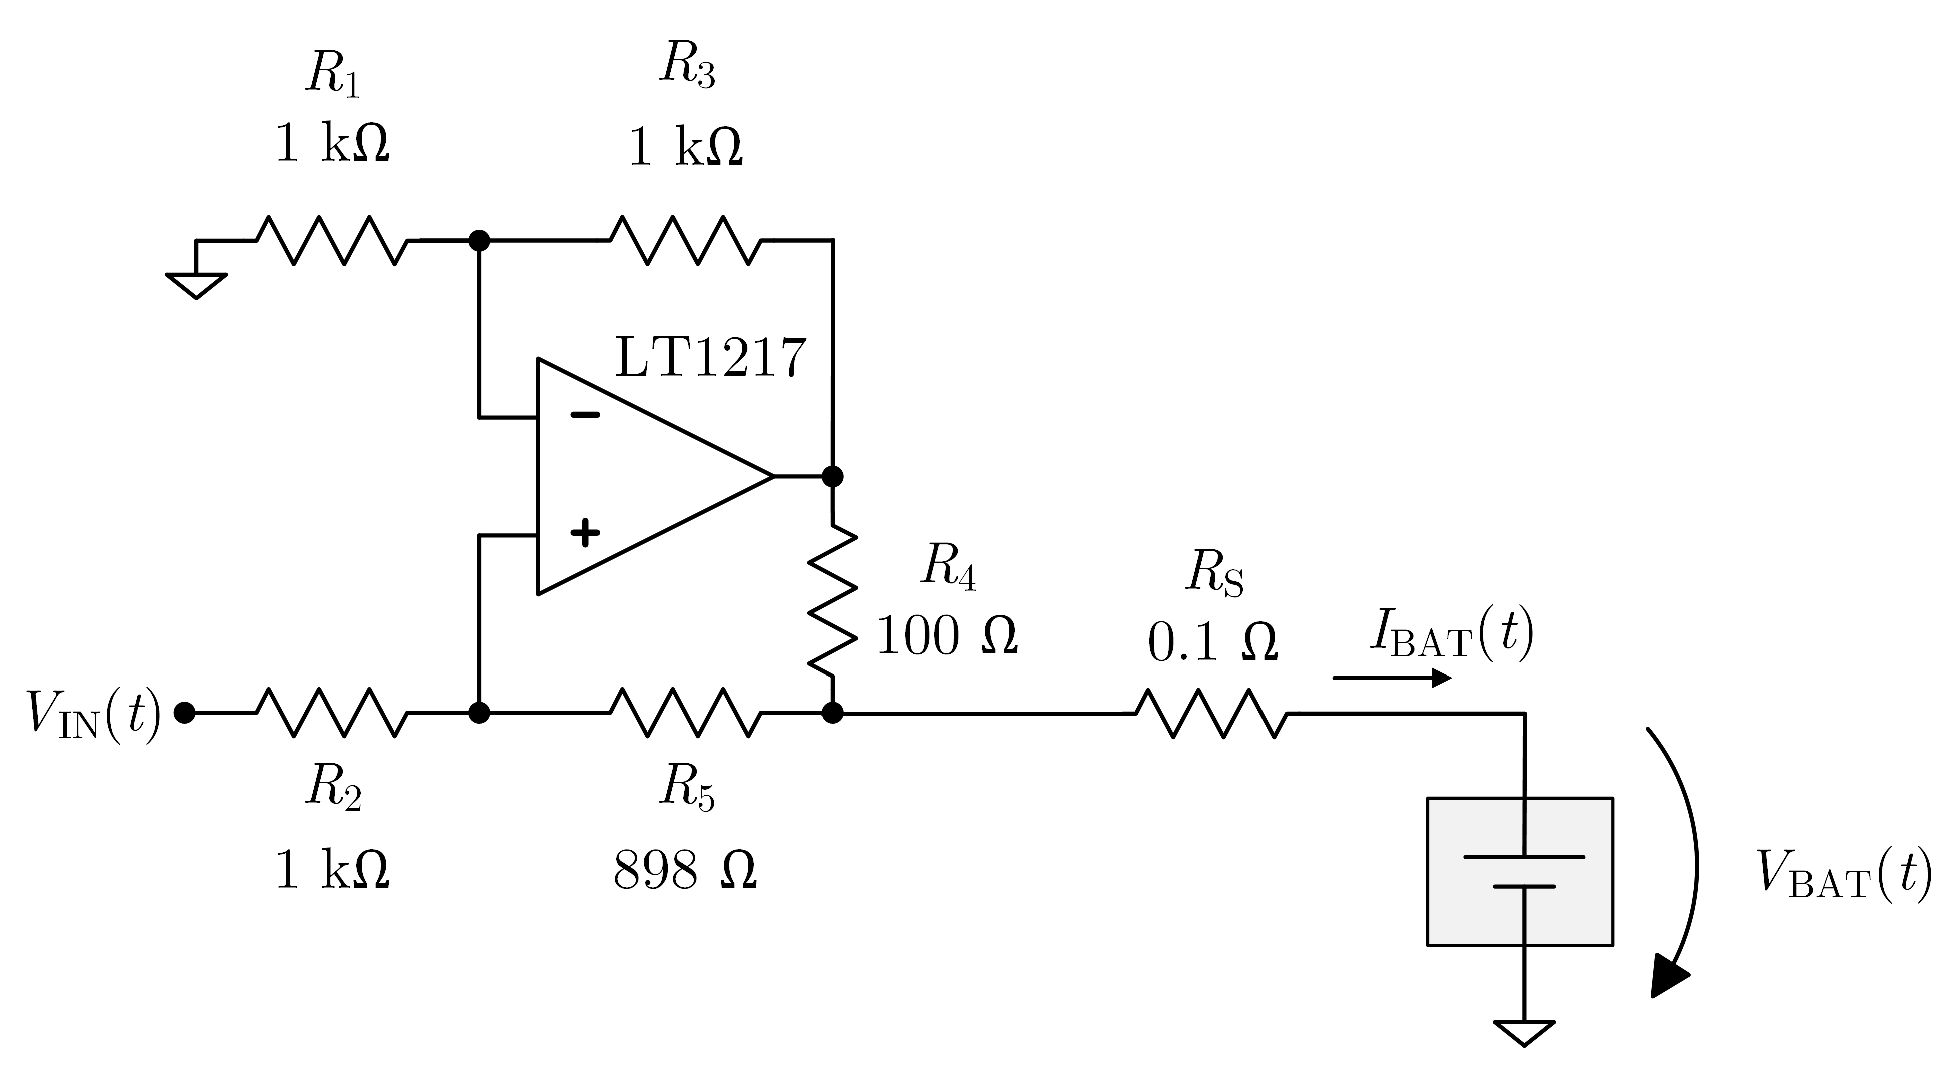
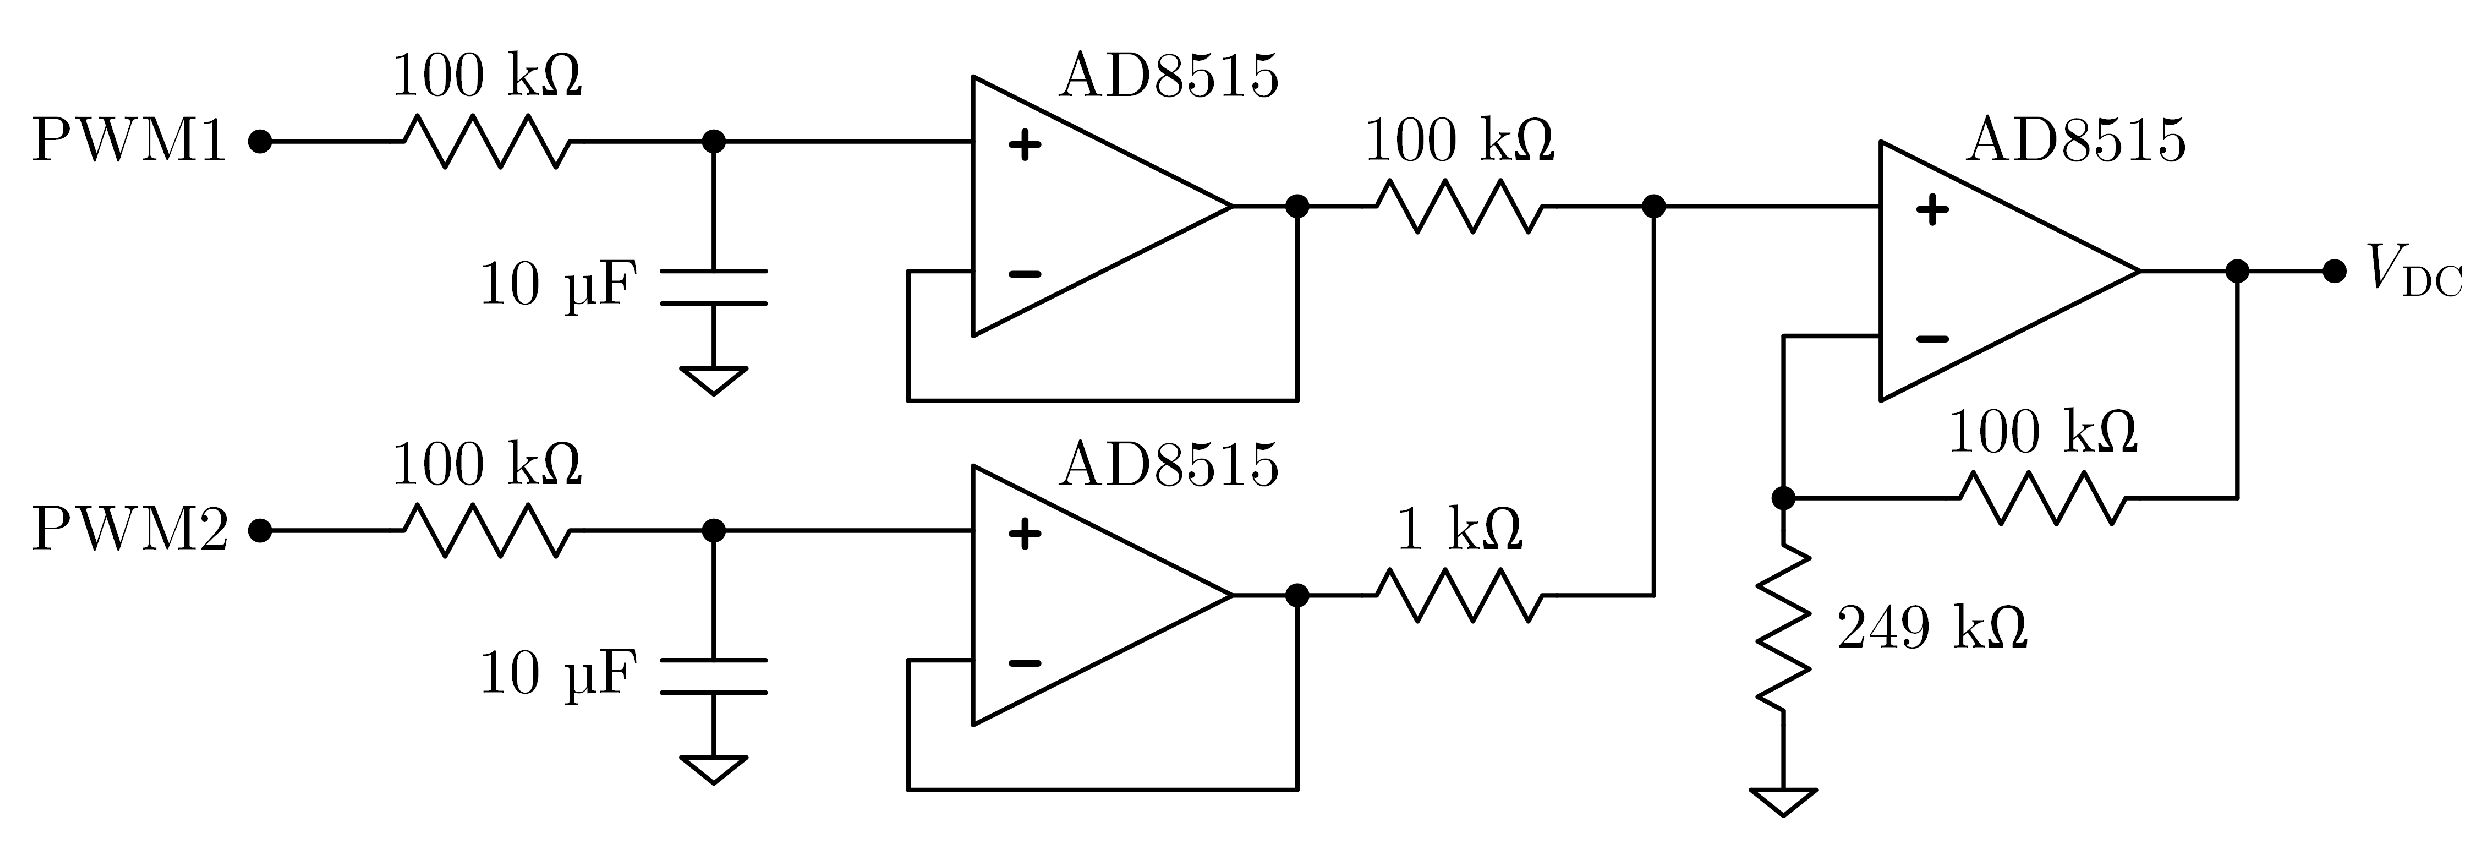
3.2. Excitation Current Source

The EIS excitation current is sourced by an Improved Howland Current Pump (IHCP) circuit, as shown in Figure 6. The selected amplifier is an Analog Devices LT1217 with a maximum output current of 100 mA. This IHCP is a voltage-controlled current source with R 1 = R 2 = R 3 = 1 k Ω , R 4 = 100 Ω and R 5 = 898 Ω , resulting in a battery current range of I BAT = ± 50 mA obtained from a control voltage range of ± 5 V connected at VIN. This ± 5 V input voltage range is obtained from the STM32 DAC output ( [ 0 , 3.3 ] V range) with a differential amplifier after subtracting a 1.65 V constant voltage.

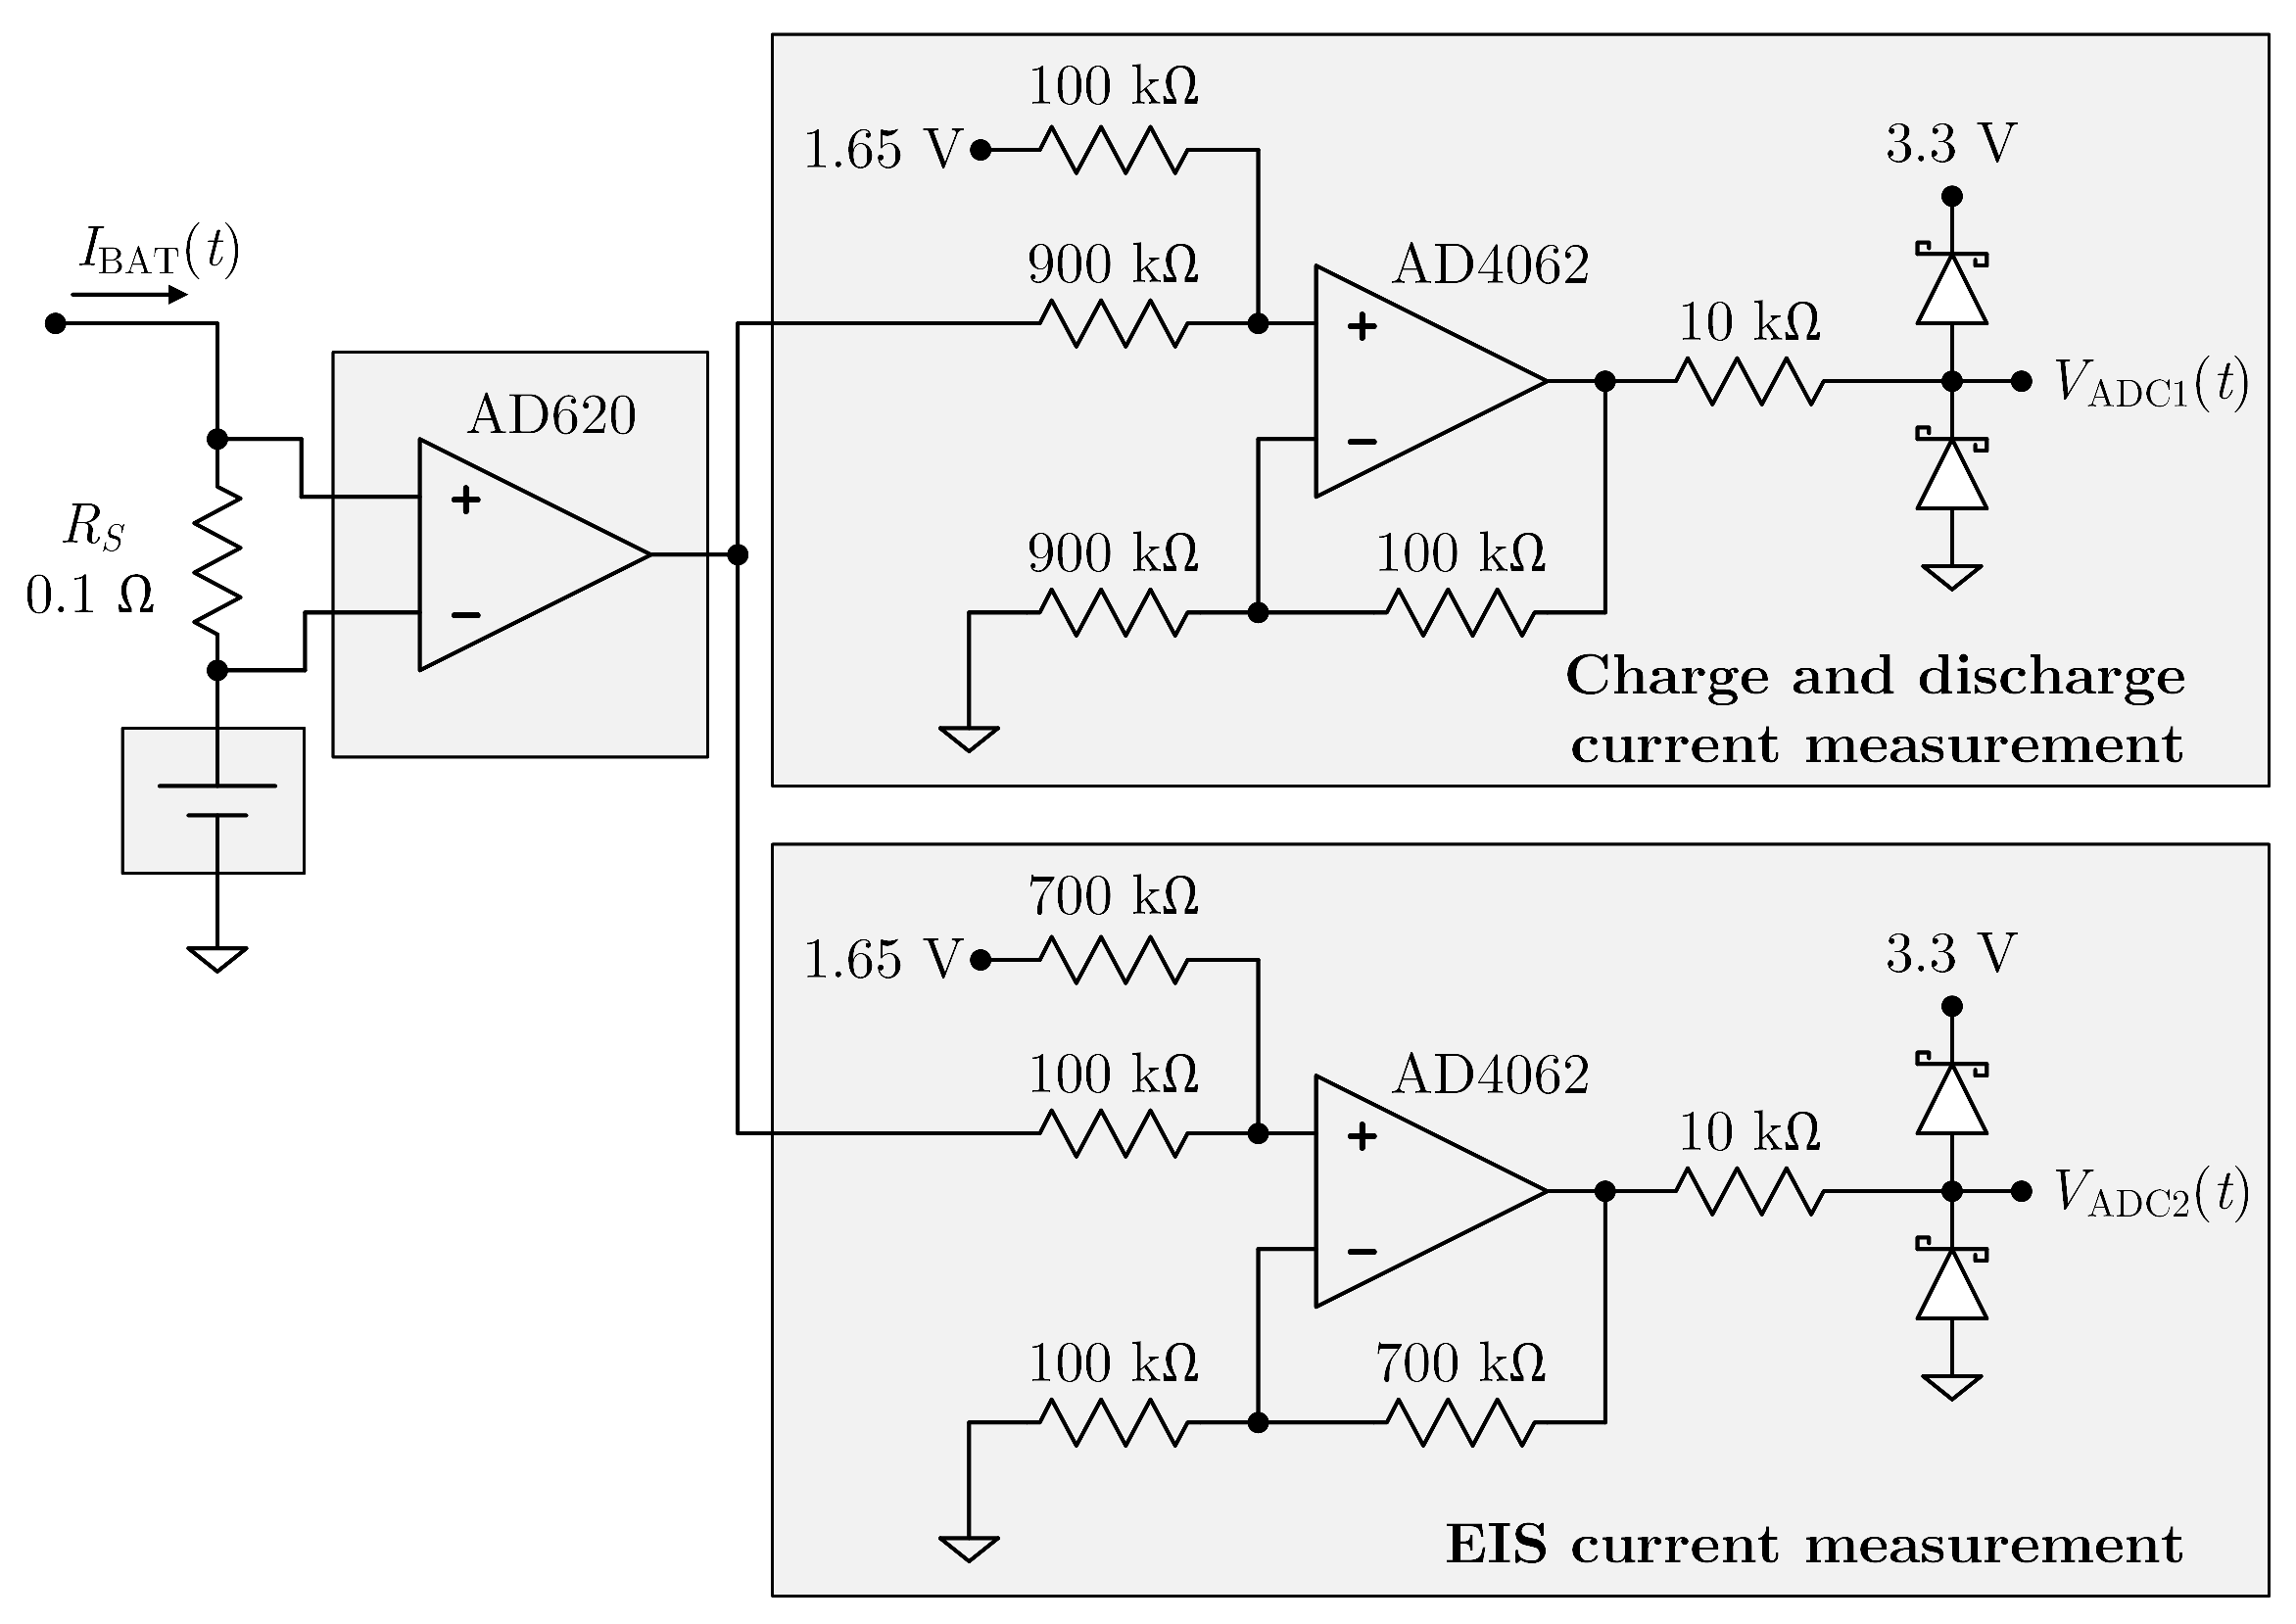
3.3. Current Measurement Circuit

There are two different current measurement ranges. When an EIS measurement is being performed, the current range is ±50 mA, and when the cell is being discharged or charged, the current range is ±3 A. As shown in Figure 7, the current is sampled using a 0.1 Ω resistor ( R s ) and then amplified by an Analog Devices instrumentation amplifier (AD620) with G = 39 , leading to ± 195 mV and ± 11.7 V ranges for each mode, respectively. The two ranges have different measurement circuits with different gains, leading to two different ADC channels. Since the rated inputs of the ADC of the STM32 are in the [ 0 , 3.3 ] V range, an offset voltage of 1.65 V is added to adapt these voltages into unipolar voltages. To protect the ADC inputs, two anti-parallel Schottky diodes are used to limit the output to normal voltage levels for both measurement circuits.

3.4. Voltage Measurement Circuit

During charge-and-discharge cycles V BAT ( t ) is measured with a simple voltage divider whose output is connected to V ADC 4 . When performing EIS measurements, the battery voltage contains a DC component and an AC response to the applied current perturbation, V BAT ( t ) = V DC + V AC ( t ) . To measure the EIS response, V AC ( t ) , it is necessary to remove the V DC component. This is achieved by sampling V BAT ( t ) with V ADC 4 and averaging the results to estimate V DC . The value to be subtracted is dynamically generated through the sum of two filtered Pulse Width Modulation (PWM) outputs, as shown in Figure 8. The PWM2 signal provides most of the required amplitude, with a 45.79 mV resolution, while the other (PWM1) provides increased resolution, 457.9 µV, for fine-tuning.
A differential amplifier circuit is used to subtract the PWM generated V DC from V BAT ( t ) (Stage 1), and its output is amplified 200 times and converted to a unipolar voltage by adding 1.65 V (Stage 2), as shown in Figure 9.

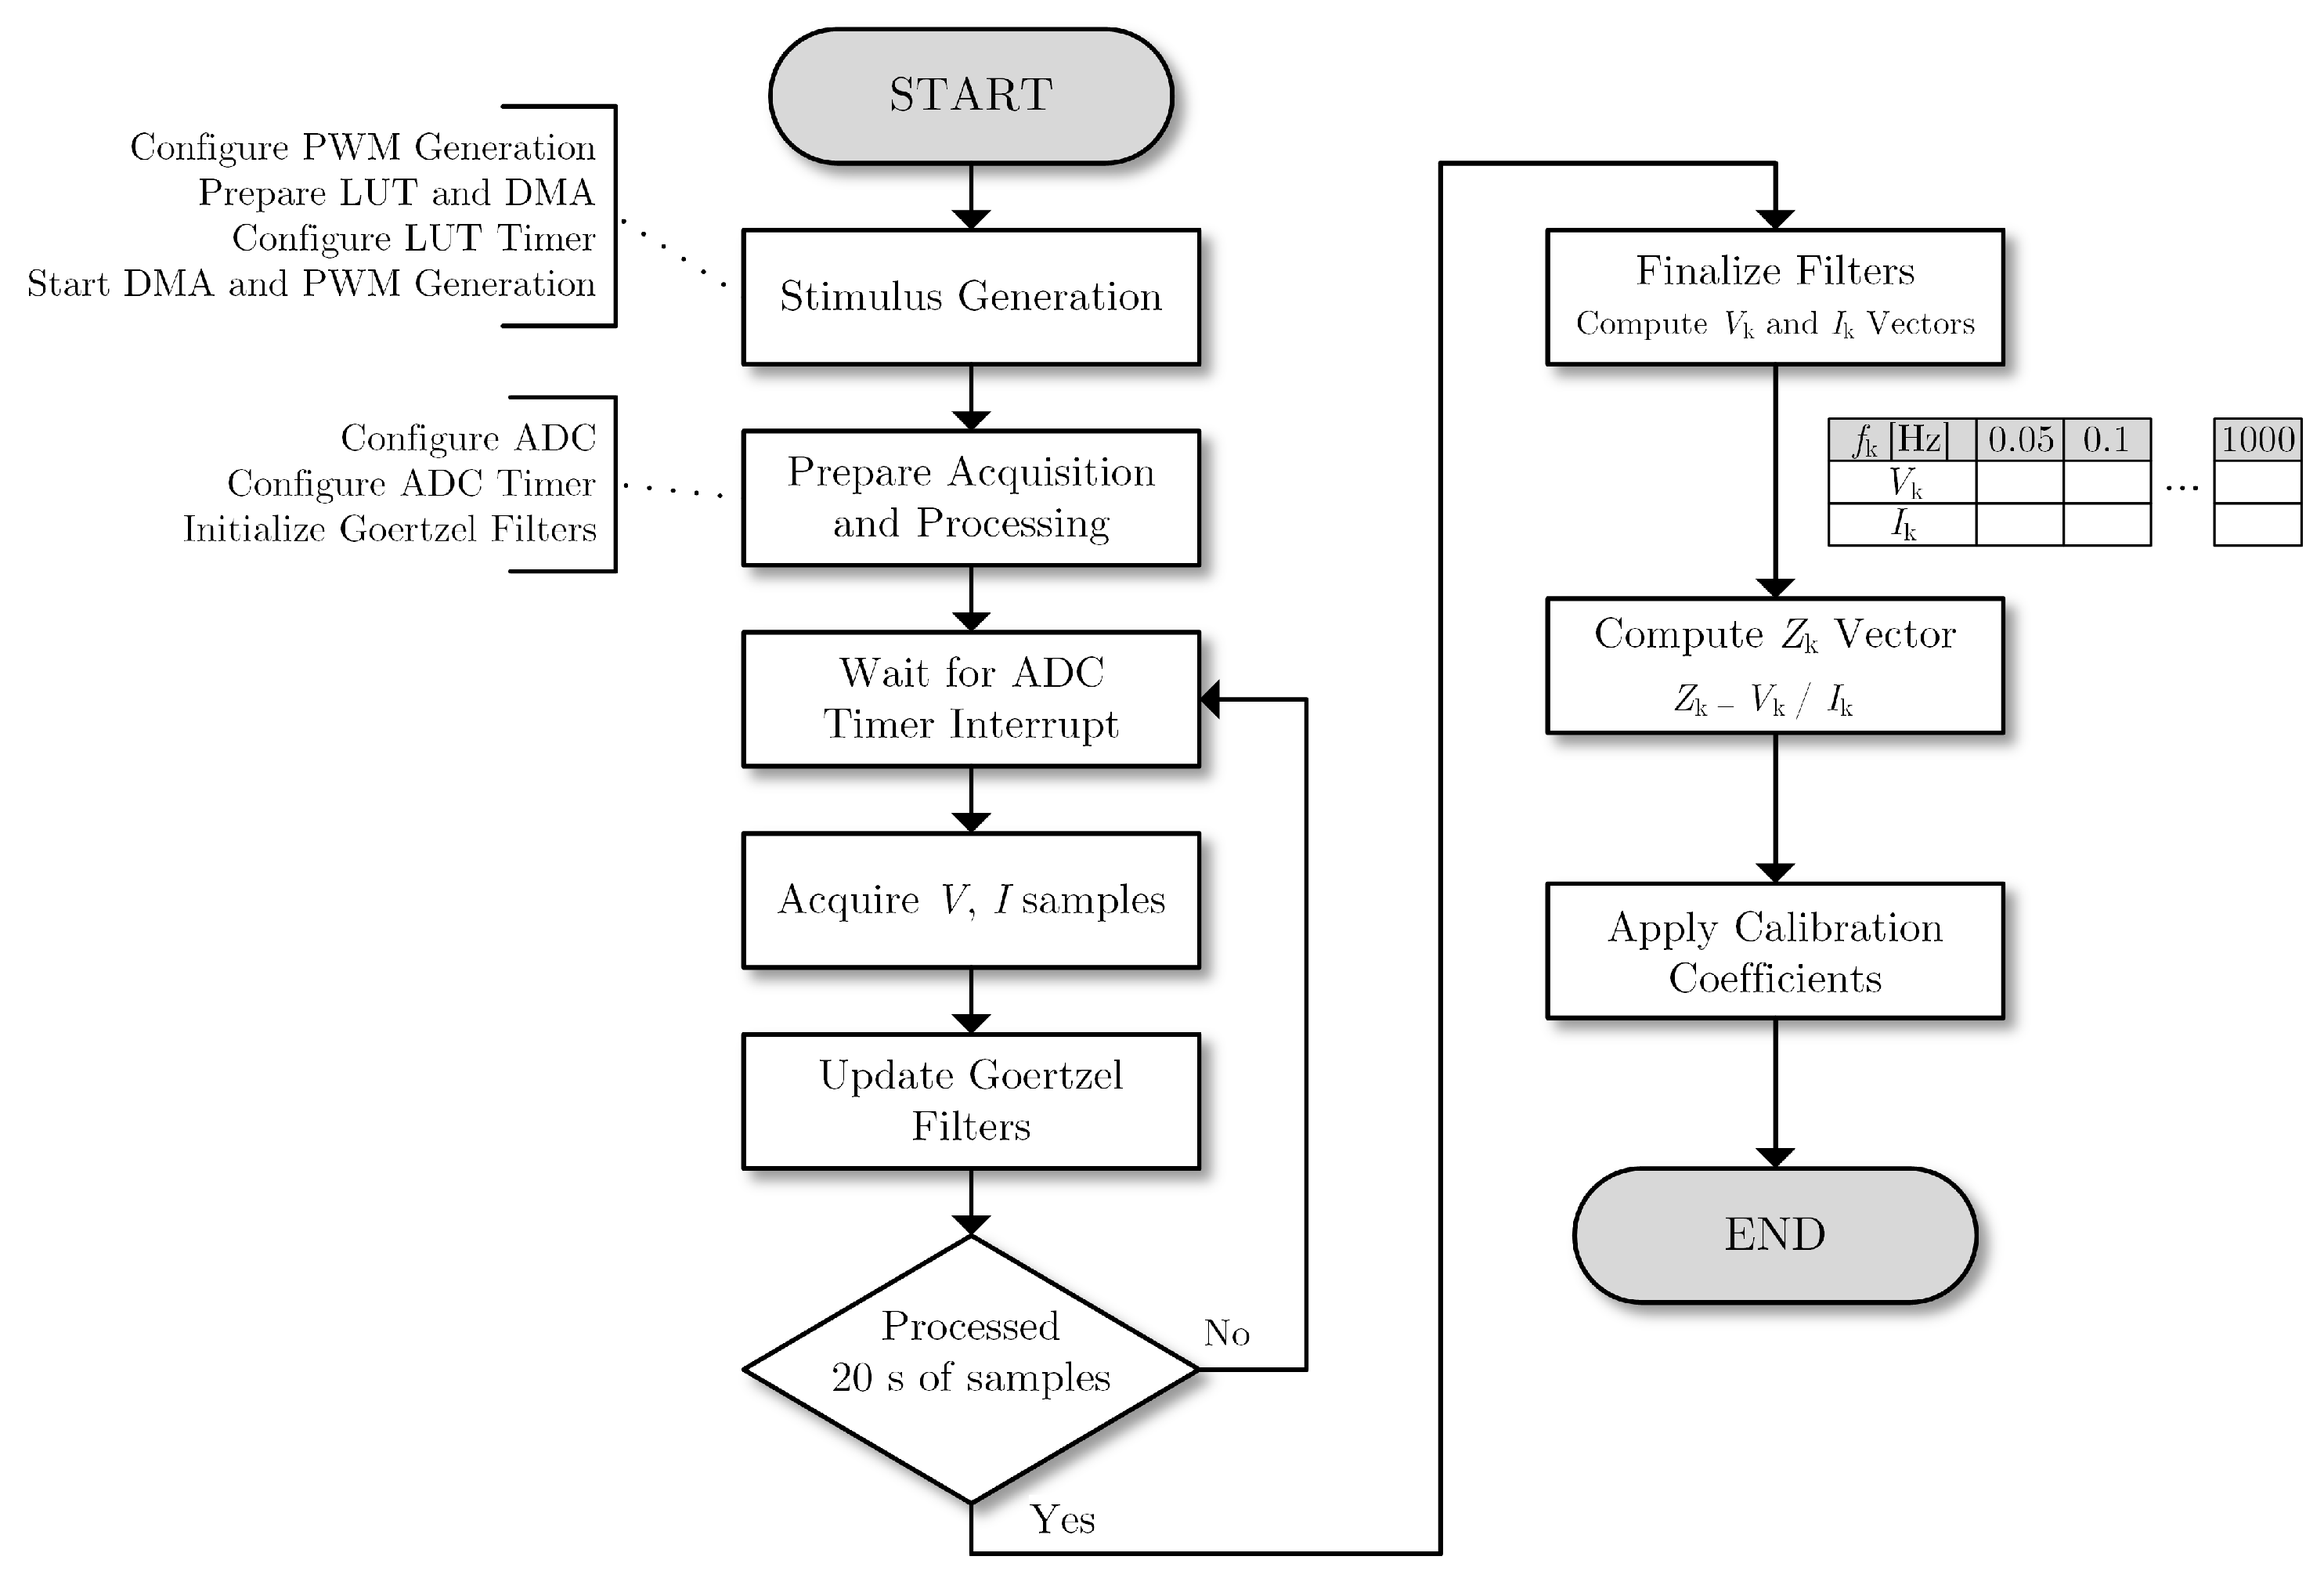
3.5. Impedance Estimation

To estimate the impedance at the different target frequencies f k , the voltage and current components at those frequencies need to be estimated. Since only 15 frequency components are required, it is memorywise more efficient to compute them using the Goertzel algorithm [47] instead of computing the full DFT of the voltage and current signal. The Goertzel algorithm is a second-order IIR filter used to efficiently estimate an individual Discrete Fourier Transform (DFT) component. When only a small set of frequencies of the DFT is required, a set of Goertzel filters are more efficient in both computation and memory usage when compared with the complete FFT (Fast-Fourier Transform) [48,49]. The coherence between the generated and measured signals eliminates spectral leakage, ensuring that the Goertzel algorithm provides accurate estimations of the desired voltage and current frequency components. The impedance, at each frequency, is obtained through the amplitude and phase of the voltage and current Goertzel-estimated frequency components. The proposed system impedance measurement system was calibrated using a commercial instrument with basic accuracy of 0.08 % across the measurement frequency range and the relevant impedance magnitude.

4. Measurement Results

The battery used for the EIS measurements was a CELLEVIA BATTERIES L502248 450 mA·h Lithium-Polymer (LiPo) cell, which was placed in a temperature-controlled chamber with a setpoint of 25 °C. Voltage and current measurement circuits were calibrated with an Hewlett Packard HP34401A multimeter.
The test process sequence that was used in this work is as follows:
  • Fully charge and discharge the battery 5 times, ending with it fully discharged (including rest periods after each charge and discharge).
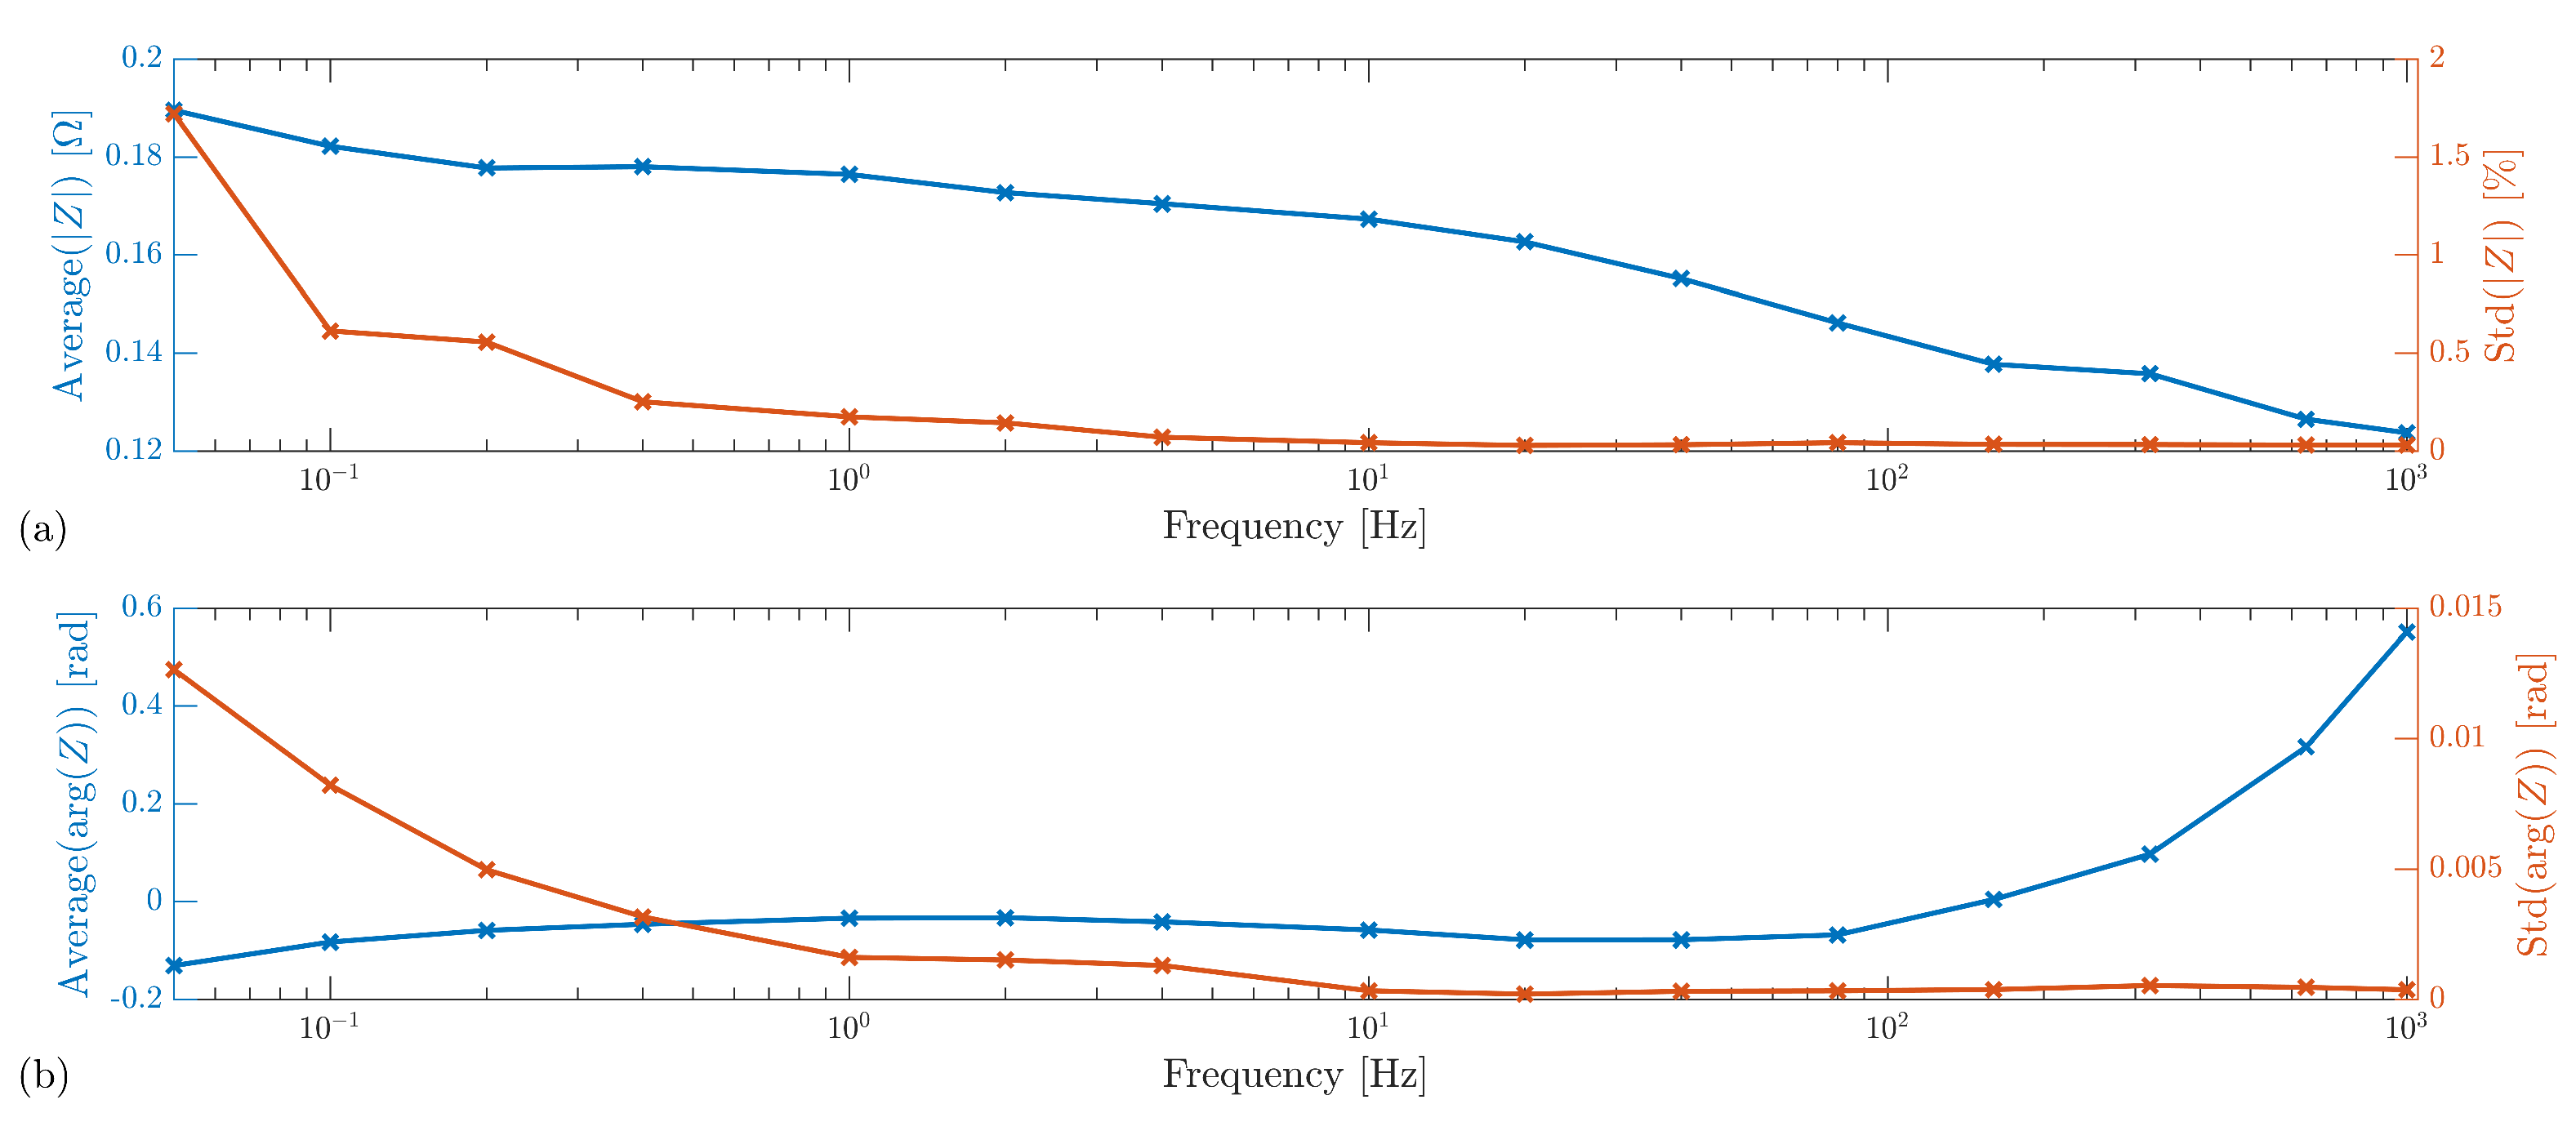
  • Perform EIS measurements with 12 repetitions to obtain the average impedance parameters for each of the 15 frequencies.
  • If the battery was already fully charged, discharge it and go back to Step 1; otherwise, go to Step 4.
  • Charge the battery up to 10 % of Q m a x or until it is fully charged, wait for the battery to rest, and go to Step 2.

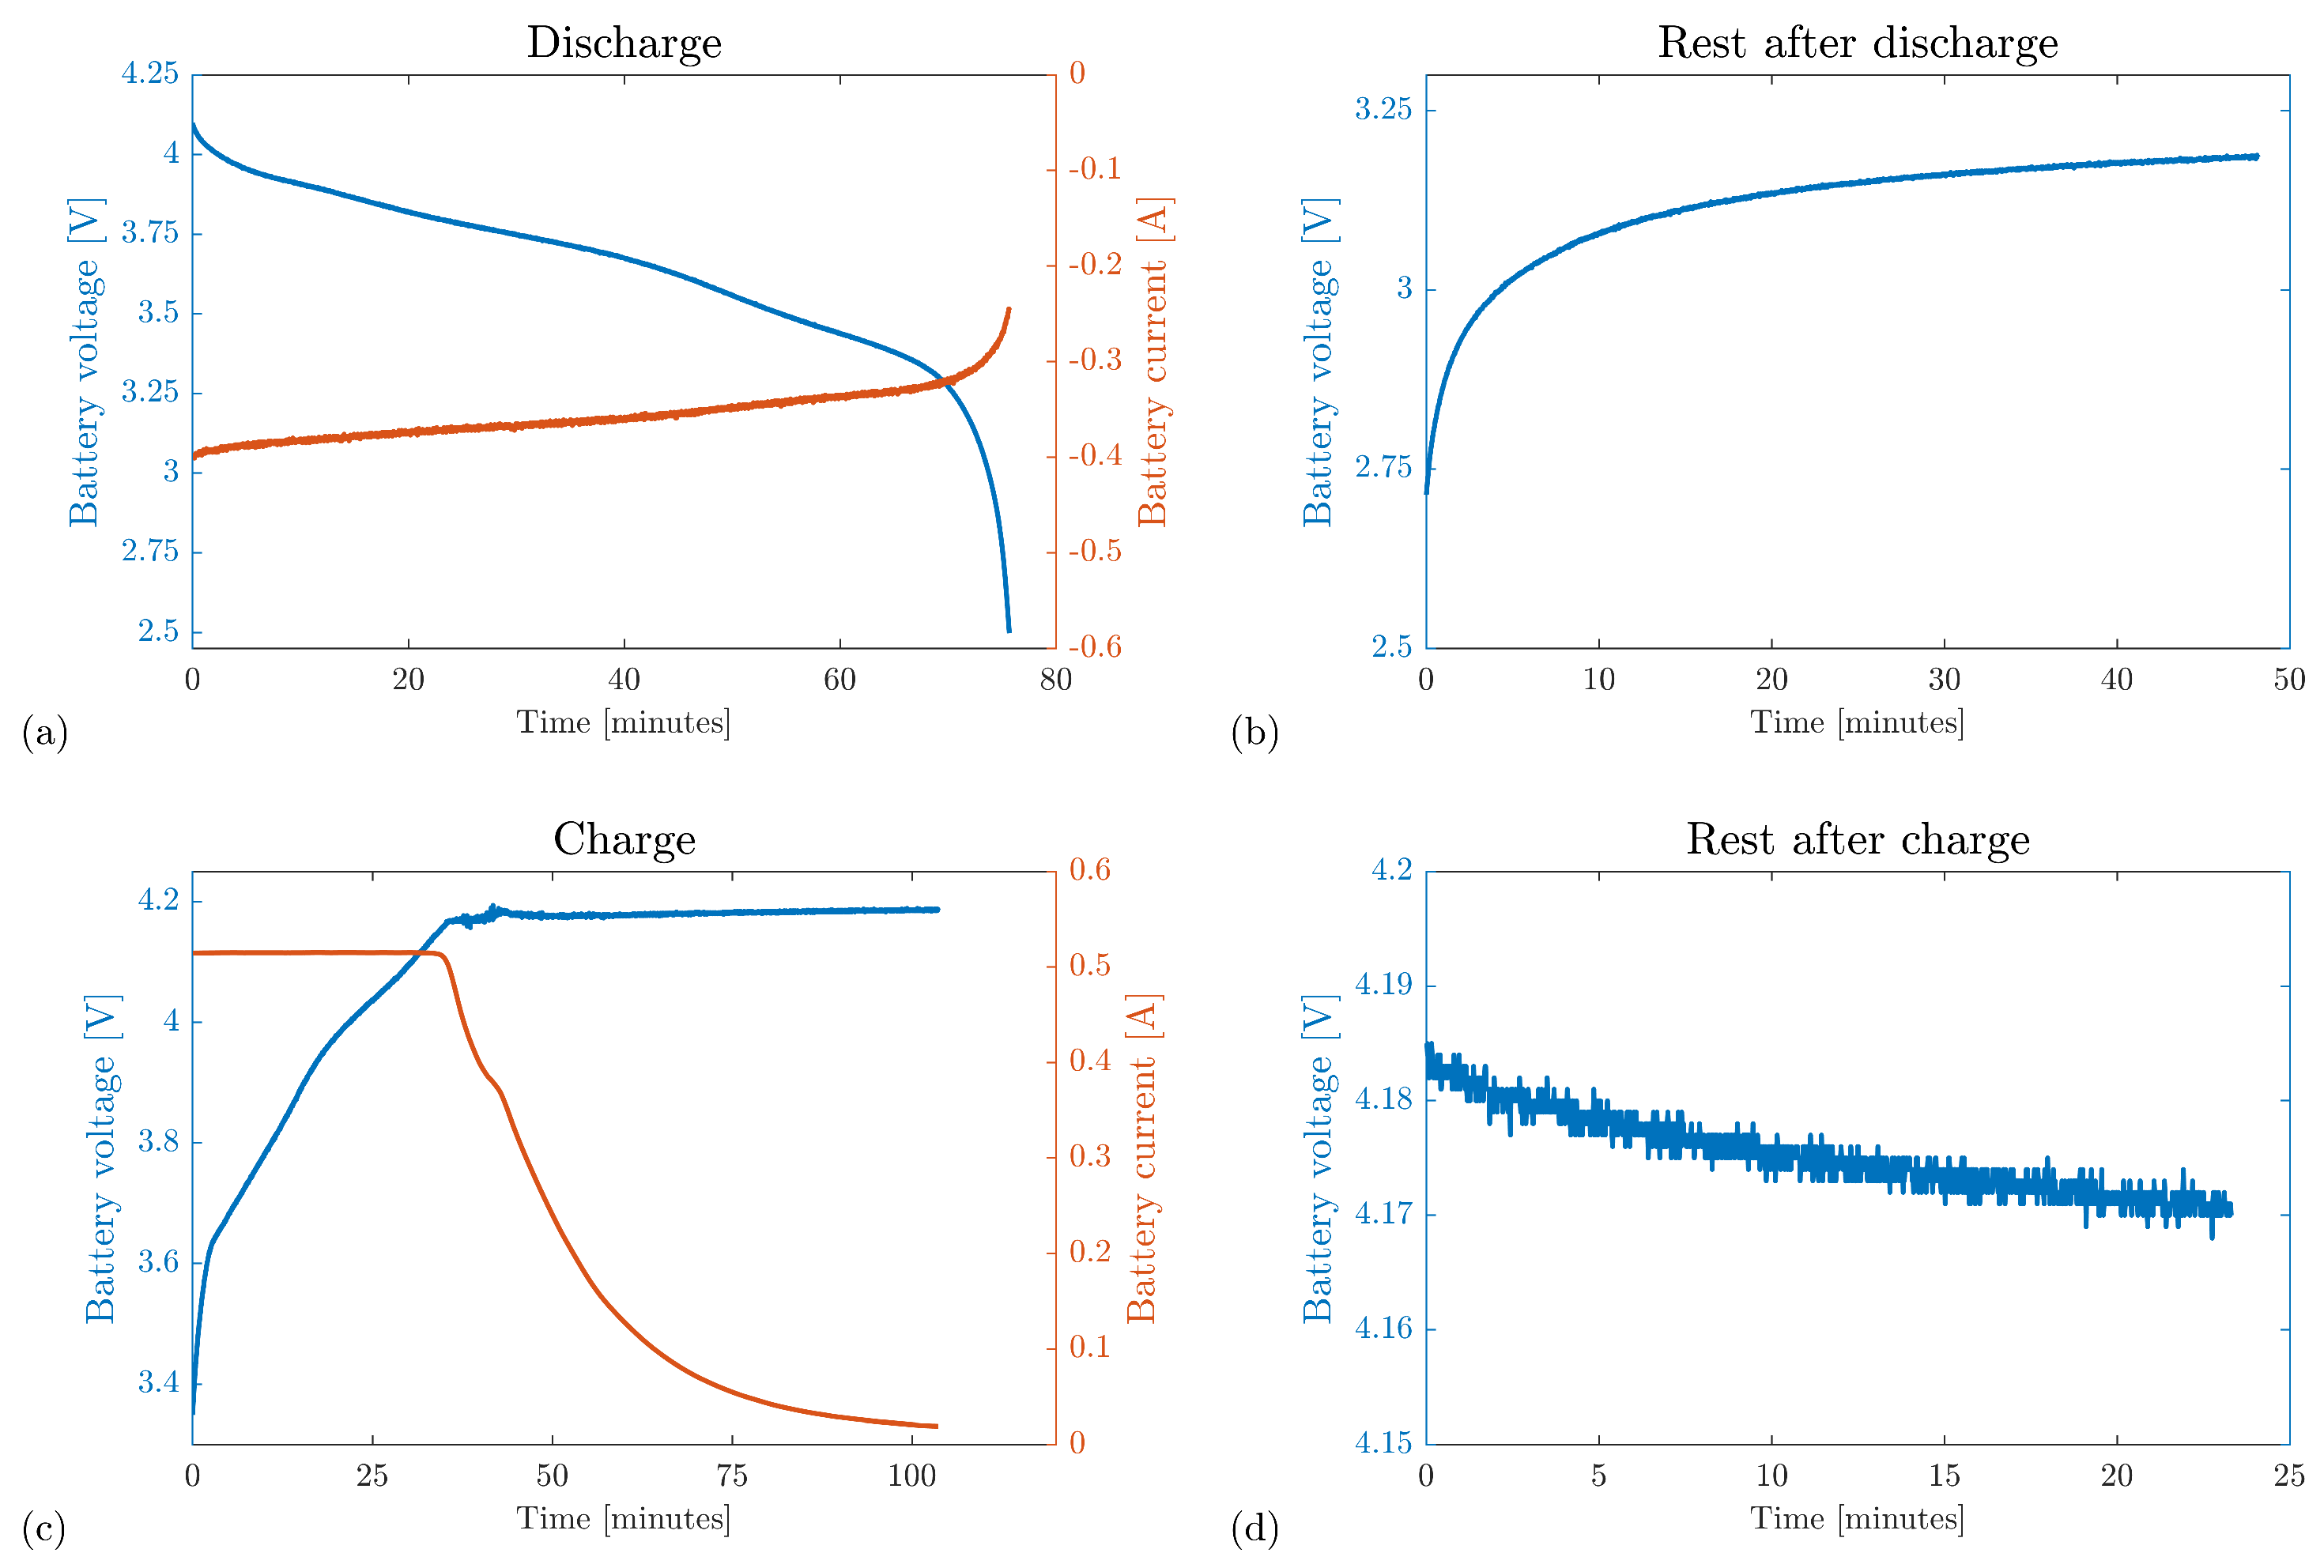
4.1. Charge/Discharge Cycling Procedure

The cell is fully charged and discharged five times (5 cycles) between EIS measurements so that an S o H study can be conducted. During the charging procedure, the maximum current is set to 500 mA (1.1 C-rate), while discharge is performed through a 10 Ω resistor, resulting in a current between 250 mA and 420 mA [ 0.55 C - rate , 0.93 C - rate ] . It is considered that charging ends when the current is lower than 20 mA, and that discharging is concluded when the battery voltage drops below 2.5 V. A full cycle takes approximately 4 h, including the rest periods, as shown in Figure 10. Due to the aging degradation of the battery, the capacity corresponding to 100 % S o C , Q m a x , obtained by calculating the final Coulomb counting result, is updated after each complete discharge/charge cycle.

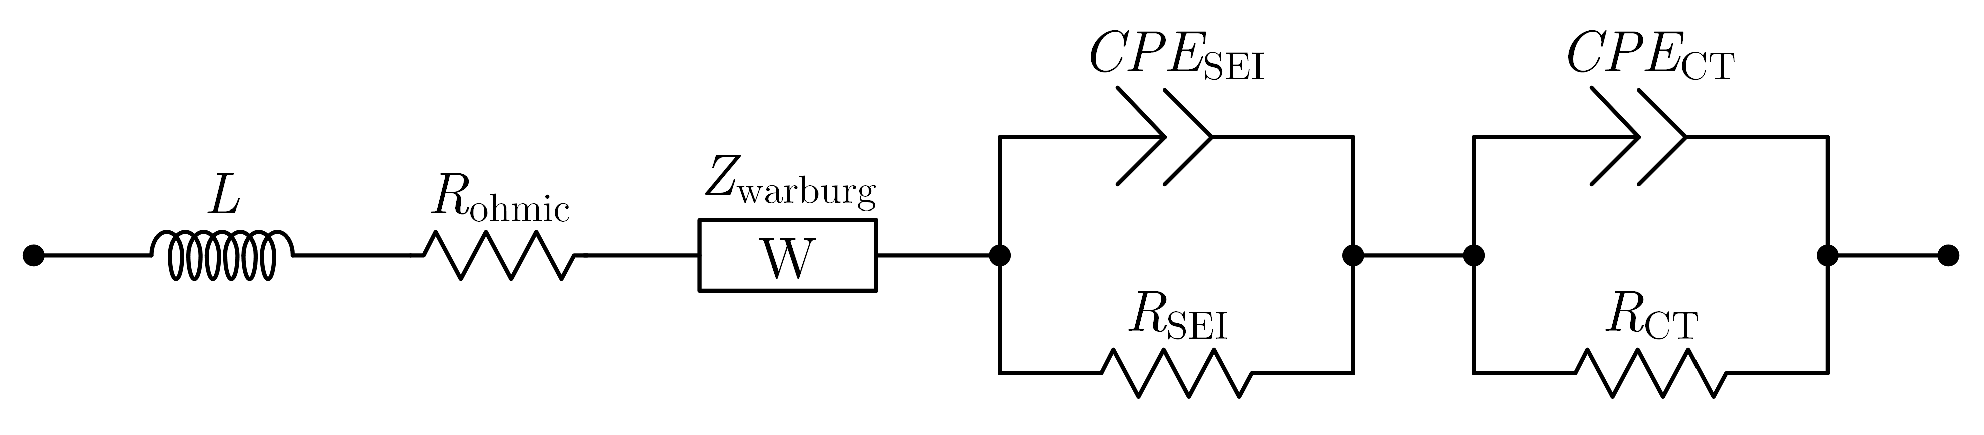
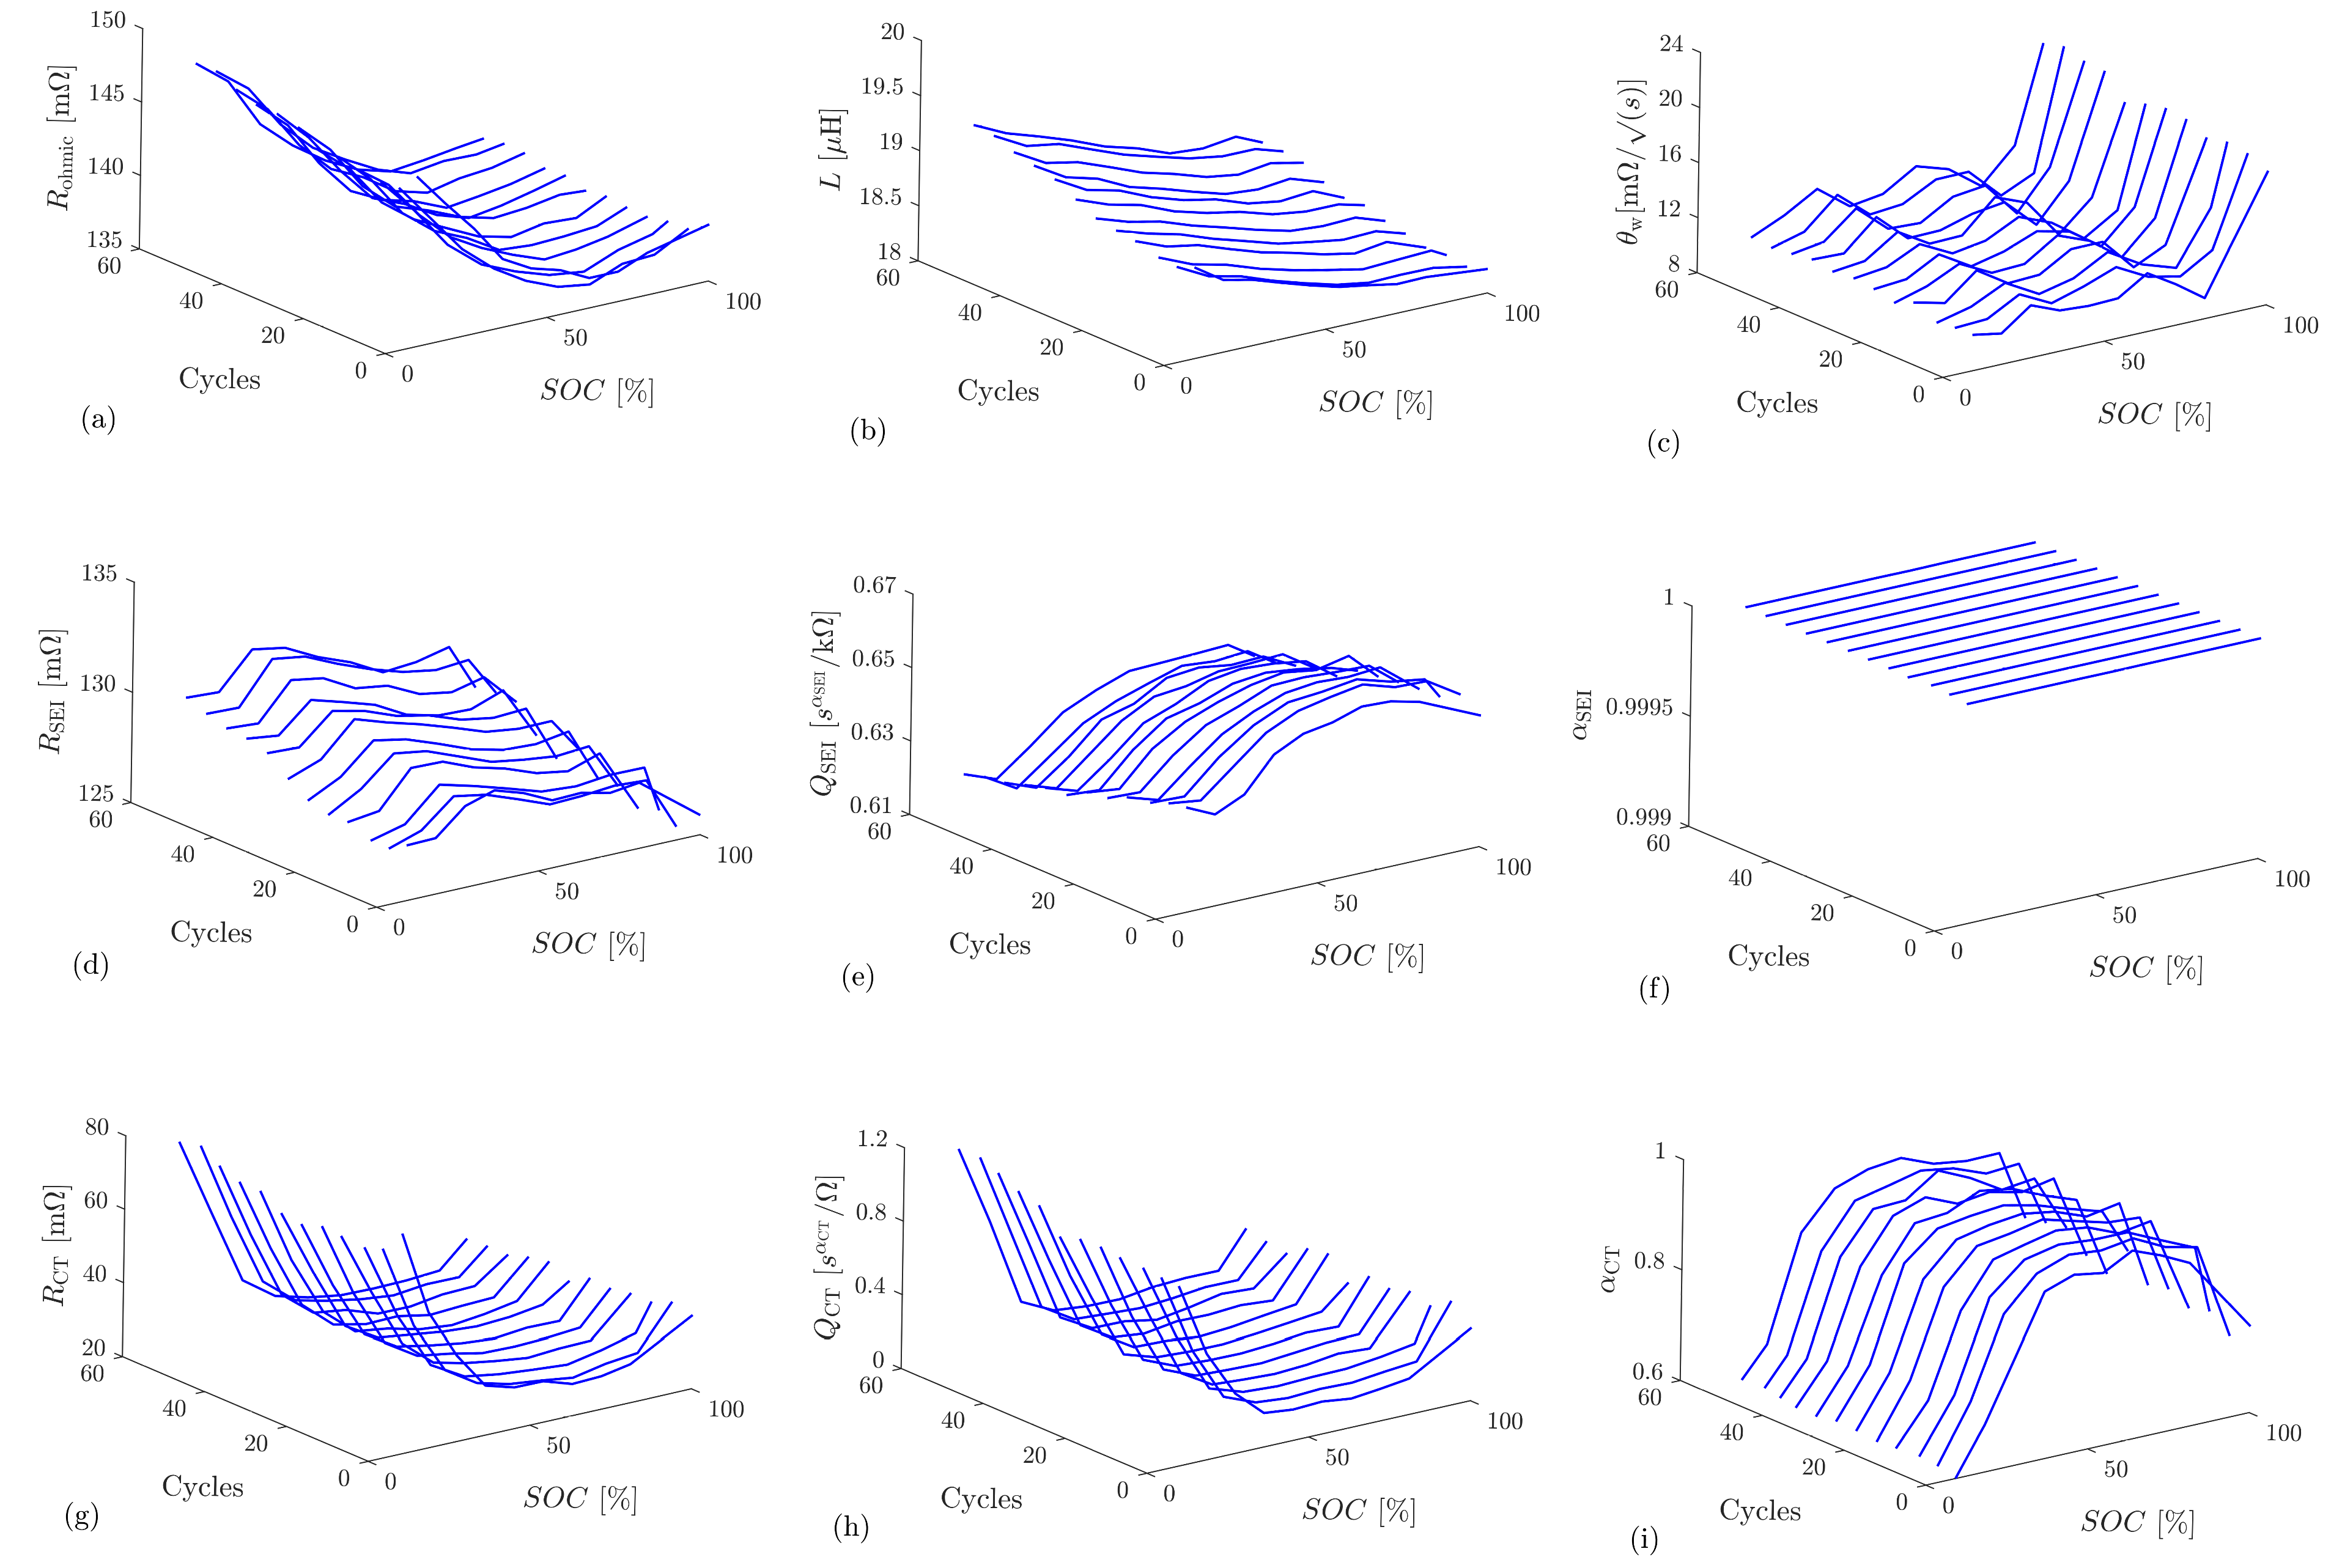
4.2. Measurements and Equivalent Circuit Model Fitting

The measurement process begins with the battery fully discharged, and with the Coulomb counter reset to 0 A·h. The battery is then charged until the cumulative charge, measured by Coulomb counting, reaches each successive 10 % of Q m a x . After each increment, the battery rests to achieve a steady state, after which an EIS measurement is performed. Since the final Q m a x may be lower than its original value, the S o C values are recalculated using the new estimated maximum capacity. A single batch of measurements takes around 6 h.
The EIS measurements, at each S o C , are performed 12 times (i.e., acquisition time is 240 s), therefore providing multiple voltage and current measurements at each frequency. Although choosing a higher number of repetitions would improve the quality of the measurements, the number of repetitions (12) was chosen as a balance between the time required to perform the acquisition and the accuracy of the measured impedance. From these measurements, the battery impedance response is obtained. As an example, Figure 11 shows the average and standard deviation of the impedance magnitude and phase of the battery at S o C 40   % . The standard deviations of the impedance magnitude and phase for different S o C and S o H values are of the same order of magnitude as the ones shown in Figure 11. The resulting standard deviations are higher at lower frequencies, suggesting that the system could be improved by using higher amplitudes A k at lower frequencies, which can be gradually lowered as the frequency increases.
To extract useful information from the measurements, the Equivalent Circuit Model (ECM) shown in Figure 12 was adopted. R ohmic models the electrolyte, electrodes and separator resistances, while L represents the residual inductive behavior due to wires. The Warburg impedance models the diffusion processes within the cell and is given by Z warburg = θ w / j ω , where θ w is the Warburg coefficient. The Solid Electrolyte Interfaces (SEIs) are modeled by R SEI in parallel with the first Constant Phase Element (CPE), C P E SEI , with the parameters Q SEI and α SEI . The CPE impedance is Z CPE = 1 / ( Q ( j ω ) α ) . Similarly, the double-layer capacitance of the cathode is modeled by R CT and the second CPE, C P E CT , with the parameters Q CT and α CT . This results in a model with nine parameters: R ohmic , L, θ w , R SEI , Q SEI , α SEI , R CT , Q CT , and α CT . While the Warburg impedance can be considered an inseparable part of the interfacial impedance [50], modeling it as an independent element in series with the interfacial components is a common practice and will be used in this paper.
Given the potentially broad search space associated with the nine ECM parameters and the likelihood of local minima in the curve-fitting cost function, conventional optimization methods may fail to yield reliable results. To overcome these limitations, a genetic algorithm-based least squares fitting approach is adopted [51], with boundary conditions set to ensure that the parameters remain within physically meaningful ranges. The parameters α SEI and α CT are bounded between 0 and 1, while the remaining parameters are required to be non-negative.
Figure 13 shows the measured impedance of the battery, as a function of S o C , at the different frequencies being studied, after the battery was cycled 55 times. The results presented include the magnitude, the phase, and a Nyquist plot showing the variation at each S o C level.
The feature extraction from the measurements resulted in the ECM parameters presented in Figure 14. It shows the parameter evolution with S o C , along with the aging of the cell as the number of discharge/charge cycles increases. Although parameter R CT shows an increase when S o C lowers, this does not occur at S o C values close to 100 %. However, at higher S o C values, the Warburg coefficient, θ w , also increases. On the other hand, as the number of cycles increases (i.e., the cell ages) resistances R ohmic and R SEI increase for all S o C , while Q SEI decreases.
These findings suggest that, in particular, the evolution of R ohmic , R SEI , and Q SEI may serve as a robust indicator of S o H evolution, while R CT together with θ w can serve as markers for S o C variations. Additionally, as parameter α SEI is always unitary, C P E SEI is a capacitor, and thus, future work will consider this change to the ECM.

5. Conclusions

An impedance measurement system, specifically designed for LIBs, which has the ability to measure impedance under a range of S o C and S o H conditions has been developed. The system allows for battery characterization over variable charge/discharge C-rates, up to a 3 A maximum current.
The system generates a multisine current signal with 15 frequencies, spanning 50 mHz to 1 kHz, designed to capture electrochemical phenomena of the battery. Coherent generation/sampling is used to eliminate spectral leakage. Goertzel filters are thus used to efficiently estimate voltage and current frequency components with a 10 kHz sampling rate.
The design is compact but can be further optimized by integrating the microcontroller into the PCB and removing the charge/discharge circuits. This compact system, which measures battery impedance and has the potential to estimate S o C and S o H , may be seamlessly integrated into various battery applications.
The measurements performed showed that different S o C and S o H levels influence the impedance of the selected equivalent circuit. In particular, S o C can possibly be inferred from R CT and θ w , while S o H predominantly influences the components associated with the Solid Electrolyte Interfaces (SEIs) and the value of R o h m i c . Since the use of a single parameter may prove insufficient for S o H and S o C estimation, machine learning (ML) methods could be explored to automatically detect relevant characteristics from measured impedance and temperature data.
Although this study did not focus on the influence of the charge/discharge C-rate on battery impedance, this system can serve as a versatile framework for expanding battery analysis by considering the effects of different charging rates.

Author Contributions

Conceptualization, P.M.R., L.S.R. and F.M.J.; methodology, J.L. and P.M.R.; software, J.L., P.M.R. and F.M.J.; validation, L.S.R. and P.M.R.; investigation, J.L.; resources, L.S.R. and P.M.R.; writing—original draft preparation, J.L., P.M.R. and F.M.J.; writing—review and editing, P.M.R. and F.M.J. All authors have read and agreed to the published version of the manuscript.

Funding

This work was funded by FCT/MECI through national funds and, when applicable, co-funded EU funds under UID/50008: Instituto de Telecomunicações.

Data Availability Statement

Data are available on request from the authors.

Conflicts of Interest

The authors declare no conflicts of interest.

References

  1. Liang, Y.; Zhao, C.-Z.; Yuan, H.; Chen, Y.; Zhang, W.; Huang, J.-Q.; Yu, D.; Liu, Y.; Titirici, M.-M.; Chueh, Y.-L.; et al. A review of rechargeable batteries for portable electronic devices. InfoMat 2019, 1, 6–32. [Google Scholar] [CrossRef]
  2. Morris, M.; Tosunoglu, S. Comparison of rechargeable battery technologies. ASME Early Career Tech. J. 2012, 11, 148–155. [Google Scholar]
  3. Zhang, Y.; Zhang, C.; Zhang, X. State-of-charge estimation of the Lithium-ion battery system with time-varying parameter for hybrid electric vehicles. IET Control Theory 2014, 8, 160–167. [Google Scholar] [CrossRef]
  4. Hu, X.; Zou, C.; Zhang, C.; Li, Y. Technological developments in batteries: A survey of principal roles, types, and management needs. IEEE Power Energy Mag. 2014, 15, 20–31. [Google Scholar] [CrossRef]
  5. Luo, X.; Wang, J.; Dooner, M.; Clarke, J. Overview of current development in electrical energy storage technologies and the application potential in power system operation. Appl. Energy 2015, 137, 511–536. [Google Scholar] [CrossRef]
  6. Mohamad, F.; Teh, J.; Lai, C.; Chen, L. Development of Energy Storage Systems for Power Network Reliability: A Review. Energies 2018, 11, 2278. [Google Scholar] [CrossRef]
  7. International Energy Agency. Global EV Outlook. 2024. Available online: https://iea.blob.core.windows.net/assets/a9e3544b-0b12-4e15-b407-65f5c8ce1b5f/GlobalEVOutlook2024.pdf (accessed on 10 April 2025).
  8. Rahmani, P.; Chakraborty, S.; Mele, I.; Katrašnik, T.; Bernhard, S.; Pruefling, S.; Wilkins, S.; Hegazy, O. Driving the Future: A Comprehensive Review of Automotive Battery Management System Technologies and Future Trends. J. Power Sources 2025, 629, 235827. [Google Scholar] [CrossRef]
  9. Garche, J.; Jossen, A. Battery Management Systems (BMS) for Increasing Battery Lifetime. In Proceedings of the TELESCON 2000—Third International Telecommunications Energy Special Conference, Dresden, Germany, 7–10 May 2000; pp. 81–88, IEEE Cat. No. 00EX424. [Google Scholar] [CrossRef]
  10. Waag, W.; Fleischer, C.; Sauer, D.U. Critical review of the methods for monitoring of Lithium-ion batteries in electric and hybrid vehicles. J. Power Sources 2014, 258, 321–339. [Google Scholar] [CrossRef]
  11. Huang, S.-C.; Tseng, K.-H.; Liang, J.-W.; Chang, C.-L.; Pecht, M.G. An online SoC and SoH estimation model for Lithium-ion batteries. Energies 2017, 10, 512. [Google Scholar] [CrossRef]
  12. Braun, J.A.; Behmann, R.; Schmider, D.; Bessler, W.G. State of charge and state of health diagnosis of batteries with voltage-controlled models. J. Power Sources 2022, 544, 231828. [Google Scholar] [CrossRef]
  13. Colarullo, L.; Thakur, J. Second-life EV batteries for stationary storage applications in local energy communities. Renew. Sustain. Energy Rev. 2022, 169, 112913. [Google Scholar] [CrossRef]
  14. Roy, P.M.; Sawant, H.H.; Shelar, P.P.; Sarode, P.U.; Gawande, S.H. Battery health management—A perspective of design, optimization, manufacturing, fault detection, and recycling. Energy Storage Sav. 2024, 3, 90–208. [Google Scholar] [CrossRef]
  15. Chang, W.-Y. The state of charge estimating methods for battery: A review. Int. Sch. Res. Not. 2013, 1, 953792. [Google Scholar] [CrossRef]
  16. Zhang, J.; Lee, J. A review on prognostics and health monitoring of Li-ion battery. J. Power Sources 2011, 196, 6007–6014. [Google Scholar] [CrossRef]
  17. Murnane, M.; Ghazel, A. A Closer Look at State of Charge (SOC) and State of Health (SOH) Estimation Techniques for Batteries; Analog Devices Technical Note. 2017. Available online: https://www.analog.com/media/en/technical-documentation/tech-articles/a-closer-look-at-state-of-charge-and-state-health-estimation-tech.pdf (accessed on 10 April 2025).
  18. Xing, Y.; He, W.; Pecht, M.; Tsui, K.L. State of charge estimation of lithium-ion batteries using the open-circuit voltage at various ambient temperatures. Appl. Energy 2014, 113, 106–115. [Google Scholar] [CrossRef]
  19. Shrivastava, P.; Soon, T.K.; Idris, M.Y.; Mekhilefb, S. Overview of model-based online state-of-charge estimation using Kalman filter family for lithium-ion batteries. Renew. Sustain. Energy Rev. 2019, 113, 109233. [Google Scholar] [CrossRef]
  20. Hossain, M.; Haque, M.E.; Arif, M.T. Kalman filtering techniques for the online model parameters and state of charge estimation of the Li-ion batteries: A comparative analysis. J. Energy Storage 2022, 51, 104174. [Google Scholar] [CrossRef]
  21. Ren, Z.; Du, C. A review of machine learning state-of-charge and state-of-health estimation algorithms for lithium-ion batteries. Energy Rep. 2023, 9, 2993–3021. [Google Scholar] [CrossRef]
  22. Lee, S.; Lee, D. A novel battery state of charge estimation based on voltage relaxation curve. Batteries 2023, 9, 517. [Google Scholar] [CrossRef]
  23. Stiaszny, B.; Ziegler, J.C.; Krauß, E.E.; Zhang, M.; Schmidt, J.P.; Ivers-Tiffee, E. Electrochemical characterization and post-mortem analysis of aged LiMn2O4–NMC/graphite Lithium ion batteries part II: Calendar aging. J. Power Sources 2014, 258, 61–75. [Google Scholar] [CrossRef]
  24. Galeotti, M.; Cinà, L.; Giammanco, C.; Cordiner, S.; Di Carlo, A. Performance analysis and SOH (state of health) evaluation of lithium polymer batteries through electrochemical impedance spectroscopy. Energy 2015, 89, 678–686. [Google Scholar] [CrossRef]
  25. McCarthy, K.; Gullapalli, H.; Ryan, K.M.; Kennedy, T. Review—Use of Impedance Spectroscopy for the Estimation of Li-ion Battery State of Charge, State of Health and Internal Temperature. J. Electrochem. Soc. 2021, 168, 080517. [Google Scholar] [CrossRef]
  26. Kallel, A.Y.; Hu, Z.; Kanoun, O. Comparative Study of AC Signal Analysis Methods for Impedance Spectroscopy Implementation in Embedded Systems. Appl. Sci. 2022, 12, 591. [Google Scholar] [CrossRef]
  27. Meddings, N.; Heinrich, M.; Overney, F.; Lee, J.-S.; Ruiz, V.; Napolitano, E.; Seitz, S.; Hinds, G.; Raccichini, R.; Gaberšček, M.; et al. Application of electrochemical impedance spectroscopy to commercial li-ion cells: A review. J. Power Sources 2020, 480, 228742. [Google Scholar] [CrossRef]
  28. De Angelis, A.; Ramilli, R.; Crescentini, M.; Moschitta, A.; Carbone, P.; Traverso, P.A. In-situ electrochemical impedance spectroscopy of battery cells by means of binary sequences. In Proceedings of the IEEE International Instrumentation and Measurement Technology Conference (I2MTC), Glasgow, UK, 17–20 May 2021; pp. 1–5. [Google Scholar] [CrossRef]
  29. Kallel, A.Y.; Kanoun, O. On the design of multisine signals for maintaining stability condition in impedance spectroscopy measurements of batteries. J. Energy Storage 2023, 58, 106267. [Google Scholar] [CrossRef]
  30. Baccari, S.; Vasca, F.; Mostacciuolo, E.; Iannelli, L.; Sagnelli, S.; Luisi, R.; Stanzione, V. A characterization system for LEO satellites batteries. In Proceedings of the 2019 European Space Power Conference (ESPC), Juan-les-Pins, France, 30 September–4 October 2019; pp. 1–6. [Google Scholar] [CrossRef]
  31. Miguel, E.; Plett, G.L.; Trimboli, M.S.; Oca, L.; Iraola, U.; Bekaert, E. Review of computational parameter estimation methods for electrochemical models. J. Energy Storage 2021, 44, 103388. [Google Scholar] [CrossRef]
  32. Cicioni, G.; De Angelis, A.; Janeiro, F.M.; Ramos, P.M.; Carbone, P. Battery impedance spectroscopy embedded measurement system. Batteries 2023, 9, 577. [Google Scholar] [CrossRef]
  33. Wei, X.; Wang, X.; Dai, H. Practical on-board measurement of Lithium Ion battery impedance based on distributed voltage and current sampling. Energies 2018, 11, 64. [Google Scholar] [CrossRef]
  34. Chen, H.; Bia, J.; Wu, Z.; Song, Z.; Zuo, B.; Fu, C.; Zhang, Y.; Wang, L. Rapid impedance measurement of Lithium-Ion batteries under pulse ex-citation and analysis of impedance characteristics of the regularization distributed relaxation time. Batteries 2025, 11, 91. [Google Scholar] [CrossRef]
  35. Chang, B.-Y.; Park, S.-M. Electrochemical impedance spectroscopy. Annu. Rev. Anal. Chem. 2010, 3, 207–229. [Google Scholar] [CrossRef]
  36. Liu, Y.; Li, Q.; Wang, K. Revealing the degradation patterns of lithium-ion batteries from impedance spectroscopy using variational auto-encoders. Energy Storage Mater. 2024, 69, 103394. [Google Scholar] [CrossRef]
  37. Zhang, Y.; Tang, Q.; Zhang, Y.; Wang, J.; Stimming, U.; Lee, A.A. Identifying degradation patterns of lithium ion batteries from impedance spectroscopy using machine learning. Nat. Commun. 2020, 11, 1706. [Google Scholar] [CrossRef]
  38. De Angelis, A.; Buchicchio, E.; Santoni, F.; Moschitta, A.; Carbone, P. Practical broadband measurement of battery EIS. In Proceedings of the 2021 IEEE International Workshop on Metrology for Automotive (MetroAutomotive), Bologna, Italy, 1–2 July 2021; pp. 25–29. [Google Scholar] [CrossRef]
  39. Buchicchio, E.; De Angelis, A.; Santoni, F.; Carbone, P.; Bianconi, F.; Smeraldi, F. Dataset on broadband electrochemical impedance spectroscopy of Lithium-ion batteries for different values of the state-of-charge. Data Brief 2022, 45, 108589. [Google Scholar] [CrossRef]
  40. De Angelis, A.; Carbone, P.; Moschitta, A.; Crescentini, M.; Ramilli, R.; Traverso, P.A. A Fast and Simple Broadband EIS Measurement System for Li-ion Batteries. In Proceedings of the 24th IMEKO TC4 International Symposium, Pordenone, Italy, 20–21 September 2020; pp. 157–161. Available online: https://www.imeko.org/publications/tc4-2020/IMEKO-TC4-2020-30.pdf (accessed on 10 April 2025).
  41. Ojarand, J.; Min, M. Recent advances in crest factor minimization of multisine. Elektron. Elektrotech. 2017, 23, 59–62. [Google Scholar] [CrossRef]
  42. Janeiro, F.M.; Hu, Y.; Ramos, P.M. Peak factor optimization of multi-harmonic signals using artificial bee colony algorithm. Measurement 2020, 150, 107040. [Google Scholar] [CrossRef]
  43. Kallel, A.Y. Design of Optimized Broadband Excitation Signals for Consistent Impedance Spectroscopy Measurements. Ph.D. Thesis, Technische Universität Chemnitz, Chemnitz, Germany, 2024. [Google Scholar]
  44. Zhang, Z.; Jiang, L.; Zhang, L.; Huang, C. State-of-charge estimation of Lithium-ion battery pack by using an adaptive extended Kalman filter for electric vehicles. J. Energy Storage 2021, 37, 102457. [Google Scholar] [CrossRef]
  45. Zhang, Z.; Zhang, L.; Hu, L.; Huang, C. Active cell balancing of Lithium-ion battery pack based on average state of charge. Int. J. Energ. Res. 2020, 44, 2535–2548. [Google Scholar] [CrossRef]
  46. Ningrum, P.; Windarko, N.A.; Suhariningsih, S. Estimation of state of charge (SoC) using modified coulomb counting method with open circuit compensation for battery management system (BMS). JAREE J. Adv. Res. Electr. Eng. 2021, 5, 15–20. [Google Scholar] [CrossRef]
  47. Rodrigues, N.M.; Janeiro, F.M.; Ramos, P.M. Implementation of Goertzel-based frequency estimation for power quality monitoring in embedded measurement systems. Metrol. Meas. Syst. 2022, 39, 142270. [Google Scholar] [CrossRef]
  48. Regnacq, L.; Wu, Y.; Neshatvar, N.; Jiang, D.; Demosthenous, A. A Goertzel filter-based system for fast simultaneous multi-frequency EIS. IEEE Trans. Circuits Syst. II Express Briefs 2021, 68, 3133–3137. [Google Scholar] [CrossRef]
  49. Kanoun, O.; Kallel, A.Y. High-performance efficient embedded systems for impedance spectroscopy: Challenges and potentials. Electrochim. Acta 2024, 492, 144351. [Google Scholar] [CrossRef]
  50. Orazem, M.E.; Ulgut, B. On the proper use of a Warburg impedance. J. Electrochem. Soc. 2024, 171, 040526. [Google Scholar] [CrossRef]
  51. Janeiro, F.M.; Ramos, P.M. Application of genetic algorithms for estimation of impedance parameters of two-terminal networks. In Proceedings of the IEEE International Instrumentation and Measurement Technology Conference, Singapore, 5–7 May 2009; pp. 602–606. [Google Scholar] [CrossRef]
Figure 1. One period of the crest factor-optimized multisine voltage.
Batteries 11 00227 g001
Figure 2. The measured spectrum of the crest factor-optimized voltage in Figure 1.
Batteries 11 00227 g002
Figure 3. The architecture of the developed system. The three switches are controlled by the MCU to select the system operating mode: charging; discharging; or performing EIS impedance measurements.
Batteries 11 00227 g003
Figure 4. A flowchart of the main algorithm for stimulus generation, the acquisition of voltage and current samples, the calculation of the Goertzel filters, and impedance estimation.
Batteries 11 00227 g004
Figure 5. Custom PCB of the developed analog front end to measure the battery impedance, and perform automated charge/discharge cycles.
Batteries 11 00227 g005
Figure 6. Improved Howland Current Pump (IHCP) circuit.
Batteries 11 00227 g006
Figure 7. Current measurement circuit.
Batteries 11 00227 g007
Figure 8. The circuit for generating the DC component of the measured battery voltage.
Batteries 11 00227 g008
Figure 9. Battery EIS voltage response, V AC ( t ) = V BAT ( t ) V DC , of measurement circuit.
Batteries 11 00227 g009
Figure 10. Overview of the different stages during a full discharge/charge cycle. The battery voltage and current are shown for the discharge (a) and charge (c) processes. After each discharge or charge, there are rest periods, where the battery voltage is monitored, shown in (b,d), respectively.
Batteries 11 00227 g010
Figure 11. Average and standard deviation of the impedance magnitude (a) and phase (b) at S o C 40   % . .
Batteries 11 00227 g011
Figure 12. ECM used for EIS data fitting.
Batteries 11 00227 g012
Figure 13. A batch of EIS measurements after 55 charge/discharge cycles. The blue dots represent the impedance measurements, while the black lines show the ECM-fitted response: (a) impedance magnitude; (b) impedance phase; (c) Nyquist plot.
Batteries 11 00227 g013
Figure 14. A comparison of ECM parameters for different S o C values as the battery ages through charge/discharge cycles. (a) R ohmic , (b) L, (c) θ w , (d) R SEI , (e) Q SEI , (f) α SEI , (g) R CT , (h) Q CT , (i) α CT .
Batteries 11 00227 g014
Table 1. Comparison between proposed system and other microcontroller-based EIS measurement systems.
Frequency RangeMeasured FrequenciesStimulusImpedance
Estimation Algorithm
Battery
Charge/Discharge
Proposed
system
0.05–1000 Hz15Multisine PWM-generatedGoertzel filtersIncluded
[32]0.5–5000 Hz39Sum of two PWM-generated
multisine signals
FFTExternal
[33]0.1–500 Hz16Sine-SweepDigital lock-in
amplifier based on
cross-correlation
Not Specified
[34]0.1–100 Hz24Sweep of a square signal using
3 frequency components for each
input frequency
FFTExternal
Disclaimer/Publisher’s Note: The statements, opinions and data contained in all publications are solely those of the individual author(s) and contributor(s) and not of MDPI and/or the editor(s). MDPI and/or the editor(s) disclaim responsibility for any injury to people or property resulting from any ideas, methods, instructions or products referred to in the content.

