Abstract
Particles ejected during thermal runaway (TR) of lithium-ion batteries carry a significant fraction of the total TR energy and can cause danger to other components in the battery system. The associated safety hazards should be addressed in the battery pack development process, which requires a deep understanding of TR particle characteristics. In this study, these characteristics are determined by applying several measurement techniques. Among them, dynamic image analysis and large particle image processing are applied to battery abuse particles for the first time, allowing their size and shape to be quantified in detail. Particles are collected from three overheating tests on a prismatic 51 Ah NMC622 cell under vacuum conditions in an autoclave environment. Battery abuse particles cover a wide size range, from micrometers to millimeters, with the largest particle reaching 51.4 mm. They are non-spherical, whereby sphericity, symmetry, and aspect ratio decrease for larger particles. Re-solidified copper droplets and intact separator pieces indicate particle temperatures of ~200–1100 °C at the time of cell ejection. Particles are partially combustible, with an exothermic onset at ~500 °C associated with graphite oxidation. Reactivity is non-linearly size dependent. Implications of these findings for battery system development are discussed.
1. Introduction
The ongoing shift towards carbon-neutral energy sources in the context of global climate change has led to an increasing demand for battery systems in mobile and stationary storage applications [1]. Current battery systems are mainly based on lithium-ion battery (LIB) technology, which offers high energy density but can pose serious safety hazards in the form of battery fires [2]. Battery fire incidents have been frequently reported [3], maintaining public safety concerns and preventing the rapid spread of battery technology [4]. To promote attention to battery fire safety, authorities have introduced several standards and regulations. In automotive applications, e.g., GB38031-2020 [5] effective in China and ECE R100 Rev3 [6] effective in the European Union (EU), a minimum of five minutes is required between an actual fire outside the battery pack and a warning to the driver of a potential fire risk. In aeronautic applications, for example, RTCA DO-311A [7] regulates the allowable fire behavior based on different venting categories. In stationary storage applications, for example, EU Regulation 2023/1542 [8] requires fire safety testing.
Thermal runaway (TR) triggered by various events is believed to be the root cause of the majority of battery fires [9]. It denotes an uncontrollable increase in cell temperature caused by exothermic reactions within a battery cell that can spread to neighboring cells, known as thermal propagation (TP) [6]. TR is often accompanied by a significant release of toxic and flammable gases and solid particles, causing serious safety hazards beyond fires [10]. To develop effective TP countermeasures in battery system designs, the TR characteristics of the cell, as the smallest safety-relevant unit, must be carefully examined.
Over the past two decades, a large number of TR-related studies have been conducted. Researchers have evaluated key influencing factors such as cell chemistry, cell size, cell format, state of charge (SOC), state of health (SOH), TR triggering method, and environmental conditions on key TR characteristics such as total energy release, self-heating onset, TR onset and maximum temperature, cell mass loss, and degassing characteristics [11,12,13,14,15,16,17,18,19]. Consequently, several attempts have been made to derive the main TR decomposition pathways [20,21,22,23,24,25] and different modeling approaches were developed for TR, TP, vent gas and particle flow, and combustion [26,27,28,29,30,31,32,33].
The mass loss during TR can be categorized into vent gases, including decomposition gases and vaporized electrolyte, liquid electrolyte droplets, and solid particle ejecta. Over 40 different vent gas components have been identified using various analytical methods. , , and have the largest mole fractions in all types of LIBs, with liquid electrolyte followed by short-chain hydrocarbons, vaporized electrolyte, and fractions of longer-chain hydrocarbons (C4 and higher) [12,13,34,35,36,37,38,39,40,41,42,43,44,45]. Additionally, Zhou et al. measured dozens of toxic gas traces from various abused batteries with different SOC [46].
In recent years, special attention has been paid to TR vent particles, acknowledging their importance in TR and TP behavior. A summary of the major studies is given in Table 1. Key results are discussed alongside the findings of this paper. Additionally, Li et al. provide a review of the current literature on TR particles [47,48].

Table 1.
Battery abuse particle analyses: literature summary.
Particles of (NMC), and (LFP) cells were analyzed by various techniques, including sieve analysis (SA) and laser diffraction (LD), for particle size distribution; scanning electron microscopy (SEM) and optical microscopy (OM) for particle morphology; energy dispersive X-ray spectroscopy (EDS), X-ray diffraction (XRD), inductively coupled plasma combined with mass spectrometry (ICP-MS), ion chromatography (IC), elemental analysis (EA), X-ray fluorescence (XRF), Fourier-transform infrared spectroscopy (FTIR), and gas chromatography coupled with mass spectrometry (GC–MS) for chemical composition; combined differential scanning calorimetry (DSC) and thermogravimetric analysis (TGA), also known as simultaneous thermal analysis (STA), explosion risk test (ERT), and STA coupled with FTIR for reactivity.
The above characteristics can be used to develop venting strategies such as particle filters, design proper shielding of vulnerable battery system components such as the high-voltage circuit, and provide input for respective simulation models. Appropriate safety measures can be defined for the handling of burned battery cells and systems. Recently, the risk of arcing in battery systems caused by vented TR particles was recognized by independent research groups [57,58]. Further, the impact of particle emissions on the environment and human health was studied [59,60,61,62,63]. Xu et al. investigated the health effects of soot particles collected during TR from LFP and NMC cells and found that “battery soot can cause significant damage to the human respiratory and nervous systems” [62]. Depending on wind and fire size, respirable particles from battery fires can be transported several kilometers through the atmosphere, potentially contaminating a large area [64]. Therefore, understanding the characteristics of ejected particles is essential for safe battery pack design.
In this work, the settleable particle emissions caused by thermal runaway of a commercial prismatic 51 Ah lithium-ion battery with NMC622 cathode chemistry are thoroughly studied. The particle size distribution is analyzed by means of sieve analysis. Furthermore, dynamic image analysis (DIA) and large particle image processing are applied for the first time to determine particle size and shape. Particle morphology is additionally investigated by optical microscopy and SEM. Elemental composition is studied by EDS and the thermal oxidation behavior is examined by STA. The results are compared to the latest literature and potential design guidelines for battery packs are discussed.
2. Materials and Methods
In this chapter, the test cell, the cell thermal runaway characterization procedure, the particle sampling method, and the different particle analyses are described.
2.1. Test Cell
The LIB tested is a commercial prismatic cell with NMC622 cathode active material, graphite anode, and a capacity of 51 Ah. Key cell properties can be found in Table 2.
Table 2.
Key properties of the tested lithium-ion cell.
2.2. Cell Thermal Runaway Characterization
Three repetitive overtemperature abuse tests with one-sided heating were conducted in a 242 L thermally insulated autoclave, shown in Figure 1. The outer wall of the autoclave was instrumented with thermocouples (TC) in order to calculate the energy released by the thermal runaway based on an energy balance of all components. Several thermocouples were also placed inside the autoclave to monitor changes in the temperature of the cell and the gases. Applying the ideal gas law, a pressure measurement was used to determine the amount of vent gas generated during the TR.
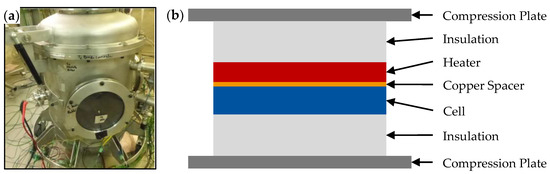
Figure 1.
Photo of the autoclave without thermal insulation (a) and schematic illustration of the test jig used (b).
The tests were performed under vacuum conditions to minimize oxidation of vent gases and particles. The cell was compressed by two plates and four screws with a torque of 3 Nm in a stack of different materials: insulation, copper spacer for TC instrumentation, and heater (Figure 1b). Before each test, the cell was charged to 100% SOC. In conjunction with the RTCA DO-311A standard [7], the temperature ramp to initiate thermal runaway was controlled to be 6 K/min. After TR was triggered, the heater was turned off. When the autoclave had completely cooled for at least 12 h, it was opened to collect the particles.
2.3. Particle Sampling
The particle sampling method can have a significant impact on all subsequent analyses. It should sample each particle as a whole, without significantly affecting its properties, such as shape or size. In this study, after each TR test, and after allowing sufficient time for the particles to cool and settle, the particles in the autoclave were sampled with a vacuum cleaner. For each test, a new filter was placed in the vacuum cleaner and the filters were weighed differentially to determine the mass of particles sampled. Although very fine and/or wet dust could not be completely removed from the autoclave, it was determined to be a very small fraction of the total amount of particles. To perform the particle analyses, the vacuum cleaner filters were cut open, the particles were sampled in different containers for each test, and the remaining mass of dust trapped in the filter was documented by differential weighing. With this method, only a few mass percent of the particles were lost.
2.4. Sieve Analysis
Sieve analysis is performed to fractionate the particle probes into different size groups and measure a mass-weighted size distribution. Particle sample #3 was sent to an external laboratory. The probe was sieved using the Analysette 3 Pro vibratory sieve shaker (Fritsch GmbH, Idar-Oberstein, Germany) and nine meshes: 32 µm, 45 µm, 63 µm, 90 µm, 125 µm, 250 µm, 500 µm, 1000 µm, and 2000 µm, creating ten different fractions for further analysis. Agate spheres were placed on each sieve to speed up the sieving process and to prevent mesh clogging. Particle sample #2 was later sieved using the AS 200 Control vibratory sieve shaker (Retsch GmbH, Haan, Germany) and eight meshes: 25 µm, 40 µm, 63 µm, 125 µm, 250 µm, 500 µm, 1000 µm, and 2000 µm to determine a second size distribution. No additional sieving aids were used in this test.
2.5. Dynamic Image Analysis
Sieve analysis measures only a few discrete points in the particle size distribution. This requires a priori knowledge of the expected distribution in order to select appropriate mesh sizes. In addition, the sieve meshes are subject to tolerances, the minimum mesh size is typically limited to 20 µm and only one characteristic size, the minimum particle diameter that fits through the square holes in the sieve mesh, can be determined. For LIB vent gas particles, a significant mass fraction is expected to be below the minimum mesh size and the particles are non-spherical [49,53,54]. Therefore, dynamic image analysis (DIA) according to ISO 13322-2 [65] was used in this work to resolve the particle size distribution well and to obtain additional information on the particle shape. Particle sample #1 was analyzed using the CAMSIZER X2 (Microtrac Retsch GmbH, Haan, Germany) with the X-Jet compressed air module and a 14 × 4 mm2 dispersion nozzle to separate the particles well. Particles were sieved through a 2 mm mesh prior to analysis to avoid clogging the nozzle with large particles. Representative probes from sample #1 were generated using a sample splitter. Two probes were measured.
The DIA obtains 2D images of the particles as they pass through the dual camera system. Figure 2 summarizes typical size and shape parameters used to determine morphological characteristics.
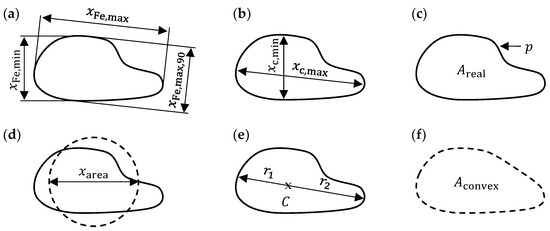
Figure 2.
Dynamic image analysis: particle size and shape characteristics (schematic visualization)—(a) Feret diameters; (b) chord lengths; (c) circumference and area; (d) area equivalent circle diameter; (e) radii for symmetry calculation; (f) convex area.
The Feret diameter (Figure 2a) is the distance between two parallel outer planes as measured with a caliper. Similarly, the chord length (Figure 2b) is the largest possible internal distance between two points on the particle circumference in a given direction. In this paper, the aspect ratio is defined by the minimum chord length and the maximum Feret diameter as implemented in the CAMSIZER X2 software:
The sphericity of a particle can be calculated from its area and circumference (Figure 2c):
A common size measure for non-spherical particles is the area equivalent circle diameter (Figure 2d). The particle symmetry is given by (Figure 2e):
where and are the colinear radii from the centroid . Convexity can be judged by comparing the real area with the convex area (Figure 2f):
In general, values close to one represent perfectly round, symmetrical, and convex particles. Values close to zero represent long, non-circular, asymmetric, and concave particles, respectively. To plot volumetric cumulative distribution functions (CDF) from the above parameters, particle volumes are calculated as implemented in the CAMSIZER X2 software. Curves plotted over the equivalent circle diameter use sphere volumes :
Curves of all other characteristic lengths are built from ellipsoid volumes :
2.6. Large Particle Image Processing
Large particles can pose several threats in battery systems. They can clog vent paths and pressure relief devices. They further carry significant thermal energy and create low-velocity wake regions in the vent gas stream, potentially acting as ignition sources [55]. They can also bridge parts at different electrical potentials, resulting in arcing [57]. Sieved particles > 2 mm were analyzed by image processing to obtain their morphological characteristics. The particles were manually laid out on a DIN A3 paper, separated by material and roughly ordered by size. Four groups of particles were identified based on their appearance and color: copper foil-based particles, aluminum foil-based particles, completely black particles that are either metal droplets covered with active material dust or partially burnt plastics, and gray non-metallic particles such as separator foil or terminal insulation. High-resolution top-down photographs were taken, and the four separate groups were individually weighed. The particle images were post-processed in MATLAB R2023a to obtain the same characteristics as for the DIA described in Section 2.5.
2.7. Light Microscopy
Light microscopy was applied to the fractionated particles of sample #3 to determine morphological differences between the various size groups and to detect visible anomalies. The VH-S30K (Keyence Deutschland GmbH, Neu-Isenburg, Germany) with two different lenses, VH-Z20R (magnification: 20–200) and VH-Z100R (magnification: 100–1000), was used for this study.
2.8. SEM/EDS Analysis
The same probes were analyzed by means of scanning electron microscopy (SEM) to obtain higher resolution and reveal more details. Furthermore, energy dispersive X-ray spectroscopy (EDS) was applied to determine the elemental composition of various particles and to infer their origin in the battery cell. The Zeiss Gemini SEM 300 (Carl Zeiss AG, Oberkochen, Germany) with an EDS detector UltimMax 65 (Oxford Instruments plc, Abingdon, UK) was used in this study. Secondary electron (SE) and backscattering electron (BSE) images were taken. SE images better resolve surface topology, while BSE images allow light and heavy probe atoms to be distinguished by dark and bright pixels, respectively.
2.9. Simultaneous Thermal Analysis
Simultaneous thermal analysis (STA) combines differential scanning calorimetry (DSC) and thermogravimetric analysis (TGA) to measure the heat release and mass change of a probe under a given atmosphere and temperature profile. Conclusions can be drawn about the chemical reactivity and other thermal processes such as phase-change. In the context of vent gas particles, this information is particularly valuable in assessing the risk of particle combustion in an oxidative environment, such as when ejected from a battery pack. In addition, specific features in the STA curve evaluation can be used to trace and confirm the chemical composition of the particles.
In this study, the STA 449 F3 Jupiter® (NETZSCH-Gerätebau GmbH, Selb, Germany) was used for the analysis. The diametrically fractionated probes of particle sample #3 were measured using the settings and conditions listed in Table 3. The 500–1000 µm sample was initially analyzed with a temperature ramp of 10 K/min. Minor mass change and heat flow were detected, thus only fractions with sizes < 500 µm were investigated in detail. For the fractions < 32 µm and 250–500 µm, the 10 K/min ramp was tested three times to analyze the repeatability of the results. Prior to the test series, the instrument was calibrated for the same boundary conditions using eight metallic melting calibration standards to cover the temperature range investigated.
Table 3.
Settings and conditions for the simultaneous thermal analysis.
3. Results and Discussion
This chapter presents the experimental results and highlights key findings. They are further placed in the context of current research.
3.1. Cell Thermal Runaway Behavior
Vent particle characteristics are linked to the specific cell thermal runaway behavior, which is, therefore, the subject of our initial investigation. Figure 3 shows the time-dependent average temperature profiles on the heated cell side , the non-heated cell side , and in front of the vent , as well as the autoclave pressure , cell voltage , and produced vent gas quantity profiles for test #1. Results for test #2 and test #3 are shown in Figures S1 and S2 of the Supplementary Materials. Additionally, images of the cells after TR are summarized in Figure S3.
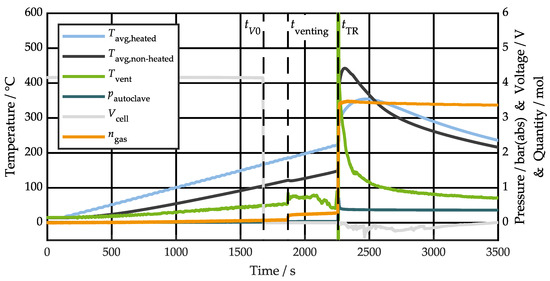
Figure 3.
Time-dependent temperature , pressure , cell voltage , and gas quantity profiles, as well as characteristic timestamps for voltage drop , first venting , and thermal runaway for test #1.
Four characteristic timestamps can be identified in each test: the drop in cell voltage due to the triggering of the built-in current interrupt device, the cell vent opening due to internal pressure build-up caused by electrolyte vaporization and gas production from side reactions, the thermal runaway onset defined at a temperature rise rate of 1 K/s due to the rate increase of chemical reactions and/or internal short circuit, and the time of peak temperature , which is individual for each thermocouple measurement.
Table 4 summarizes the key results of the three thermal runaway tests. During TR, the cells lost approximately 60% of their mass as vent gases and particles. Similar values have been observed for a NMC622 60 Ah prismatic cell [12], a NMC622 60 Ah pouch cell [13], and a NMC811 157 Ah prismatic cell [15] with 47%, 56%, and 53–78%, respectively. Roughly two thirds of the ejected mass could be collected as particles after the tests. The residual mass accounts for vent gases, condensed electrolyte, and residue particles that could not be extracted by vacuum cleaning. From the particles in the vacuum cleaner filters, approx. 95% of their mass could be sampled into vials for further analyses, proving the feasibility of the sampling method.
Table 4.
Summary of thermal runaway test results.
The cell temperature measurements at the timestamps , , and are very similar between the tests. During the main TR event, the test results naturally differ from each other due to the explosive behavior of the cell, which strongly influences the exact reaction process [15]. The venting time and the molar quantity of gases is comparable between tests. The capacity specific gas release aligns well with similar capacity NMC622 cells [12,13,42]. Gas temperature measurements in front of the cell vent failed except for test #2, where the thermocouple was presumably displaced from the main flow during venting. Failed thermocouples indicate gas/particle flow temperatures of above 1100 °C in this setup. Accurate time-dependent gas temperature measurements are challenging to obtain in the particle-laden, high-velocity vent jet. However, Essl et al. measured a peak gas temperature of 1169 °C for a similar cell in a nitrogen atmosphere [12]. Based on an energy balance that considers the increase in internal energy of all setup components [66], the TR heat release can be estimated to be about 1 MJ, which correlates to approximately 1.5 times the electrical energy stored in the cell at 100% SOC. Grossetete et al. calculated a factor of 1.2 for a 144 Ah prismatic NMC cell using the same method [66].
Overall, the similarity of results among the three tests validates the test setup and allows assumption of comparable characteristics of the particle samples for further analysis. The cell under investigation shows typical TR behavior compared to similar cells in the literature. Therefore, the following particle analyses are considered representative for this type of cell.
3.2. Particle Size and Shape Distribution
Particle size and shape are important parameters to develop filtering concepts or to parameterize particle simulation models. Figure 4 displays the results of the two sieve analyses of samples #2 and #3 in the form of a mass-weighed cumulative distribution function (CDF) and the mass fraction per sieve over the sieve mesh size. Ninety-five percent of the particles have a size below 1 mm, while 60% of the particles are smaller than 63 µm. The two independent measurements are in good agreement, especially for particles larger than 63 µm. Fine particles show some variation due to the different mesh sizes used and the addition of sieve aids for sample #3. The accuracy of sieve analysis is generally limited for small particles and typically underpredicts the contribution of small size particles.
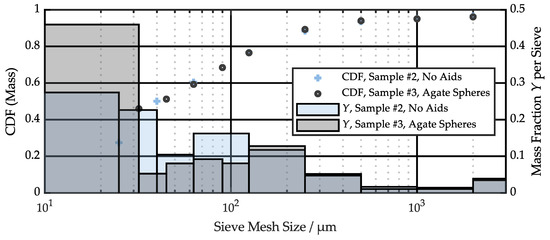
Figure 4.
Particle size distribution measured by sieve analysis.
To obtain a more accurate size distribution for the significant fraction of small particles, DIA was applied to sample #1. The two runs conducted show very similar behavior, proving the reproducibility of the results (Figure 5). The three different curves for , , and are separated from each other, illustrating the non-spherical nature of the battery abuse particles. For spherical particles, all three curves would be identical. Taking the equivalent circle diameter as a reference, the characteristic particle sizes D10, D50, and D90 are 10.3 µm, 60.8 µm, and 541 µm for run #1, and 10.4 µm, 63.7 µm, and 457 µm for run #2. D10, D50, and D90 are percentile values, and indicate the particle size below which 10%, 50%, and 90% of all particles are found. Some exemplary particle images taken during the DIA run #1 can be found in Figure S4.
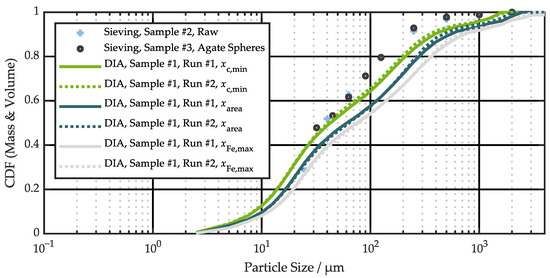
Figure 5.
Comparison of particle size distribution measured by sieve analysis and dynamic image analysis (DIA).
The sieve analysis results are also shown in Figure 5, normalized to CDF (2 mm) = 1, since the DIA was performed on pre-sieved particles smaller than 2 mm. As explained in Section 2.5, the sieving results correlate best with the minimum chord length . However, for large particles, there is an offset accumulating between the two measurements down to 250 µm. For smaller particles, this offset decreases, and the curves intersect at ~30 µm. Note that the DIA CDF are volume-based, while the sieve analysis CDF are mass-based. This difference, along with the multi-material particle probes, may be possible explanations for the deviations between the two measurement methods. Further, small particles are underrepresented in the sieve analysis, but are well captured by DIA.
Table 5 places the size characteristics of this study in the context of the available literature data. The particles in this work have comparatively small D10 and D50 values, with D90 values well within the range of other studies. Notably, all other studies applied laser diffraction compared to DIA in this work. Even for cells with similar shape, capacity, and cathode active material, significant differences in size can be observed. Therefore, when comparing particle size distributions, it is advisable to consider the methods of particle sampling, handling, and analysis, since all these parameters may influence the results. Compared to the prismatic cells, cylindrical cells showed different characteristics. Chen et al. observed very narrow size ranges for different boundary conditions with D90 values not exceeding 240 µm [50]. On the other hand, Garcia et al. found ~20–30% of particles to be larger than 400 µm for a 18650 NMC811 cell depending on the SOC [56].
Table 5.
Comparison of characteristic particle sizes from literature.
In addition to the micrometer to millimeter particles mentioned above, nanoparticles are emitted during TR. Barone et al. studied TR aerosols and found nanoparticles smaller than 1 µm [52]. Garcia et al. detected nanoparticles down to 96 nm at 100% SOC, 18 nm at 75% SOC, and 48 nm at 50% SOC [56]. Nanoparticles deserve special attention because they can penetrate deeply into the human respiratory system.
An advantage of DIA is the capability to analyze particle shape in addition to particle size. The sphericity, symmetry and aspect ratio of the particles are plotted against the equivalent circle diameter and as CDF in Figure 6. Again, the two individual runs agree well. Only for very large particles, stochastic differences can be observed due to low particle counts. The particles are clearly non-spherical, with lower sphericity for particle sizes between ~30–60 µm and above ~500 µm (Figure 6a). The volume-based median sphericity is 0.77 (Figure 6b). Particle symmetry is high, except for very large particles (Figure 6c) with a volume-based median symmetry of 0.90 (Figure 6d). Aspect ratio is comparatively low, decreasing for larger particles (Figure 6e) with a volume-based median value of 0.71 (Figure 6f).
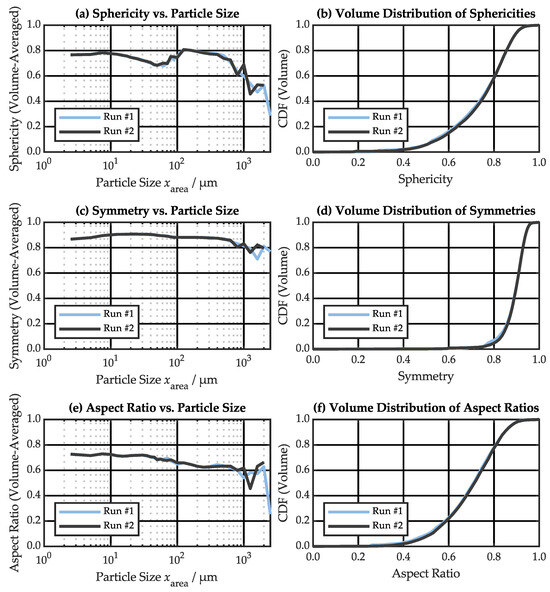
Figure 6.
Particle shape characteristics measured by dynamic image analysis (DIA): (a,b) sphericity, (c,d) symmetry, (e,f) aspect ratio.
To the best of the authors’ knowledge, TR abuse particle shapes have not been previously quantified in the literature. However, non-spherical particles experience higher drag force in a two-phase flow [67], highlighting the need for accurate particle shape measurements for reliable numerical simulations. Furthermore, non-spherical particles have a more scattered deflection pattern during wall interactions, because the deflection angle depends on the rotation angle of the particles at the time of impact. This makes it more challenging to predict wall interactions for such particles.
3.3. Large Particle Characteristics
Large particles can block vent channels and filters in the battery system and carry significant energy to potentially act as an ignition source for the flammable vent gas. For the purpose of this study, large particles are defined as particles that can be sieved through a 2 mm mesh. Images of these particles from sample #3, sorted by appearance on DIN A3 papers, are shown in Figure 7. Images of samples #1 and #2 can be found in Figure S5 and Figure S6, respectively. Foil pieces from the copper and aluminum current collectors as well as the separator show significant folding, presumably due to fluid forces and wall interactions during venting, resulting in arbitrary shapes. In the black category, partially burned plastics and re-solidified metal droplets covered by active material dust can be identified.
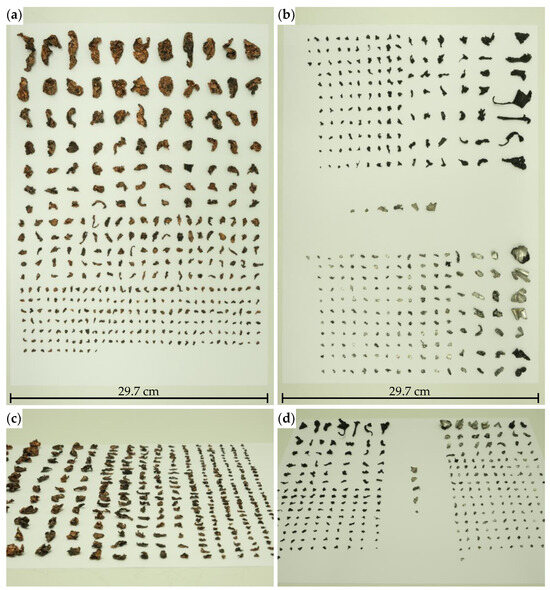
Figure 7.
Images of sorted copper-based (a,c) as well as aluminum-based, gray non-metallic, and “black” particles (b,d) > 2 mm from sample #3.
Table 6 summarizes the number and mass of large particles per material class for all three TR tests conducted. Copper-based particles have the highest contribution in terms of number and mass. Aluminum-based and black particles are similar in number, with black particles weighing significantly more. Gray non-metallic particles have a minor contribution to number and mass. Notably, the venting behavior of cell #1 was less explosive (see also Table 4), and therefore, fewer large particles were ejected in this test. Also, the number of gray non-metallic particles, consisting primarily of separator foil pieces, was higher in test #1, indicating a lower temperature during venting.
Table 6.
Number and mass of large particles split by material class for all three samples.
Figure 8 shows the large particle size characteristics split by material class as cumulated count and volume specific CDF for sample #3. The results for sample #1 and sample #2 can be found in Figure S7 and Figure S8, respectively. Significant differences between the three CDF can be observed, highlighting the non-spherical shape. The majority of particles has a minimum chord length between 2–6 mm, an equivalent circle diameter between 3–9 mm, and a maximum Feret diameter between 4–11 mm. However, there is a significant proportion with larger dimensions. Copper-based particles dominate in this section. Due to the relatively low number of large particles, they are considered individual events, and the results vary between tests.
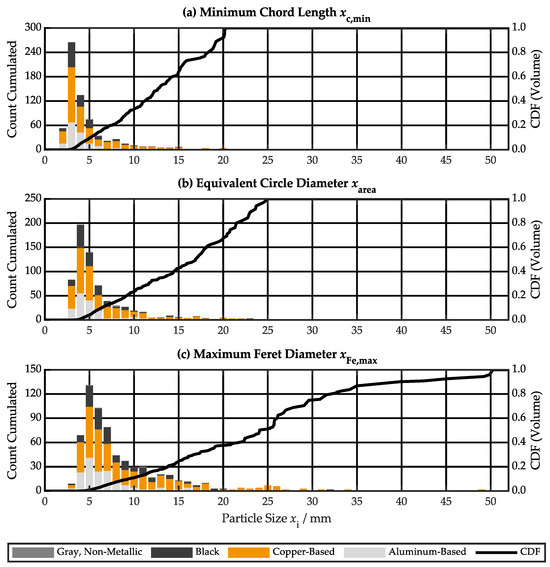
Figure 8.
Large particle size characteristics split by material class as cumulated count and volume-specific cumulative distribution function (CDF) for sample #3: (a) minimum chord length , (b) equivalent circle diameter , (c) maximum Feret diameter .
Table 7 summarizes selected large particle size characteristics split by material class for all three samples for further quantification. The largest particles are several centimeters in size. In accordance with the cell vent opening, the minimum chord length of the largest particles is limited to less than 26 mm. Approximately 90% of the large particles have a maximum Feret diameter greater than 5 mm. Over 30% of the large copper-based particles and almost 20% of the large aluminum-based particles have a maximum Feret diameter greater than 10 mm. This cumulates to 168 conductive particles with a maximum size greater than 10 mm for sample #3.
Table 7.
Selected large particle size characteristics split by material class for all three samples.
Figure 9 illustrates the large particle shape characteristics split by material class as cumulated count and volume-specific CDF for sample #3. Results for sample #1 and sample #2 can be found in Figure S9 and Figure S10, respectively. All material classes show a wide range of sphericities, symmetries and aspect ratios. The volume-based medians for sphericity (Figure 9a), symmetry (Figure 9b), and aspect ratio (Figure 9c) are 0.74, 0.79, and 0.55, respectively. Sphericity is slightly lower, while symmetry and aspect ratio are significantly lower than for the particles < 2 mm.
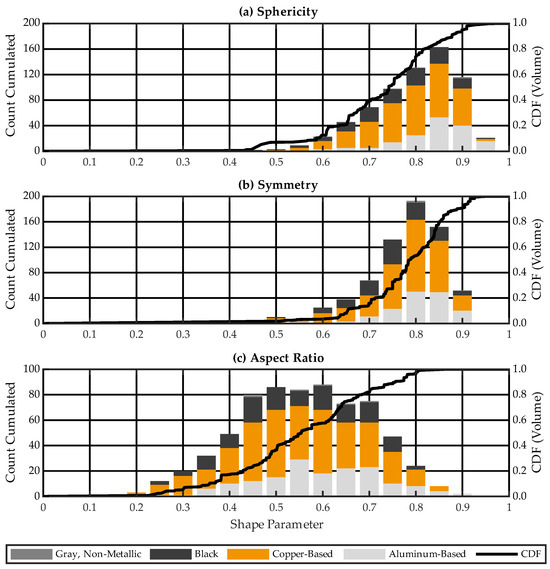
Figure 9.
Large particle shape characteristics split by material class as cumulated count and volume-specific cumulative distribution function (CDF) for sample #3: (a) sphericity, (b) symmetry, (c) aspect ratio.
Large particles have received little attention in previous research. However, Ledinski et al. highlighted the electrical shorting potential of current collector pieces in a battery pack and found 60 copper particles larger than 5 mm for an NMC 66 Ah pouch cell [57], which is significantly lower than the numbers found here. This study adds to the research on large particles by applying well known methods to quantify size and shape based on material classes in alignment with other imaging techniques such as DIA.
3.4. Microscopic Investigations
Microscopic scale investigations reveal particle properties that can be traced back to their cell origin and point to specific TR features. Optical microscopy images of the sieved size fractions of sample #3 are shown in Figure 10, ranging from below 32 µm to 2 mm. Across all size categories, the particles can be classified as a heterogeneous mixture with various shapes.
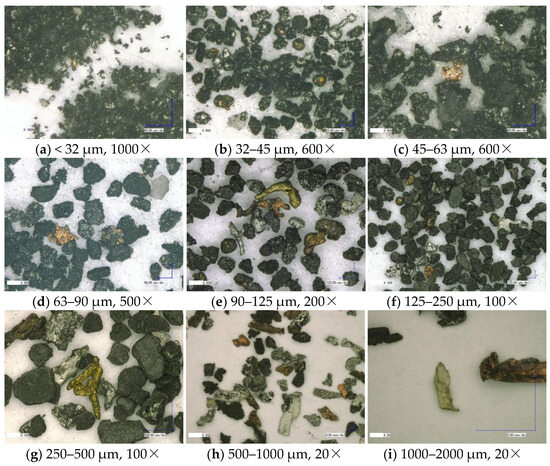
Figure 10.
Optical microscopy images of sample #3 particle fractions with different sizes.
Particles smaller than 250 µm are predominantly black with silver sprinkles. The black colored particles presumably originate from the active materials inside the cell. Two types of black particles can be observed: re-solidified metal melt covered with black dust and black chunks sprinkled with re-solidified metal spray. Additionally, a significant share of re-solidified metal droplets in silver, yellow, and orange can be found. The silver particles presumably consist of aluminum from the positive electrode current collector and cell casing, while the yellow and orange particles are copper-based particles, mainly from the negative electrode current collector. The latter require inside cell TR temperatures that, at least locally, exceed 1085 °C, the melting temperature of copper [68]. This finding well aligns with measured vent gas temperatures above 1100 °C (see Table 4). As noted in the literature [69,70,71], the internal cell temperature during TR tends to be significantly higher than that measured at the external surfaces. Here, the microscopic particle investigation provides a clue to a temperature window.
Particles larger than 250 µm show an increasing proportion of copper and aluminum metal foil from the current collectors. These pieces were either partially molten, folded by fluid forces and particle interactions, or are in their original flat shape. A small proportion of flat, matt grayish particles, presumably pieces of separator foil that did not melt or burn but tore during TR, can be observed in all samples. Re-solidified copper particles combined with intact separator pieces indicate a large temperature range of vent gas particles during TR. Black particles appear to be fragile because some fine dust was separated from the parent particles during probe handling and is present on all images with a size well below the respective category. These particles may be individual grains of the active materials or small agglomerates of the same.
Figure 11 presents special findings in the optical microscopy analysis. Figure 11a shows a particle consisting of mixed aluminum and copper melt in the center. To the left is a large copper melt particle that is almost completely covered by black dust. As noted above, the latter is present in large quantities in all size classes. There is also a number of aluminum foil pieces that show multiple bright silver spots and holes (Figure 11b). These features may reflect hotspots during the TR process, where the aluminum is partially or completely molten, or they may be formed during high-velocity impacts of other particles. Figure 11c shows a copper foil particle with a partially red-colored surface. It is speculated that the red hue represents copper (I) oxide () formed during copper oxidation in oxygen-poor atmosphere such as that present in the TR tests of this study.

Figure 11.
Optical microscopy images of sample #3: special findings—(a) mixed aluminum and copper melt; (b) pierced aluminum foil; (c) oxidized copper foil.
To verify the above particle chemistry assumptions and to obtain a more detailed representation of the particles, SEM/EDS was performed on the same probes. Figure 12 presents SEM images with SE and BSE signals and EDS images for different size fractions of sample #3.
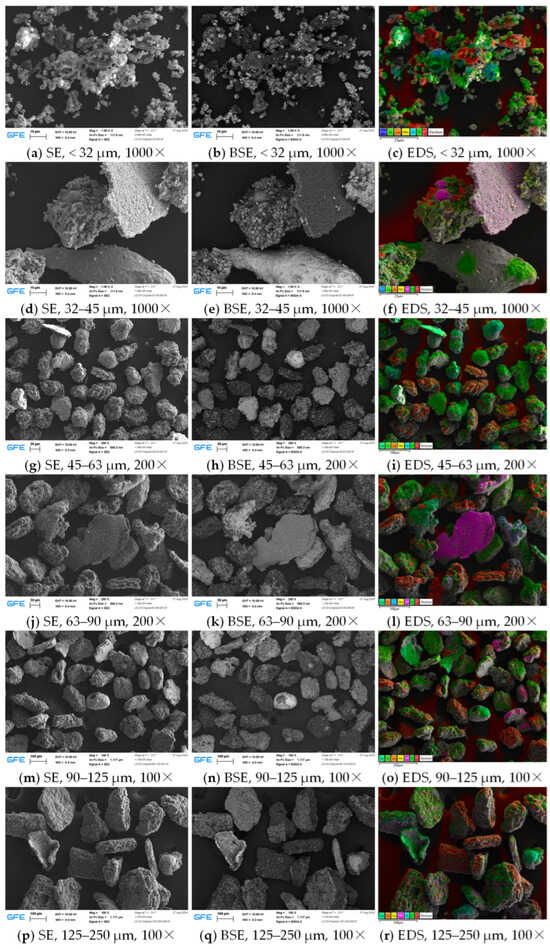
Figure 12.
Scanning electron microscopy (SEM) images with secondary electron (SE) and backscattering electron (BSE) signals, as well as energy dispersive X-ray spectroscopy (EDS) images for different size fractions of sample #3.
In the fraction < 32 µm (Figure 12a–c), carbon particles from the anode active material can be observed that show slate-like layered structure. In addition to the EDS images, carbon-containing particles can be well distinguished in the BSE images because of their low atomic mass. Many primary NMC particles from the cathode active material with a size of a few micrometers can be found both individually and agglomerated to larger secondary particles. In this context, primary particles shall refer to single grains, whereas secondary particles are agglomerations of several grains or even small chunks of the active material layers broken during TR. Furthermore, a partially oxidized copper droplet and an aluminum droplet covered with fine particles are visible in the center of the image.
Figure 12d–f presents the 32–45 µm fraction. The images show three distinct particle types: two NMC secondary particles (center and lower left) with aluminum droplets and carbon traces on the surface, two larger copper droplets (lower and upper right) covered by a few micron-scale NMC primary particles, and a thin plate-like particle composed of aluminum and oxygen. The latter is a piece of the alumina () coating of the separator, which can withstand high temperatures.
The 45–63 µm fraction (Figure 12g–i) consists of secondary active material particles covered by small primary particles and metal droplets, as well as larger metal droplets covered to varying degrees by small primary particles. This pattern continues for larger size fractions (Figure 12j–r) with the addition of aluminum and copper foil pieces originating from the current collectors. It is noteworthy that the shape of the active material chunks becomes flatter with increasing size. This observation can be explained by the original thickness of the active material layers in the cell, which determines the maximum possible thickness of these abuse particles.
In addition to the main elements from the active materials and current collectors , , , , , , and , traces of , , and can be found in almost all samples. Fluorine and phosphorus are thought to be mainly decomposition products of the electrolyte salt lithium-hexafluorophosphate (). Sulfur may be traced back to electrolyte additives and is found in very small amounts. Note that lithium cannot be detected in the EDS scans due to its low atomic mass, but is expected to be present in high quantity from the cathode metal oxide and electrolyte salt and their decomposition products.
The elements found in this study agree well with literature data. Since the particles originate from the cell internal materials, their chemical composition naturally depends on the cell chemistry. Typically, a high proportion of carbon, metal oxides, and metals from the active materials and current collectors can be found [49,50,53]. Zhang et al. detected 30 elements in the collected particulate matter [42]. Niu et al. investigated a prismatic NMC811 cell at different SOC levels and could only detect copper particles at 100% SOC [54]. This highlights the dependency of copper emissions on internal cell temperature due to copper’s high melting point. Yan and Ezekoye analyzed electrode residues after TR of an 18650 NMC811 cell. By applying EDS, they found that NMC ratios change from pristine to post-TR depending on the initial SOC and suggested that nickel and cobalt are transferred in gaseous decomposition products such as metal carbonyls [72]. In this study, considering the uncertainties in the EDS, the NMC ratio remained at 622 for the ejected particles. However, a significant loss of oxygen was detected in the EDS probes and is related to the oxygen releasing phase transitions of the cathode active material at high temperature and SOC [73]. A disadvantage of EDS is the limitation to measure only atomic ratios. In combination with the optical information in the SEM images it is possible to detect changes due to chemical reactions or phase transitions. However, the exact molecular structure of the decomposition products remains unclear. Wang et al. applied XRD to determine the crystal structure of abuse particles from NMC111, NMC532 and NMC622 cells. They identified Ni/Co, graphite, , , , , , and as the major components for all three cells [55]. Similarly, Liao et al. detected carbon, , , , , , , , and in the abuse particles of a cylindrical NMC111 cell [51]. They further listed possible decomposition reactions.
3.5. Particle Oxidation Characteristics
The thermal runaway tests for this study were conducted in near-vacuum conditions to best preserve the original out-of-cell state of the ejecta. In many real-world applications, the hot ejected particles will mix with ambient air when exiting the battery system, allowing for additional reactions. The particle oxidation characteristics in oxygen containing atmosphere were therefore studied by STA. Figure 13 shows the DSC, thermogravimetric (TG) and differential thermogravimetric (DTG) signals for the heating rate of 5 K/min, as this minimizes the influence of oxygen diffusion delay into the sample. The DSC and TG results for all size fractions and heating rates can be found in Figure S11.
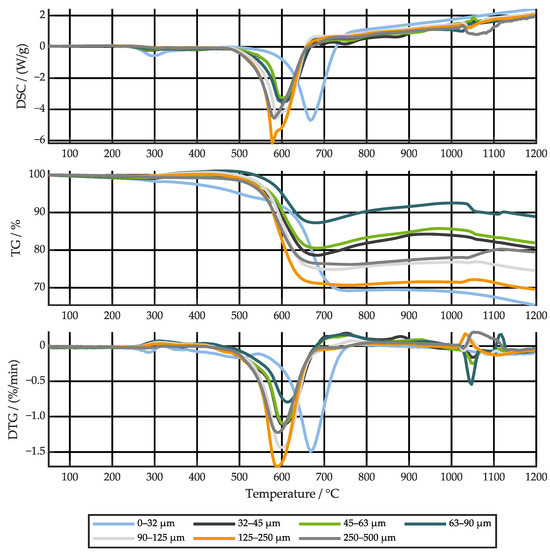
Figure 13.
Differential scanning calorimetry (DSC), thermogravimetric (TG), and differential thermogravimetric (DTG) signals for a heating rate of 5 K/min.
Up to 250 °C a slightly increasing DSC and a slightly decreasing TG signal can be observed. The minor endothermic mass loss of maximum 1% can be related to the evaporation of volatile species such as residual electrolyte, with smaller particles having a higher mass loss [74]. Between 250 °C and 500 °C, most of the fractions, except the smallest and the largest, gain some mass. Mass gain must be attributed to the addition of oxygen to the probe, e.g., by metal surface oxidation [75]. The fraction < 32 µm undergoes a noticeable exothermic reaction at around 300 °C, which may be linked to the decomposition of the remaining binder [23]. From about 500 °C to 750 °C, a strong exothermic reaction accompanied by significant mass loss can be observed in all size classes. In this temperature range, graphite oxidizes to and [76]. The corresponding mass loss can therefore be directly related to the amount of graphite in the probe. Interestingly, the fractions < 32 µm and 125–250 µm contain the most graphite at all heating rates with almost 30% of the total mass. Small particles are more densely packed in the crucibles. Thus, the oxidation of graphite is delayed by oxygen diffusion into the probe and the peak rate is shifted to a higher temperature [76]. This delay becomes even more pronounced at higher heating rates. At roughly 600 °C, a slight endothermic dip in many of the DSC signals represents the melting of aluminum [68]. From ~650 °C, the DSC signals show an increasing endothermic trend that overlays other processes. It is speculated that this trend is not related to the probe reactions or phase changes but is a measurement uncertainty due to increasing thermal radiation from the probes in combination with high transmissivity of the alumina crucibles in the infrared region. After graphite combustion, the oxygen addition to the sample, which had begun at 250 °C, again becomes the dominant process, with all probe masses increasing up to about 1000 °C. Oxidation of aluminum to alumina () is a potential reason for the mass increase [75]. During this period, some small and broad exothermic peaks can be observed alongside peaks in the DTG signal, most pronounced for particles between 32–63 µm. Above 1000 °C, several exothermic and endothermic peaks can be detected. Most samples lose mass above this temperature.
To study the repeatability of the STA, the 0–32 µm and 250–500 µm fractions were tested three times at a heating rate of 10 K/min. The results are shown in Figure S12. For small particles, the three measurements overlap almost perfectly. For large particles, the qualitative trends are similar with quantitative differences. Individual particles become significant, demonstrating the influence of the probe sampling on the results. Since the majority of particles is smaller than 250 µm and each STA runs overnight, only one measurement was performed for the remaining samples and heating rates, noting that representativeness increases with decreasing particle size.
Figure 14 presents SEM images of the cathode active material prior to TR, abuse particles of the fraction < 32 µm, and particles after STA of a sample from the initial particle mix prior to sieving. Notably, the appearance of the different particles varies significantly. The NMC-based particles (red crosses) appear in two different crystal structures after TR, and a third structure after STA. Aluminum-based particles (green crosses) contain pure aluminum after TR, which oxidizes to aluminum oxide and forms pyramidal crystals during STA. Carbon-based particles (yellow cross) are present after TR, but not after STA due to oxidation to and .
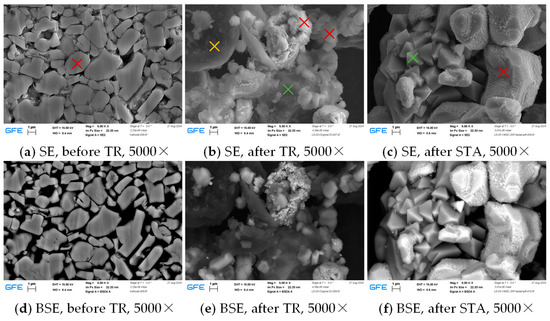
Figure 14.
Scanning electron microscopy (SEM) images with secondary electron (SE) and backscattering electron (BSE) signals of the cathode active material before thermal runaway (TR) (a,d), abuse particles of the fraction < 32 µm (b,e), and particles after the simultaneous thermal analysis (STA) (c,f).
In the following, the findings are compared with the literature. Wang et al. studied the oxidation behavior in air by STA coupled with FTIR analysis for different particle sizes at a heating rate of 20 K/min [53]. They also measured a significant mass loss starting at 600–700 °C, and an approximately linear endothermic signal at high temperatures. The FTIR measurement revealed as the main gas produced, demonstrating that graphite oxidation is the main source of mass loss. Furthermore, they observed greater mass loss and a faster reaction rate for smaller particles. Brunauer–Emmertt–Teller (BET) and Barrett–Joyner–Halenda (BJH) analyses revealed a larger specific surface area for smaller particles. With a larger surface area, reactions may be accelerated and are more complete. In this study, a linear size dependence on the mass loss could not be obtained. Note that significantly more fractions for the small sizes are examined here than in any of the literature studies. Garcia et al. observed that particles emitted from batteries with higher SOC tended to lose a higher percentage of mass during TGA, which they attributed to the concentration of carbon in the particle probes [56]. They also measured some mass gain after the graphite oxidation. Chen et al. applied STA with inert gas flow to the abuse particles of an 18650 NMC cell and found significant differences for different test atmospheres, SOC, heating power, and heating temperature [50]. Due to the inert atmosphere, they did not obtain the exothermic graphite oxidation but observed several endothermic processes. Moreover, they performed explosion tests using a spherical explosion test apparatus on ejected particles with different loadings, which provides additional insights into the reactivity of the particles. They found that the particles are not explosive. Note that the D10 values in the associated size analysis were often well over 100 µm. Explosion behavior may be different for fine dust and requires further investigation.
4. Conclusions
This study investigated the characteristics of particles ejected during thermal runaway of a prismatic 51 Ah NMC622/graphite lithium-ion cell. TR was triggered by external overheating with a heater at one large cell surface in an autoclave environment under vacuum conditions. Three TR tests were conducted and particles were sampled with a vacuum cleaner. The TR test results were very similar in many respects and only a minor mass percentage of particles was lost during sampling. It was therefore concluded that the three particle samples were representative for further analysis.
Dynamic image analysis was applied for the first time to analyze abuse particle size and shape. Two measurements revealed the characteristic particle sizes D10, D50, and D90 to be 10.3 µm, 60.8 µm, and 541 µm for run #1, and 10.4 µm, 63.7 µm, and 457 µm for run #2. Compared to sieve analysis, DIA resolves fine dust well, allowing detailed size distributions to be captured. Additionally, particle shapes could be quantified for the first time. Particles are clearly non-spherical, with sphericity, symmetry, and aspect ratio decreasing for larger particles.
Large particle size and shape were analyzed for the first time in this study by means of image processing applying the same measures as used in the DIA. 462, 683, and 684 particles sieveable with a 2 mm mesh were detected in the three TR tests. The particles could be separated into four material classes: copper-based, aluminum-based, “black”, and gray non-metallic. Copper-based particles accounted for the largest quantity and mass. The number of total large particles and separator foil pieces could be linked to the venting severity. A total of 168 metallic particles with a maximum Feret diameter above 10 mm could be identified in sample #3, with the largest particle reaching 51.4 mm. A variety of different shapes could be observed.
Sieving was used to separate the particles into ten fractions for further analysis. Microscopic investigations of these fractions, such as light microscopy and SEM/EDS, revealed a wide temperature range of the ejected particles. Based on intact separator foil pieces and molten copper droplets, particle temperatures during their ejection from the cell varied from about 200 °C to over 1100 °C. The exact temperature distribution remains subject of research. With the large number of size fractions and the recognition of detailed features in each fraction, this study supplements to the available microscopic investigations in literature.
Simultaneous thermal analysis of the seven smallest size fractions revealed graphite combustion as the main exothermic event between 500–750 °C, causing a mass loss of ~10–30% depending on particle size. Size classes 0–32 µm and 125–250 µm show the highest mass loss and thus contain the highest proportion of graphite. Graphite depletion is supported by EDS of particles after STA. Additionally, phase transitions in NMC based particles and aluminum oxidation were obtained.
From this study, the following battery system development guidelines can be summarized:
- The wide range of particle sizes makes it particularly challenging to design appropriate filtration concepts. If a large mesh size is chosen, e.g., 0.1–1 mm, only a small proportion of the particles can be filtered. Reducing the mesh size drastically increases the risk of filter clogging. Alternative filter concepts beyond screening should therefore be investigated.
- Large metallic particles (>2 mm) should be considered as a risk for electrical breakdown of uninsulated high voltage components due to contact–contact shorting. To mitigate arcing within a battery system during TR, high-voltage components should be insulated with a material capable of withstanding the high-temperature, high-velocity particle jet. Alternatively, although impractical, clearance and creepage distances could be designed based on the largest expected pieces of copper or aluminum foil.
- Hot particles can act as an ignition source and are partially combustible themselves. Therefore, the maximum allowable exit temperature of the particles from a battery system into the ambient air should be defined considering the vent gas and particle ignition temperatures, respectively. The reaction onset of the latter was determined to be around 500–600 °C in this study, with peak heat release between 600–750 °C.
- Three-dimensional numerical simulation of particle-laden two-phase flows is a complex task, especially for battery abuse particles. The wide size range requires a wise selection of the right modeling techniques. Non-spherical particle shapes are relevant for proper drag modeling and particle-wall interactions. The wide temperature range has a significant impact on modeling attempts since energy stored in the particles and their material properties vary significantly. This study provides some contribution to these challenges, with further investigation needed.
Supplementary Materials
The following supporting information can be downloaded at: https://www.mdpi.com/article/10.3390/batteries11060225/s1, Figure S1: Time-dependent temperature , pressure , cell voltage , and gas quantity profiles, as well as characteristic timestamps for voltage drop , first venting , and thermal runaway for test #2; Figure S2: Time-dependent temperature , pressure , cell voltage , and gas quantity profiles, as well as characteristic timestamps for voltage drop , first venting , and thermal runaway for test #3; Figure S3: Images of the cells after thermal runaway: (a) test #1, (b) test #2, (c) test #3; Figure S4: Particle images taken during the dynamic image analysis (DIA) of run #1; Figure S5: Images of sorted copper-based (a) as well as aluminum-based, gray non-metallic, and “black” particles, (b) >2 mm from sample #1; Figure S6: Images of sorted copper-based (a) as well as aluminum-based, gray non-metallic, and “black” particles, (b) >2 mm from sample #2; Figure S7: Large particle size characteristics split by material class as cumulated count and volume-specific cumulative distribution function (CDF) for sample #1: (a) minimum chord length , (b) equivalent circle diameter , (c) maximum Feret diameter ; Figure S8: Large particle size characteristics split by material class as cumulated count and volume-specific cumulative distribution function (CDF) for sample #2: (a) minimum chord length , (b) equivalent circle diameter , (c) maximum Feret diameter ; Figure S9: Large particle size characteristics split by material class as cumulated count and volume-specific cumulative distribution function (CDF) for sample #1: (a) minimum chord length , (b) equivalent circle diameter , (c) maximum Feret diameter ; Figure S10: Large particle size characteristics split by material class as cumulated count and volume-specific cumulative distribution function (CDF) for sample #2: (a) minimum chord length , (b) equivalent circle diameter , (c) maximum Feret diameter ; Figure S11: Differential scanning calorimetry (DSC) and thermogravimetric (TG) signals for different size fractions and heating rates; Figure S12: Differential scanning calorimetry (DSC) and thermogravimetric (TG) signals for three repetitive tests at a heating rate of 10 K/min: (a) size fraction 0–32 µm, (b) size fraction 250–500 µm.
Author Contributions
Conceptualization, F.E.; methodology, F.E.; software, F.E.; validation, F.E.; formal analysis, F.E.; investigation, F.E., P.G., G.B. and S.D.; resources, R.V., S.P.; data curation, F.E.; writing—original draft preparation, F.E., G.B. and R.V.; writing—review and editing, F.E., P.G., G.B., R.V. and S.P.; visualization, F.E.; supervision, R.V. and S.P.; project administration, R.V. and S.P.; funding acquisition, R.V. and S.P. All authors have read and agreed to the published version of the manuscript.
Funding
This project has received funding from the European Union’s Horizon Europe research and innovation program under grant agreement No 101103696. Views and opinions expressed are however those of the author(s) only and do not necessarily reflect those of the European Union or the European Innovation Council. Neither the European Union nor the granting authority can be held responsible for them.
Data Availability Statement
The original data presented in the study are openly available in Zenodo at https://doi.org/10.5281/zenodo.15438359 accessed on 19 May 2025.
Acknowledgments
The authors would like to thank Microtrac Retsch GmbH for carrying out the DIA and Fritsch GmbH for performing one sieve analysis. F.E. would further like to acknowledge the help of student assistants Marc Müllenbach during the testing period and Jan Bonkowski for data postprocessing.
Conflicts of Interest
The authors declare no conflicts of interest. The funders had no role in the design of the study; in the collection, analyses, or interpretation of data; in the writing of the manuscript; or in the decision to publish the results.
References
- Bloomberg Finance, L.P. Global Energy Storage Market Records Biggest Jump Yet. Available online: https://about.bnef.com/blog/global-energy-storage-market-records-biggest-jump-yet/ (accessed on 15 December 2024).
- Abbas, Q.; Mirzaeian, M.; Hunt, M.R.; Hall, P.; Raza, R. Current State and Future Prospects for Electrochemical Energy Storage and Conversion Systems. Energies 2020, 13, 5847. [Google Scholar] [CrossRef]
- The University of Texas Fire Research Group. Battery Fire and Explosion Incidents: Database Tools. Available online: https://tools.utfireresearch.com/apps/incident_map (accessed on 15 December 2024).
- TÜV-Verband e., V. TÜV Mobility Studie 2024. Available online: https://tuev-verband.de/studien/tuev-mobility-studie-2024 (accessed on 15 December 2024).
- GB 38031-2020; Electric Vehicles Traction Battery Safety Requirements. State Administration for Market Regulation—Standardization Administration of the People’s Republic of China: Beijing, China, 2020.
- United Nations. In Uniform Provisions Concerning the Approval of Vehicles with Regard to Specific Requirements for the Electric Power Train, 3rd ed.; (ECE R100); United Nations: New York, NY, USA, 2022.
- RTCA, Inc. DO-311A—Minimum Operational Performance Standards for Rechargeable Lithium Batteries and Battery Systems; RTCA, Inc.: Washington, DC, USA, 2017. [Google Scholar]
- The European Parliament and the Council of the European Union. Regulation (EU) 2023/1542 of the European Parliament and of the Council of 12 July 2023 Concerning Batteries and Waste Batteries, Amending Directive 2008/98/EC and Regulation (EU) 2019/1020 and Repealing Directive 2006/66/EC; The European Parliament and the Council of the European Union: Brussels, Belgium, 2023. [Google Scholar]
- Zhang, Z.; Dong, H.; Wang, L.; Wang, Y.; He, X. Tracing Root Causes of Electric Vehicle Fires. Energy Technol. 2024, 12, 2400931. [Google Scholar] [CrossRef]
- Wang, S.; Wang, Q.; Xu, L.; Sun, Y.; Feng, X.; Wang, H. A review on mechanisms, characteristics and relating hazards of vent gases from thermally abused Li-ion batteries. J. Energy Storage 2024, 84, 110892. [Google Scholar] [CrossRef]
- Barkholtz, H.M.; Preger, Y.; Ivanov, S.; Langendorf, J.; Torres-Castro, L.; Lamb, J.; Chalamala, B.; Ferreira, S.R. Multi-scale thermal stability study of commercial lithium-ion batteries as a function of cathode chemistry and state-of-charge. J. Power Sources 2019, 435, 226777. [Google Scholar] [CrossRef]
- Essl, C.; Golubkov, A.W.; Fuchs, A. Comparing Different Thermal Runaway Triggers for Two Automotive Lithium-Ion Battery Cell Types. J. Electrochem. Soc. 2020, 167, 130542. [Google Scholar] [CrossRef]
- Essl, C.; Golubkov, A.W.; Fuchs, A. Influence of Aging on the Failing Behavior of Automotive Lithium-Ion Batteries. Batteries 2021, 7, 23. [Google Scholar] [CrossRef]
- Xu, C.; Feng, X.; Huang, W.; Duan, Y.; Chen, T.; Gao, S.; Lu, L.; Jiang, F.; Ouyang, M. Internal temperature detection of thermal runaway in lithium-ion cells tested by extended-volume accelerating rate calorimetry. J. Energy Storage 2020, 31, 101670. [Google Scholar] [CrossRef]
- Willstrand, O.; Pushp, M.; Andersson, P.; Brandell, D. Impact of different Li-ion cell test conditions on thermal runaway characteristics and gas release measurements. J. Energy Storage 2023, 68, 107785. [Google Scholar] [CrossRef]
- Ren, D.; Hsu, H.; Li, R.; Feng, X.; Guo, D.; Han, X.; Lu, L.; He, X.; Gao, S.; Hou, J.; et al. A comparative investigation of aging effects on thermal runaway behavior of lithium-ion batteries. eTransportation 2019, 2, 100034. [Google Scholar] [CrossRef]
- Ohneseit, S.; Finster, P.; Floras, C.; Lubenau, N.; Uhlmann, N.; Seifert, H.J.; Ziebert, C. Thermal and Mechanical Safety As-sessment of Type 21700 Lithium-Ion Batteries with NMC, NCA and LFP Cathodes–Investigation of Cell Abuse by Means of Accelerating Rate Calorimetry (ARC). Batteries 2023, 9, 237. [Google Scholar] [CrossRef]
- Ding, C.; Zhu, N.; Yu, J.; Li, Y.; Sun, X.; Liu, C.; Huang, Q.; Wang, J. Experimental investigation of environmental pressure effects on thermal runaway properties of 21700 lithium-ion batteries with high energy density. Case Stud. Therm. Eng. 2022, 38, 102349. [Google Scholar] [CrossRef]
- Golubkov, A.W.; Scheikl, S.; Planteu, R.; Voitic, G.; Wiltsche, H.; Stangl, C.; Fauler, G.; Thaler, A.; Hacker, V. Thermal runaway of commercial 18650 Li-ion batteries with LFP and NCA cathodes—Impact of state of charge and overcharge. RSC Adv. 2015, 5, 57171–57186. [Google Scholar] [CrossRef]
- Golubkov, A.W.; Fuchs, D.; Wagner, J.; Wiltsche, H.; Stangl, C.; Fauler, G.; Voitic, G.; Thaler, A.; Hacker, V. Thermal-runaway experiments on consumer Li-ion batteries with metal-oxide and olivin-type cathodes. RSC Adv. 2014, 4, 3633–3642. [Google Scholar] [CrossRef]
- Feng, X.; Ouyang, M.; Liu, X.; Lu, L.; Xia, Y.; He, X. Thermal runaway mechanism of lithium ion battery for electric vehicles: A review. Energy Storage Mater. 2018, 10, 246–267. [Google Scholar] [CrossRef]
- Feng, X.; Zheng, S.; He, X.; Wang, L.; Wang, Y.; Ren, D.; Ouyang, M. Time Sequence Map for Interpreting the Thermal Runaway Mechanism of Lithium-Ion Batteries With LiNixCoyMnzO2 Cathode. Front. Energy Res. 2018, 6, 126. [Google Scholar] [CrossRef]
- Zhou, H.; Parmananda, M.; Crompton, K.R.; Hladky, M.P.; Dann, M.A.; Ostanek, J.K.; Mukherjee, P.P. Effect of electrode crosstalk on heat release in lithium-ion batteries under thermal abuse scenarios. Energy Storage Mater. 2022, 44, 326–341. [Google Scholar] [CrossRef]
- Wu, C.; Wu, Y.; Feng, X.; Wang, H.; Zhang, F.; Chen, S.; Li, B.; Deng, T.; Ouyang, M. Ultra-high temperature reaction mechanism of LiNi0.8Co0.1Mn0.1O2 electrode. J. Energy Storage 2022, 52, 104870. [Google Scholar] [CrossRef]
- Kriston, A.; Adanouj, I.; Ruiz, V.; Pfrang, A. Quantification and simulation of thermal decomposition reactions of Li-ion battery materials by simultaneous thermal analysis coupled with gas analysis. J. Power Sources 2019, 435, 226774. [Google Scholar] [CrossRef]
- Hatchard, T.D.; MacNeil, D.D.; Basu, A.; Dahn, J.R. Thermal Model of Cylindrical and Prismatic Lithium-Ion Cells. J. Electrochem. Soc. 2001, 148, A755. [Google Scholar] [CrossRef]
- Kim, G.-H.; Pesaran, A.; Spotnitz, R. A three-dimensional thermal abuse model for lithium-ion cells. J. Power Sources 2007, 170, 476–489. [Google Scholar] [CrossRef]
- Wang, Y.; Ren, D.; Feng, X.; Wang, L.; Ouyang, M. Thermal runaway modeling of large format high-nickel/silicon-graphite lithium-ion batteries based on reaction sequence and kinetics. Appl. Energy 2022, 306, 117943. [Google Scholar] [CrossRef]
- Hoelle, S.; Zimmermann, S.; Hinrichsen, O. 3D Thermal Simulation of Thermal Runaway Propagation in Lithium-Ion Battery Cell Stack: Review and Comparison of Modeling Approaches. J. Electrochem. Soc. 2023, 170, 60516. [Google Scholar] [CrossRef]
- Kim, J.; Mallarapu, A.; Finegan, D.P.; Santhanagopalan, S. Modeling cell venting and gas-phase reactions in 18650 lithium ion batteries during thermal runaway. J. Power Sources 2021, 489, 229496. [Google Scholar] [CrossRef]
- Ostanek, J.K.; Parhizi, M.; Li, W.; Kilaz, G.; Crompton, K.R. CFD-Based Thermal Abuse Simulations including Gas Generation and Venting of an 18650 Li-Ion Battery Cell. J. Electrochem. Soc. 2023, 170, 90512. [Google Scholar] [CrossRef]
- Cellier, A. Simulation aux Grandes Echelles de Feux de Batteries Lithium-Ion pour le Diagnostic de l’Emballement Thermique. Ph.D. Thesis, Institut National Polytechnique de Toulouse—INPT, Toulouse, France, 2023. [Google Scholar]
- Wang, G.; Kong, D.; Ping, P.; Wen, J.; He, X.; Zhao, H.; He, X.; Peng, R.; Zhang, Y.; Dai, X. Revealing particle venting of lithium-ion batteries during thermal runaway: A multi-scale model toward multiphase process. eTransportation 2023, 16, 100237. [Google Scholar] [CrossRef]
- Shen, H.; Wang, H.; Li, M.; Li, C.; Zhang, Y.; Li, Y.; Yang, X.; Feng, X.; Ouyang, M. Thermal Runaway Characteristics and Gas Composition Analysis of Lithium-Ion Batteries with Different LFP and NCM Cathode Materials under Inert Atmosphere. Electronics 2023, 12, 1603. [Google Scholar] [CrossRef]
- Fernandes, Y.; Bry, A.; de Persis, S. Identification and quantification of gases emitted during abuse tests by overcharge of a commercial Li-ion battery. J. Power Sources 2018, 389, 106–119. [Google Scholar] [CrossRef]
- Zou, K.; He, K.; Lu, S. Venting composition and rate of large-format LiNi0.8Co0.1Mn0.1O2 pouch power battery during thermal runaway. Int. J. Heat Mass Transf. 2022, 195, 123133. [Google Scholar] [CrossRef]
- Edge, J.S.; O'Kane, S.; Prosser, R.; Kirkaldy, N.D.; Patel, A.N.; Hales, A.; Ghosh, A.; Ai, W.; Chen, J.; Yang, J.; et al. Lithium ion battery degradation: What you need to know. Phys. Chem. Chem. Phys. 2021, 23, 8200–8221. [Google Scholar] [CrossRef]
- Wang, H.; Xu, H.; Zhang, Z.; Wang, Q.; Jin, C.; Wu, C.; Xu, C.; Hao, J.; Sun, L.; Du, Z.; et al. Fire and explosion characteristics of vent gas from lithium-ion batteries after thermal runaway: A comparative study. eTransportation 2022, 13, 100190. [Google Scholar] [CrossRef]
- Kennedy, R.W.; Marr, K.C.; Ezekoye, O.A. Gas release rates and properties from Lithium Cobalt Oxide lithium ion battery arrays. J. Power Sources 2021, 487, 229388. [Google Scholar] [CrossRef]
- Somandepalli, V.; Marr, K.; Horn, Q. Quantification of Combustion Hazards of Thermal Runaway Failures in Lithium-Ion Batteries. SAE Int. J. Altern. Powertrains 2014, 3, 98–104. [Google Scholar] [CrossRef]
- Tian, X.; Yi, Y.; Fang, B.; Yang, P.; Wang, T.; Liu, P.; Qu, L.; Li, M.; Zhang, S. Design Strategies of Safe Electrolytes for Preventing Thermal Runaway in Lithium Ion Batteries. Chem. Mater. 2020, 32, 9821–9848. [Google Scholar] [CrossRef]
- Zhang, Y.; Wang, H.; Li, W.; Li, C. Quantitative identification of emissions from abused prismatic Ni-rich lithium-ion batteries. eTransportation 2019, 2, 100031. [Google Scholar] [CrossRef]
- Wang, K.; Wu, D.; Chang, C.; Zhang, J.; Ouyang, D.; Qian, X. Charging rate effect on overcharge-induced thermal runaway characteristics and gas venting behaviors for commercial lithium iron phosphate batteries. J. Clean. Prod. 2024, 434, 139992. [Google Scholar] [CrossRef]
- Bordes, A.; Marlair, G.; Zantman, A.; Herreyre, S.; Papin, A.; Desprez, P.; Lecocq, A. New insight on the risk profile pertaining to lithium-ion batteries under thermal runaway as affected by system modularity and subsequent oxidation regime. J. Energy Storage 2022, 52, 104790. [Google Scholar] [CrossRef]
- Chen, S.; Wang, Z.; Wang, J.; Tong, X.; Yan, W. Lower explosion limit of the vented gases from Li-ion batteries thermal runaway in high temperature condition. J. Loss Prev. Process Ind. 2020, 63, 103992. [Google Scholar] [CrossRef]
- Zhou, T.; Sun, J.; Li, J.; Wei, S.; Chen, J.; Dang, S.; Tang, N.; Zhu, Y.; Lian, Y.; Guo, J.; et al. Toxicity, Emissions and Structural Damage from Lithium-Ion Battery Thermal Runaway. Batteries 2023, 9, 308. [Google Scholar] [CrossRef]
- Li, W.; Xue, Y.; Feng, X.; Liu, J.; Zhang, F.; Rao, S.; Zhang, T.; Gao, Z.; Du, Z.; Ni, C.; et al. Enhancing understanding of particle emissions from lithium-ion traction batteries during thermal runaway: An overview and challenges. eTransportation 2024, 22, 100354. [Google Scholar] [CrossRef]
- Li, W.; Xue, Y.; Feng, X.; Rao, S.; Zhang, T.; Gao, Z.; Guo, Y.; Zhou, H.; Zhao, H.; Song, Z.; et al. Characteristics of particle emissions from lithium-ion batteries during thermal runaway: A review. J. Energy Storage 2024, 78, 109980. [Google Scholar] [CrossRef]
- Zhang, Y.; Wang, H.; Li, W.; Li, C.; Ouyang, M. Size distribution and elemental composition of vent particles from abused prismatic Ni-rich automotive lithium-ion batteries. J. Energy Storage 2019, 26, 100991. [Google Scholar] [CrossRef]
- Chen, S.; Wang, Z.; Yan, W. Identification and characteristic analysis of powder ejected from a lithium ion battery during thermal runaway at elevated temperatures. J. Hazard. Mater. 2020, 400, 123169. [Google Scholar] [CrossRef]
- Liao, Z.; Zhang, S.; Li, K.; Zhao, M.; Qiu, Z.; Han, D.; Zhang, G.; Habetler, T.G. Hazard analysis of thermally abused lithium-ion batteries at different state of charges. J. Energy Storage 2020, 27, 101065. [Google Scholar] [CrossRef]
- Barone, T.L.; Dubaniewicz, T.H.; Friend, S.A.; Zlochower, I.A.; Bugarski, A.D.; Rayyan, N.S. Lithium-ion battery explosion aerosols: Morphology and elemental composition. Aerosol Sci. Technol. 2021, 55, 1183–1201. [Google Scholar] [CrossRef] [PubMed]
- Wang, Y.; Wang, H.; Zhang, Y.; Cheng, L.; Wu, Y.; Feng, X.; Lu, L.; Ouyang, M. Thermal oxidation characteristics for smoke particles from an abused prismatic Li(Ni0.6Co0.2Mn0.2)O2 battery. J. Energy Storage 2021, 39, 102639. [Google Scholar] [CrossRef]
- Niu, H.; Chen, C.; Liu, Y.; Li, L.; Li, Z.; Ji, D.; Huang, X. Mitigating thermal runaway propagation of NCM 811 prismatic batteries via hollow glass microspheres plates. Process Saf. Environ. Prot. 2022, 162, 672–683. [Google Scholar] [CrossRef]
- Wang, H.; Wang, Q.; Jin, C.; Xu, C.; Zhao, Y.; Li, Y.; Zhong, C.; Feng, X. Detailed characterization of particle emissions due to thermal failure of batteries with different cathodes. J. Hazard. Mater. 2023, 458, 131646. [Google Scholar] [CrossRef]
- García, A.; Monsalve-Serrano, J.; Micó, C.; Guaraco-Figueira, C. Detailed characterisation of particle emissions from the thermal runaway of nickel-manganese-cobalt 811 lithium-ion batteries at different states of charge. J. Energy Storage 2024, 96, 112695. [Google Scholar] [CrossRef]
- Ledinski, T.; Golubkov, A.W.; Schweighofer, O.; Erker, S. Arcing in Li-Ion Batteries. Batteries 2023, 9, 540. [Google Scholar] [CrossRef]
- Chen, Y.; Li, Y.; Wang, J.; Lu, L.; Wang, H.; Li, M.; Xu, W.; Shi, C.; Li, C. Characterization of Breakdown Arcs Induced by Venting Particles Generated by Thermal Runaway of Large-Capacity Ternary Lithium-Ion Batteries. Electronics 2024, 13, 3168. [Google Scholar] [CrossRef]
- Claassen, M.; Bingham, B.; Chow, J.C.; Watson, J.G.; Wang, Y.; Wang, X. Characterization of Lithium-Ion Battery Fire Emissions—Part 1: Chemical Composition of Fine Particles (PM2.5). Batteries 2024, 10, 301. [Google Scholar] [CrossRef]
- Claassen, M.; Bingham, B.; Chow, J.C.; Watson, J.G.; Chu, P.; Wang, Y.; Wang, X. Characterization of Lithium-Ion Battery Fire Emissions—Part 2: Particle Size Distributions and Emission Factors. Batteries 2024, 10, 366. [Google Scholar] [CrossRef]
- Ubaldi, S.; Russo, P. Toxicity Assessment of Gas, Solid and Liquid Emissions from Li-Ion Cells of Different Chemistry Subjected to Thermal Abuse. Energies 2024, 17, 4402. [Google Scholar] [CrossRef]
- Xu, Y.; Wang, Y.; Chen, D. Soot formation and its hazards in battery thermal runaway. J. Aerosol Sci. 2024, 181, 106420. [Google Scholar] [CrossRef]
- Yang, Y.; Fang, D.; Maleki, A.; Kohzadi, S.; Liu, Y.; Chen, Y.; Liu, R.; Gao, G.; Zhi, J. Characterization of Thermal-Runaway Particles from Lithium Nickel Manganese Cobalt Oxide Batteries and Their Biotoxicity Analysis. ACS Appl. Energy Mater. 2021, 4, 10713–10720. [Google Scholar] [CrossRef]
- Lejon, C.; Vågberg, D.; Schönfeldt, F.; Liljedahl, B.; Persson, L.; Burman, J.; Elfverson, D.; Rydman, J.E.; Sjöström, J.; Björnham, O. Lagrangian plume rise and dispersion modelling of the large-scale lithium-ion battery fire in Morris, USA, 2021. Air Qual. Atmos. Health 2024, 17, 2077–2089. [Google Scholar] [CrossRef]
- ISO 13322-2:2021; Particle Size Analysis—Image Analysis Methods—Part 2: Dynamic Image Analysis Methods, 2nd ed. International Organization for Standardization: Geneva, Switzerland, 2021.
- Grossetete, T.; Dubourg, S.; Rochard, T.; Marteau, D.; Bengaouer, A. Detailed characterization of solid particles emitted during the thermal runaway of large-scale Lithium-ion cells. J. Energy Storage 2025, 124, 116666. [Google Scholar] [CrossRef]
- Haider, A.; Levenspiel, O. Drag coefficient and terminal velocity of spherical and nonspherical particles. Powder Technol. 1989, 58, 63–70. [Google Scholar] [CrossRef]
- National Institute of Standards and Technology. NIST Chemistry WebBook: NIST Standard Reference Database 69. Available online: https://webbook.nist.gov/chemistry/ (accessed on 27 March 2025).
- Feng, X.; Fang, M.; He, X.; Ouyang, M.; Lu, L.; Wang, H.; Zhang, M. Thermal runaway features of large format prismatic lithium ion battery using extended volume accelerating rate calorimetry. J. Power Sources 2014, 255, 294–301. [Google Scholar] [CrossRef]
- Wang, H.; Xu, H.; Zhao, Z.; Wang, Q.; Jin, C.; Li, Y.; Sheng, J.; Li, K.; Du, Z.; Xu, C.; et al. An experimental analysis on thermal runaway and its propagation in Cell-to-Pack lithium-ion batteries. Appl. Therm. Eng. 2022, 211, 118418. [Google Scholar] [CrossRef]
- Lai, X.; Wang, S.; Wang, H.; Zheng, Y.; Feng, X. Investigation of thermal runaway propagation characteristics of lithium-ion battery modules under different trigger modes. Int. J. Heat Mass Transf. 2021, 171, 121080. [Google Scholar] [CrossRef]
- Yan, H.; Ezekoye, O.A. State of charge effects on active material elemental composition changes between pre-thermal-runaway and post-failure states for 8-1-1 nickel-manganese-cobalt 18650 cells. J. Energy Storage 2023, 63, 106974. [Google Scholar] [CrossRef]
- Hou, J.; Feng, X.; Wang, L.; Liu, X.; Ohma, A.; Lu, L.; Ren, D.; Huang, W.; Li, Y.; Yi, M.; et al. Unlocking the self-supported thermal runaway of high-energy lithium-ion batteries. Energy Storage Mater. 2021, 39, 395–402. [Google Scholar] [CrossRef]
- Bracht, C.; Preitschopf, T.; Schöneich, M.; Neff, T.; Kallfaß, C.; Finze, M. Influence of Crucible Types on Thermal Stability Analysis of Li-Ion Battery Components by Thermogravimetric Analysis–Differential Scanning Calorimetry. Energy Technol. 2024, 12, 2400365. [Google Scholar] [CrossRef]
- Zhang, X.; Guo, R.; Feng, X.; Fang, J.; Xu, J.; Wang, X.; Zhang, J. Thermal Oxidation Characteristics and Kinetics of Micron Aluminum Powder in Different Ambient Oxygen Concentration Atmospheres. Processes 2024, 12, 2408. [Google Scholar] [CrossRef]
- Xiaowei, L.; Jean-Charles, R.; Suyuan, Y. Effect of temperature on graphite oxidation behavior. Nucl. Eng. Des. 2004, 227, 273–280. [Google Scholar] [CrossRef]
Disclaimer/Publisher’s Note: The statements, opinions and data contained in all publications are solely those of the individual author(s) and contributor(s) and not of MDPI and/or the editor(s). MDPI and/or the editor(s) disclaim responsibility for any injury to people or property resulting from any ideas, methods, instructions or products referred to in the content. |
© 2025 by the authors. Licensee MDPI, Basel, Switzerland. This article is an open access article distributed under the terms and conditions of the Creative Commons Attribution (CC BY) license (https://creativecommons.org/licenses/by/4.0/).