1. Introduction
Driven by the global energy transition and carbon neutrality, electric vehicles (EVs) have become the core vehicle of transportation innovation. According to the International Energy Agency (IEA), the number of EVs in the world will exceed 300 million in 2024, and the performance and safety of power batteries, as the core component, will directly determine the economy and reliability of the vehicles. However, the accumulation and uneven distribution of temperature of lithium-ion batteries due to heat generated by internal resistance under complex driving conditions not only accelerates battery aging but also triggers the risk of thermal runaway. Recent studies have highlighted the critical role of multiphysics modeling coupled with machine learning to predict and identify thermal runaways early by analyzing spatio-temporal thermal characteristics, enabling proactive battery safety management beyond traditional monitoring methods [
1]. This work introduces a model-constrained deep-learning approach for online fault detection in lithium-ion batteries. The proposed algorithm integrates battery model constraints and employs deep learning to manage stochastic system evolution, which enhances real-time fault detection under complex operating conditions, thus contributing to improved battery safety management [
2]. Traditional thermal management systems (BTMS) rely on passive response mechanisms (e.g., real-time temperature-based PID control [
3]), which make it difficult to cope with sudden changes in thermal loads under dynamic operating conditions, resulting in cooling lag and wasted energy consumption. Therefore, how to optimize the thermal management strategy by predicting the driving conditions in advance has become a key challenge to improve the efficiency and safety of the battery system.
Current research on battery thermal management mainly focuses on the optimization of heat dissipation technology and dynamic control strategy. In terms of heat dissipation technology, liquid cooling systems have become the mainstream choice due to their high efficiency and reliability, but their design complexity and energy consumption issues still need to be broken through. For example, the strategy based on nonlinear model predictive control (NMPC) and particle swarm optimization (PSO) [
4] is able to achieve accurate temperature regulation of lithium-ion battery modules, but it relies on high-precision models, and its computational complexity limits real-time performance; the bionic fern-like vein structure coupled with liquid-cooled phase change materials (PCM) scheme improves the thermal equilibrium in heavy-duty scenarios, such as mining trucks [
5], but PCM’s low thermal conductivity makes it difficult to adapt to frequent charging and discharging scenarios; while the multi-objective optimization method of phase change cooling coupled with liquid cooling balances heat dissipation and energy consumption through the non-dominated sorting genetic algorithm (NSGA-II) [
6], but its static framework is difficult to cope with dynamic working conditions. These efforts point to the need for more adaptive, dynamic management approaches that can cope with real-world variability [
7]. External pressure is critical for mitigating lithium plating in lithium-ion batteries. By applying pressure, battery performance improves, and longevity is extended, as this factor plays a key role in understanding the underlying mechanics of lithium-ion batteries during operation [
8]. Venting during fast charging is a critical failure mechanism of lithium-ion batteries, primarily due to exothermic reactions between the electrolyte and lithium plating. These findings underline the need for carefully controlled charging protocols to prevent gas generation and ensure safe battery operation during rapid charging [
9]. In terms of control strategies, most of the existing studies are based on fixed rules or standard working conditions, which lack the adaptation to the complexity of real roads. For example, the integrated scheme of PID and fuzzy control improves the response speed by dynamically adjusting the thermal management parameters of the whole vehicle, but it still needs to rely on real-time sensor feedback and cannot predict the future changes of heat load; real-time battery thermal management based on deep reinforcement learning (DRL) optimizes the energy allocation under the intense driving conditions [
10], but its training data relies on the simulation environment, and its generalization ability is limited; hierarchical reinforcement learning (HRL) combined with deep deterministic policy gradient (DDPG) integrated thermal management method coordinated battery and motor thermal management under high-temperature environment, but its multi-objective synergistic mechanism still needs to be optimized [
11].
In the field of energy management, the combination of model predictive control (MPC) and Markov chain speed predictor optimizes the energy consumption of hybrid buses through the Pontryagin minimization principle (PMP), but its prediction horizon is limited to a fixed time window [
12]. The active thermal management strategy of dynamic programming (DP) and genetic algorithms (GA), although it strikes a balance between the state of health of the battery (SOH) and energy consumption, but its computational cost limits the real-time performance [
13]. In terms of multi-objective optimization, the optimization of microchannel parameters of the liquid-cooling system [
14] and the design of micro heat pipe structure [
15] improve the thermal efficiency by a deep neural network (DNN) and multi-objective genetic algorithm (MOGA), but they do not consider the transient demand of dynamic working conditions. While adaptive optimization horizons (AOH-MT) and chance-constrained stochastic MPC (C-SMPC) achieve trade-offs between energy consumption and temperature constraints, they rely on the computational cost to limit the real-time performance [
16]. These methods, while promising, still face challenges in achieving a balance between computational feasibility and adaptability to hardware constraints [
17].
In addition, industry analysis points out that the global battery market demand for thermal management systems continues to grow, the optimization of liquid-cooled plate thermal performance has become a technical focus [
18], and policy-driven technological innovation needs to take into account cost and energy efficiency [
19]. The concept of battery digital twins, which integrates battery modeling, diagnostic tools, and machine learning, holds great promise for enhancing battery management. By creating a close interaction between physical and digital embodiments of batteries, this approach enables smarter control and a longer lifetime, addressing key challenges in the real-world application of battery systems [
20]. Liquid-cooled plates (LCP) are crucial for optimizing heat dissipation in high-performance applications. By incorporating internal sub-channels and using topology optimization, the cooling efficiency can be significantly improved, ensuring better thermal management in battery systems [
21]. The limitations of the existing work are reflected in three aspects: (1) data limitations: most studies rely on laboratory or standard operating condition data (e.g., China heavy-duty commercial vehicle test condition, CHTC), and lack of dynamic modeling of real road scenarios; (2) response lag: traditional PID or fuzzy control relies on real-time feedback, and the response lags behind the change of the operating conditions, resulting in the accumulation of the temperature rise; (3) energy-efficiency imbalance: the existing methods (such as NMPC, DRL) have improved the control accuracy, but the energy consumption optimization mechanism is not yet mature, and it is difficult to realize the global synergy between heat dissipation performance and system economy. Emerging approaches emphasize integrating battery, cooling system, and control policy design holistically to address these gaps [
22]. Lithium-ion batteries play a pivotal role in enabling the storage of renewable energy, especially in regions targeting carbon neutrality. Their application in energy storage systems ensures efficient energy management and supports the transition to a sustainable energy infrastructure [
23]. As the demand for batteries continues to grow, particularly in electric vehicles, the need for advanced thermal management systems has become increasingly vital. These systems are essential for improving battery efficiency, extending lifespan, and ensuring safe operation under diverse working conditions [
24].
To address the above challenges, this study proposes a synergistic strategy for battery thermal management based on dynamic working condition prediction, and the core innovations include:
- (1)
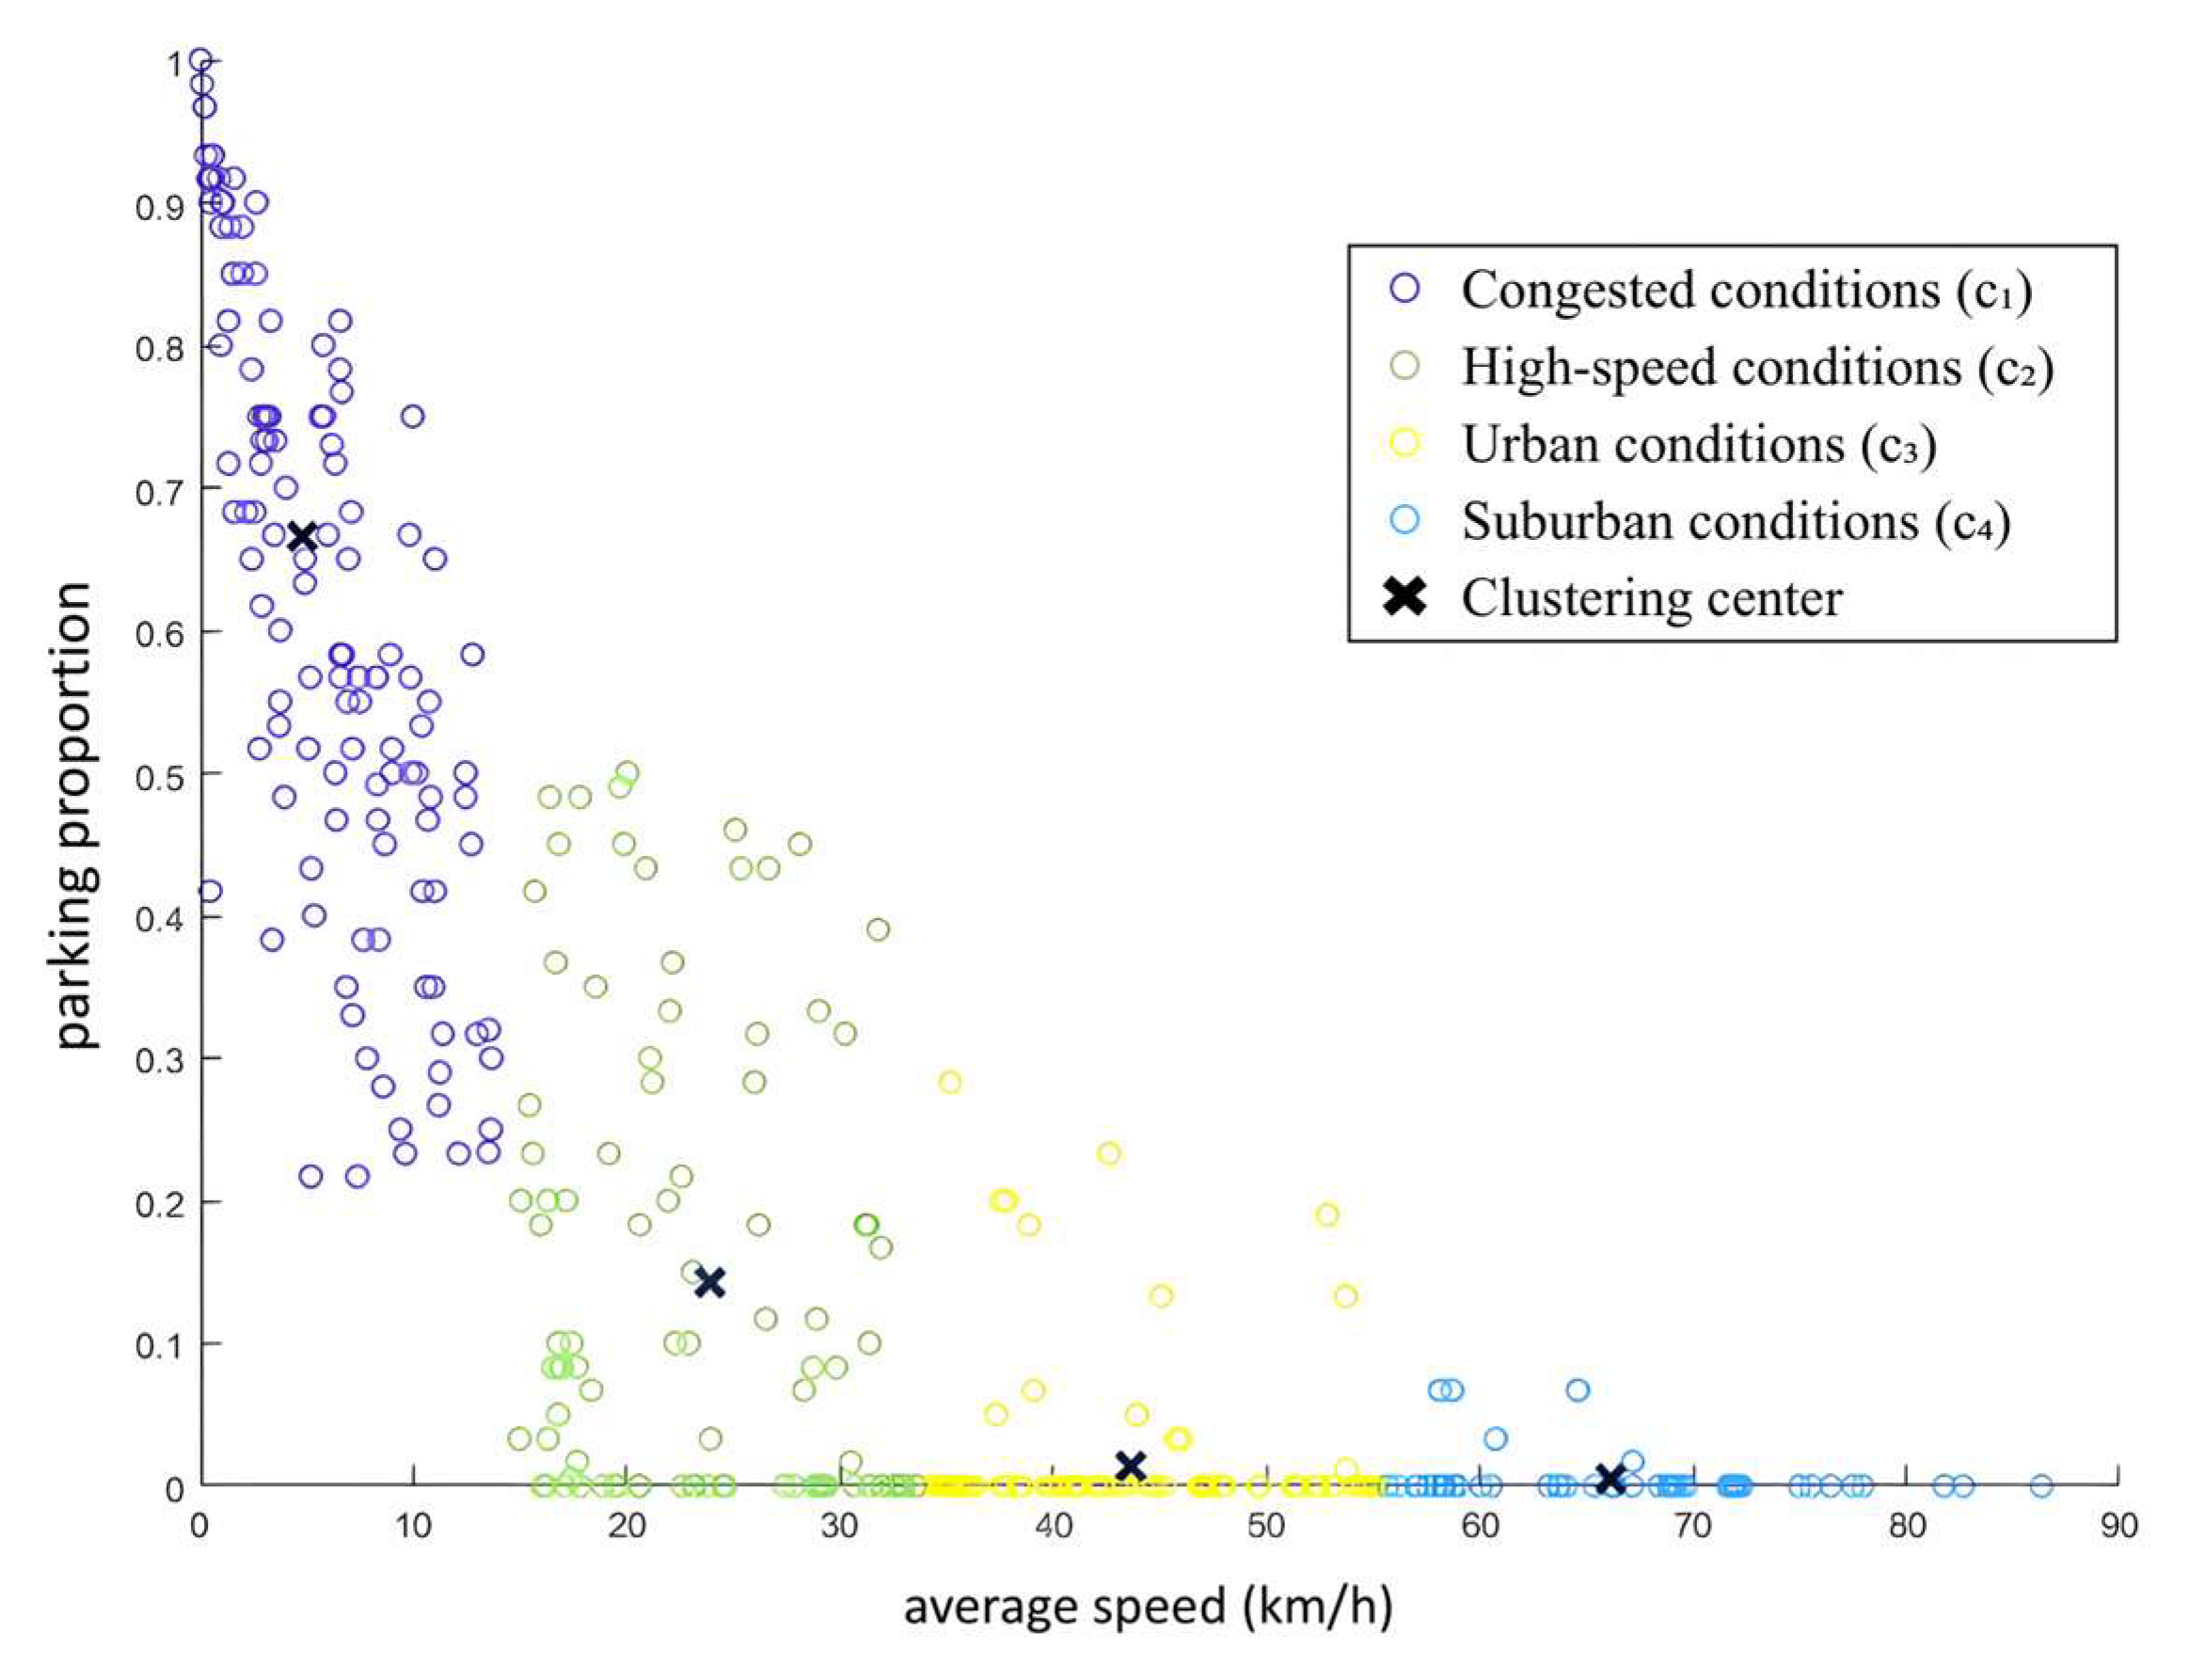
Data-driven working condition modeling: Collecting multi-scenario real vehicle data through autonomous driving method, combining with K-means clustering to extract four types of typical working conditions (congested, high-speed, urban, and suburban), and constructing a highly generalized dataset;
- (2)
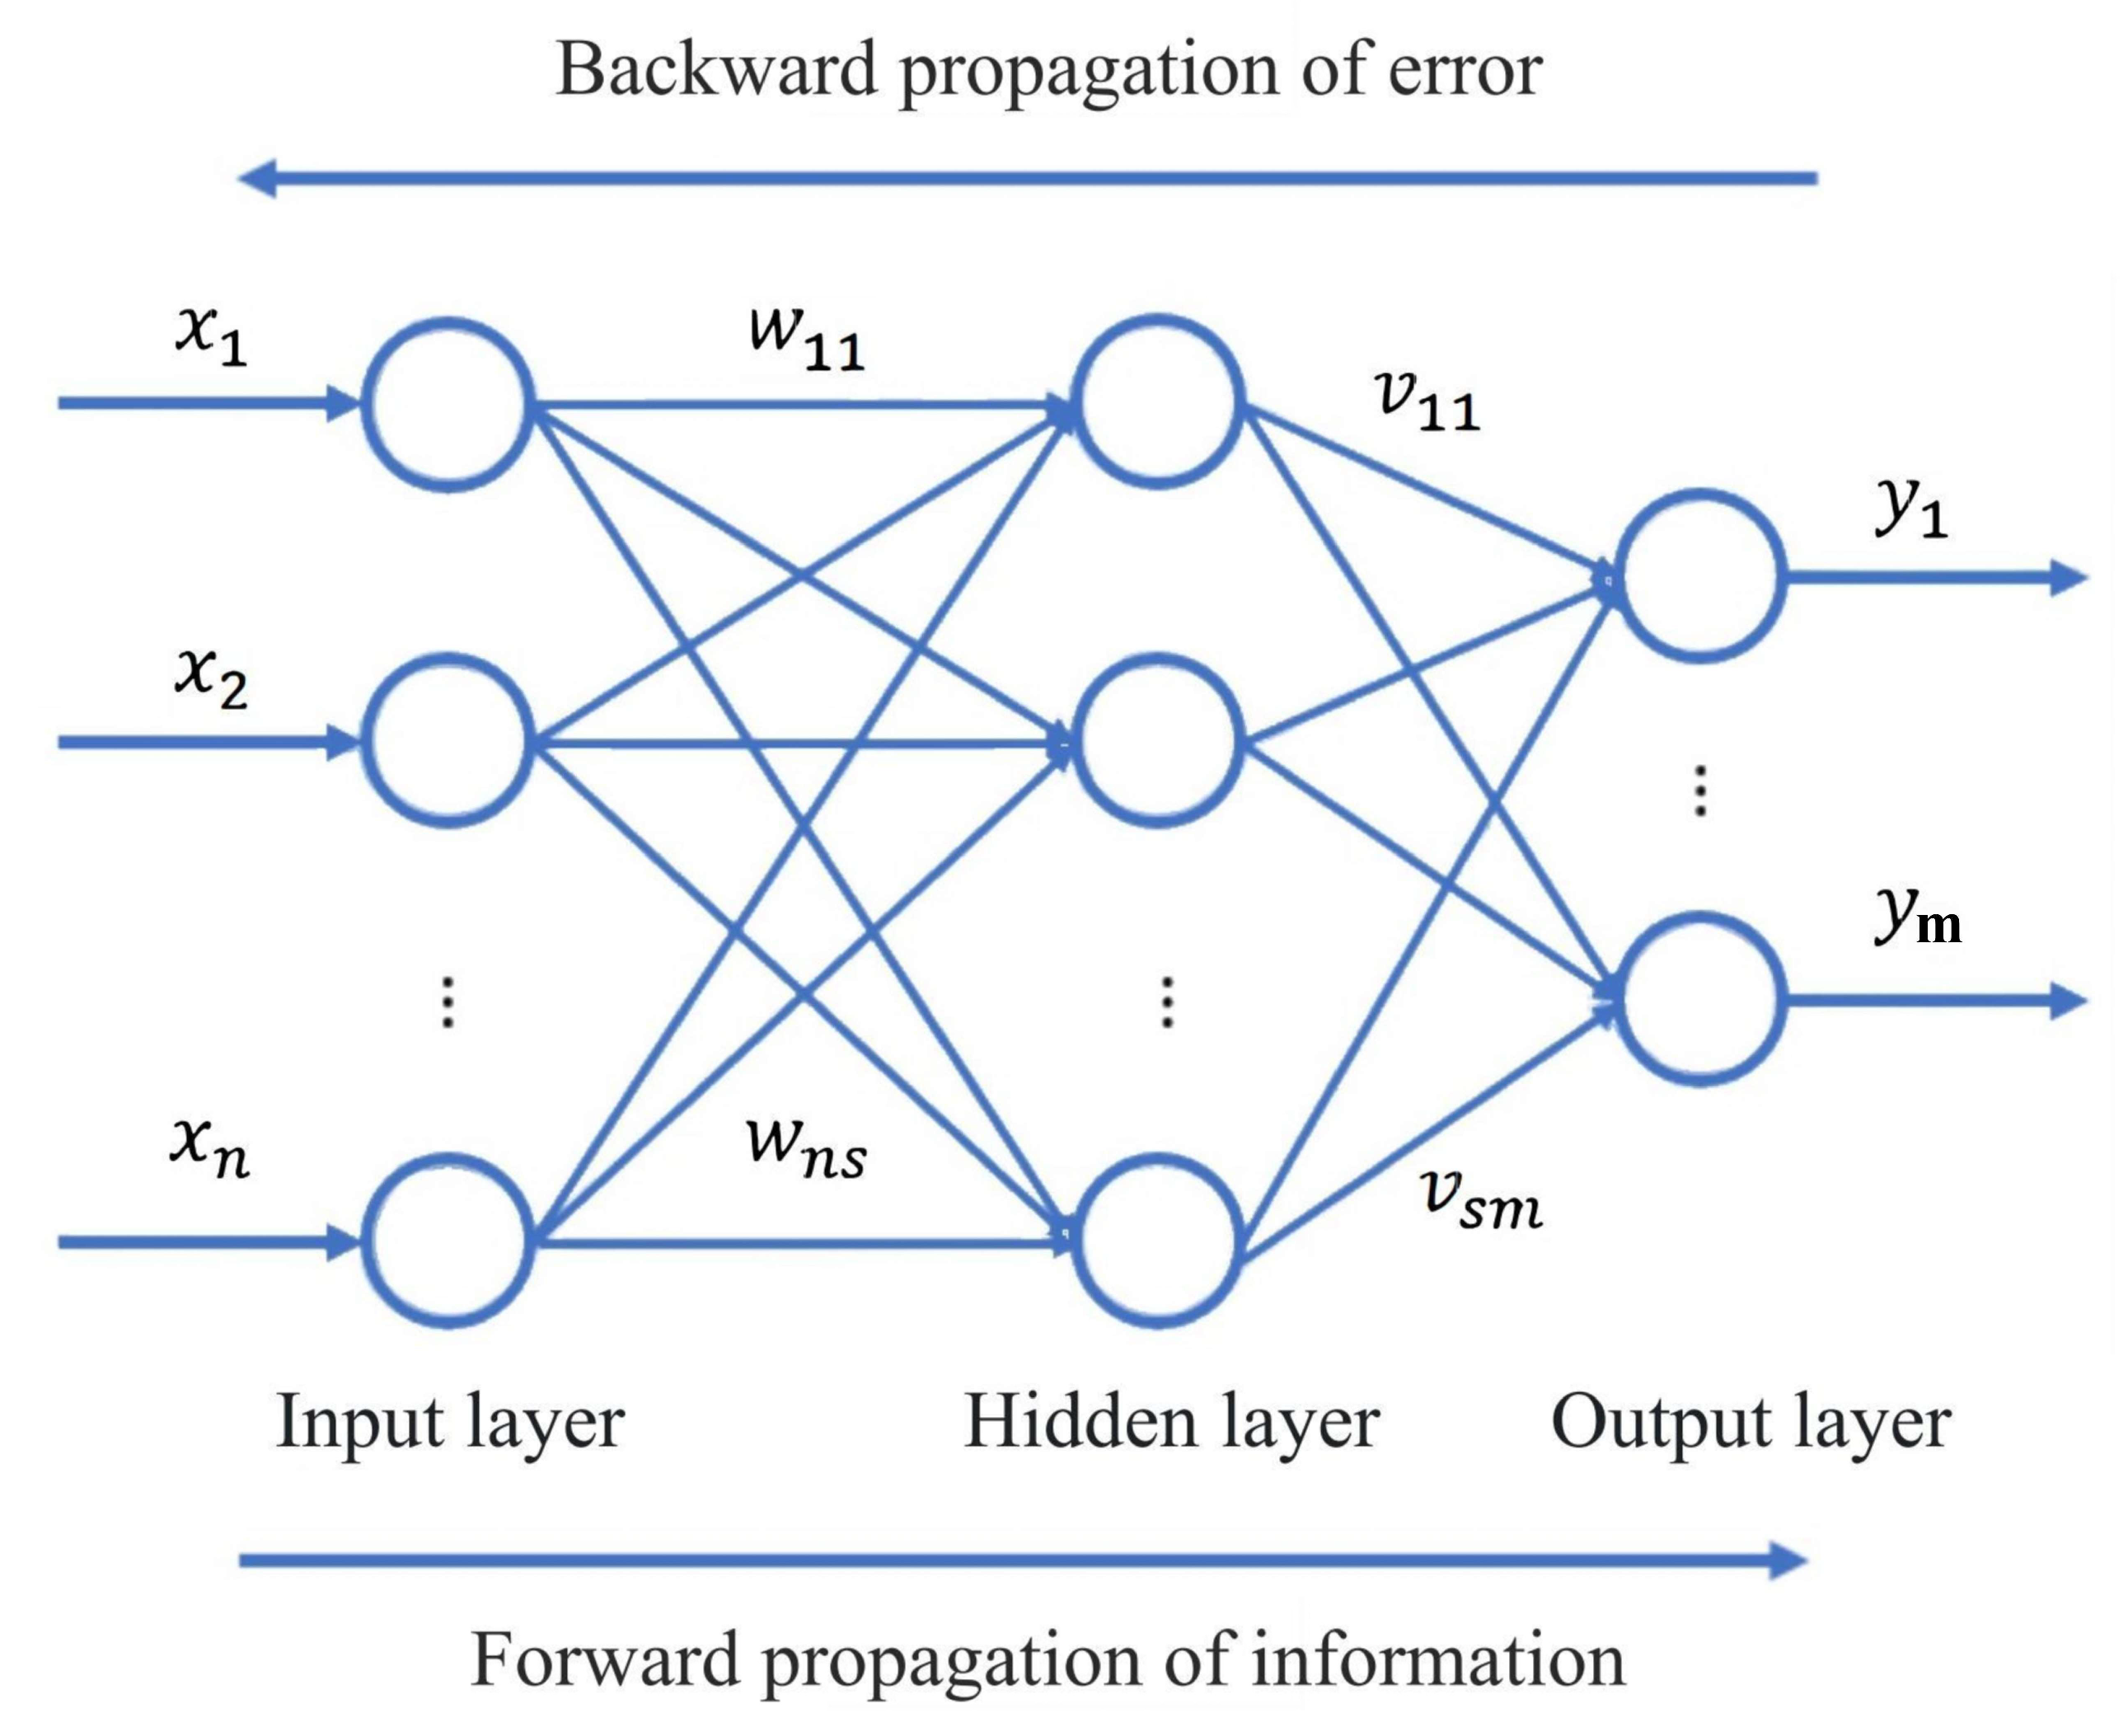
Nonlinear prediction and dynamic control: design BP neural network model to predict the future 60 s working conditions with historical speed and characteristic parameters, and coupled with PID algorithm to adjust the coolant flow in advance;
- (3)
Synergistic optimization of energy consumption and performance: Introducing a temperature feedback mechanism to dynamically adjust the water pump speed, which reduces the coolant energy consumption by 17.6% while ensuring the heat dissipation performance (temperature difference ≤ 0.7 °C).
By integrating data science and control theory, this study breaks through the limitation of traditional thermal management relying on hysteresis feedback and realizes the synergistic optimization of time-series prediction and dynamic control. Compared with existing methods, the present strategy has significant advantages in the following aspects.
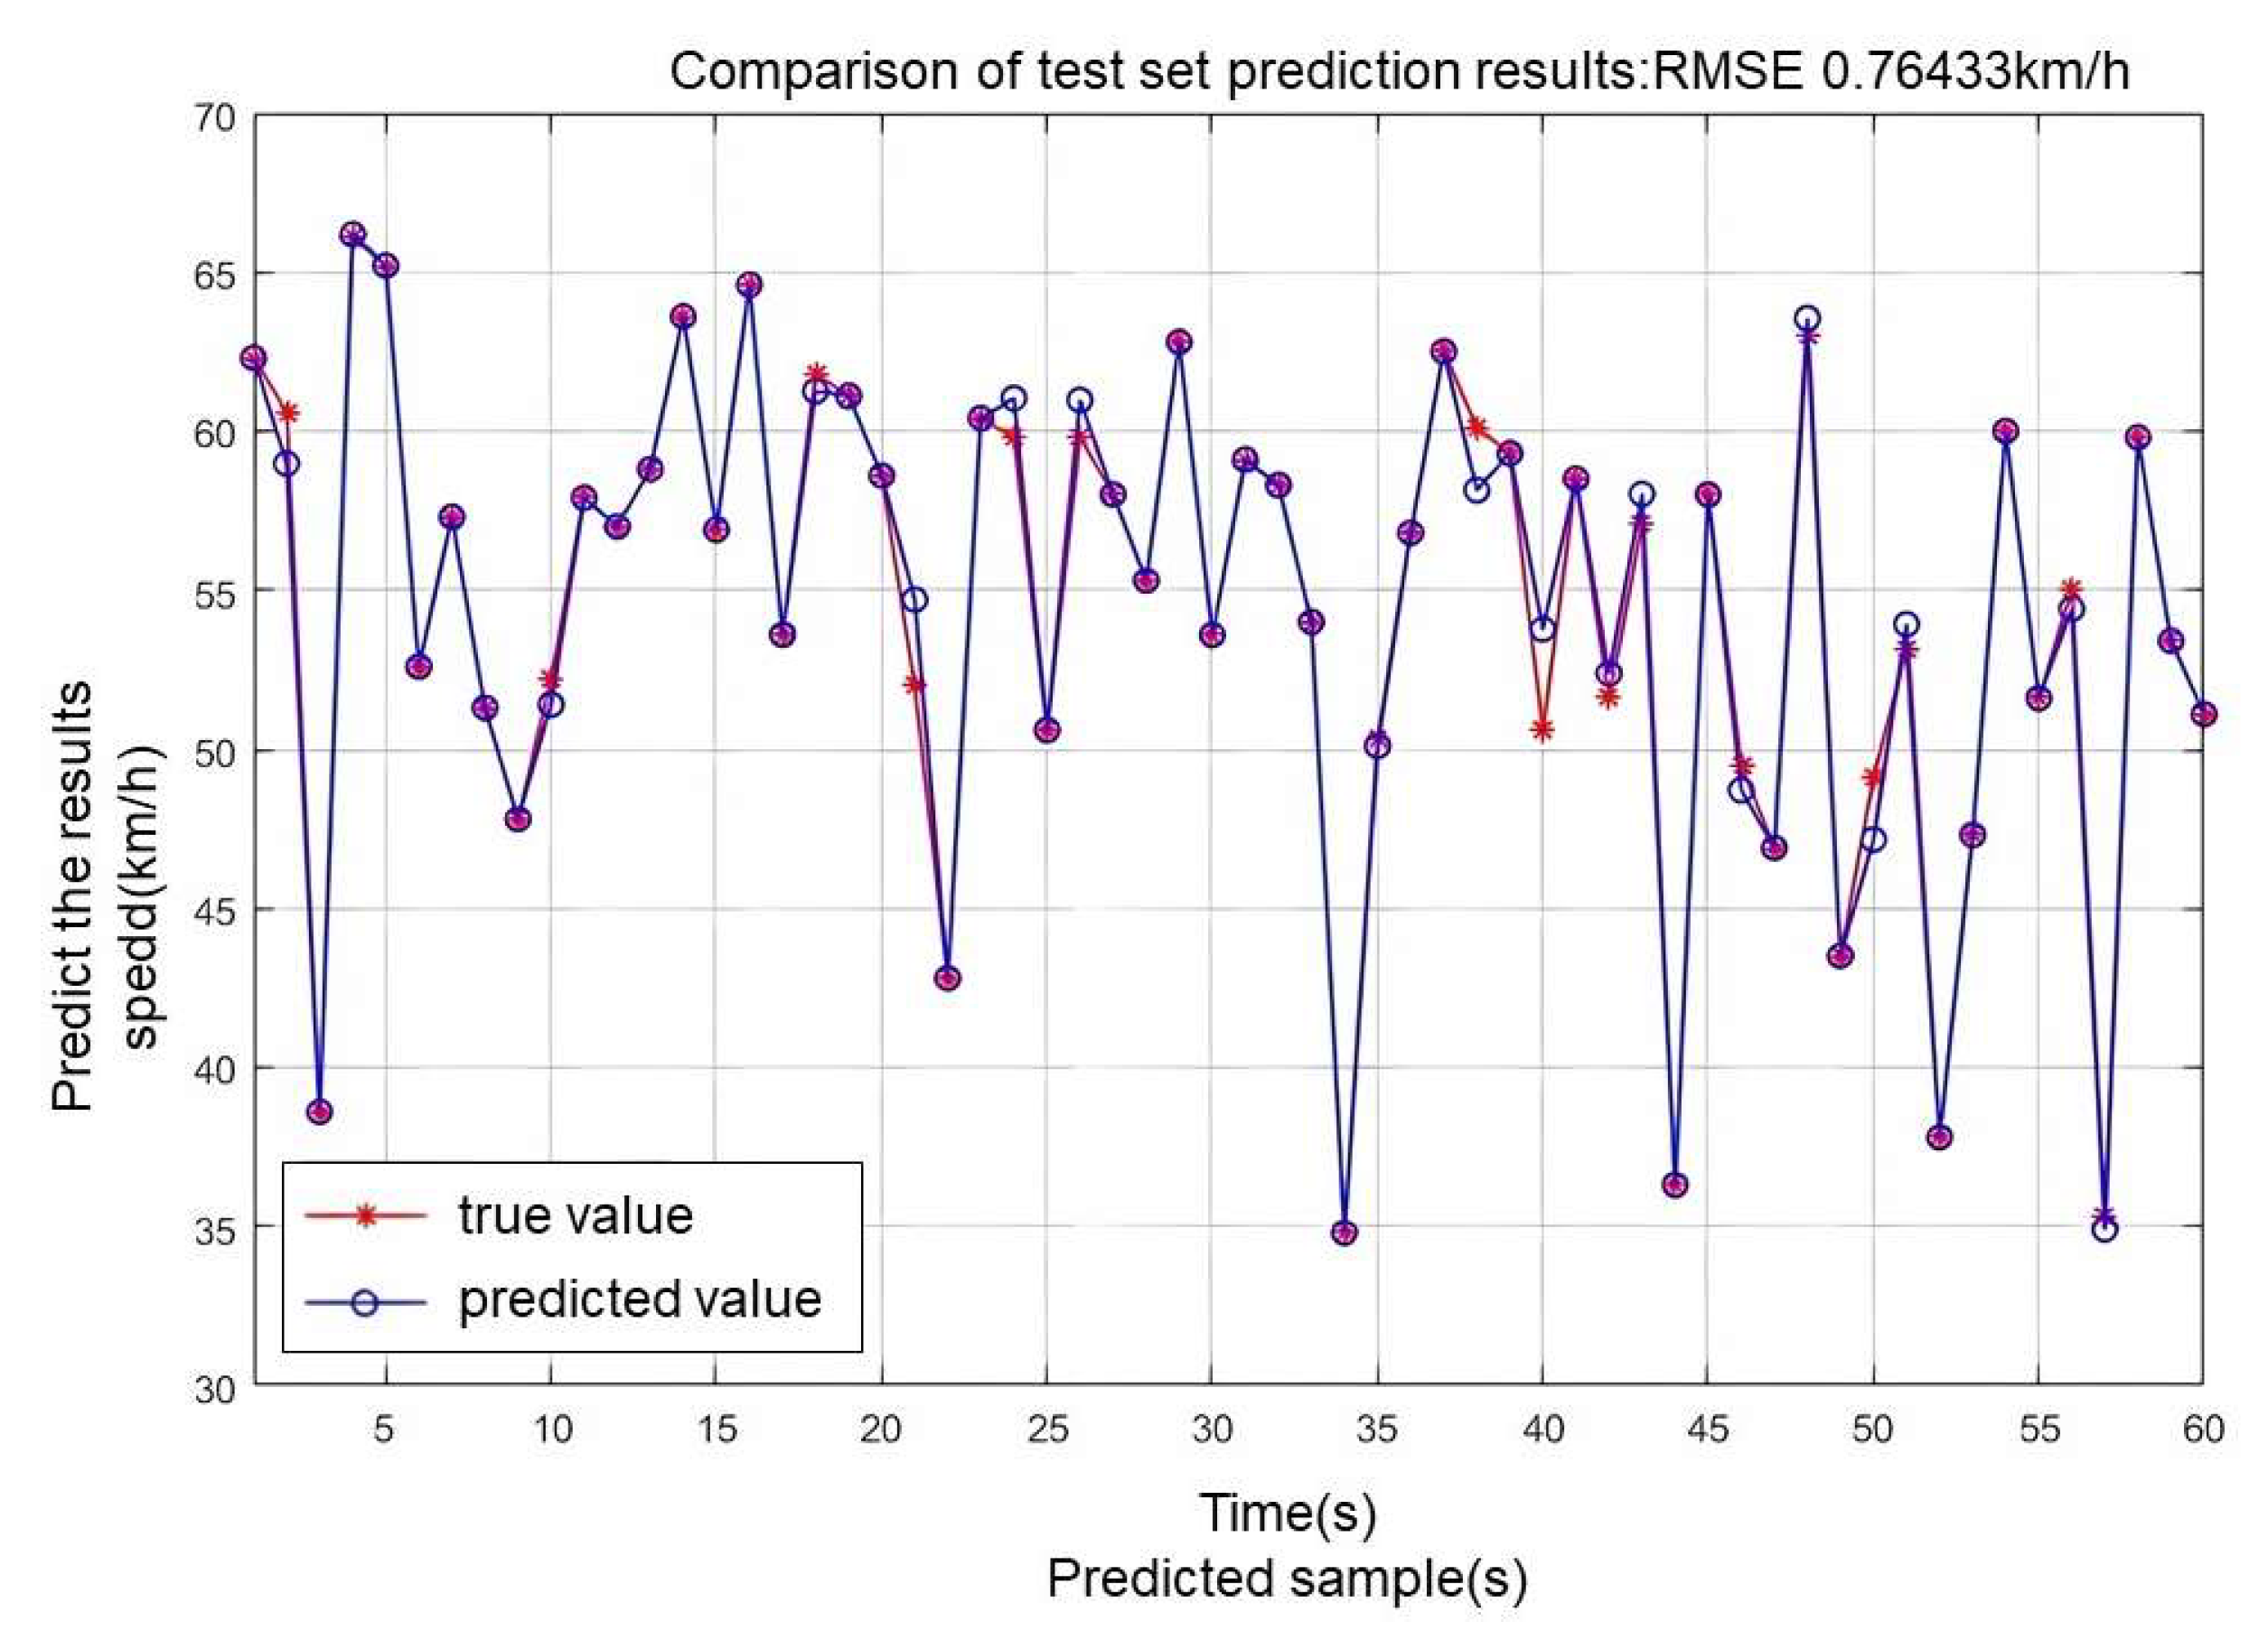
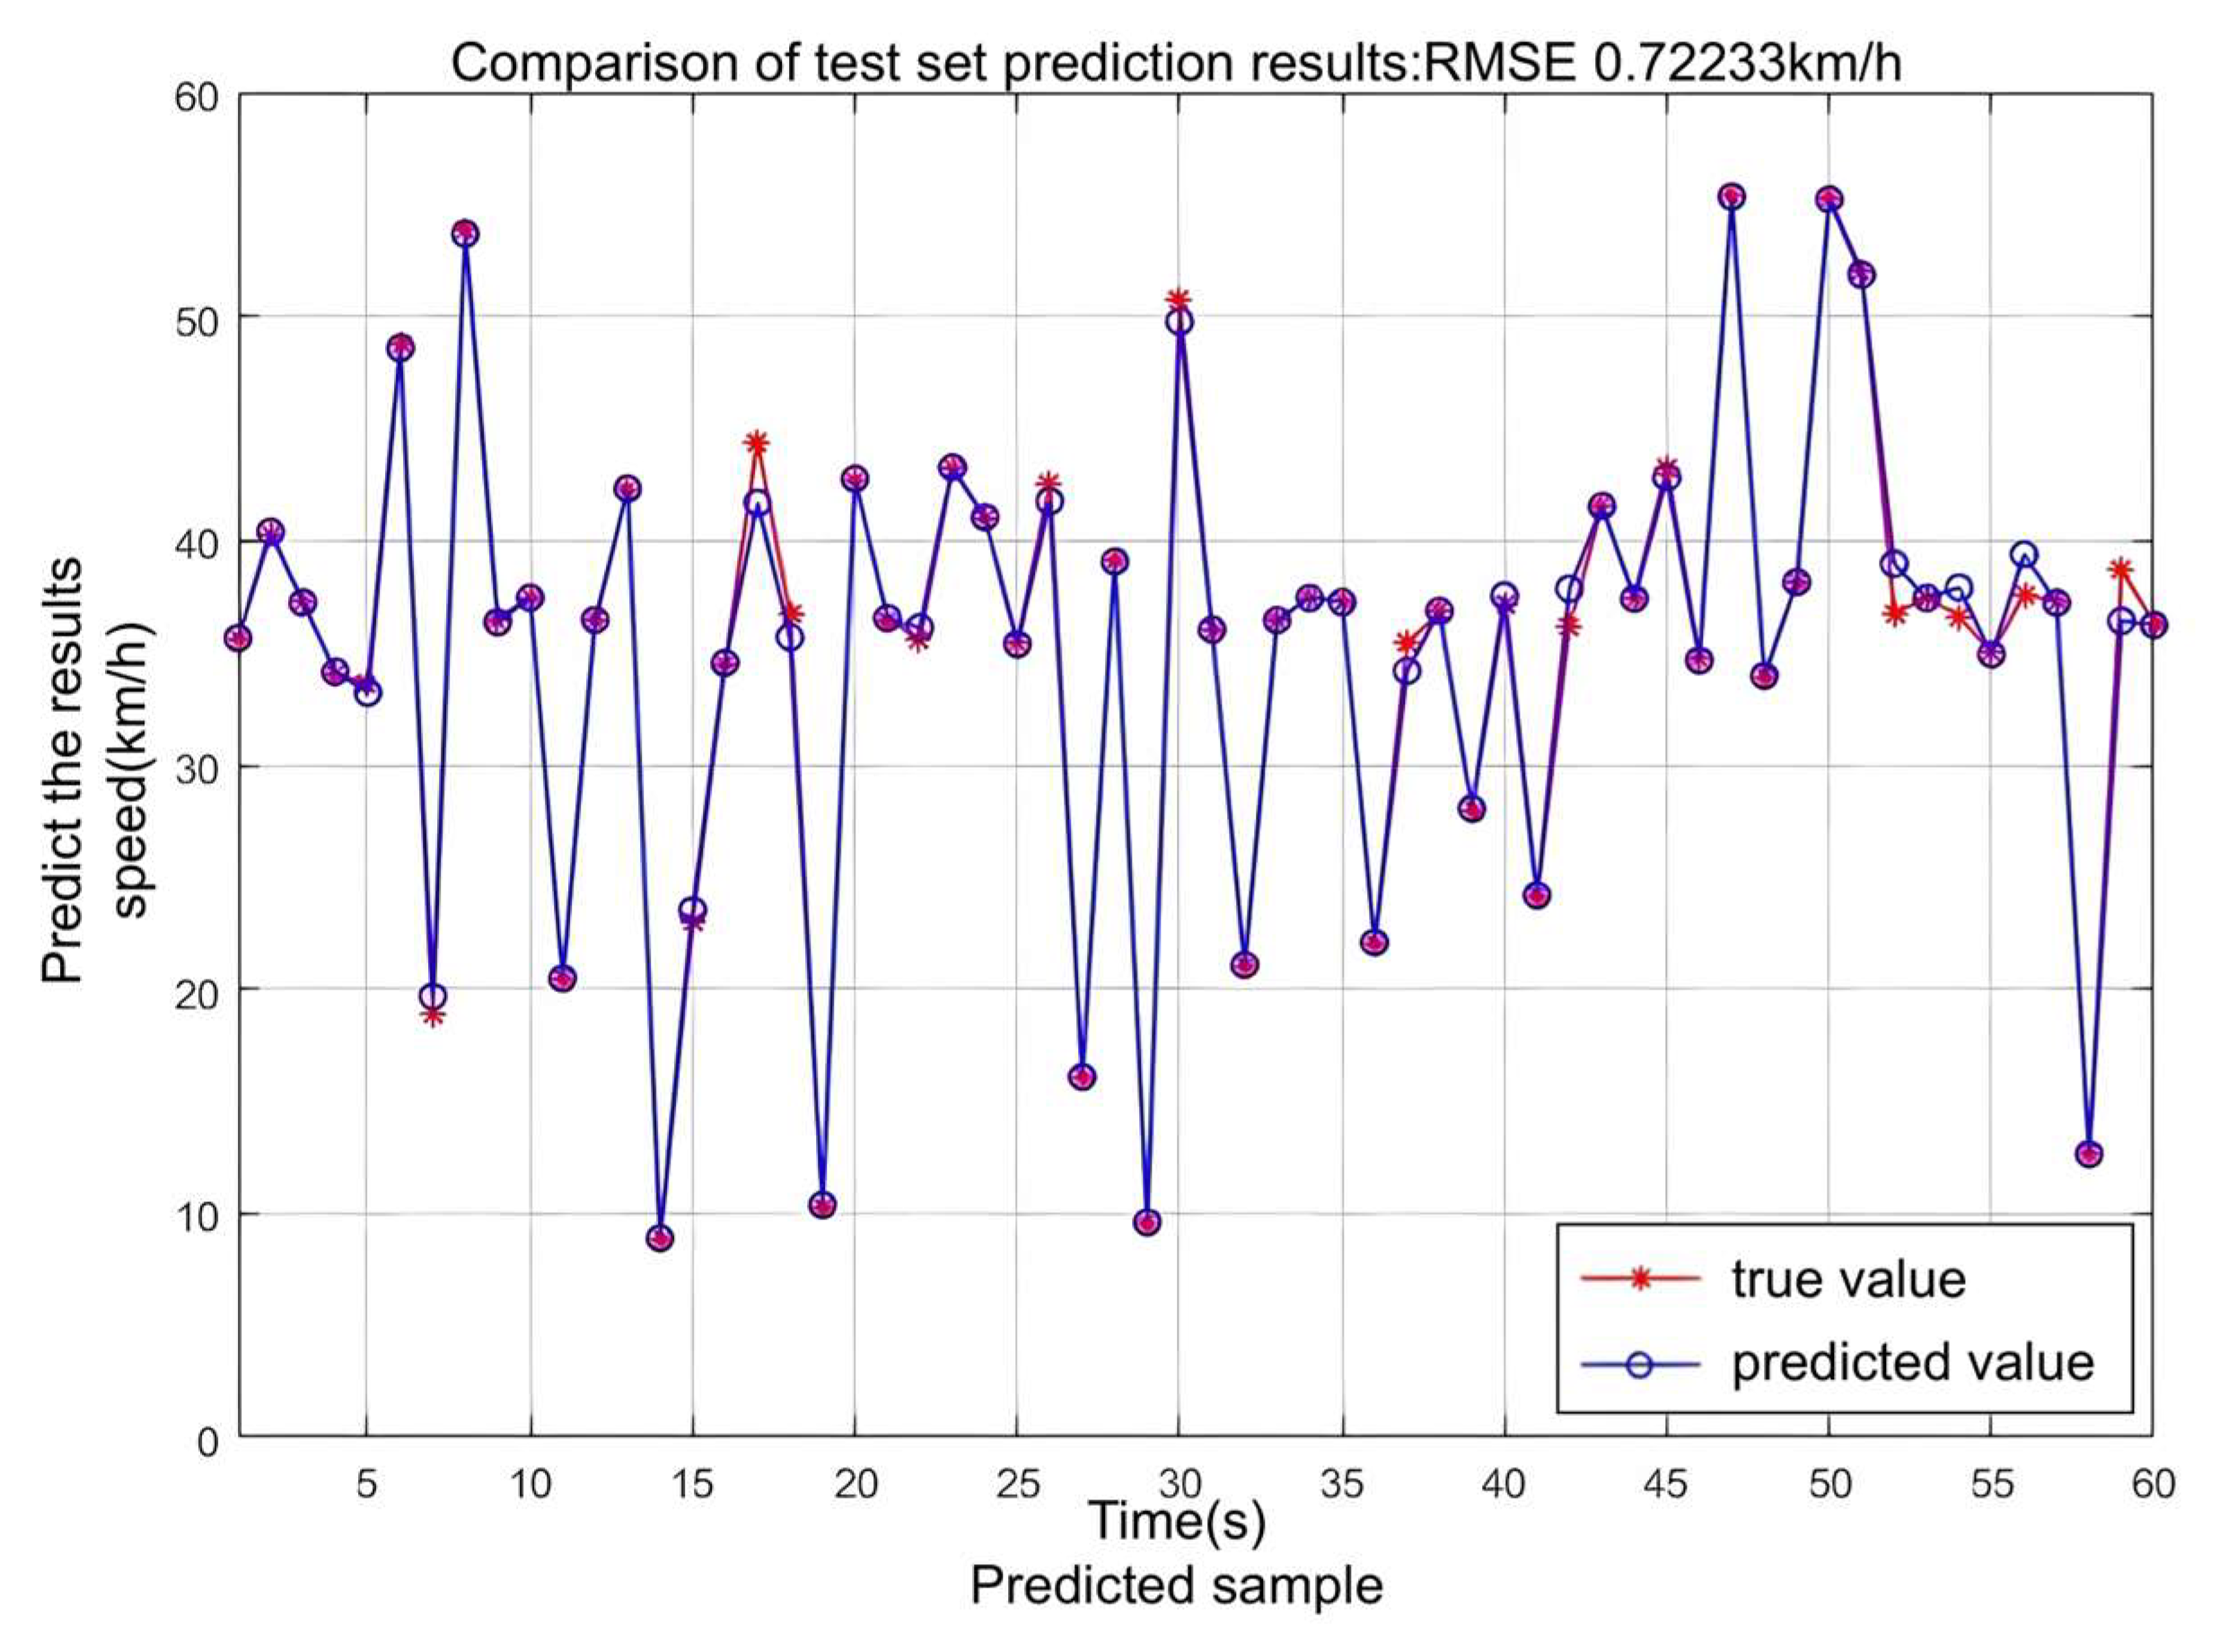
Prospective: the RMSE of the BP neural network model is 0.722 km/h, which gives a higher prediction accuracy compared to other methods such as fuzzy PI control (RMSE = 0.75 km/h) [
25] and deep learning optimized liquid cooling control (RMSE = 0.80 km/h) [
26], and can trigger cooling 10~15 s in advance;
Energy efficiency optimization: the combination of dynamic PID control and temperature feedback reduces energy consumption by 17.6% compared to the fixed threshold strategy, which is superior to the static energy-saving effect of the phase change material scheme;
Robustness: the standard deviation of temperature fluctuation is stable at 0.2 °C in the range of ambient temperature 25~40 °C. The adaptability is comparable to the multi-objective optimization framework, but the hardware cost is reduced by 50~60%.
The full text is structured as follows: we provide a detailed discussion of the experimental design and analysis methods, including multi-scenario real-vehicle data collection, K-means clustering to extract typical operating conditions, the construction and validation of a BP neural network model, and the establishment of the experimental platform in
Section 2.
Section 3 proposes a battery thermal management strategy based on work state prediction, combining PID control with a temperature feedback mechanism for dynamic regulation, and validates its effectiveness through AMESim simulation.
Section 4 conducts an in-depth discussion on the reliability of the prediction model, energy consumption and thermal performance balance, strategy robustness, and engineering application value and verifies the superiority of the strategy through comparative experiments.
Section 5 summarizes the research results, including temperature reduction, energy consumption optimization, and cost advantages, and looks forward to future research directions.
3. Battery Thermal Management Strategy Based on Working Condition Prediction
3.1. Coolant Flow Requirement Analysis
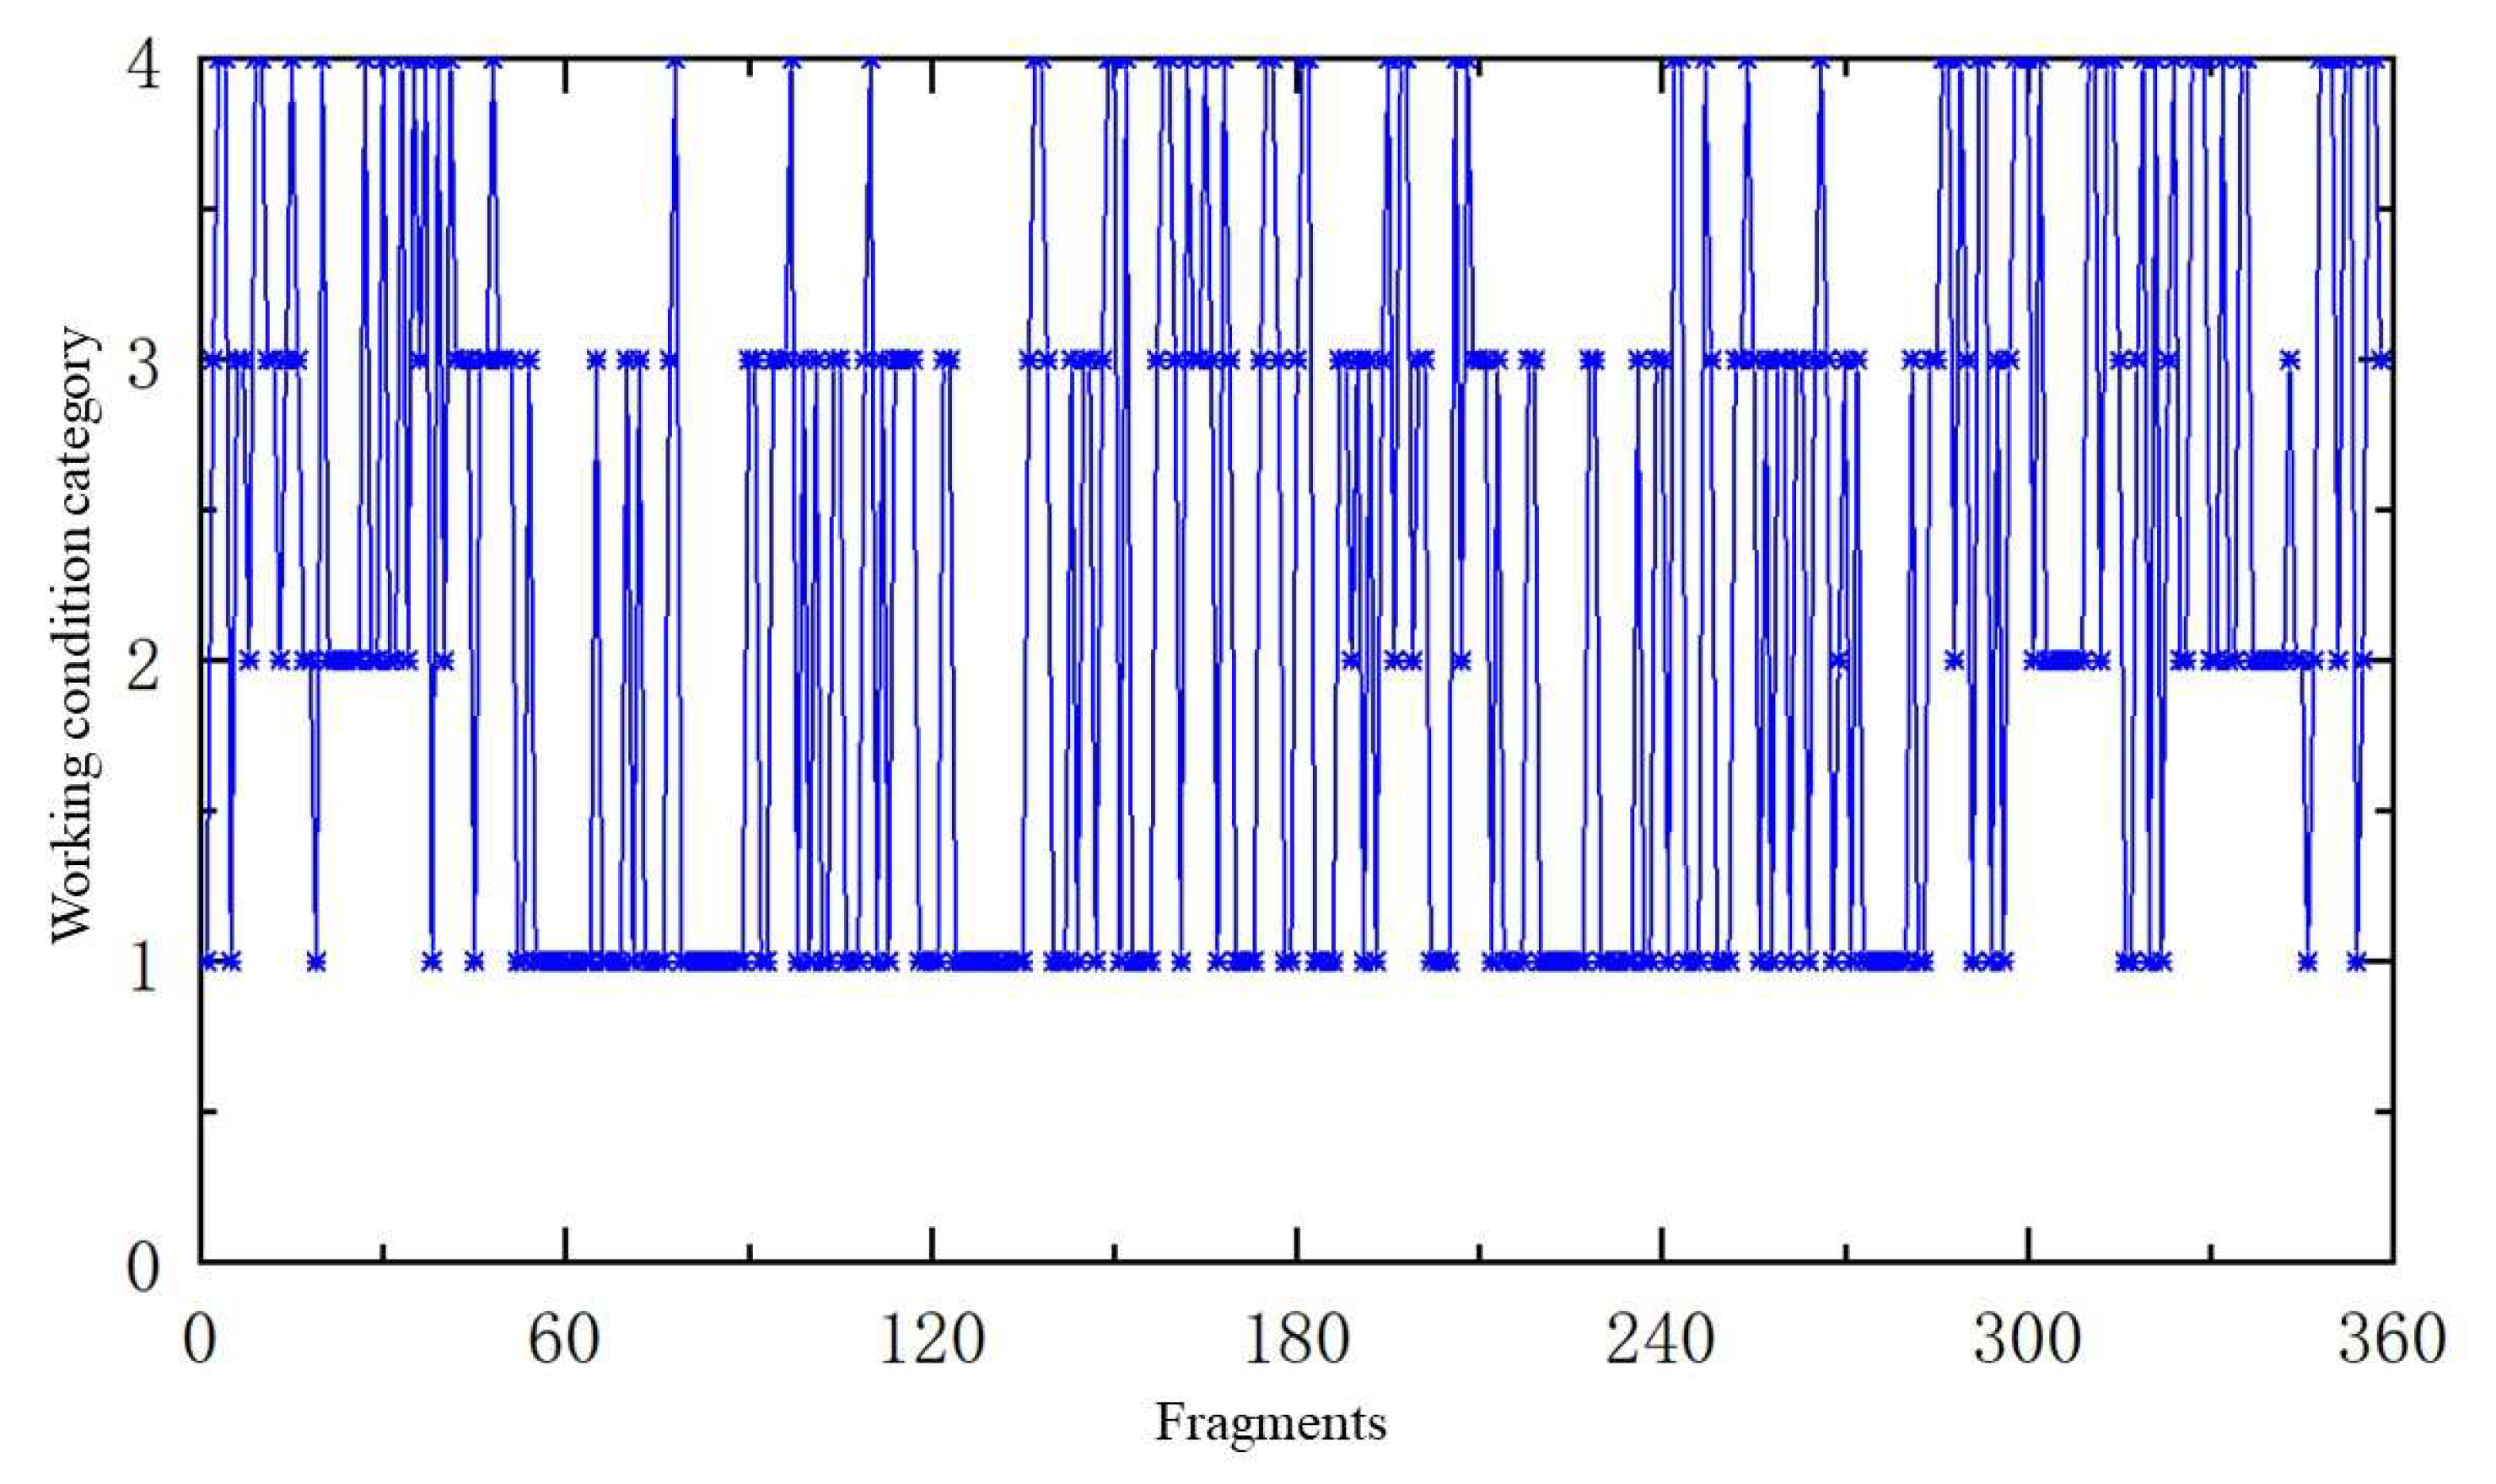
According to the clustering results (
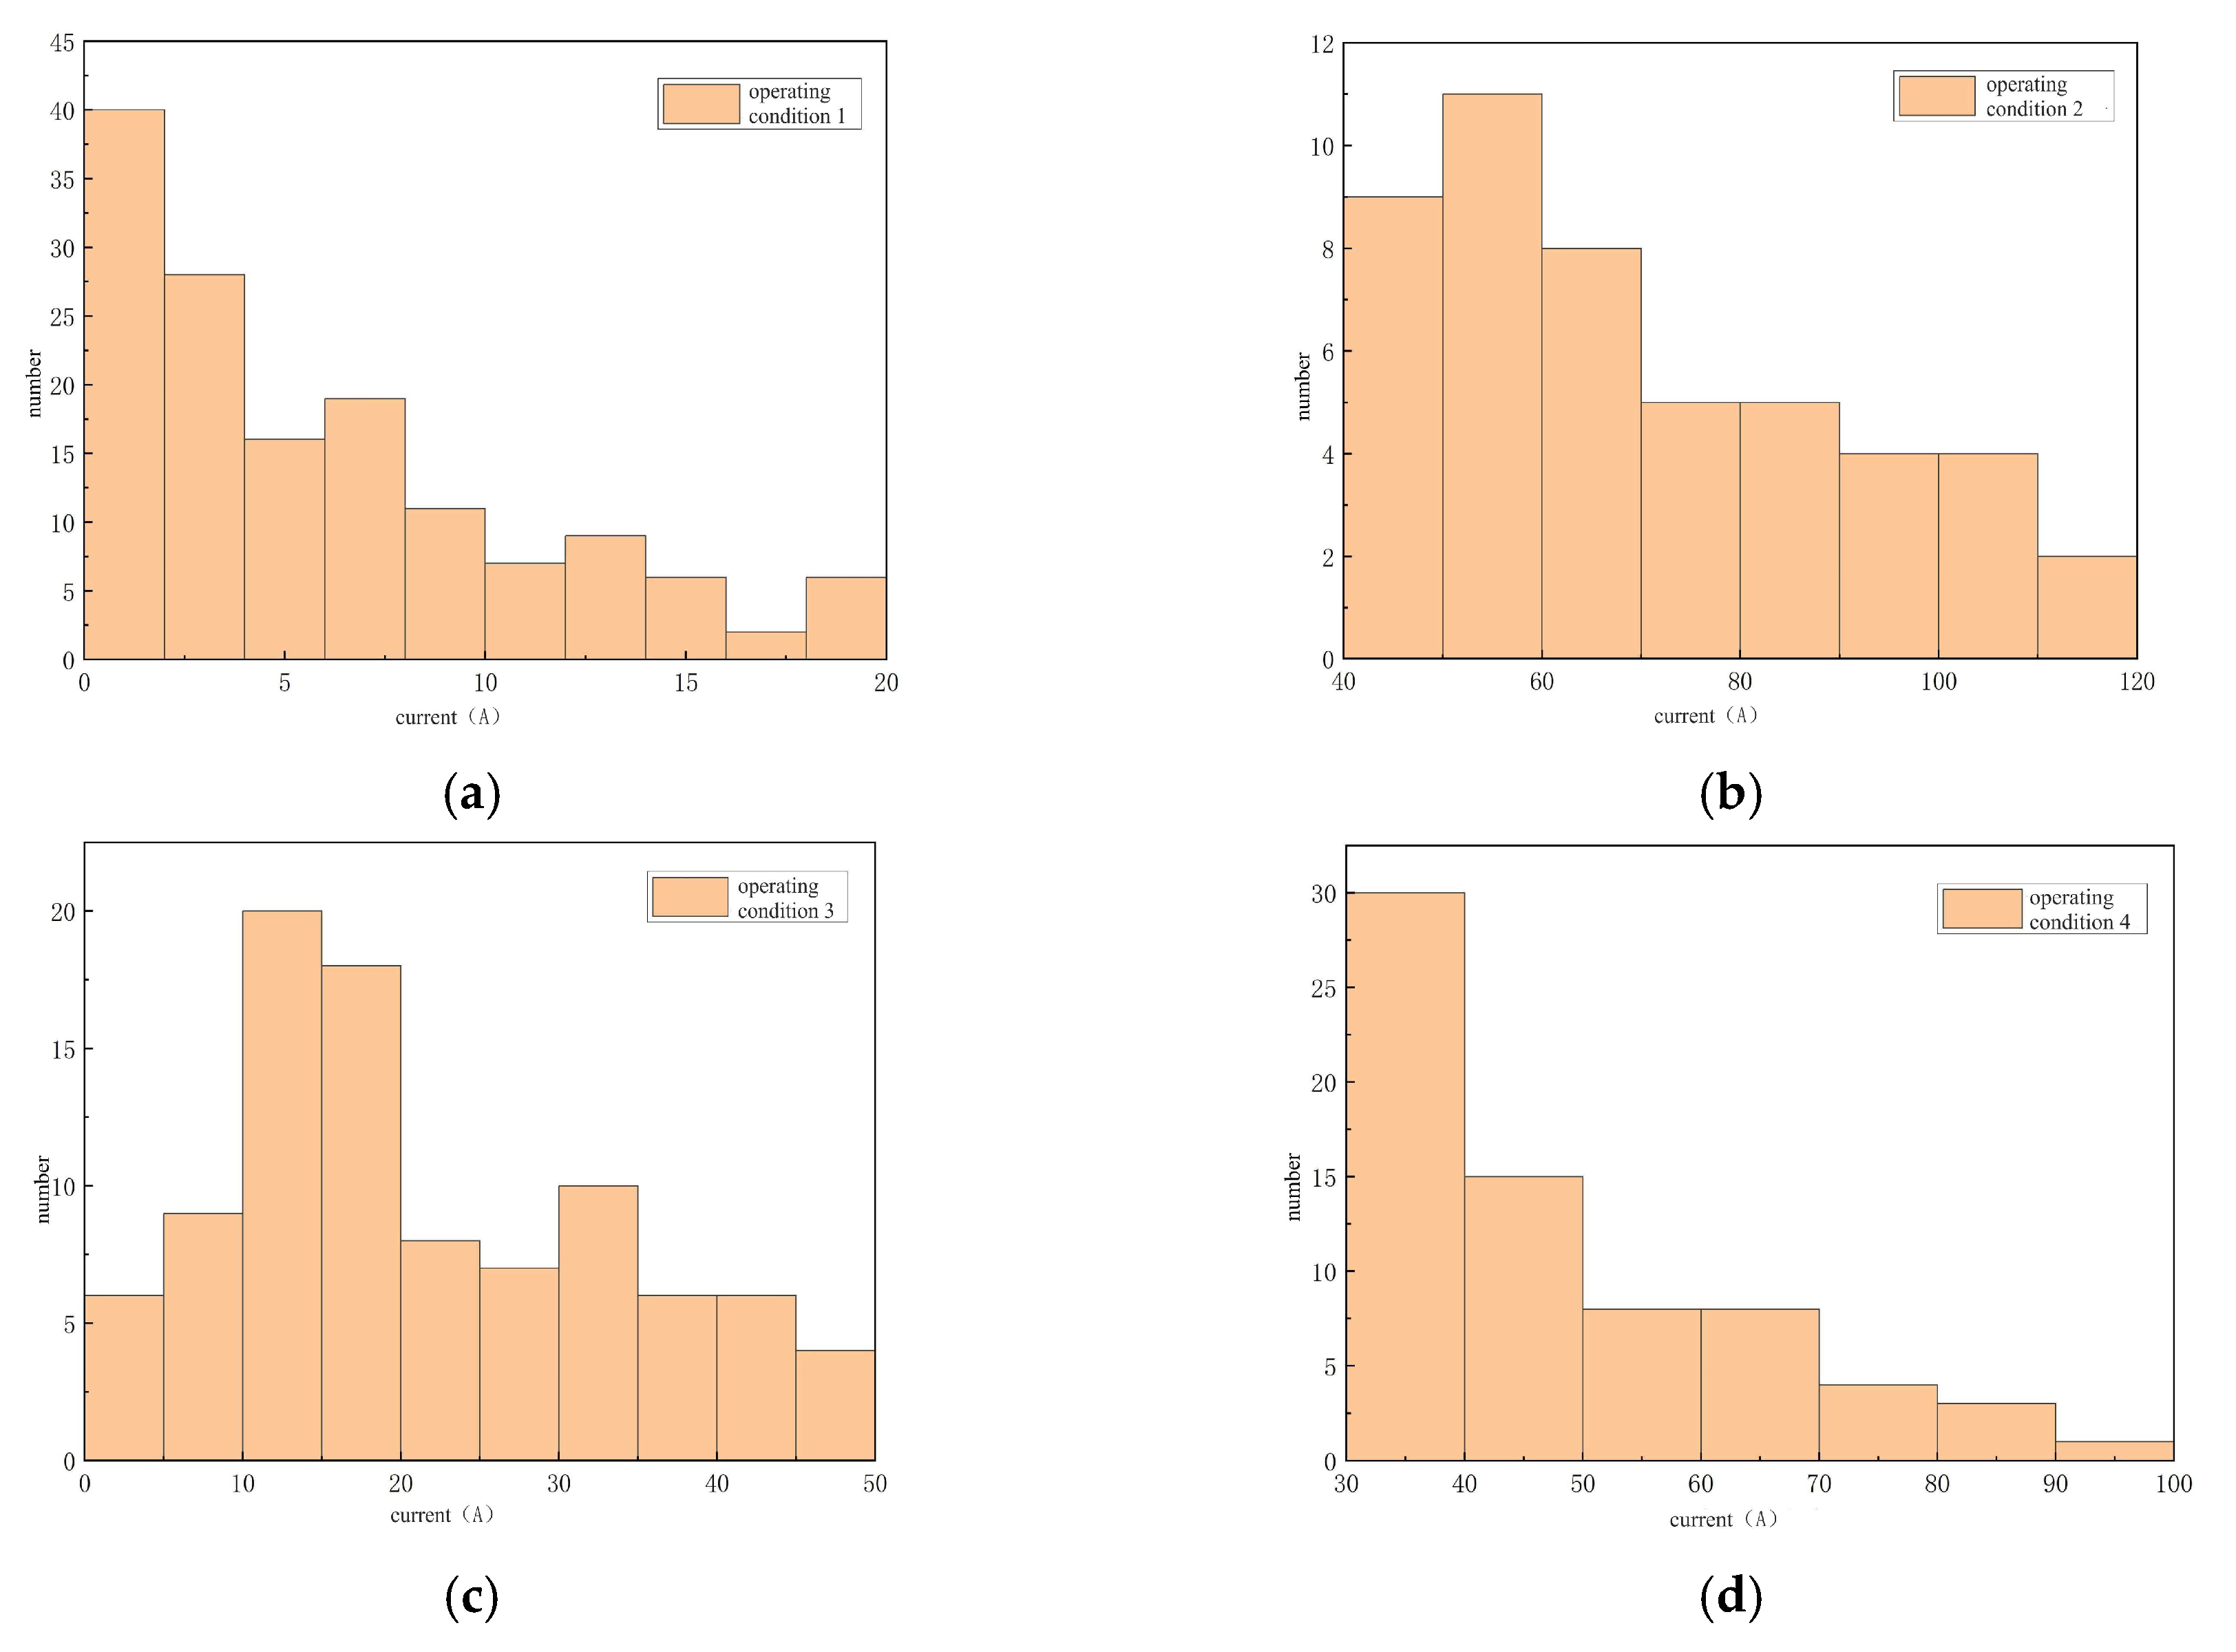
Figure 4), the 358 divided working condition segments were clustered to obtain four cluster centers representing four types of vehicle working conditions. Under different driving conditions, the current of the battery in the vehicle is also different (
Figure 12).
Working condition I represents congested driving conditions. As can be seen from
Figure 12, under this condition, the peak current of the battery is 20 A, and the proportion of currents within 10 A is relatively high. From this, it can be concluded that when an electric vehicle is driving at a low speed, and the number of stops is relatively large, the battery current is small. Working condition II represents high-speed driving conditions. The speed of the electric vehicle is relatively high, so the corresponding battery current is also high, and the maximum current can reach 120 A.
Working condition III represents the urban road driving conditions. The speed is relatively low, and the parking frequency is relatively high. The battery current is smaller compared to working condition IV. Working condition IV represents the suburban driving conditions. The speed is relatively higher than that in working condition III, so the current is also relatively higher. As can be seen from the
Figure 12, under working condition IV, the number of battery currents between 30 A and 40 A is close to half. This is because the vehicle has a steady driving speed, and the battery current remains stable. However, its maximum current can reach 100 A. This is because, in suburban driving conditions, there are situations of sudden acceleration. At this time, the motor requires a larger current for driving, resulting in a sharp increase in the battery current.
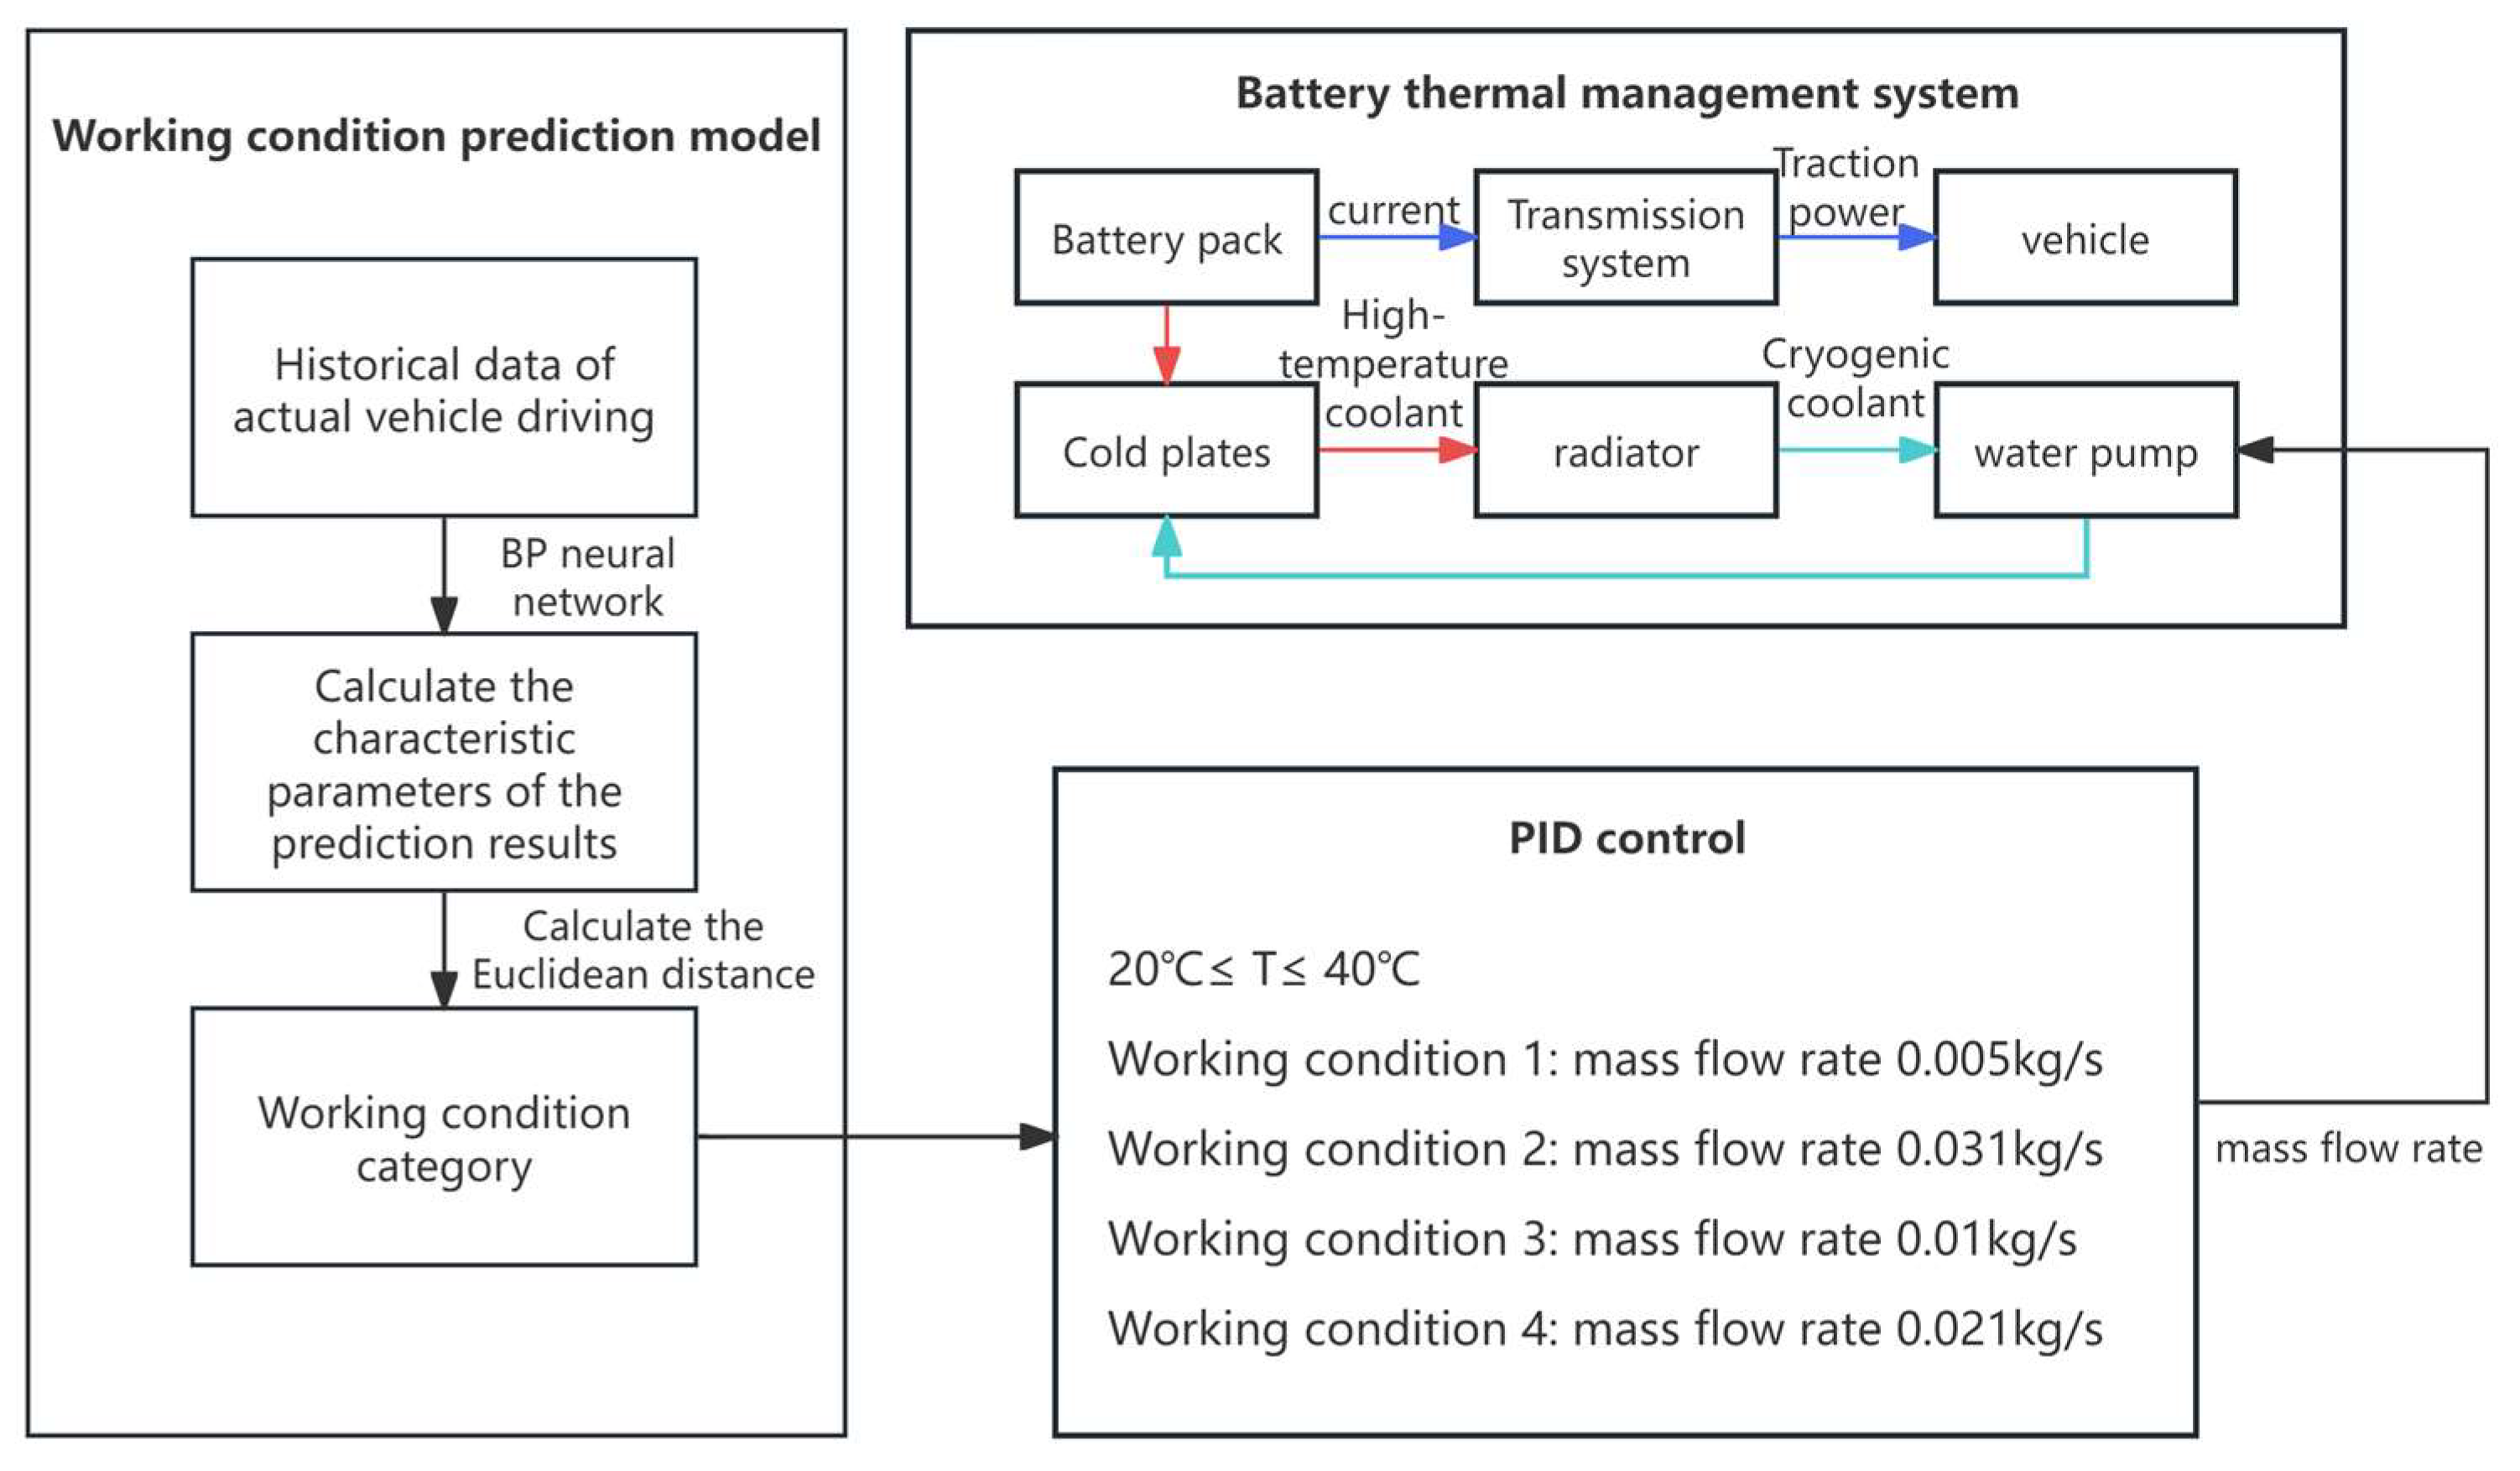
A direct mapping of the operating condition category to cooling demand is established by converting flow rate to mass flow rate through Equation (4).
where
: Coolant mass flow rate (unit: kg/s), representing the mass of coolant flowing through the battery cooling system per unit time, directly related to the heat dissipation capacity of the thermal management system.
: Coolant density (unit: kg/m3).
: Average flow velocity of coolant in the pipeline (unit: m/s).
: Cross-sectional area of the cooling pipe (unit: m2).
3.2. PID Control Strategy Design
As shown in
Figure 13, the thermal management system achieves dynamic regulation through the following steps:
Condition prediction: real-time input of driving data to the BP network and output of vehicle speed for the next 60 s;
Work condition identification: calculating feature parameters of predicted segments and matching to the nearest clustering center;
Flow rate adjustment: set the target flow rate of coolant according to the category of working conditions, and the PID controller (Equation (5)) dynamically adjusts the speed of the water pump to ensure a fast and stable flow rate.
3.3. AMESim Simulation Verification
- (1)
Basic modeling
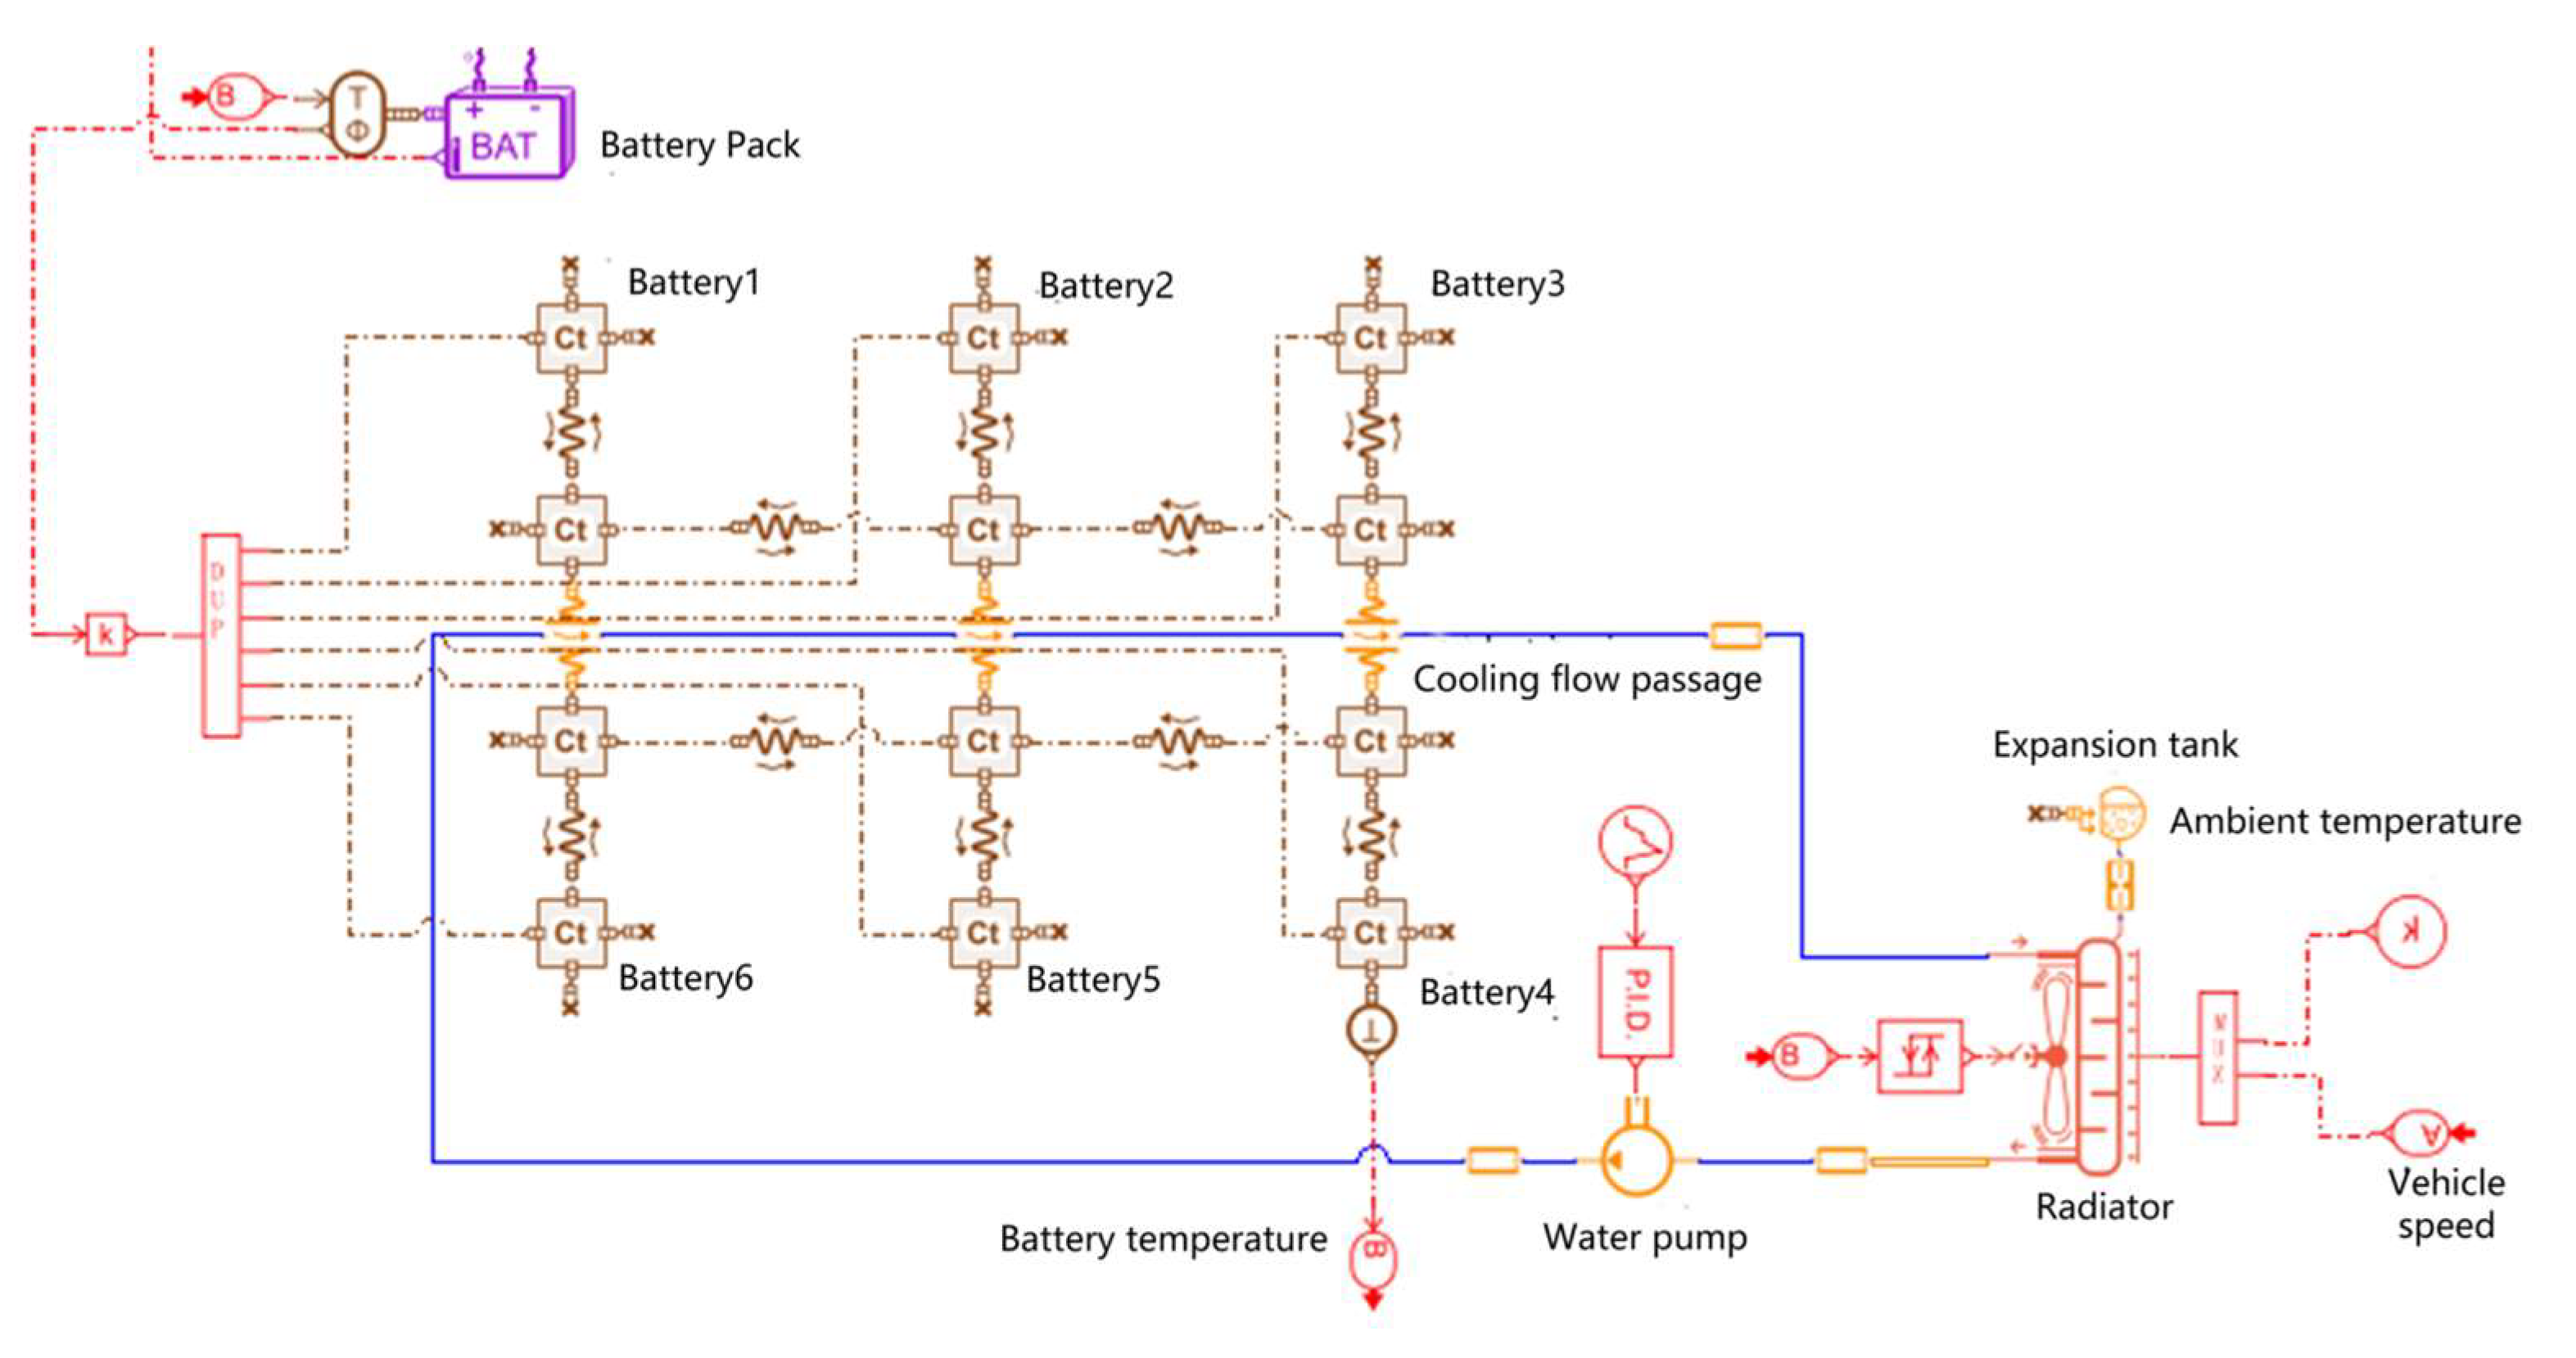
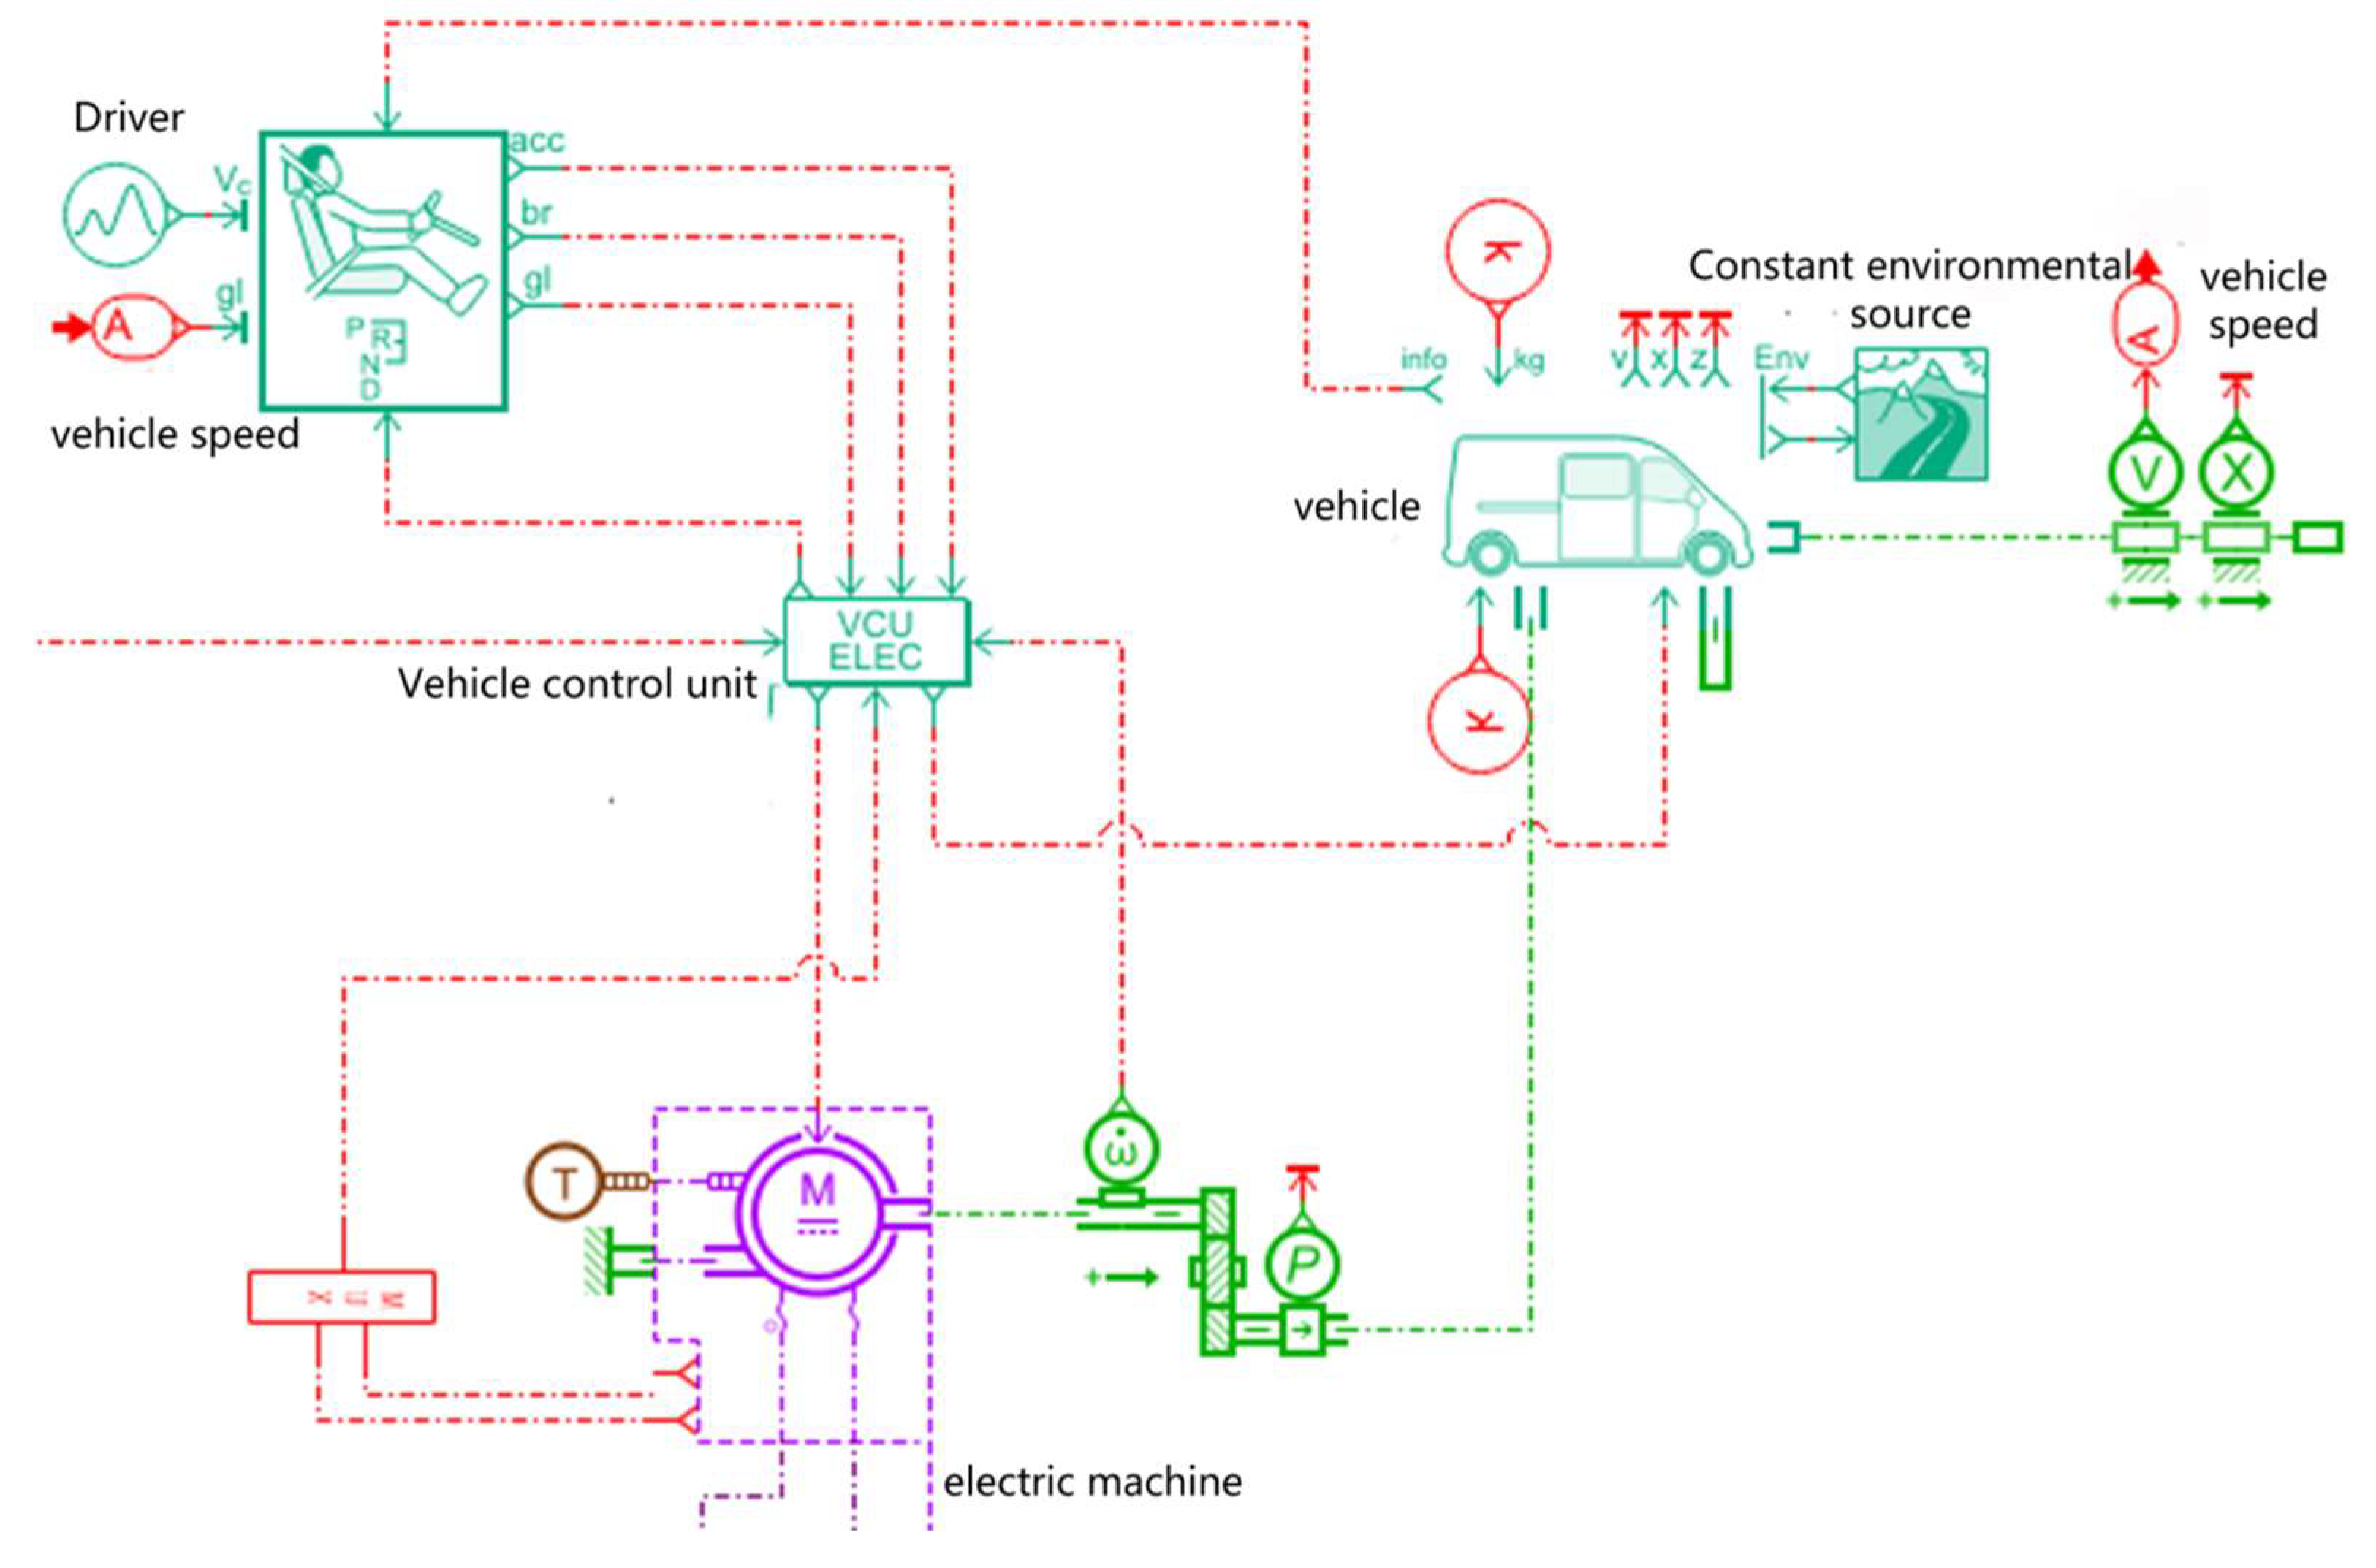
We established a liquid cooling system model (
Figure 14) and a whole vehicle model (
Figure 15) in AMESim. The implicit integration solver is adopted, and the time step is 0.01 s. The specific parameters are as follows.
Cold plate runner: cross-section 0.001 m2, length 0.5 m, material aluminum.
Coolant: 50% aqueous solution of ethylene glycol, density 1120 kg/m3.
Battery pack: 120S2P Configuration, total voltage 384 V, capacity 100 Ah (
Table 5).
Battery thermal resistance: 0.05 K/W.
Heat generation model: Bernardi heat generation model, calculated as
In this equation, represents current (A), represents battery internal resistance (Ω), represents battery overpotential (V), and represents heat generated (W).
Environmental conditions: ambient temperature 25 °C, relative humidity 50%.
- (2)
Optimization of model parameters
In order to improve the accuracy and reliability of the model, we optimized the key parameters in the model through experimental data. The specific steps are as follows:
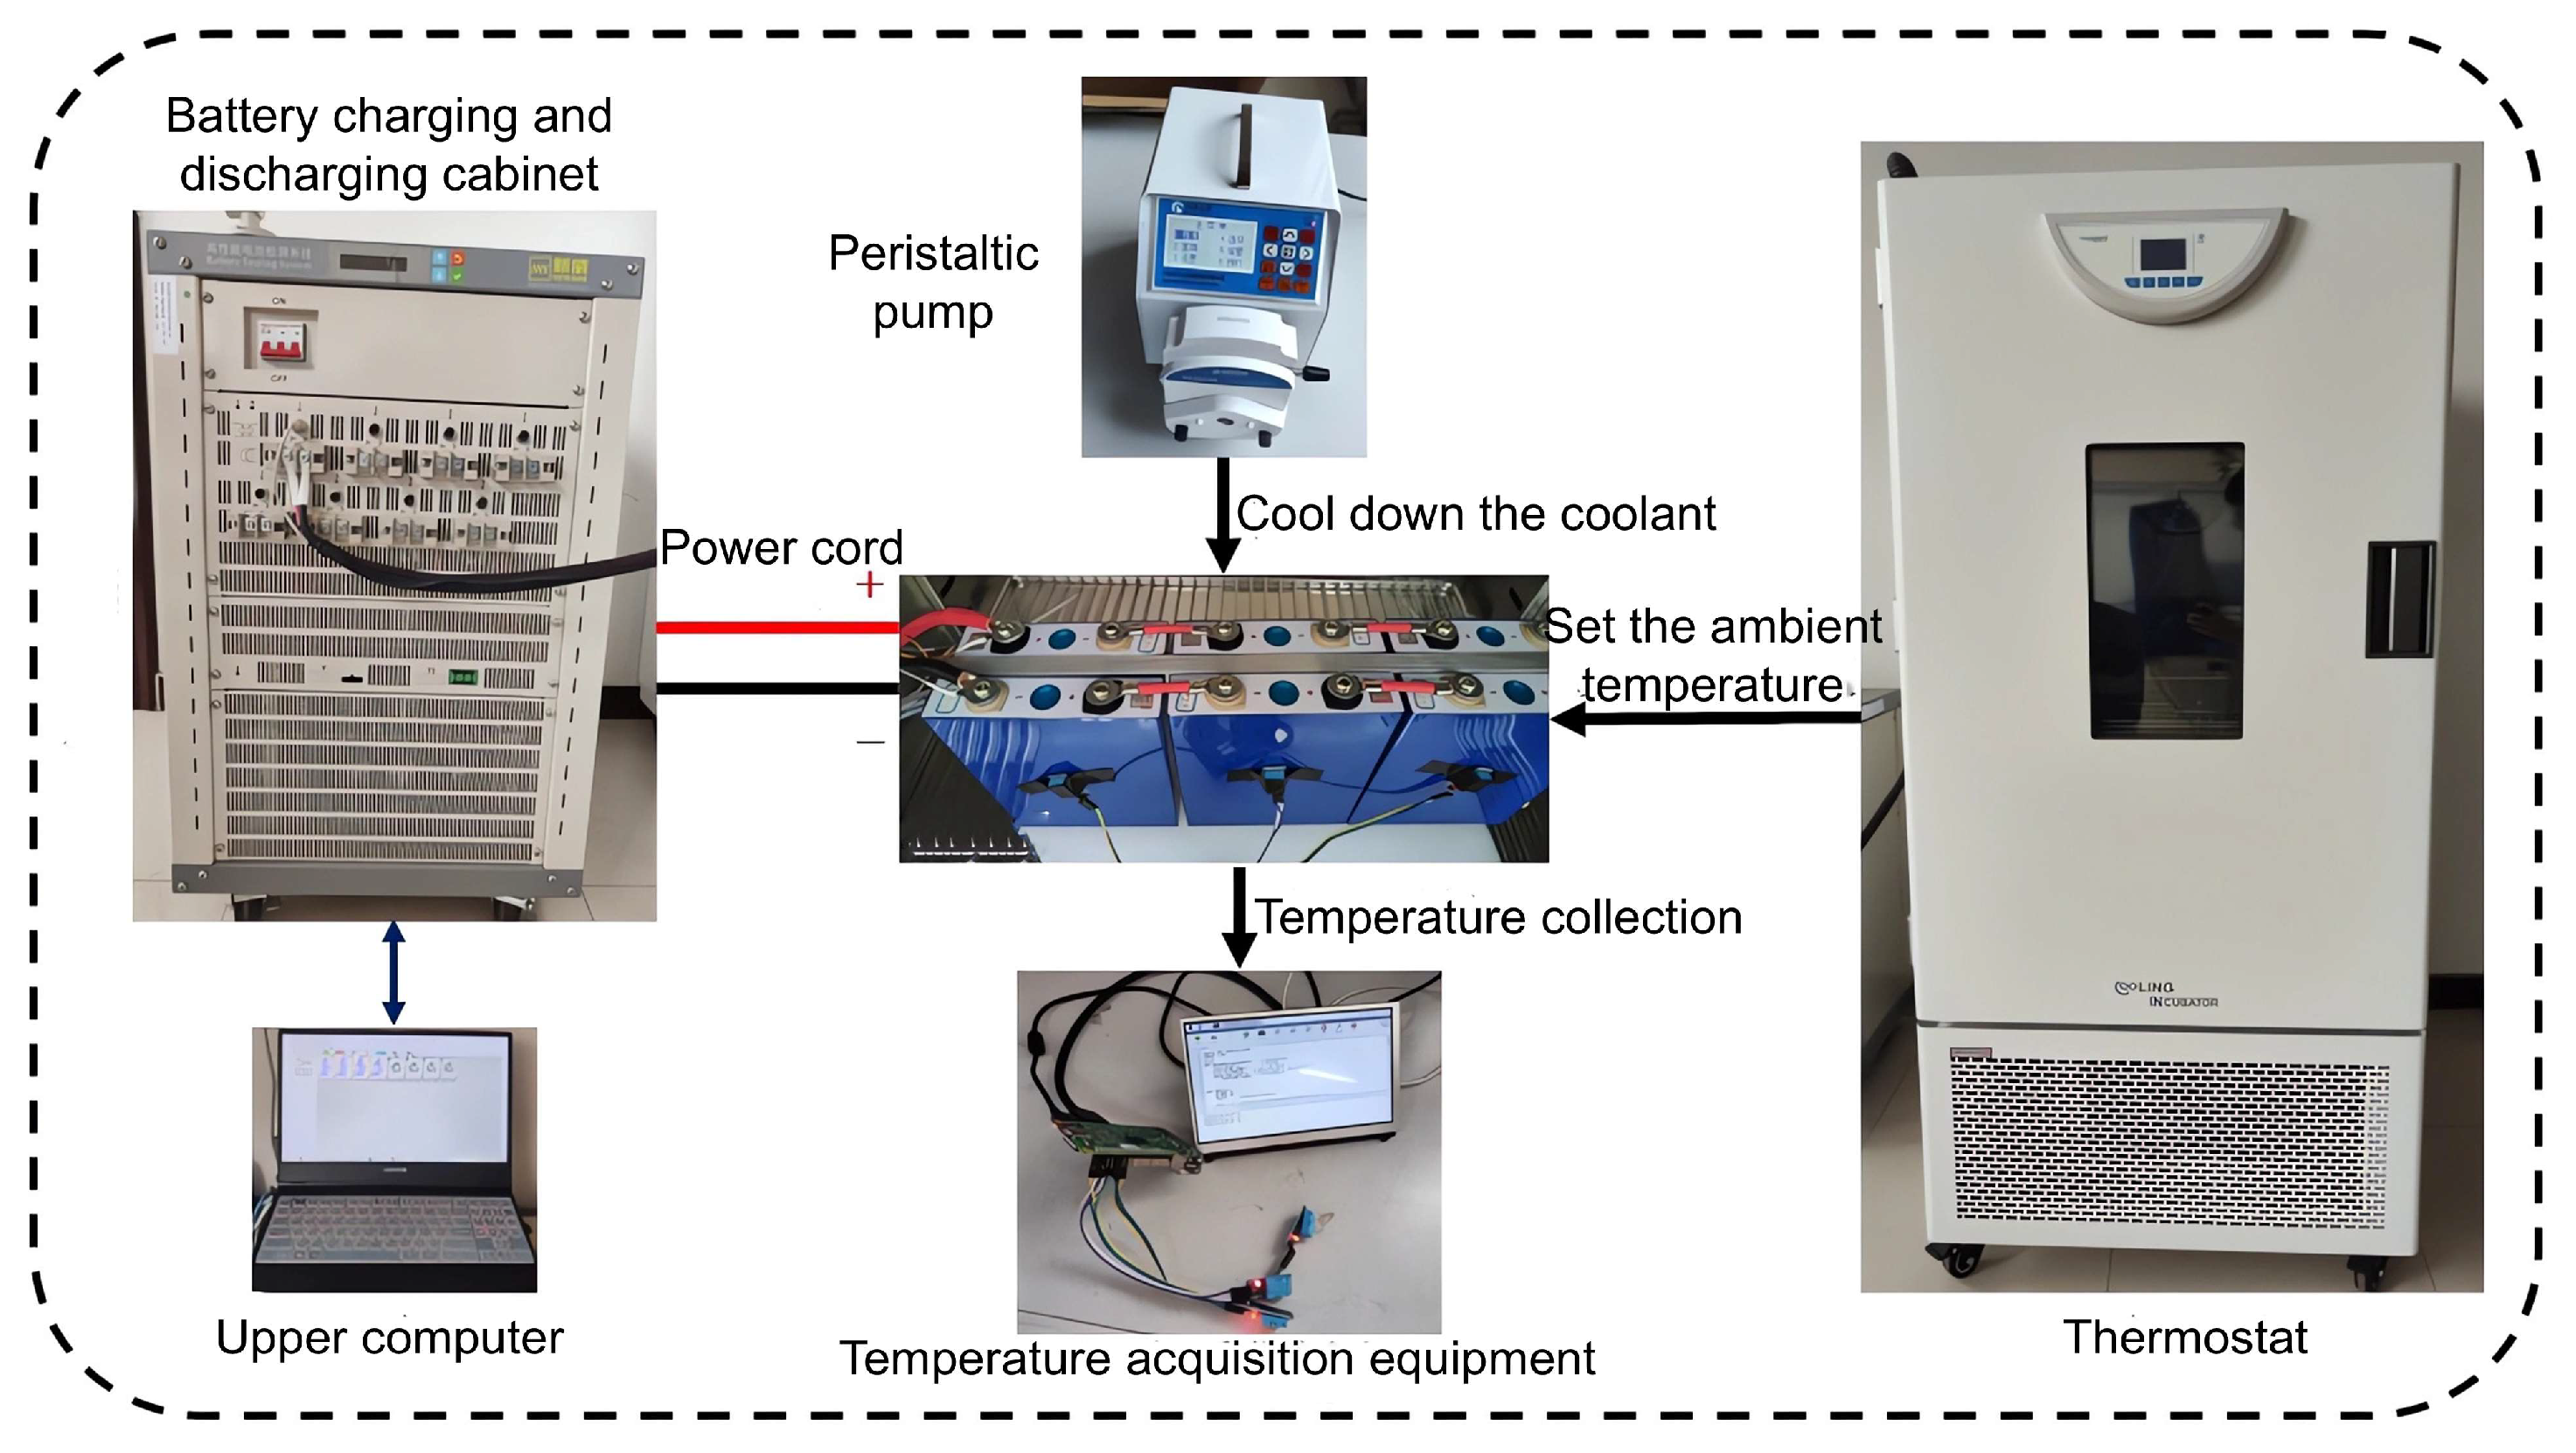
Experimental data acquisition: On the experimental platform, we collected data such as battery temperature, coolant flow, and inlet and outlet temperature under different working conditions.
Parameter adjustment: Based on the experimental data, we adjusted the key parameters in the model, such as the heat transfer coefficient, fluid resistance, and battery heat generation rate. By comparing the temperature rise curve of the battery in the experiment with the output of the model, the heat transfer coefficient was adjusted to ensure that the model could accurately reflect the heat exchange process between the battery and the coolant.
Validation and optimization: Through several iterations of adjustment, we ensure that the output results of the model are highly consistent with the experimental data. The validation results of the model show that the prediction error of the battery temperature is within ± 0.5 °C, and the prediction error of the coolant flow rate is within ± 5%.
- (3)
Model Validation
In order to further verify the accuracy of the model, we carried out simulation verification in AMESim. The simulation results show that based on the optimized model, the key parameters, such as the maximum battery temperature, temperature difference, and coolant flow rate, are highly consistent with the experimental data. For example, under the high-temperature condition, the model predicts a maximum battery temperature of 31.2 °C, while the experimentally measured temperature is 31.0 °C, with an error of 0.2 °C only. This indicates that our model can accurately reflect the operating characteristics of the actual thermal management system. Our strategy reduced the battery’s maximum temperature by 3.2 °C and the high-temperature duration by 18%. The temperature reduction brings certain benefits. For instance, lowering the maximum temperature may decrease internal thermal stress and chemical side reactions, suggesting a potential battery life extension. Similarly, a shorter high-temperature period may reduce cooling system runtime and save cooling power. The temperature reduction also likely enhances the safety margin by moving the battery’s operating conditions further from thermal runaway thresholds.
4. Discussion
4.1. Reliability and Practical Fit of Work Condition Prediction Models
The BP neural network-based prediction model shows good generalization ability on the test set, and its root mean square error (RMSE = 0.722) with maximum relative error (6.2%) indicates that the model is able to effectively capture the temporal characteristics of the vehicle speeds (
Figure 9).
Further analysis of the distribution of clustering centers between predicted and actual conditions reveals that the deviation of the Euclidean distance for the four types of conditions (congested, urban, suburban, and high-speed) is less than 5%, and the distribution trends of the characteristic parameters (e.g., stopping ratio, average vehicle speed) are consistent. This result verifies the ability of the prediction model to characterize complex driving behaviors, especially in highly dynamic scenarios (e.g., rapid acceleration), and still maintains high prediction accuracy, which lays the foundation for the advanced response of subsequent thermal management strategies.
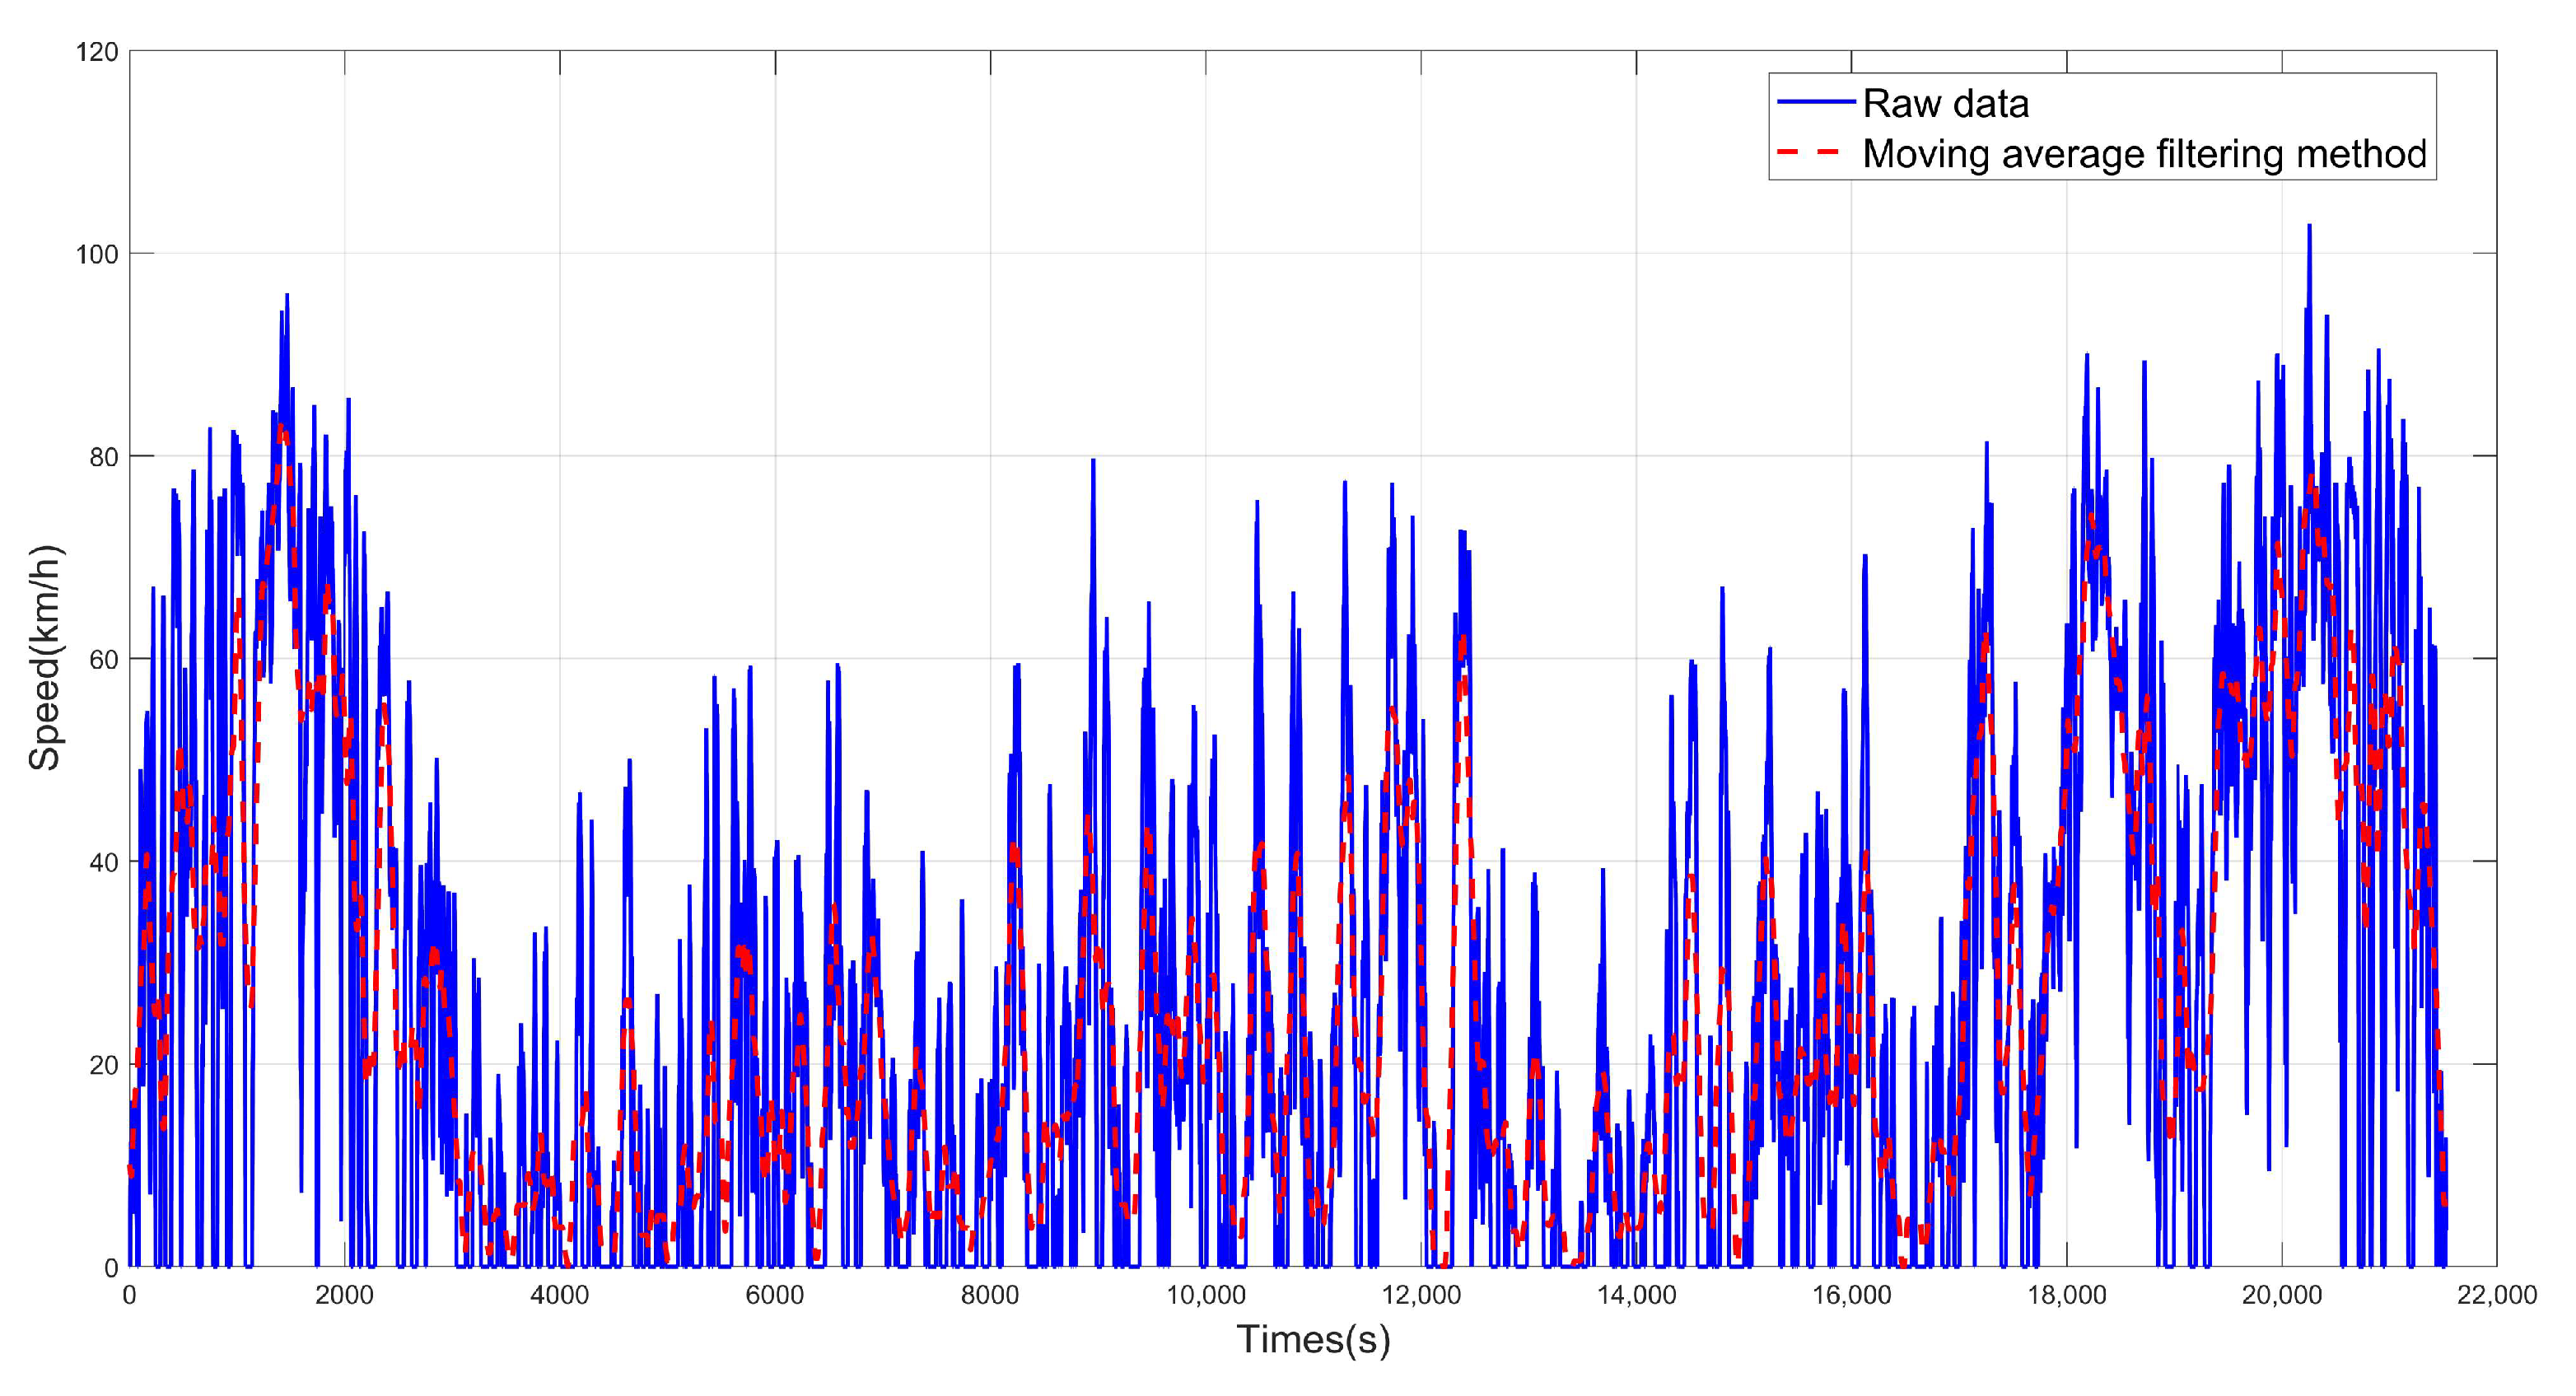
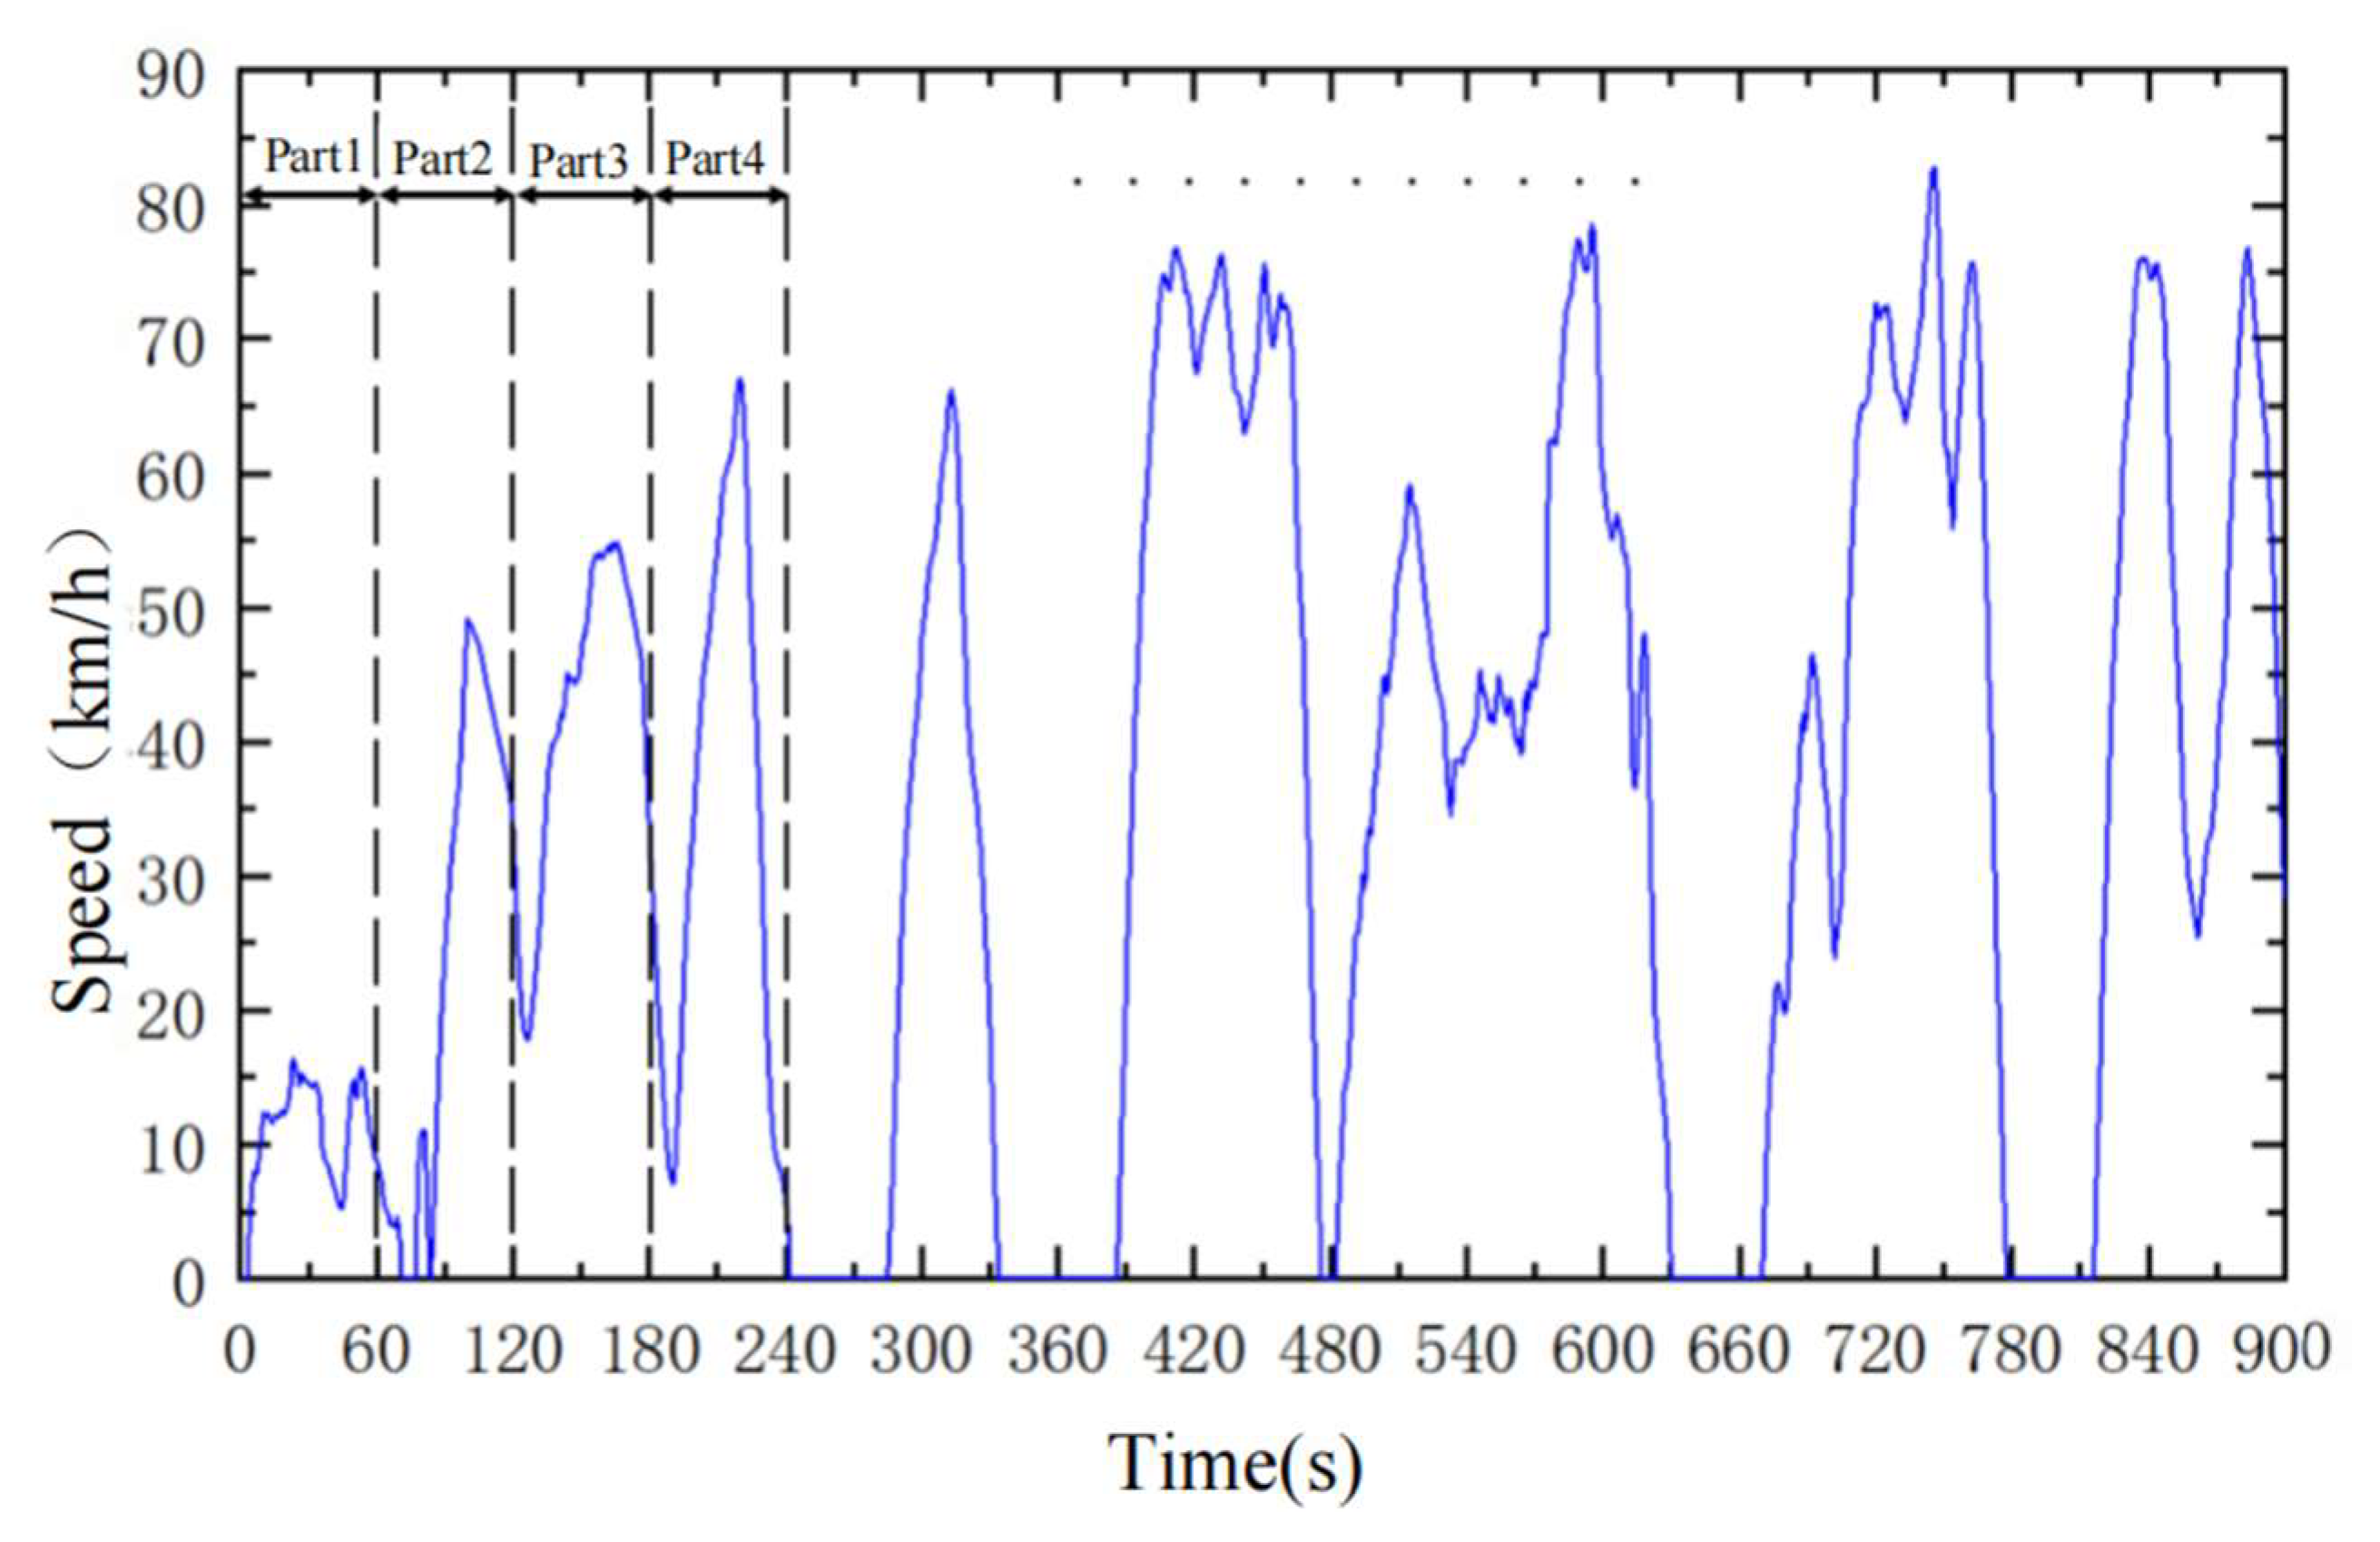
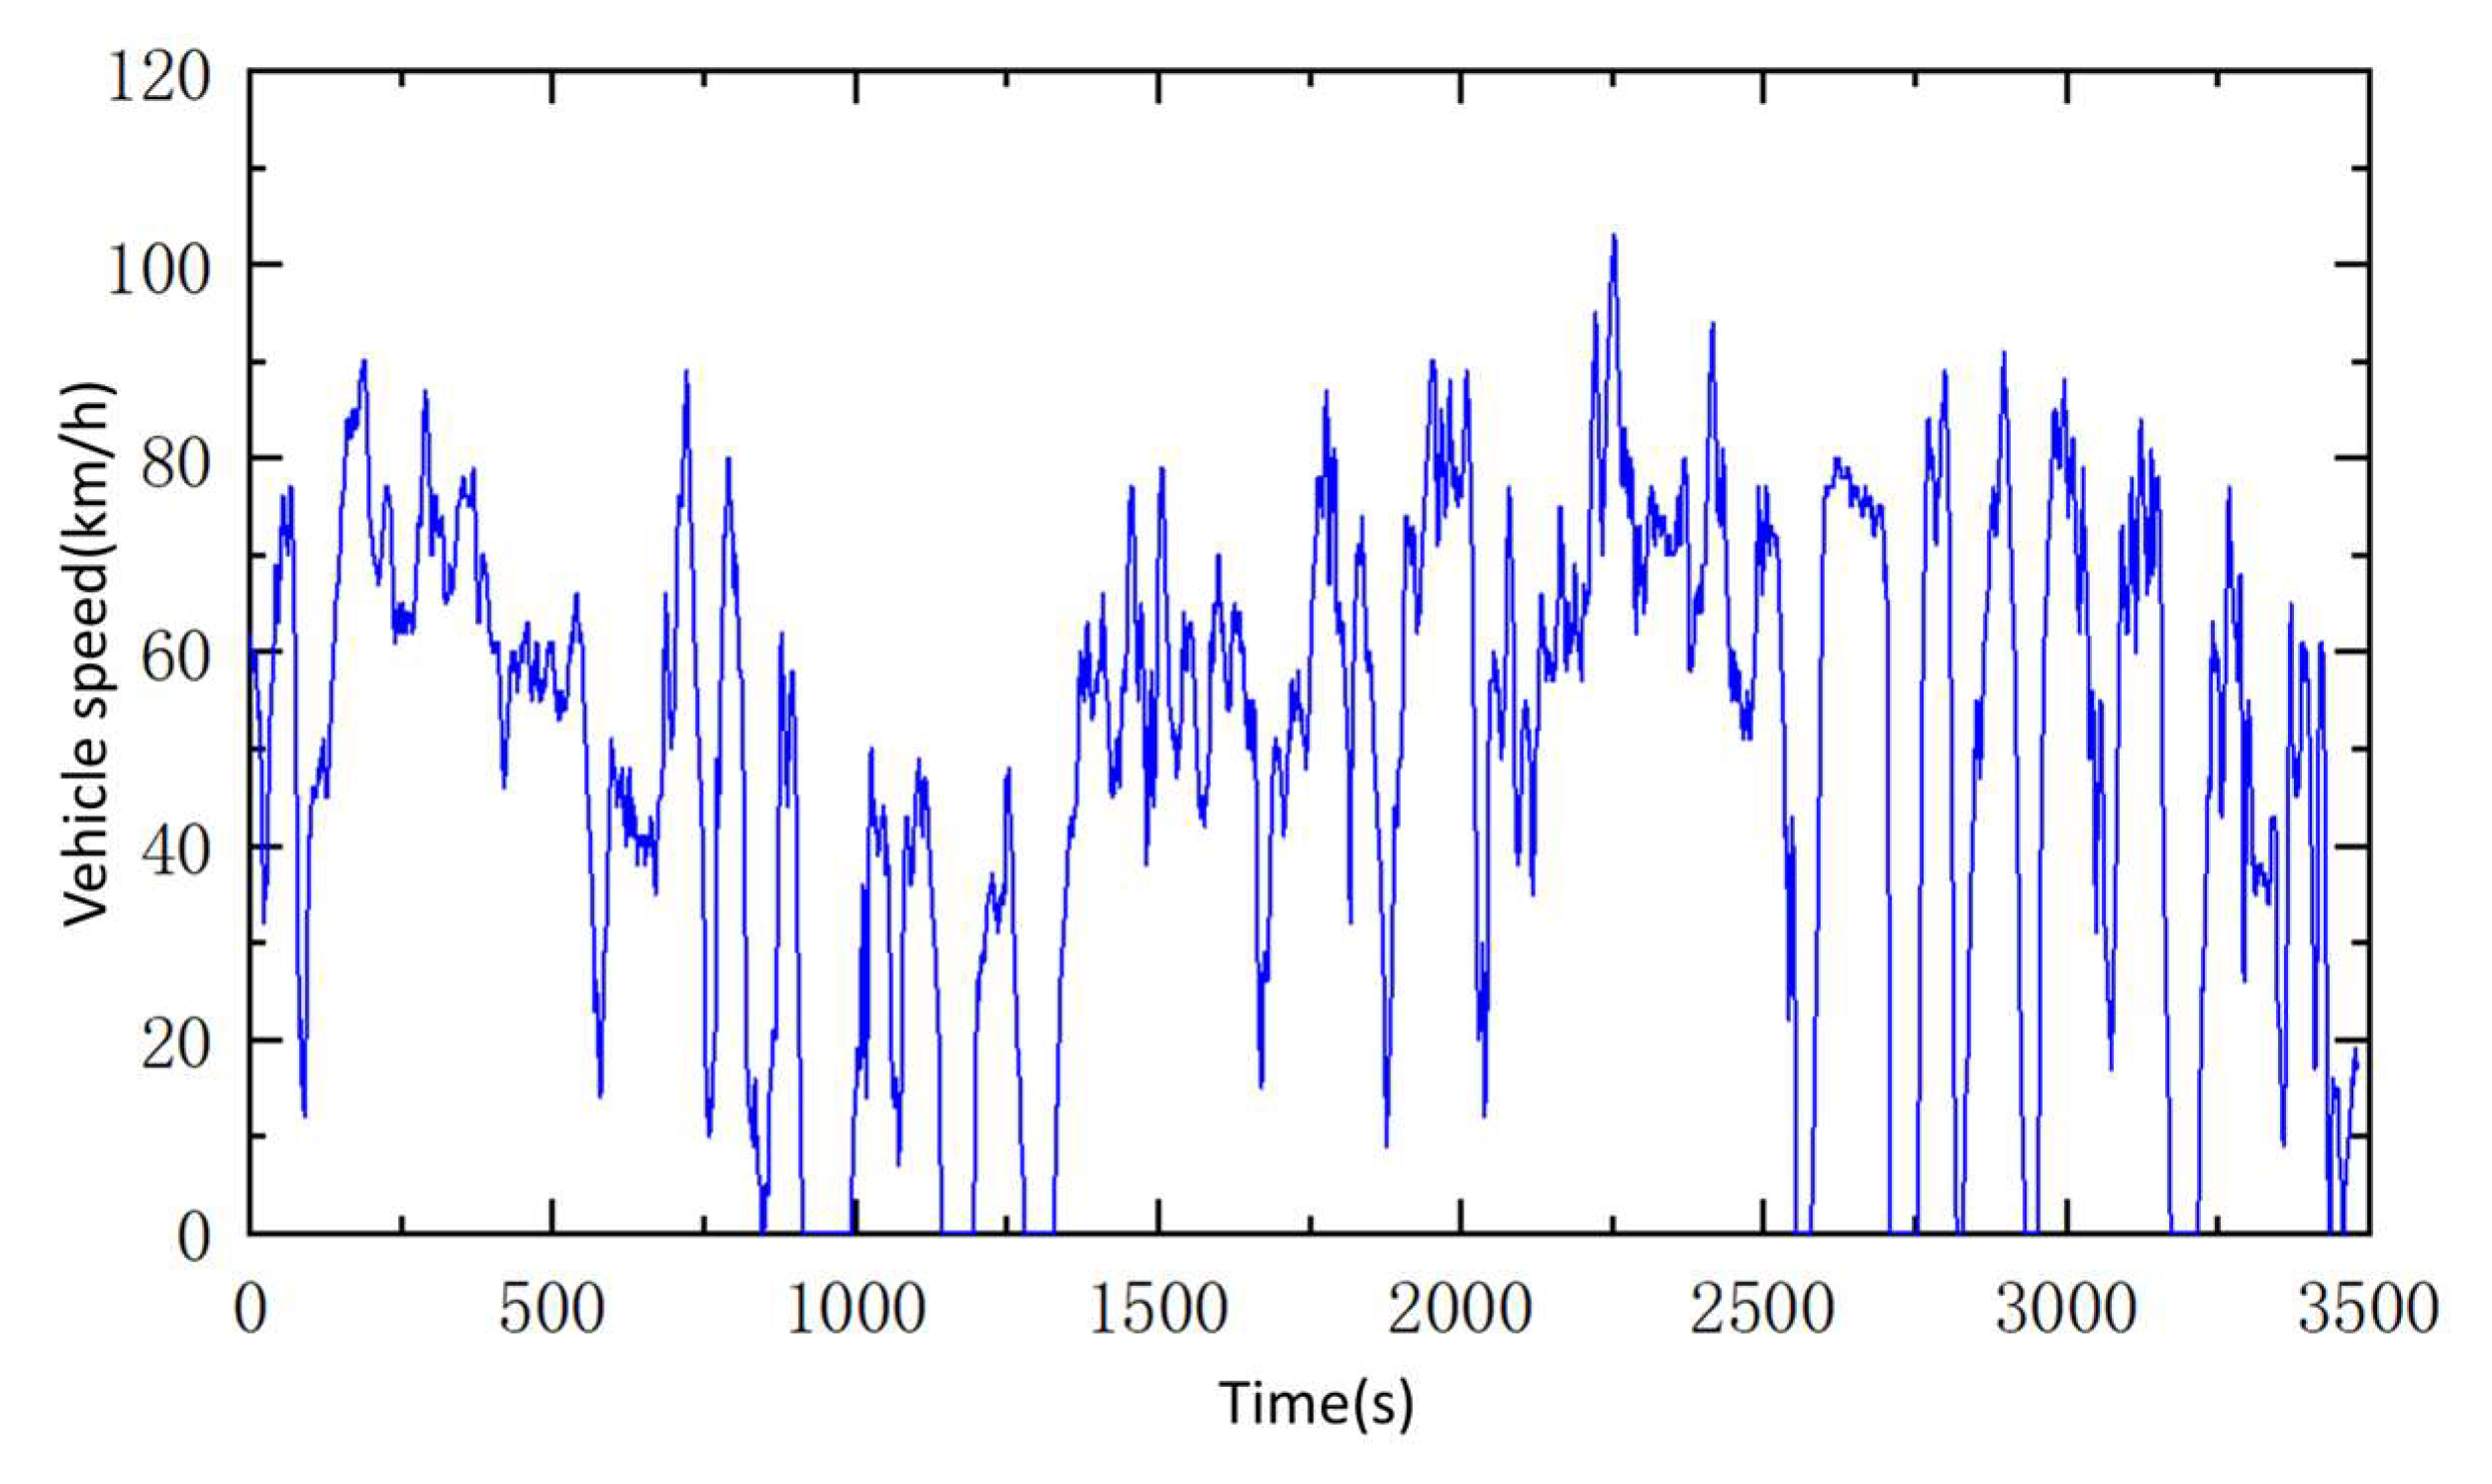
Compared with traditional methods (WLTC cycle [
27]), the naturalistic driving method collects more random and realistic data, but the problem of large data volume is effectively solved by a fixed step length method (60 s segments). The introduction of the K-means clustering algorithm (k = 4) further simplifies the logic of driving condition classification.
4.2. Energy Consumption and Thermal Performance Balance of Thermal Management Strategies
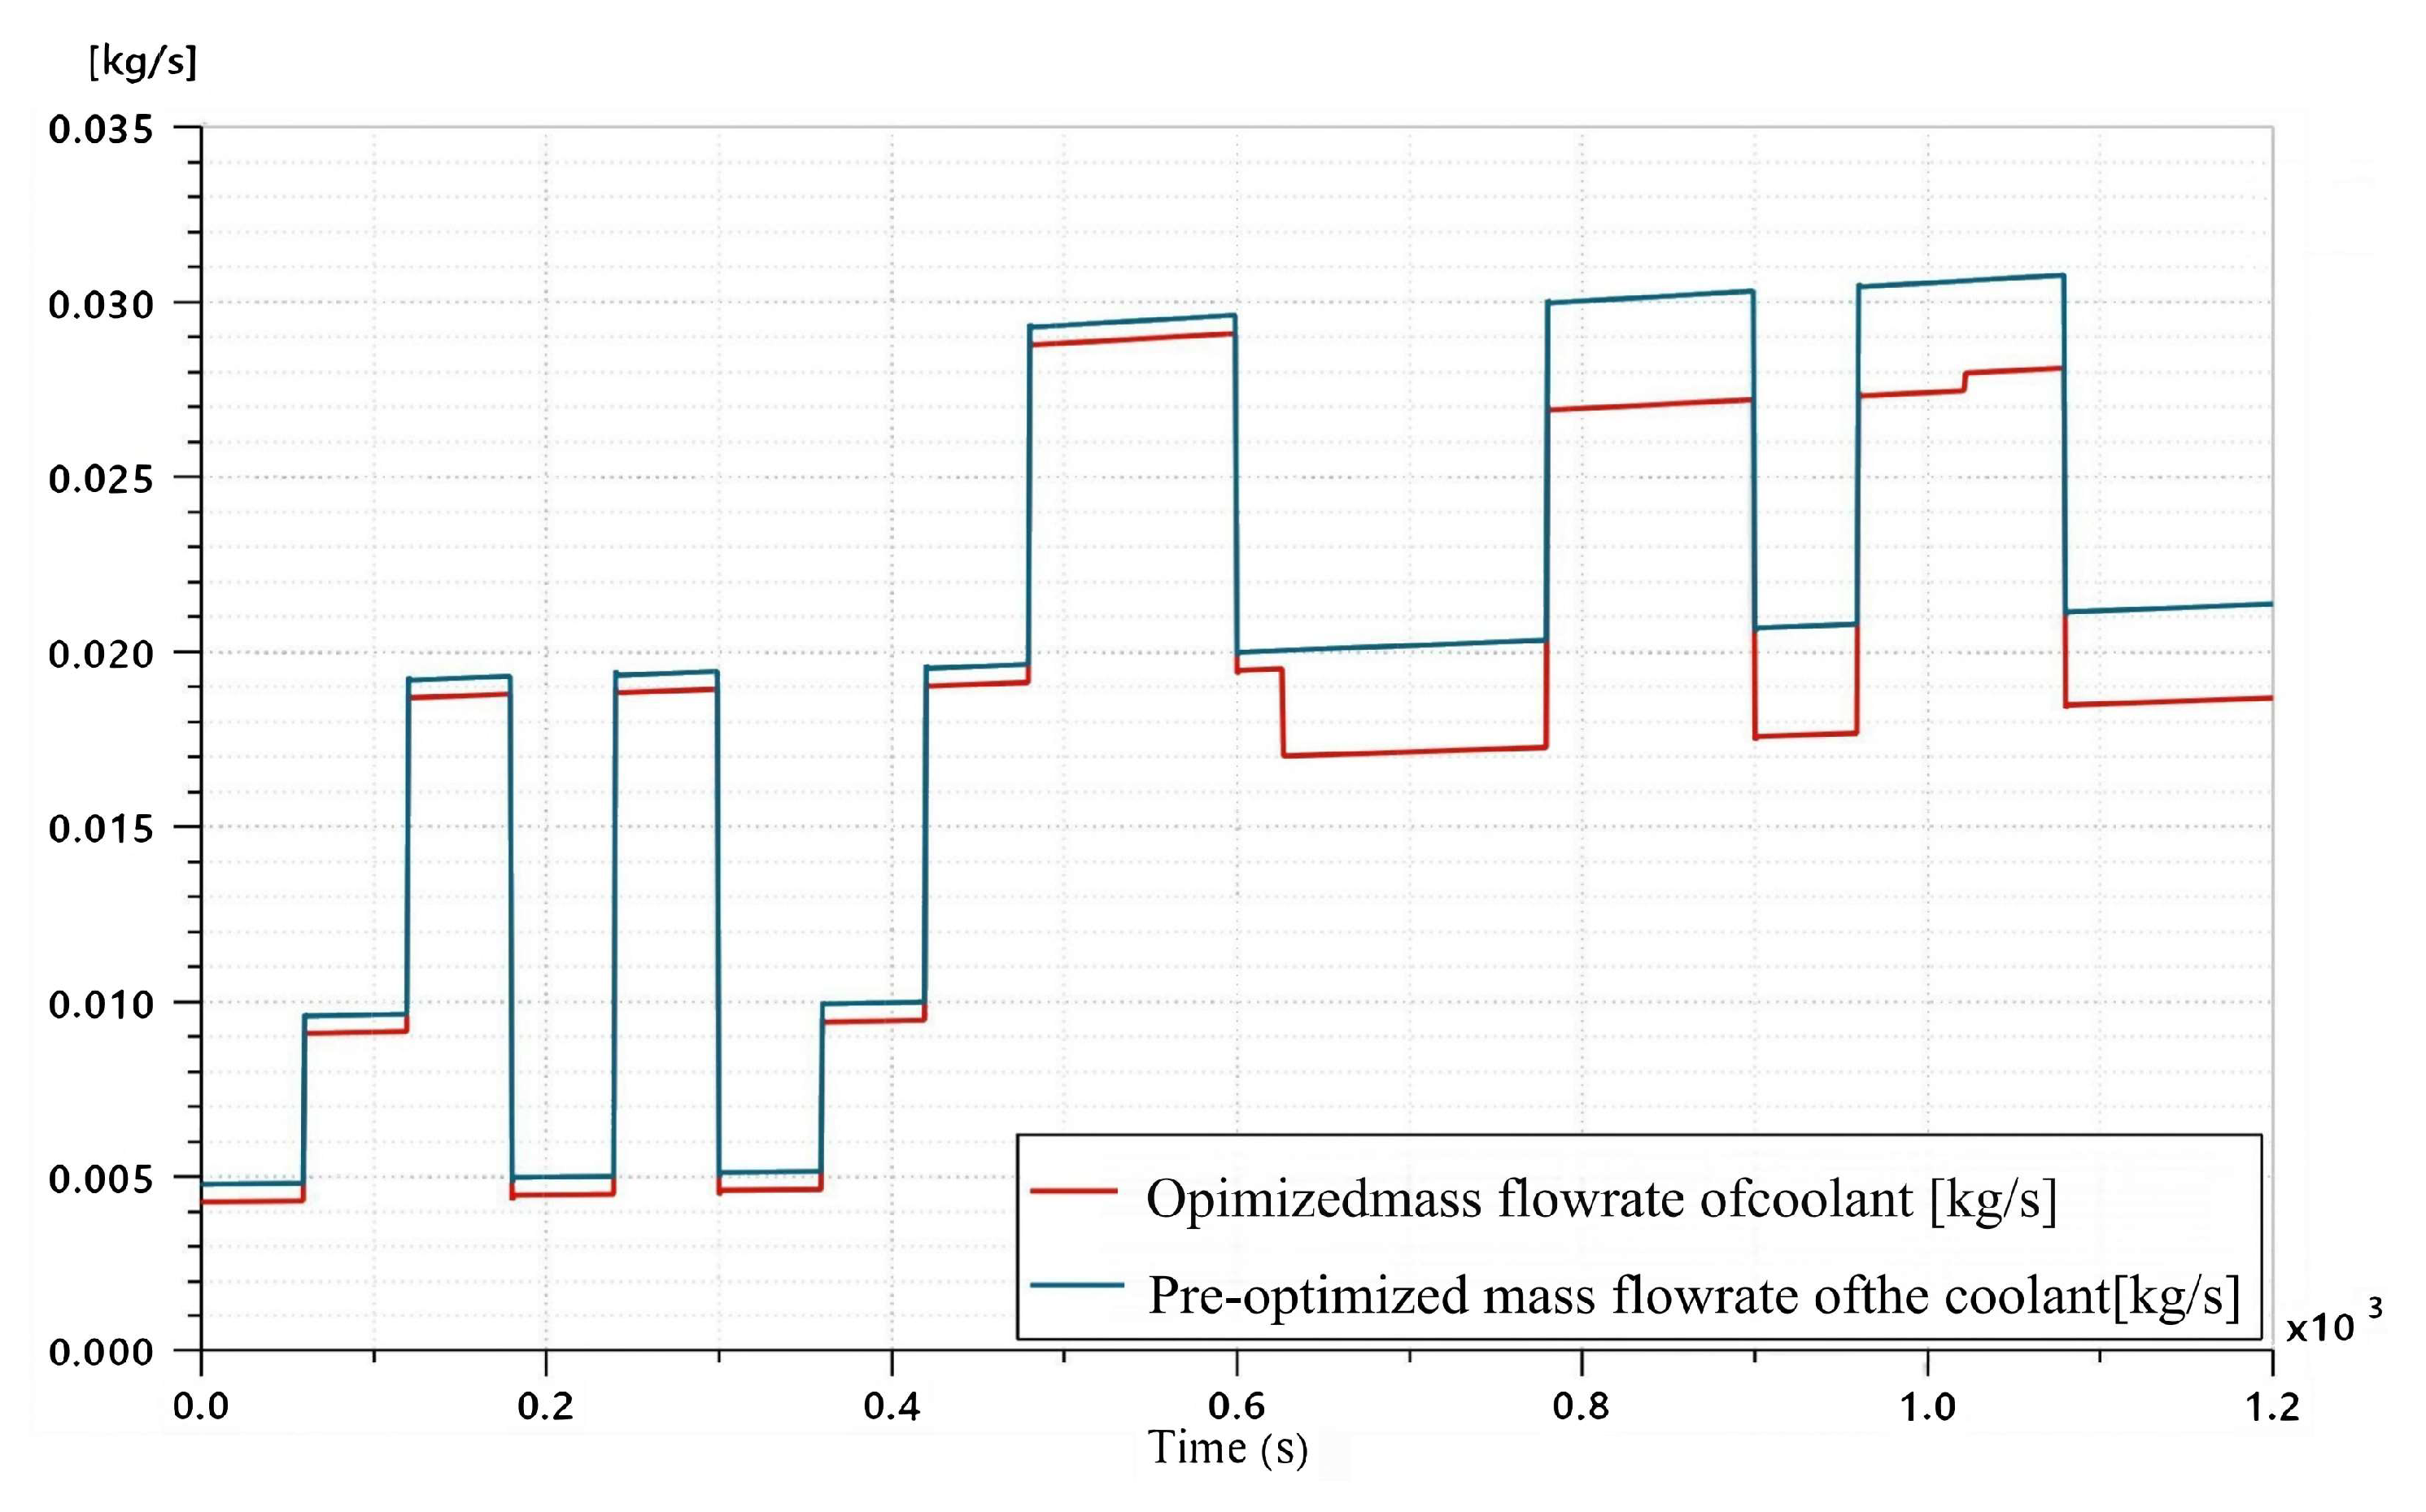
The prediction-based coolant flow regulation strategy significantly reduces the system energy consumption and improves the heat dissipation uniformity through both simulation and experiment. In the AMESim simulation, the maximum mass flow rate of coolant under the prediction strategy was reduced from 0.031 kg/s to 0.029 kg/s, with an average flow rate reduction of 17.6% (
Figure 16), and the maximum temperature of the battery pack was reduced from 34.5 °C to 30.7 °C under the real-vehicle condition, with a reduction of the maximum temperature difference by 0.3 °C (
Figure 17).
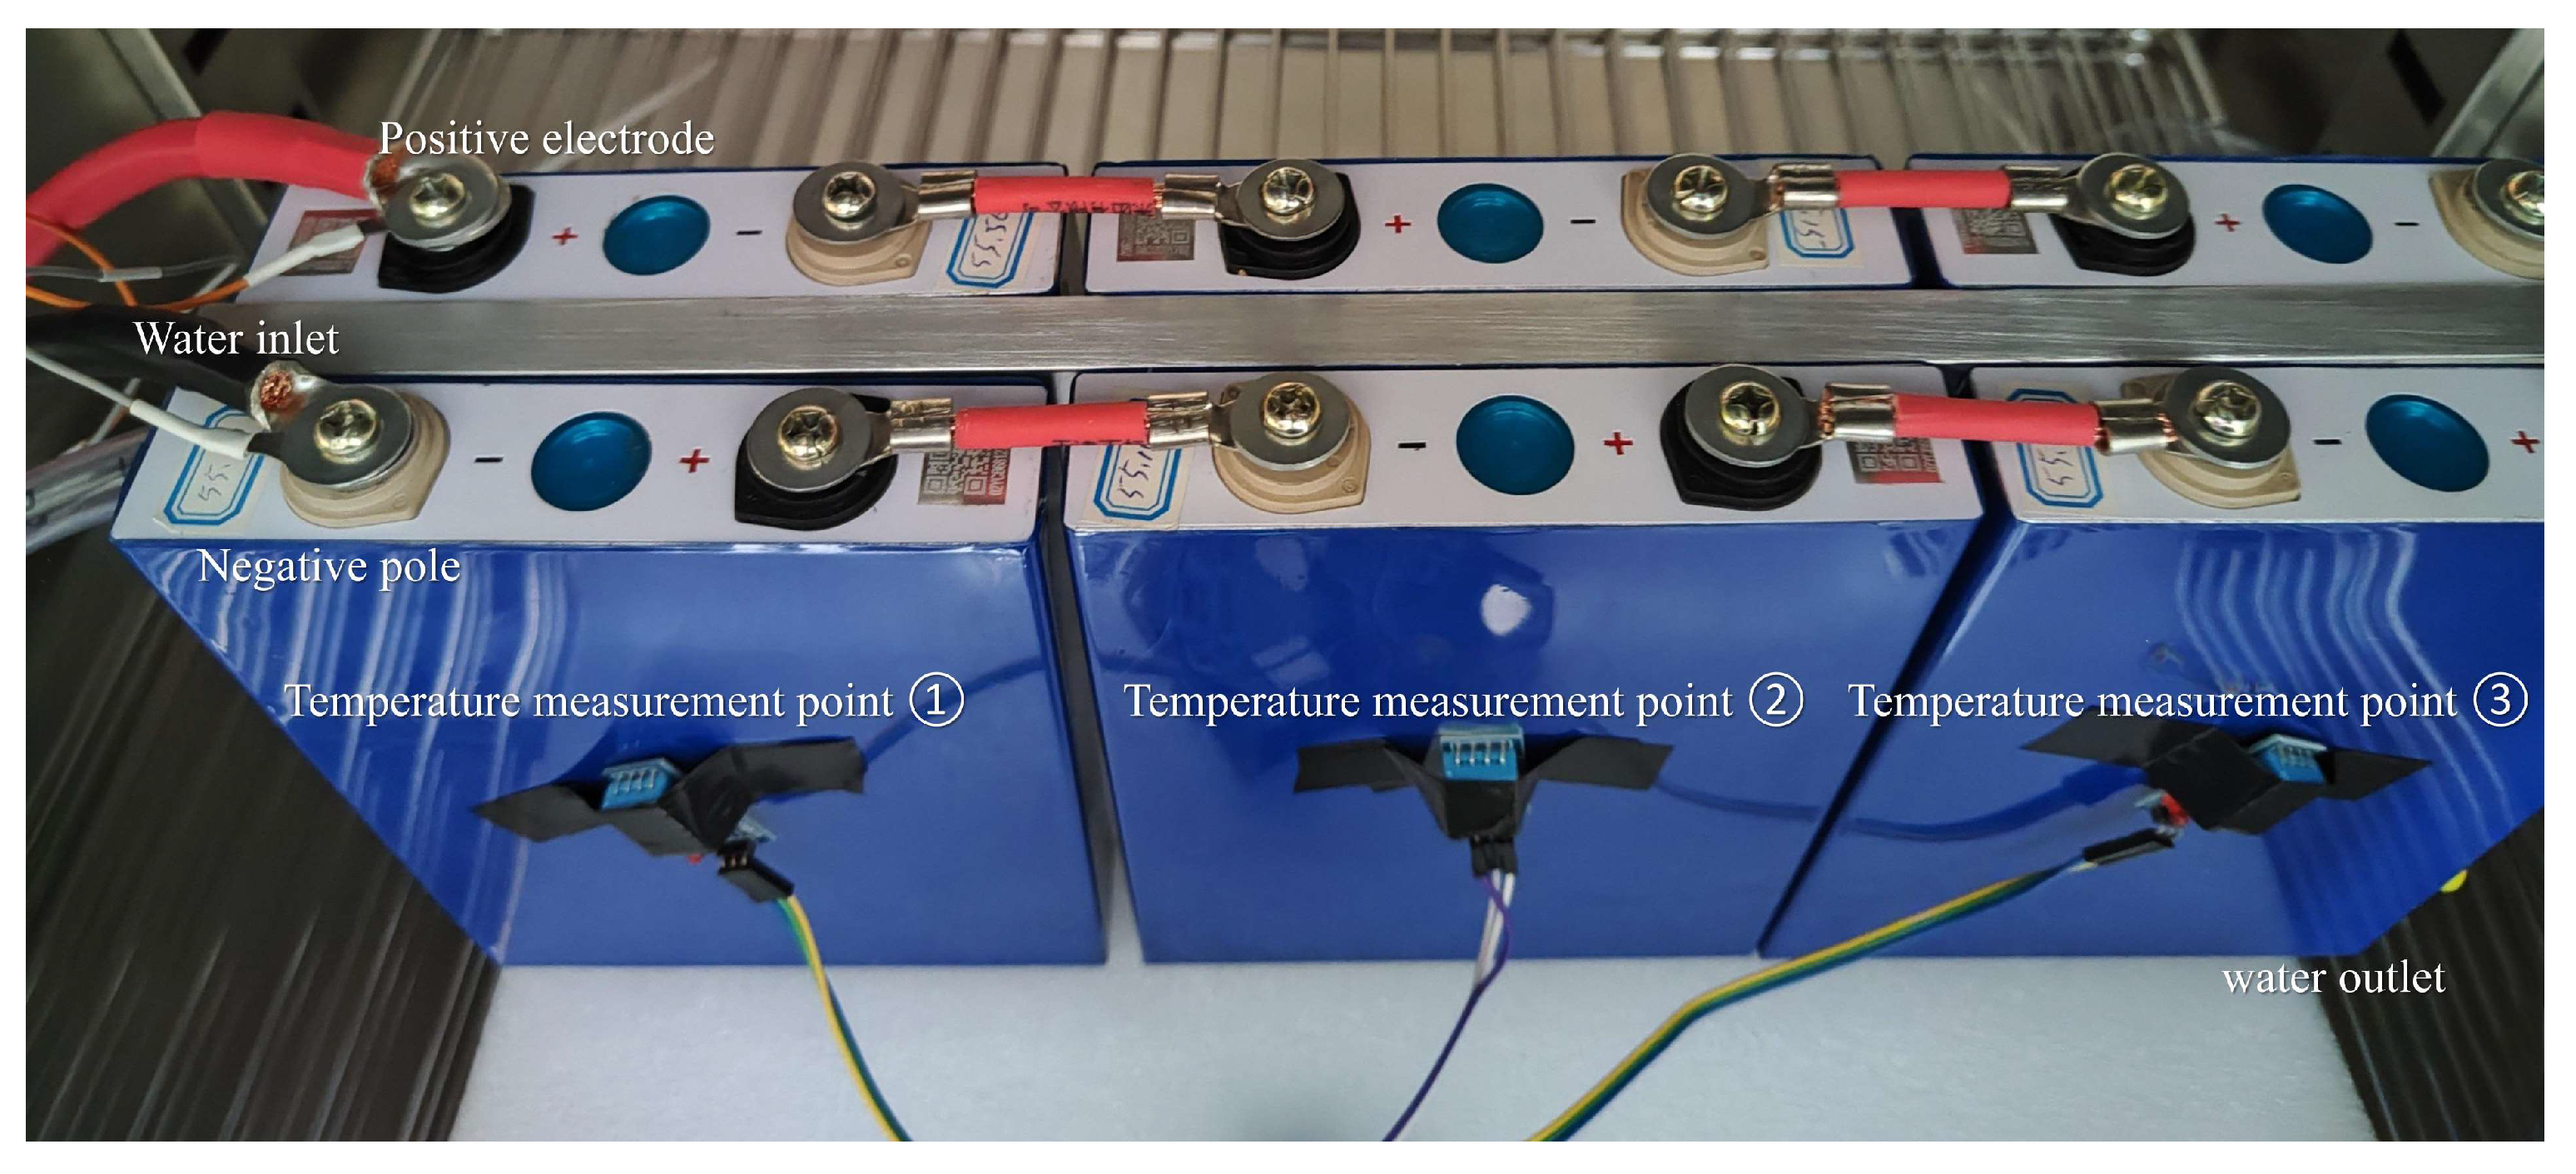
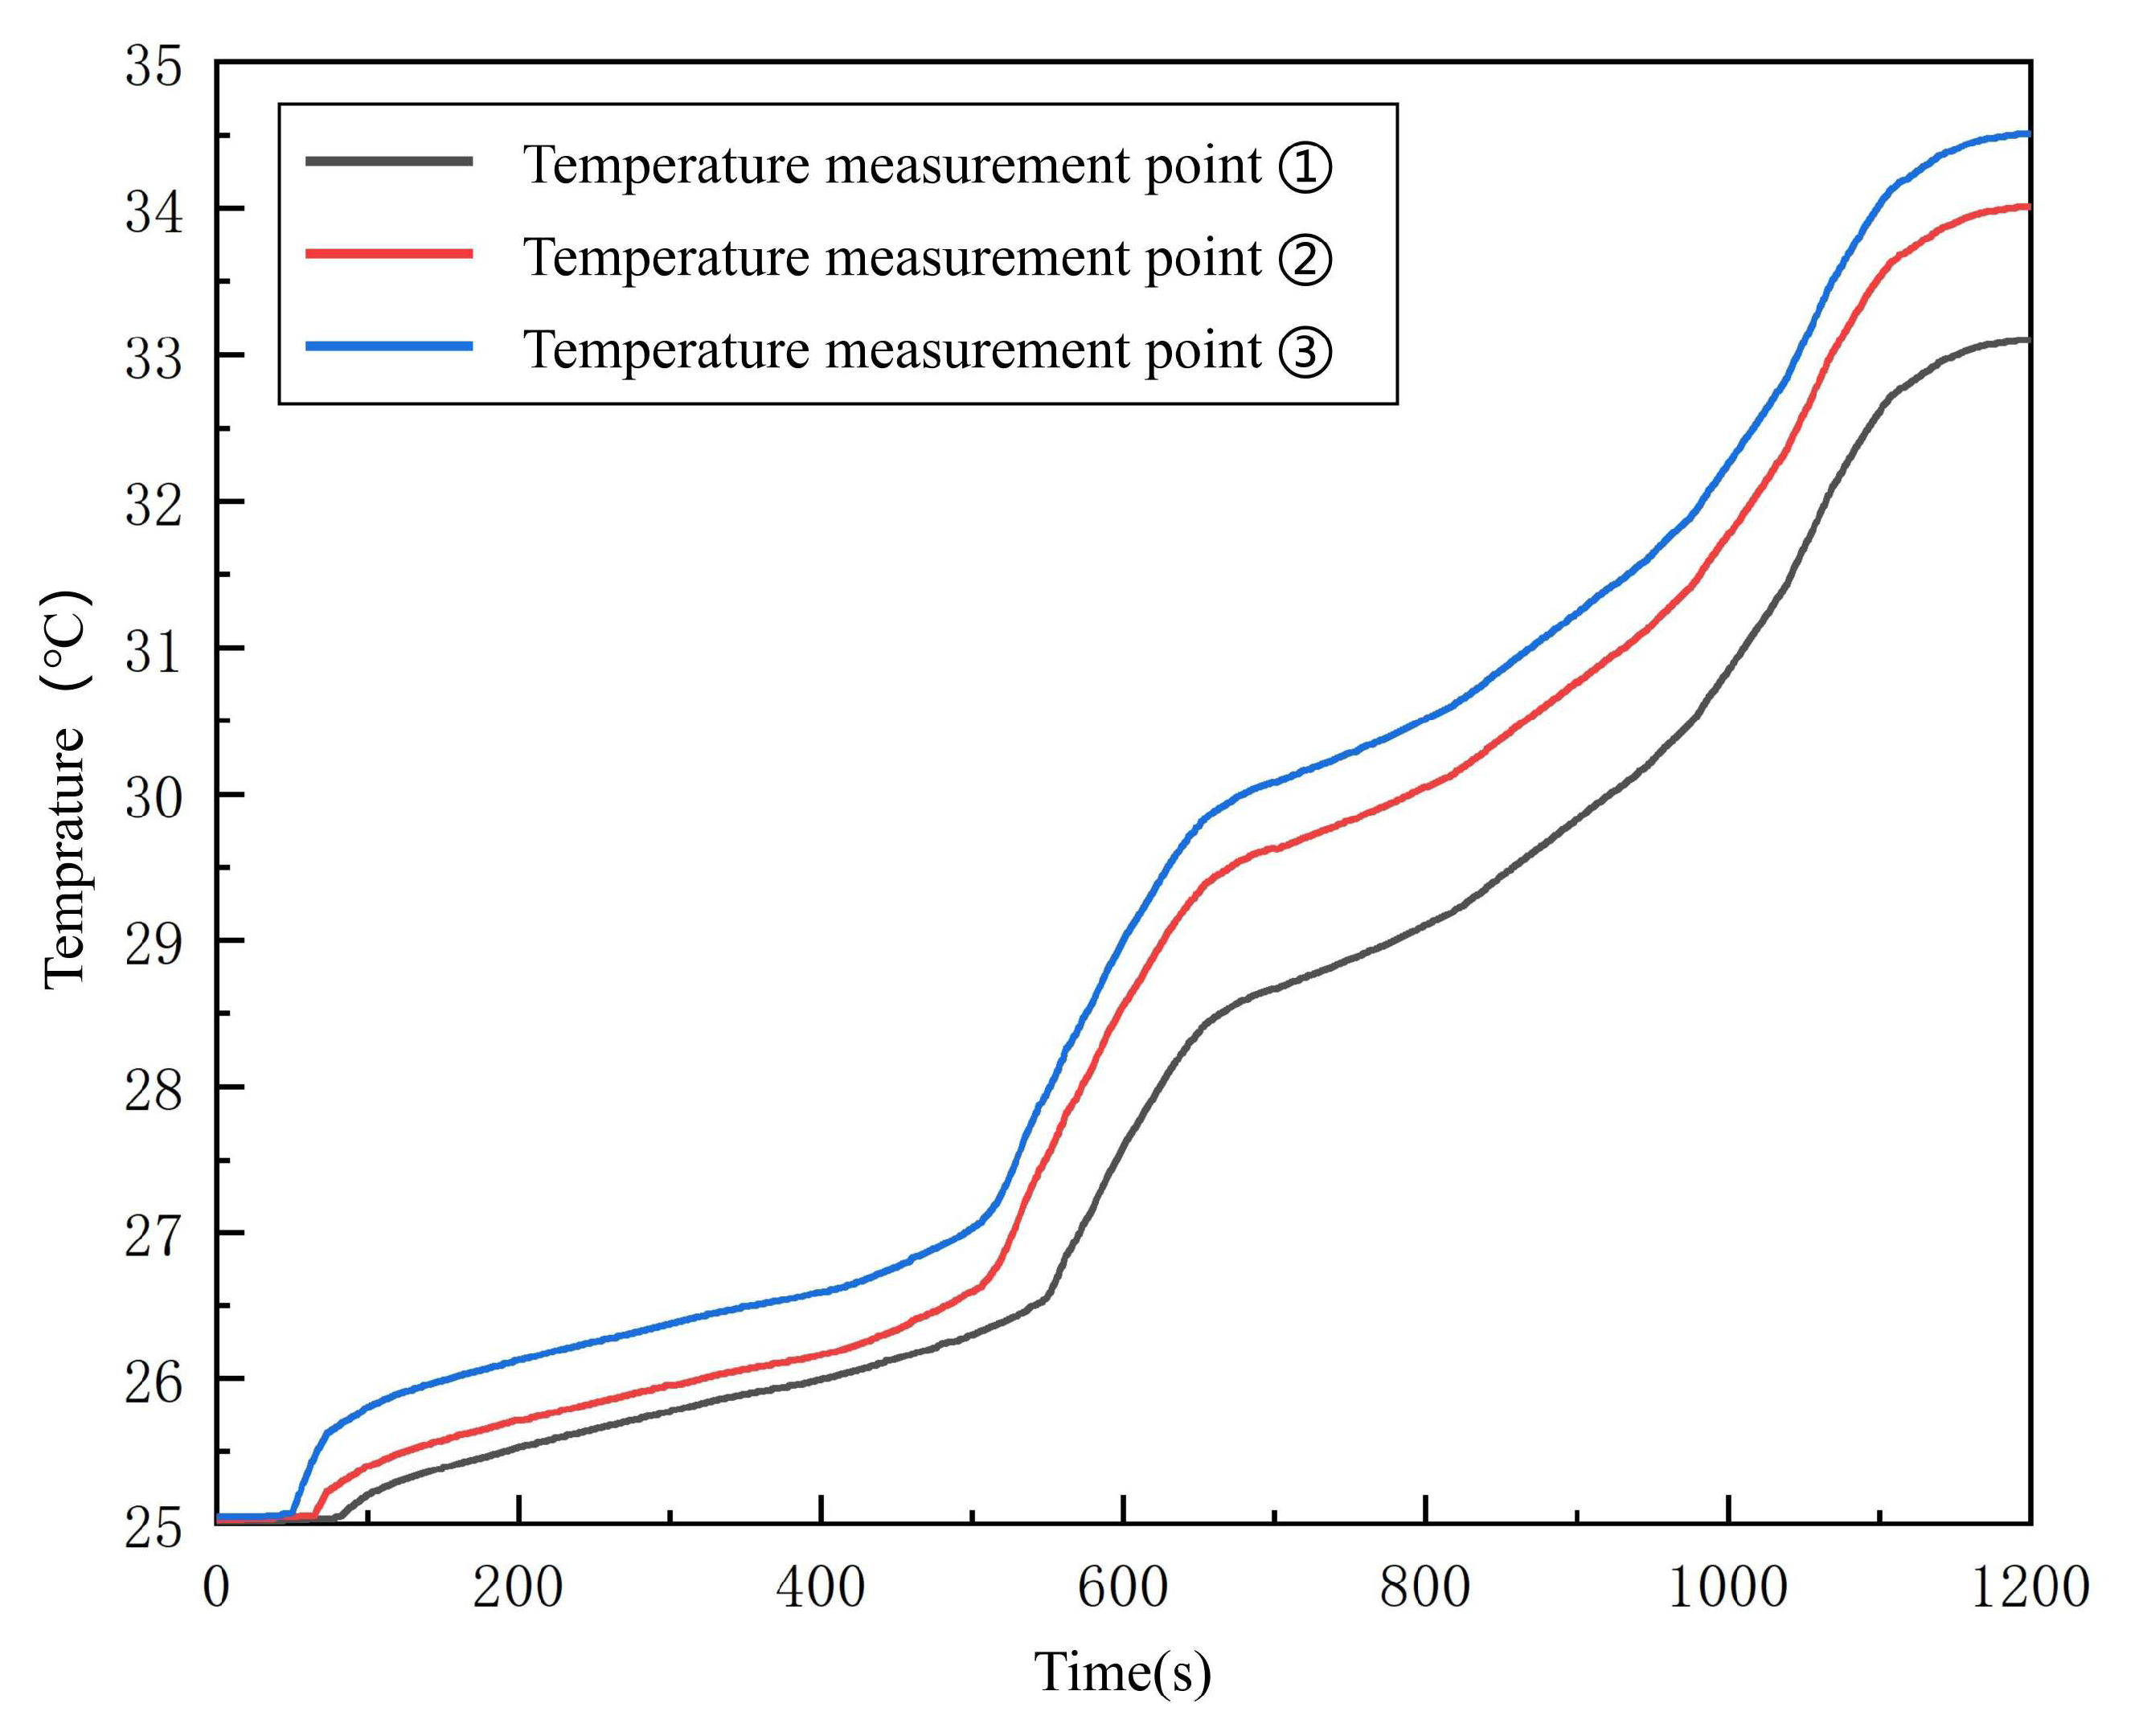
Figure 18 shows the temperature rise at the center of the surface of the battery pack under the actual vehicle driving conditions (without predicted working conditions). As can be seen from
Figure 18, the temperature at temperature measurement point ③ was the highest, reaching 34.5 °C eventually. This was because the temperature measurement point ③ was located the farthest from the water inlet. The coolant exchanges heat with the heat generated by the battery inside the cold plate. Therefore, the closer it was to the water outlet, the higher the temperature of the coolant. The final temperature at temperature-measuring point ① was 33.1 °C, which was 1.4 °C lower than that at temperature-measurement point ③. This is because the battery where temperature measurement point ① was located is the closest to the water inlet, and the coolant exchanges heat with this battery first.
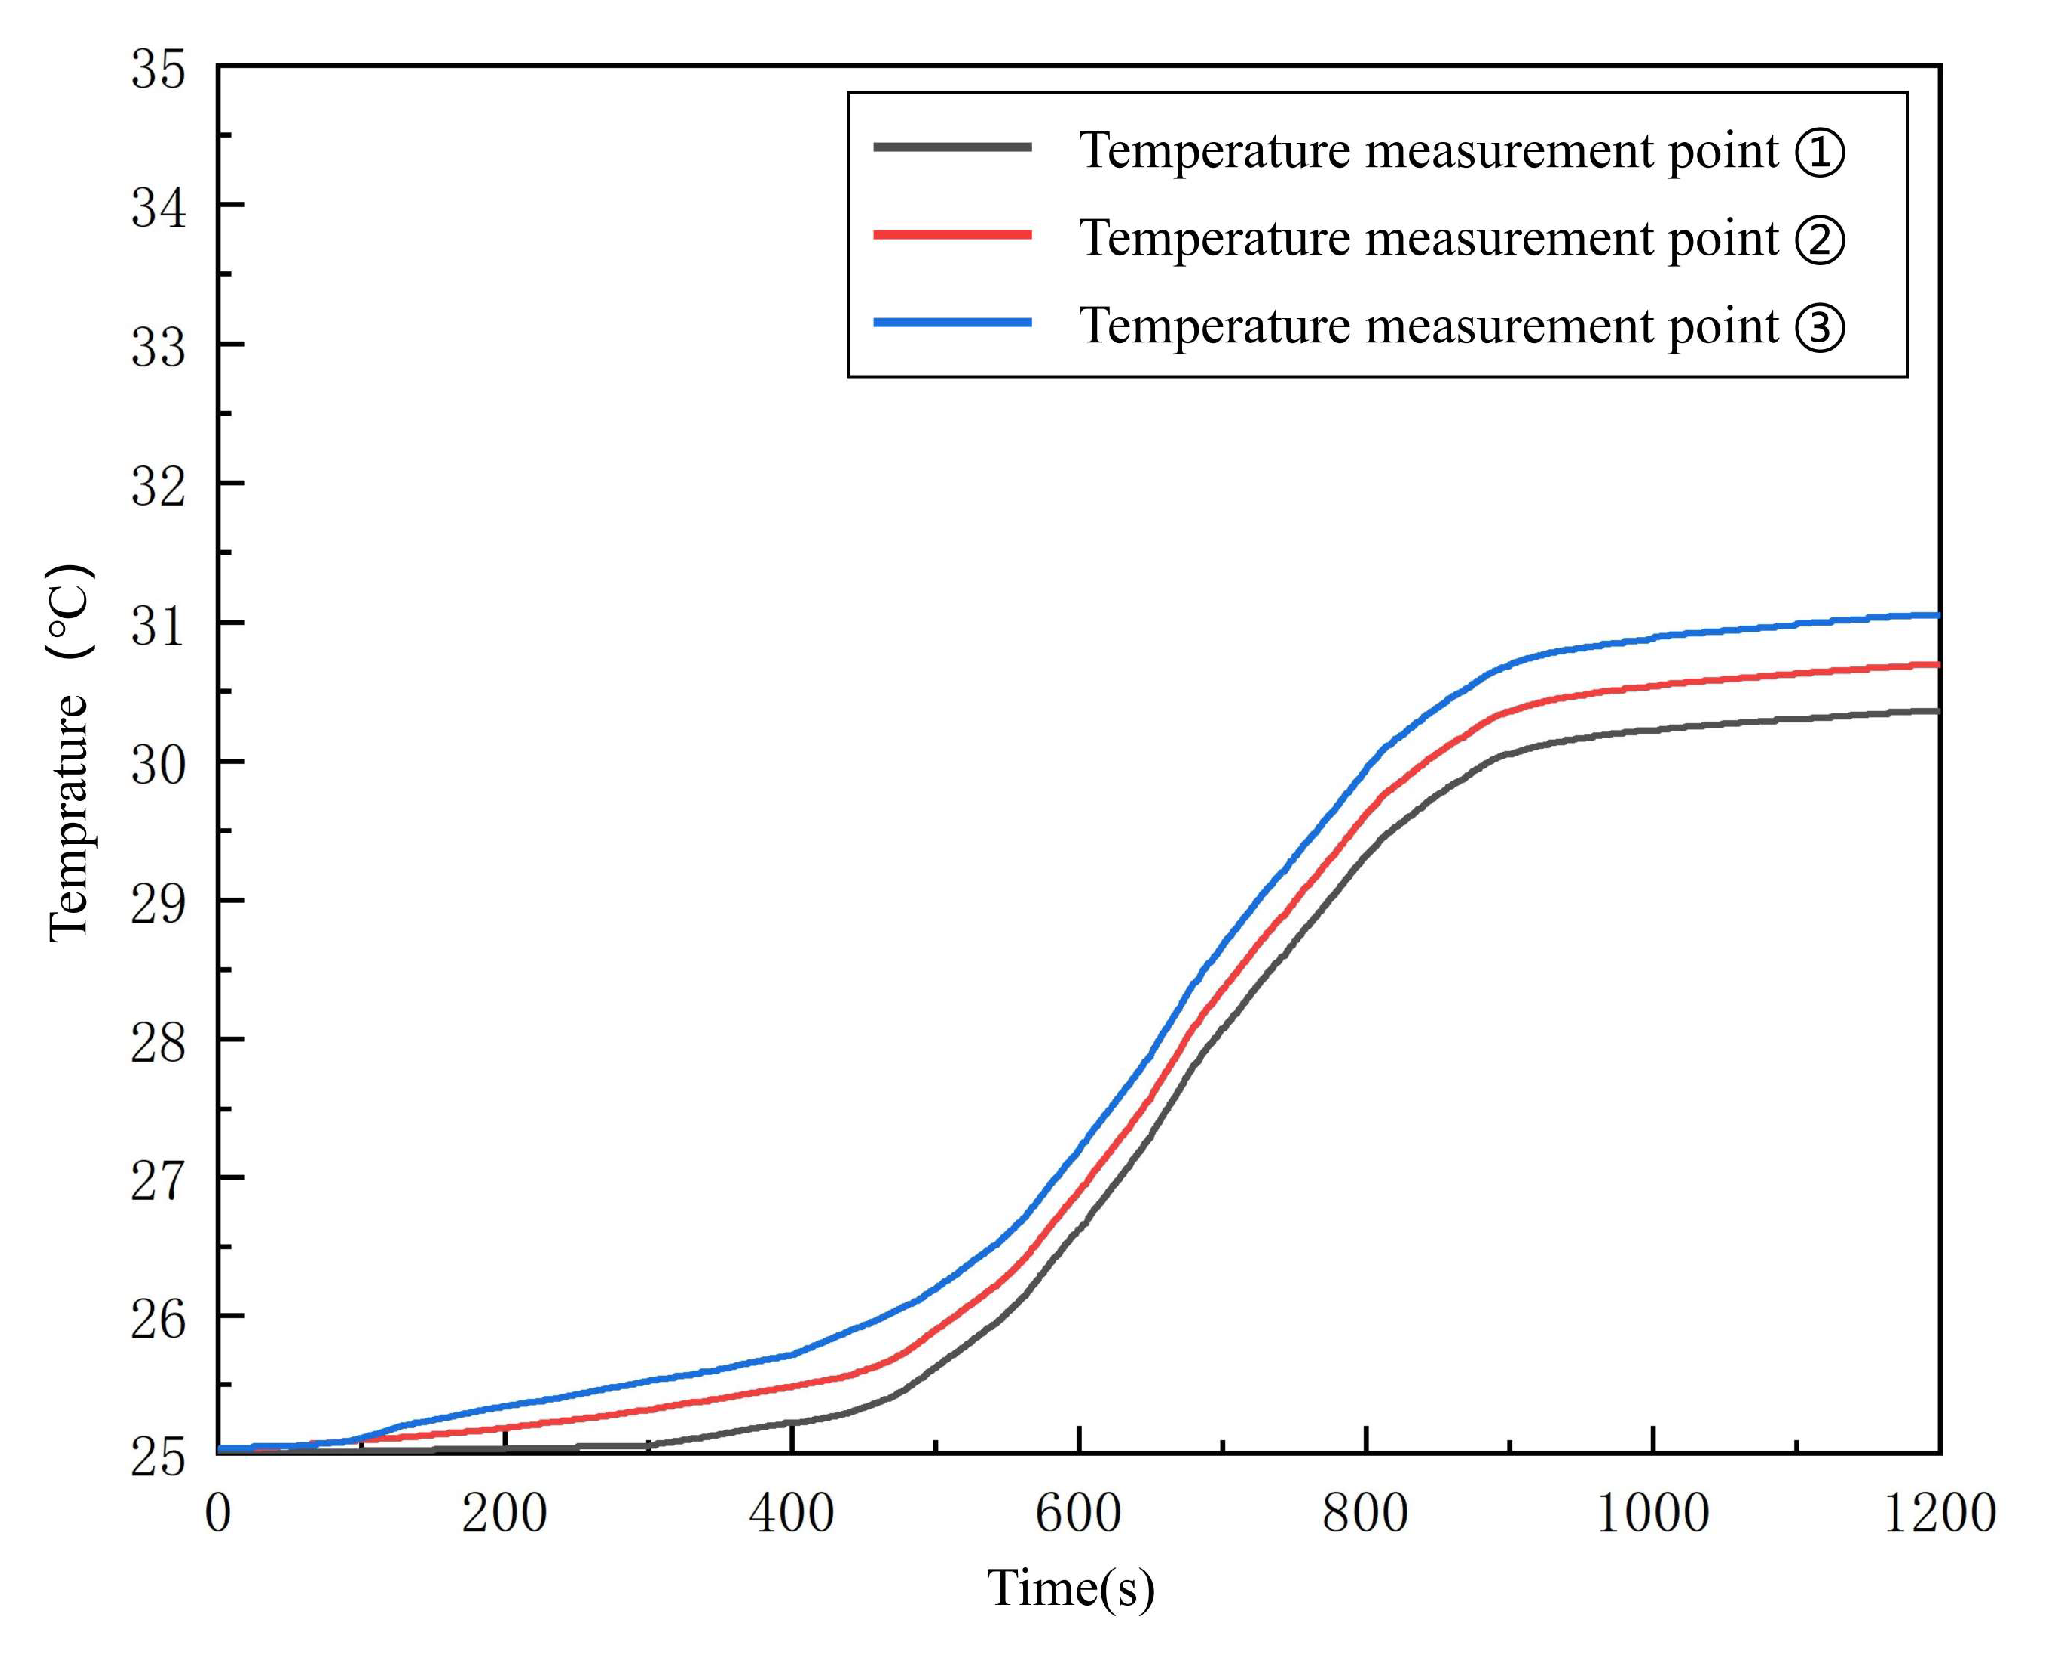
Figure 19 shows the temperature rise at the center of the surface of the battery pack after the implementation of the thermal management strategy for cooling under the predicted working conditions. As can be seen from
Figure 19 the measured temperatures increased successively from temperature measurement point ① to temperature measurement point ③. Among them, the temperature at temperature measurement point ③ was the highest, reaching 31.1 °C, while the temperature at temperature measurement ① was the lowest, being 30.4 °C.
As shown in
Figure 18 and
Figure 19, the temperature difference (unpredicted vs. predicted) between measurement point ③ is 3.5 °C, between measurement point ② is 3.3 °C, and between measurement point ① is 2.7 °C. Furthermore, under the predicted working conditions, the temperature rise of the battery is more gradual when the thermal management strategy is applied. Based on the experimental results, it can be concluded that the battery thermal management strategy established in this study, which is based on working condition prediction, has good heat dissipation performance. This experimental validation confirms the reliability of the established strategy model. After optimization, the maximum temperature at the battery surface temperature measurement point ③ decreased from 34.5 °C to 31.1 °C, and the fluctuations in the temperature rise curve were reduced by approximately 30% (
Figure 18 and
Figure 19). Notably, the introduction of the temperature feedback model enables the system to maintain cooling performance (temperature deviation less than 0.4 °C) while further reducing the average flow rate by 12.3%, demonstrating the energy-saving potential of “demand-based cooling”.
The innovation of this study lies in combining the time-sequential characteristics of operating condition prediction with the dynamic response of PID control. For example, while a conventional air-cooled system needs to operate continuously at full power under high load conditions to cope with the risk of temperature rise, the present strategy avoids oversupply of coolant by regulating the flow rate in advance. Experimental data show that the coolant flow rate drops by 17.6% in suburban and high-speed conditions, which is closely related to the transient high current due to frequent acceleration-deceleration cycles in such conditions.
4.3. Robustness and Practical Application Value of Strategies
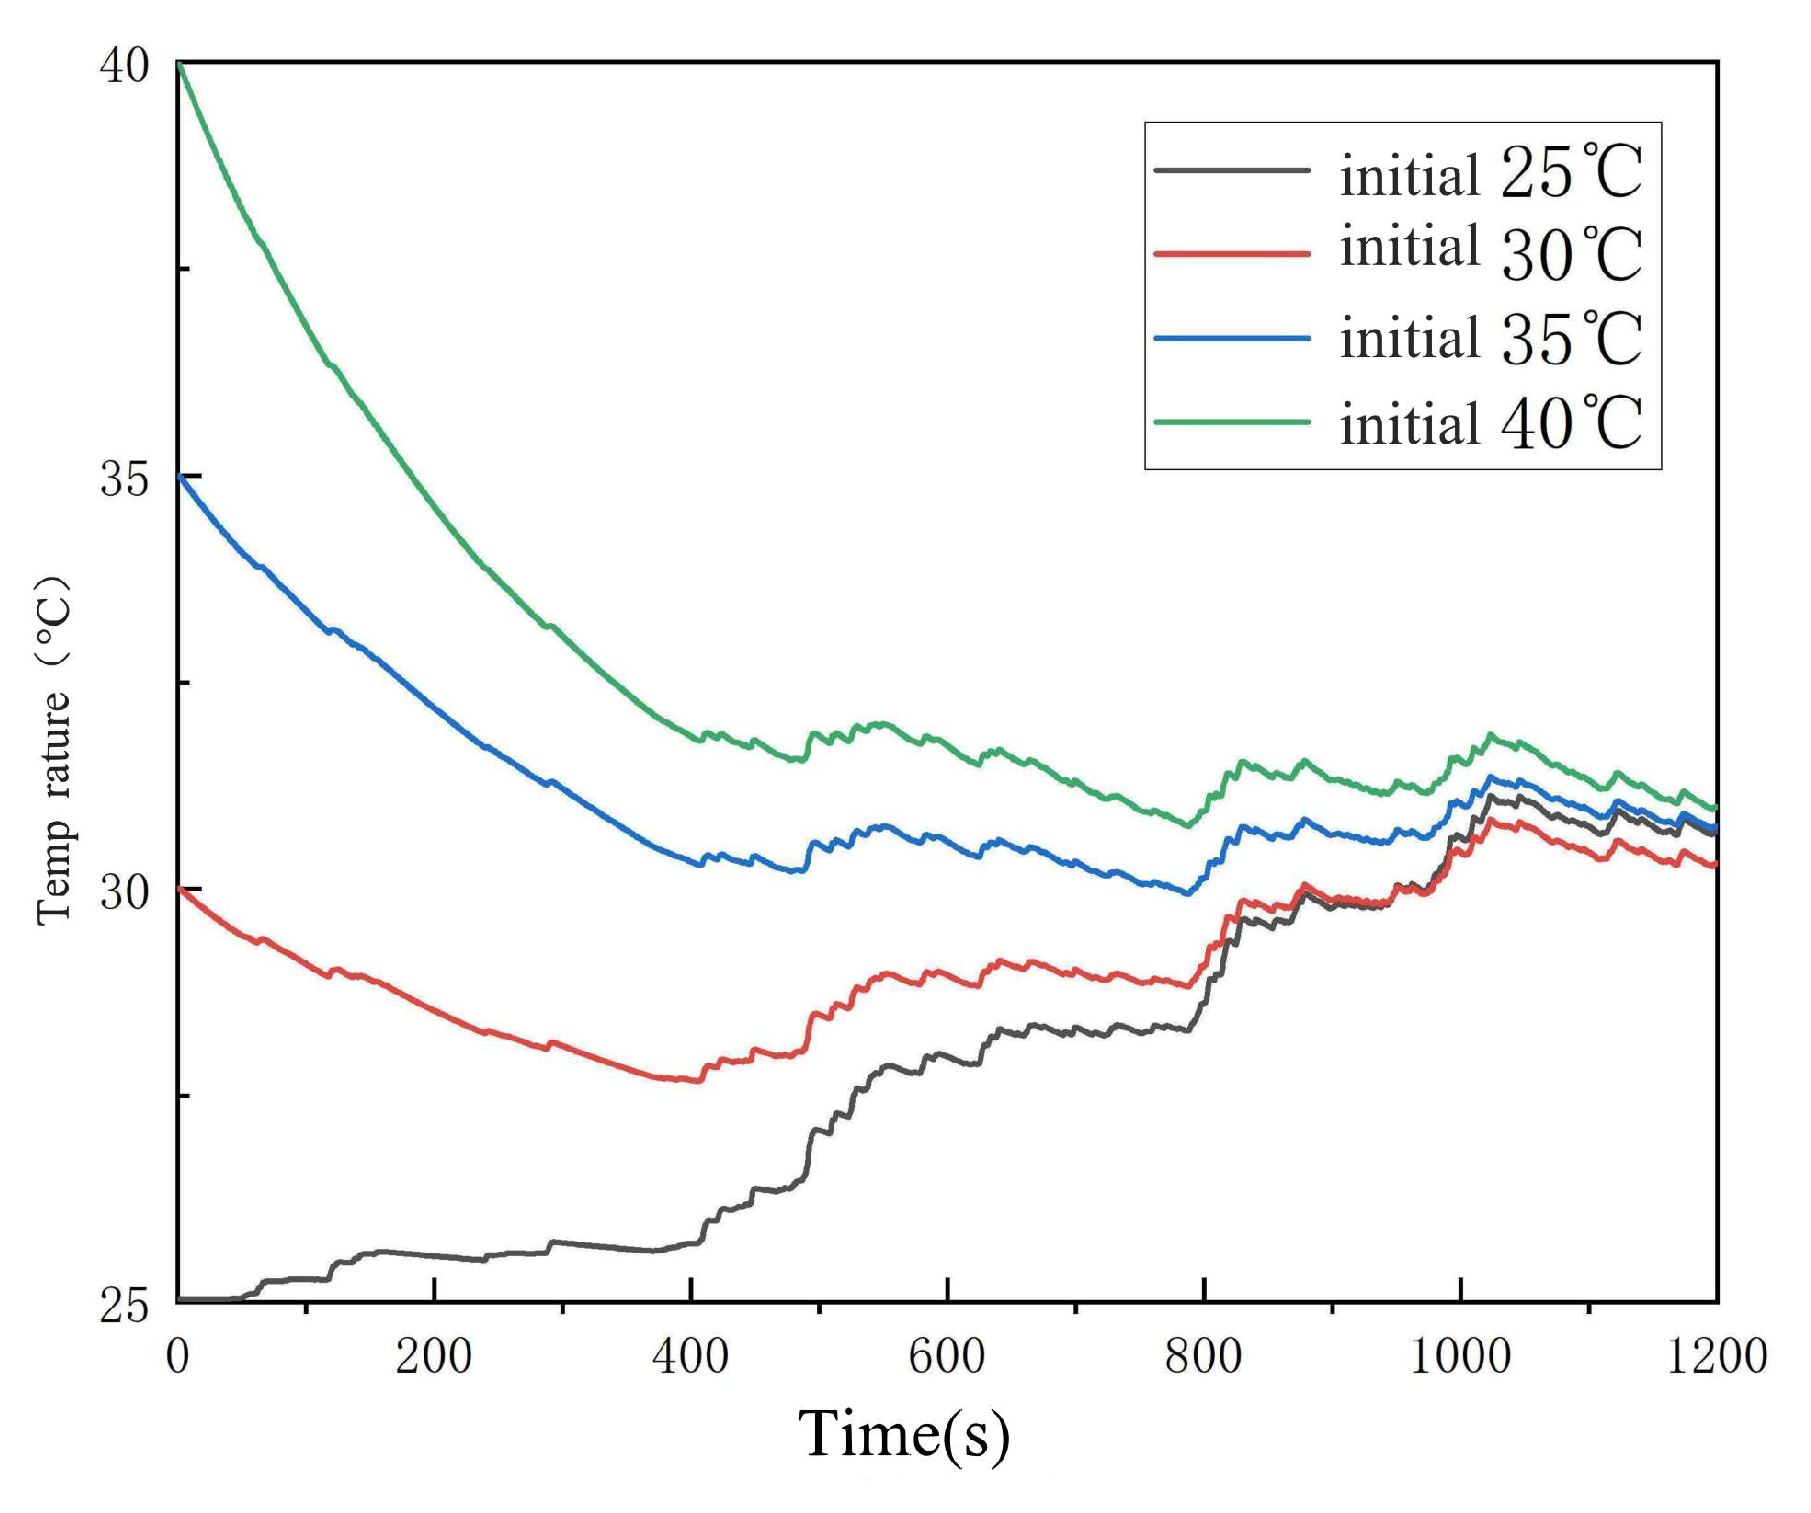
In the robustness test with the ambient temperature of 25~40 °C, the standard deviation of the battery temperature fluctuation is only 0.2 °C, which indicates that the strategy is highly adaptable to extreme environments (
Figure 20).
Further analysis reveals that the response rate of coolant flow regulation improves by about 15% when the ambient temperature increases, which is attributed to the dynamic compensation of thermal inertia by the temperature feedback model. In addition, experimental data show that the strategy maintains stable thermal performance (temperature rise rate deviation <5%) in low SOC (<30%) scenarios, validating its applicability to full battery lifecycle management.
From the engineering application point of view, the hardware implementation of this strategy is less costly, requiring only the integration of a predictive algorithm module and a PID controller in the existing liquid cooling system. Compared with the passive thermal management scheme based on phase change material (PCM), the proposed method has significant advantages in terms of cost (50%–60% reduction) and ease of maintenance. In addition, the scalability of the strategy has been experimentally verified, e.g., the flow distribution logic can be adaptively adjusted in a parallel battery module to ensure that the temperature difference of each single cell is controlled within 1 °C.
4.4. Comparative Analysis of the Advantages of Working Condition Prediction Technology in Battery Thermal Management
In order to further demonstrate the improvements brought about by working condition prediction in battery thermal management, we compared the control method in this paper with those in three other representative articles in this field. The comparison results are shown in
Table 6:
Predictive ability: the BP neural network in this paper achieves speed prediction (RMSE = 0.722), which is superior to other literature methods that rely on real-time feedback.
Optimization of energy consumption: the dynamic PID in this paper has a higher energy consumption reduction (17.6%) than the fuzzy PI control (18% pump energy only), and the phase change assisted cooling (12%).
Cost advantage: no additional high-computing-power hardware required, compatible with existing liquid-cooling systems, lower cost than deep learning solutions
4.5. Research Contributions and Engineering Implications
The innovation of this strategy lies in breaking through the limitations of traditional thermal management relying on fixed thresholds or hysteresis feedback and realizing the global optimization of temperature and energy consumption through the synergy of time series prediction and dynamic control. Experimental data show that the strategy has significant advantages in reducing the peak temperature (3.8 °C) and system energy consumption (17.6%), providing a landable technical solution for the synergistic optimization of thermal safety and energy efficiency of electric vehicle batteries.
5. Conclusions
In this study, a neural network prediction-based active thermal management strategy is proposed to address the challenge of synergistic optimization of battery temperature rise and energy consumption under dynamic driving conditions in electric vehicles, which significantly improves the safety and economy of the battery system by combining data-driven and dynamic control methods.
First, multi-scenario real-vehicle data were collected using the autonomous driving method, and four types of typical working conditions (congested, high-speed, urban, and suburban) were extracted by combining the K-means clustering algorithm to construct a dataset with high generalizability. The dynamic correlation between battery discharge current and heat dissipation demand under different working conditions is revealed through the quantitative analysis of the fixed-step segmentation method (60 s segments) and characteristic parameters (average speed, parking ratio, etc.). A BP neural network model (20 neurons in the input layer, 10 neurons in the hidden layer, and 60 neurons in the output layer) was further constructed to realize the accurate prediction of the future 60-s vehicle speed, with a test set root mean square error (RMSE) of 0.722 and a maximum relative error of 6.2%.
Based on the prediction results, a dynamic PID control strategy is designed to cope with the sudden change of heat load by adjusting the coolant flow rate (mass flow rate range of 0.005~0.031 kg/s) in advance. AMESim simulation and experimental validation show that the strategy can start cooling 10~15 s earlier than the traditional responsive method, the peak temperature of the battery can be reduced by 3.8 °C, the maximum temperature difference is reduced by 0.3 °C, and the Coolant energy consumption is reduced by 17.6%. At the same time, the introduction of a temperature feedback mechanism further optimizes the flow distribution, and the standard deviation of the battery temperature fluctuation is stable at 0.2 °C in the range of 25~40 °C ambient temperature, which verifies the robustness and adaptability of the strategy.
The core contribution of this study is to break through the limitation of traditional thermal management relying on hysteresis feedback and realize the global optimization of thermal performance and energy consumption through the synergy of timing prediction and dynamic control. Experimental results show that this strategy can effectively suppress the battery temperature rise, reduce the risk of thermal runaway, and provide a landable technical solution for energy efficiency management under complex working conditions. In addition, the hardware implementation cost is low (50~60% lower than the traditional scheme) and has good scalability, which is suitable for the thermal balance control of multi-module parallel battery systems.


