Article

Quantification of Degradation Processes in Lithium-Ion Batteries Through Internal Strain Measurement with Fiber Bragg Grating Sensors

1
Institute of Energy Research and Physical Technologies, Clausthal University of Technology, Leibnizstraße 4, 38678 Clausthal-Zellerfeld, Germany
2
Department Fiber Optical Sensor Systems, Fraunhofer Institute for Telecommunications, Heinrich-Hertz-Institut, HHI, Am Stollen 19H, 38640 Goslar, Germany
3
Fraunhofer Institute for Silicon Technology ISIT, Fraunhoferstraße 1, 25524 Itzehoe, Germany
*
Author to whom correspondence should be addressed.
Batteries 2025, 11(6), 218; https://doi.org/10.3390/batteries11060218
Submission received: 10 April 2025 / Revised: 18 May 2025 / Accepted: 27 May 2025 / Published: 1 June 2025

Abstract

An important aspect of lithium-ion batteries related to lifetime and aging is the change in state within the cells, which results from the expansion of the electrode materials and causes internal stress during operation. In this work, fiber optical sensors by means of Bragg gratings are utilized to determine the internal strain in the anode material. The collected data were employed to approximate aging-related changes in anode strain using a combination of established methods, such as the differential voltage and incremental capacity analysis. Moreover, additional methodologies are proposed and explored, substituting electrical data with optical strain measurements to quantify degradation effects linked to changes in strain. During the cycling of the cell, changes in the strain behavior have been observed and can be partially attributed to changes in the cell’s electrochemical composition. The methods suggested have proven effective in providing additional insights into the current state of the cells and tracking changes over time due to detected degradation effects.

1. Introduction

Lithium-ion batteries (LIBs) are used in a variety of applications, ranging from portable electronics and the transportation sector to stationary energy storage systems [1]. As the demand for batteries is expected to grow further in the coming years, the issues of safety and reliability are becoming increasingly critical. On the other hand, improvements are expected in key areas such as power and energy density and longevity [2,3]. LIBs are complex electrochemical systems in which the chemical composition of the active materials changes during charge and discharge cycles as well as over time [4,5,6,7,8]. Due to the transition of Li+ into graphite anodes or lithium metal oxide cathodes, the volume of the electrode expands and contracts during charge and discharge, resulting in a variation in the mechanical strain on the electrodes [9,10]. The mechanical changes occurring during these processes have been examined in various studies and reviews [11,12,13,14]. While the cell expansion is mostly reversible, over time, it can add up to degradation effects that can reduce the performance and safety of a cell gradually [15,16]. Most LIB applications, therefore, require information on key parameters such as voltage, current, and temperature to ensure safe performance at all times. To effectively monitor the degradation of LIBs throughout their lifespan, various methods have been developed that utilize known variables such as current and voltage. Differential voltage analysis (DVA) and incremental capacity analysis (ICA) are both based on these parameters to evaluate cell aging [17]. Both methods employ the same dataset as a differentiated ratio between each other over fixed increments [18]. Every peak in the ICA or DVA curve represents a specific electrochemical reaction process that occurs within the battery [19,20].
Although the mentioned methods can provide information on the electrochemical state of the cell, there is still a lack of knowledge about the general mechanical state. By using mechanical measurement systems in addition to the aforementioned electrical systems, new insights into the behavior and aging mechanisms can be gained. Previously reported studies use a combination of differential analysis and various measurement principles. These works range from different volumetric and pressure-related setups [21,22,23] to external strain gauges [24]. However, these methods do not provide information about the internal mechanical state of the cell, which is affected by changes in chemical composition due to charging or irreversible degradation processes. Here, using internal sensors to directly measure the strain on the electrodes represents a promising approach to gaining additional information about LIB states. An elegant type of internal measurement unit is a sensor based on a fiber Bragg grating (FBG) [25], which consists of glass fiber with an inscribed Bragg reflector for strain and temperature measurement. The advantages of this kind of sensor include its inert properties and compact dimensions, with a diameter of a few hundred µm. In the past, this kind of sensor has been used to determine internal strain as well as internal temperature changes within LIBs [26,27,28,29]. However, aging and degradation testing via the long-term cycling of cells with integrated glass fiber, combined with a method that brings optical values together with established electrical analysis tools, remain unexplored. In this work, optically measured data from internal sensors are used to generate differential and incremental analysis methods to determine aging effects that are related to changes in the strain behavior of the anode material over time. These methods are evaluated for low C-rate check cycles and C/2 load cycles. To our knowledge, this is the first application of differential and incremental optical analysis of internal strain data using FBGs in LIB aging experiments. We anticipate achieving a comprehensive understanding of aging-related alterations in the anode material and its deformation behavior, along with insights into the degradation processes affecting the entire cell.

2. Materials and Methods

2.1. Measuring Principle

An FBG sensor consists of periodic modulations inscribed into the core of single-mode fiber using a femtosecond laser. When the fiber, and consequently the FBG, is illuminated with a spectrum of light, a part of this spectrum is reflected due to the periodic modulations. The wavelength at which this reflection occurs is called the Bragg wavelength λ B and depends on the grating period Λ and the effective refractive index of the core mode n e f f , as described by the following equation [30]:
λ B = 2 n e f f Λ .
The wavelength of a Bragg grating is influenced by thermal and mechanical effects, which change the grating period Λ . Mechanical strain alters the distance between the gratings, as well as the refractive index n e f f [31]. In addition, a variation in temperature causes a change in the refractive index and induces a thermal expansion of the fiber itself. Therefore, the equation
Δ λ B = 2 1 n e f f δ n e f f δ ε + 1 Λ δ Λ δ ε Δ L + 1 n e f f δ n e f f δ T + 1 Λ δ Λ δ T Δ T
can be used to determine the Bragg grating wavelength λ B , where Δ L represents the change in grating length, and Δ T represents the temperature difference [32,33]. Because the material properties of the optical fiber can be experimentally determined by simplifying Equation (2), the following term can be derived:
Δ λ B = λ B ( 1 ρ α ) Δ ε + λ B ( α n + α Λ ) Δ T
and only three key parameters are required to calculate the strain and temperature-dependent shift, with ρ α being the photoelastic constant, α n the thermo-optic coefficient, and α Λ relating to the thermal expansion coefficient. Therefore, the strain ε (µm/m) can be calculated using the following formula:
ε = Δ L L = 1 1 ρ α Δ λ B λ B
with ρ α being 0.21 [34,35]. Equation (4) assumes Δ λ B has already been compensated for in terms of temperature effects. In order for the optical fiber to detect any strain, it must be effectively coupled with the material under investigation. If there is an ideal coupling between the surface and the fiber, the expansion applied to the surface can be accurately measured and calculated. In this scenario, a linear correlation exists between the respective Bragg wavelength and the actual strain.

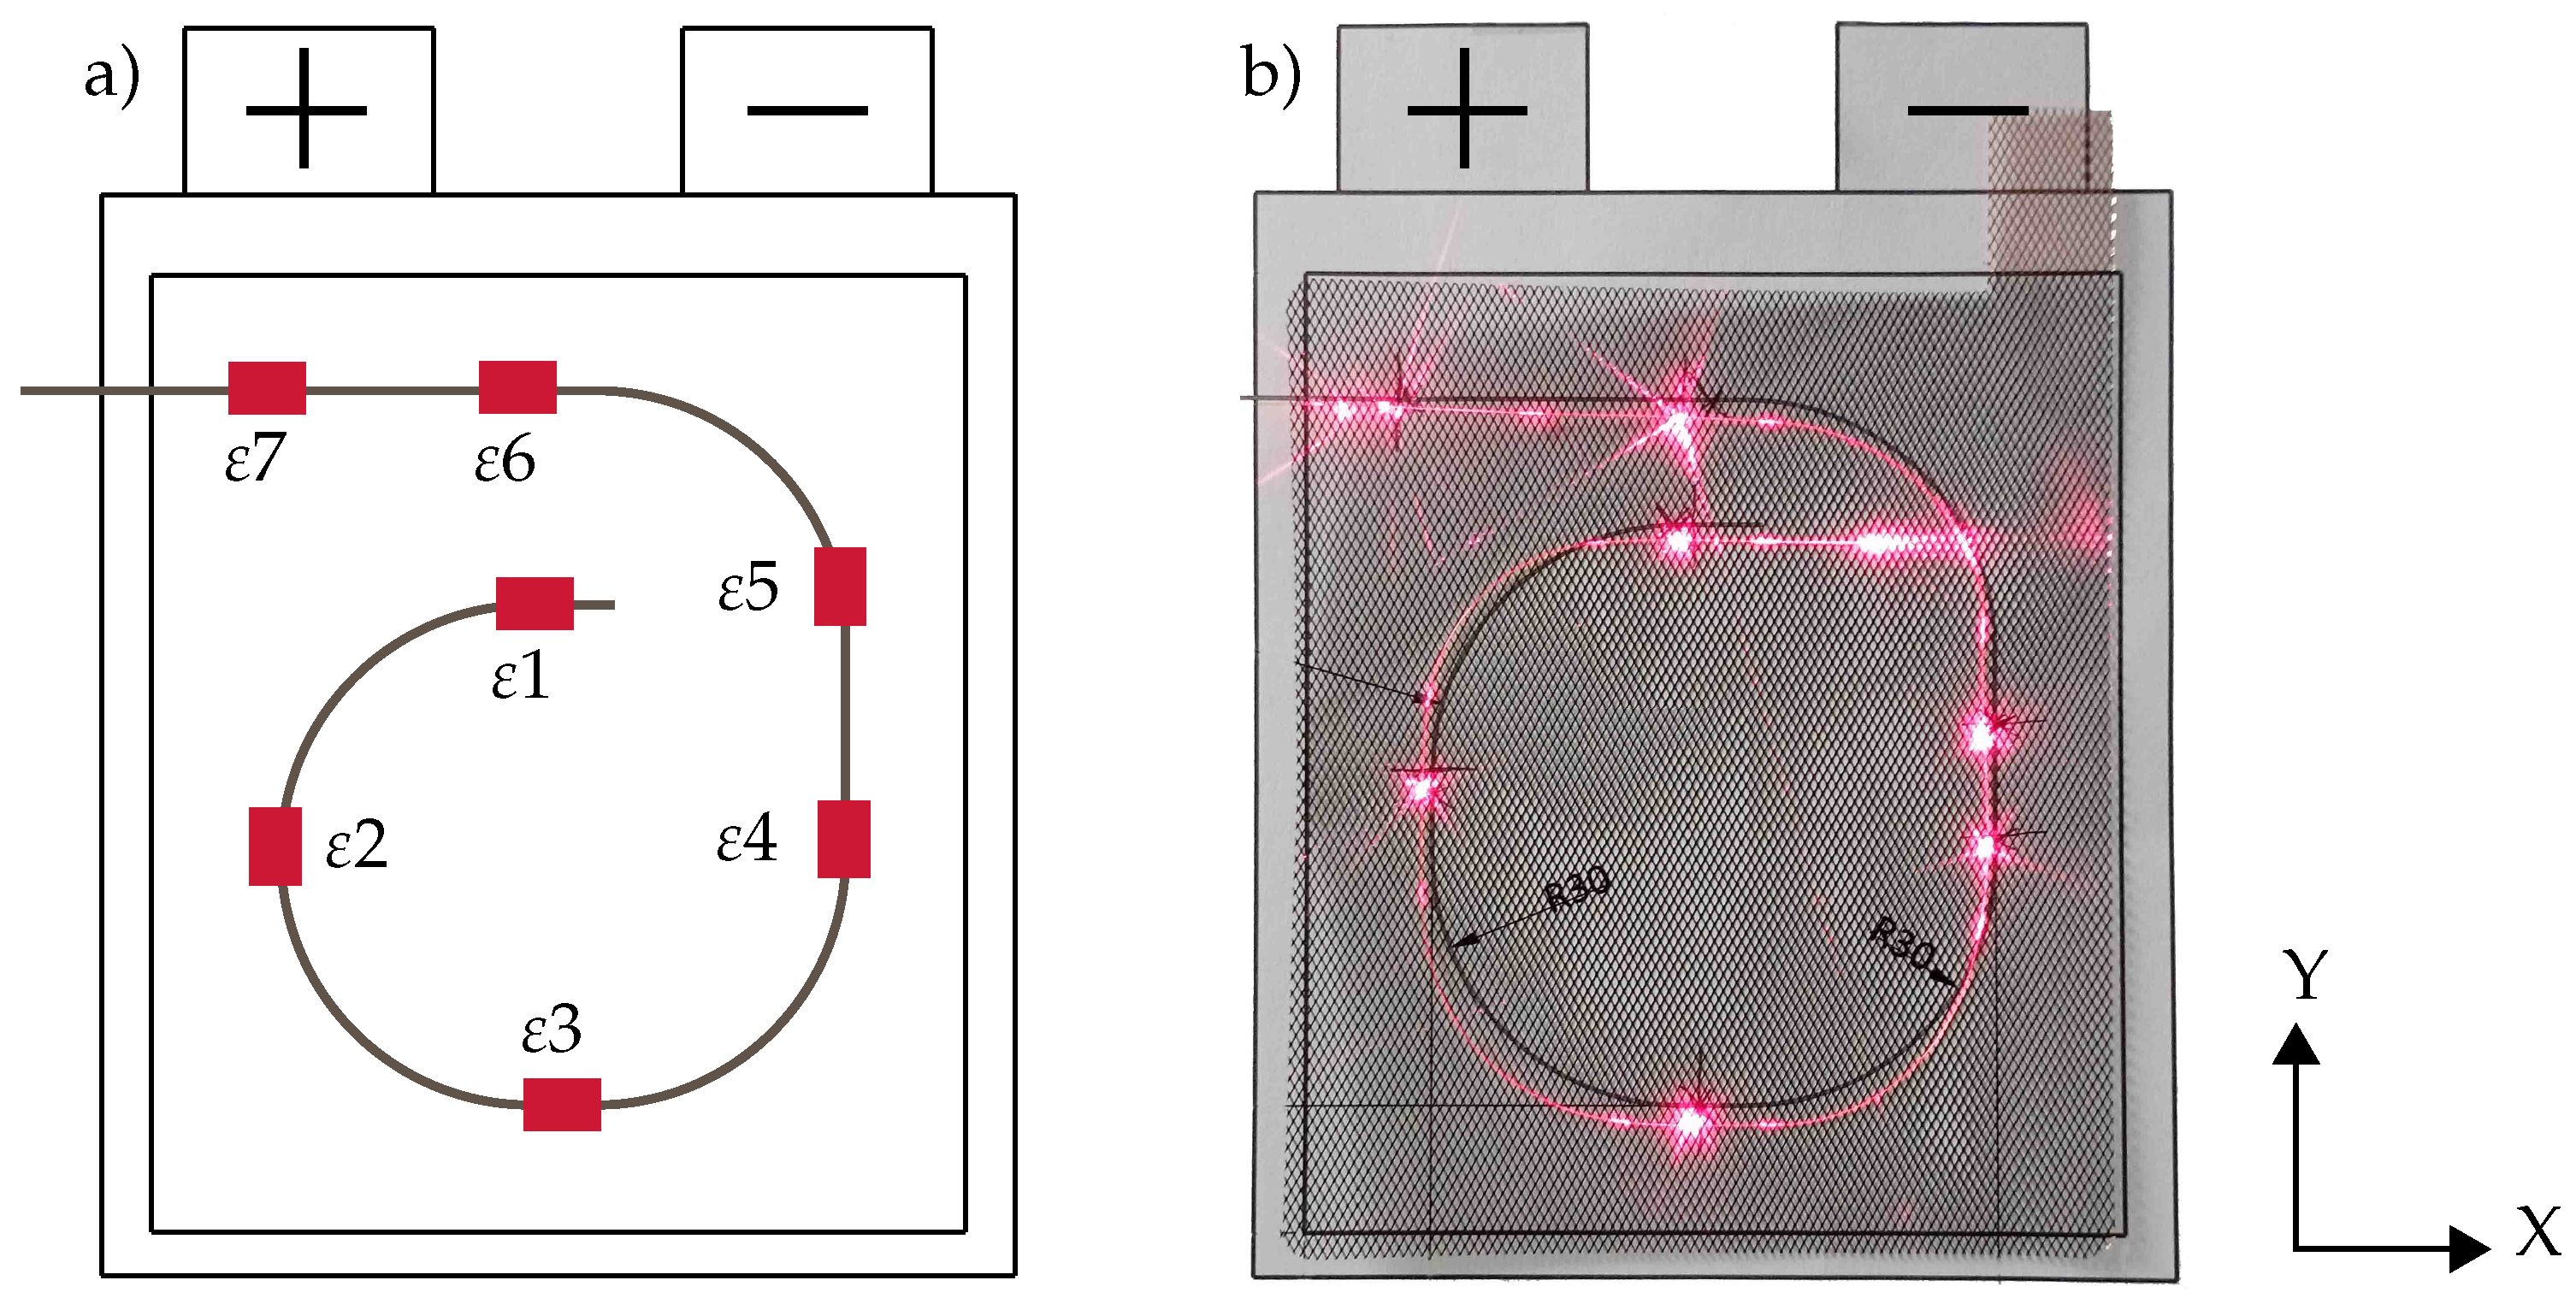
2.2. Device Under Test

The Devices Under Test (DUT) used in this study are lithium-ion cells with integrated glass fiber produced at Fraunhofer ISIT (Itzehoe, Germany). Graphite was selected for the anode material, while the cathode consists of NMC622 (LiNi0.6Mn0.2Co0.2O2). The selection of these materials was based on their current relevance and projected significance in the near future market [36]. Expanded metal serves as the current collector, utilizing aluminum on the cathode side and copper on the anode side. The DUT cell has a nominal capacity of approximately 4.5 Ah. Regarding the optical fiber component, the fiber utilized in this study for integration into the cell is commercially available glass fiber from Fibercore, designated as SM800(4.9/125)P/001.
This fiber contains a germanium-doped silica core with a polyimide coating. The fiber diameter is 125 µm, which extends to 157 µm, including the coating. The operational wavelength range of the fiber spans from 820 to 890 nm, making it suitable for an array of FBGs to monitor multiple points within a lithium-ion cell. In Figure 1a, the pathway of the internal fiber is illustrated, as well as the location of the measurement points and their dimensional orientation. By utilizing FBG sensors, only a single inlet point is needed for the glass fiber to reach the active material, thereby reducing the potential for cell failure due to leakage. The fiber implemented is inscribed with seven Bragg gratings evenly distributed over the wavelength range of the used interrogator between 834 and 870 nm at a distance of 6 nm, using a femtosecond laser at the Fraunhofer HHI (Goslar, Germany). This spacing ensures that there is no overlapping of peaks, allowing for an unambiguous interpretation of each measurement point. The individual Bragg gratings are visible as bright spots in Figure 1b, resulting from light refraction. This figure also illustrates the actual pathway of the fiber as it is positioned on the current collector. The anode is applied directly onto the current collector with the fiber already in place, allowing for complete embedding of the sensor array within the electrode. To prevent any leakage, the fiber’s entry point into the pouch cell is additionally sealed. The measurement points are evenly distributed over the area of the cell, with four Bragg gratings oriented in the X-direction of the cell and the remaining three in the Y-direction. This arrangement enables comprehensive monitoring of internal strain in both directions. While the embedding process introduces some degree of transverse stress that affects individual sensors, the strain detected in this study is assumed to occur predominantly along the fiber axis. This is supported by the absence of significant splitting in the peak of the FBG signals, indicating that the primary strain remains aligned with the orientation of the fiber [29,37].

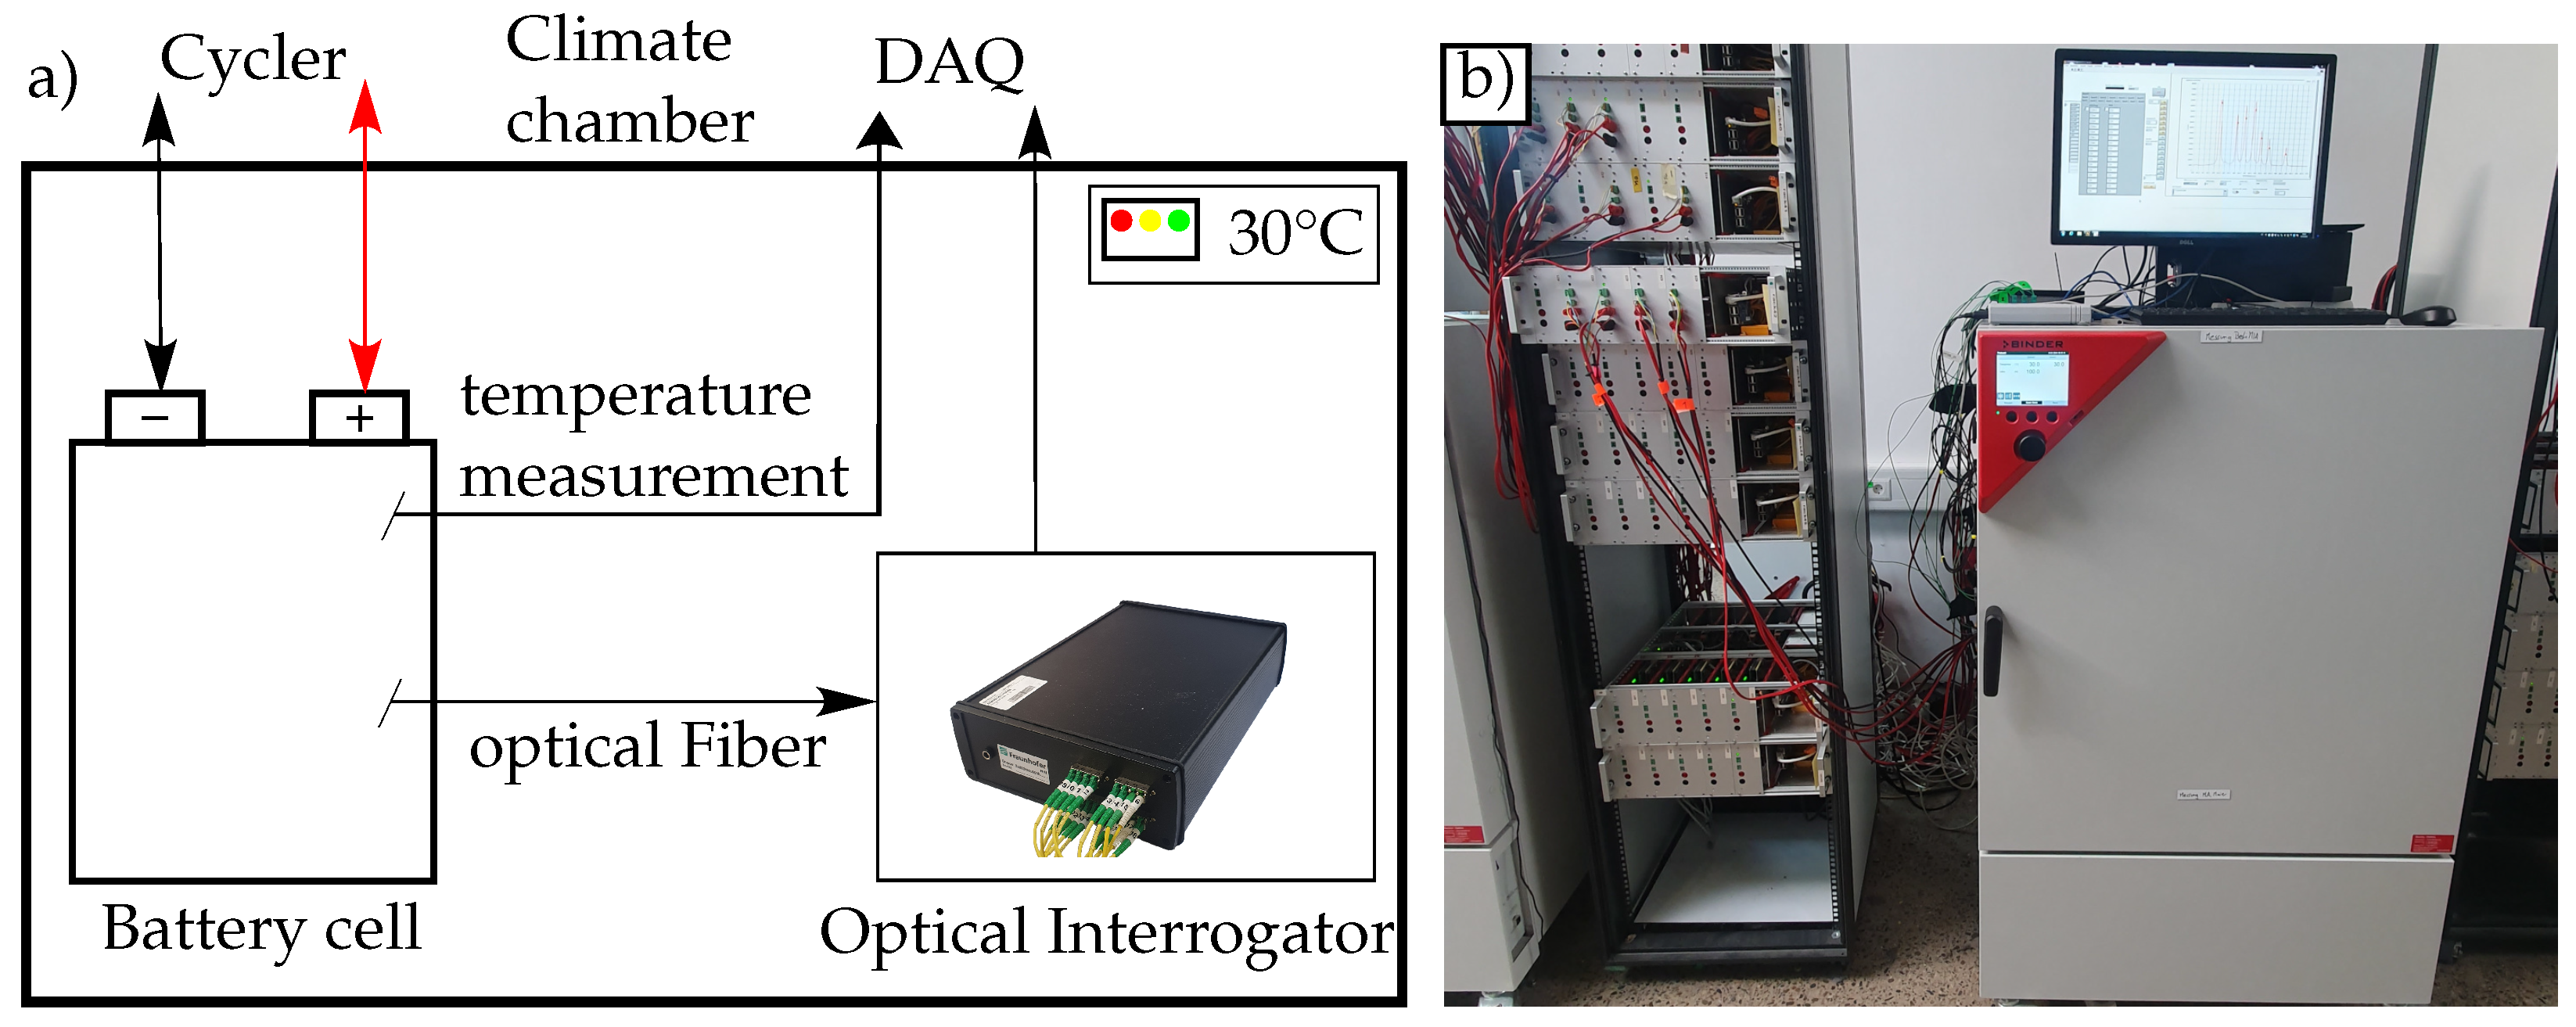
2.3. Experimental Setup

All experiments were performed in a climate chamber, as depicted in Figure 2a. A constant temperature of 30 °C was maintained to ensure stable conditions, thereby eliminating the impact of temperature fluctuations. The climate chamber employed is a Binder KB115 cooling incubator. In addition to the DUT, the measurement unit for the glass fiber was also conducted inside the climate chamber. For fiber optical measurements, a custom interrogator was employed. This interrogator uses an OceanOptics HR4000 spectrometer paired with a broadband light source that covers a range of 830–880 nm. It is capable of monitoring up to 16 fibers simultaneously using a FiberSwitch eol 1 × 16 optical switch by Leoni. The interrogator is controlled by using custom LabView software to allow precise adjustment of the limits and integration times of the optical signal.
The electrical aging process was performed on a custom-built cycler at the Fraunhofer HHI, with a voltage range of 0–5 V and a maximum current of 15 A (Figure 2b). All data generated were stored on a local server with a synchronized time stamp across all measurement devices and the data acquisition unit (DAQ). In addition to the internal optical data, the environment inside and outside the chamber was monitored using Pt100 resistance thermometers connected to a PT-104 measurement unit from Pico Technology. The external temperatures of the specimens were tracked using type K thermocouples connected to a TC-08 logger unit, also from Pico Technology. All electrical temperature data were stored on the same DAQ as the optical system.
The measurement protocol consists of a combination of check-ups and load cycles. All cycles were based on a constant current phase, followed by a constant voltage phase for charging and a constant current to cut-off voltage for discharging. The voltage range is from a maximum Vmax of 4.2 V to a minimum Vmin of 3.0 V. Each check-up cycle includes a full cycle at a C/20 rate, followed by a C/5 internal resistance test at every 10% of the state of charge (SOC). The load cycle consists of 30 full cycles at C/2 until the next check-up is initiated. The load cycles have a cut-off current of C/25. For this study, the check-up cycles at C/20 are particularly valuable for their comprehensive datasets.

3. Results

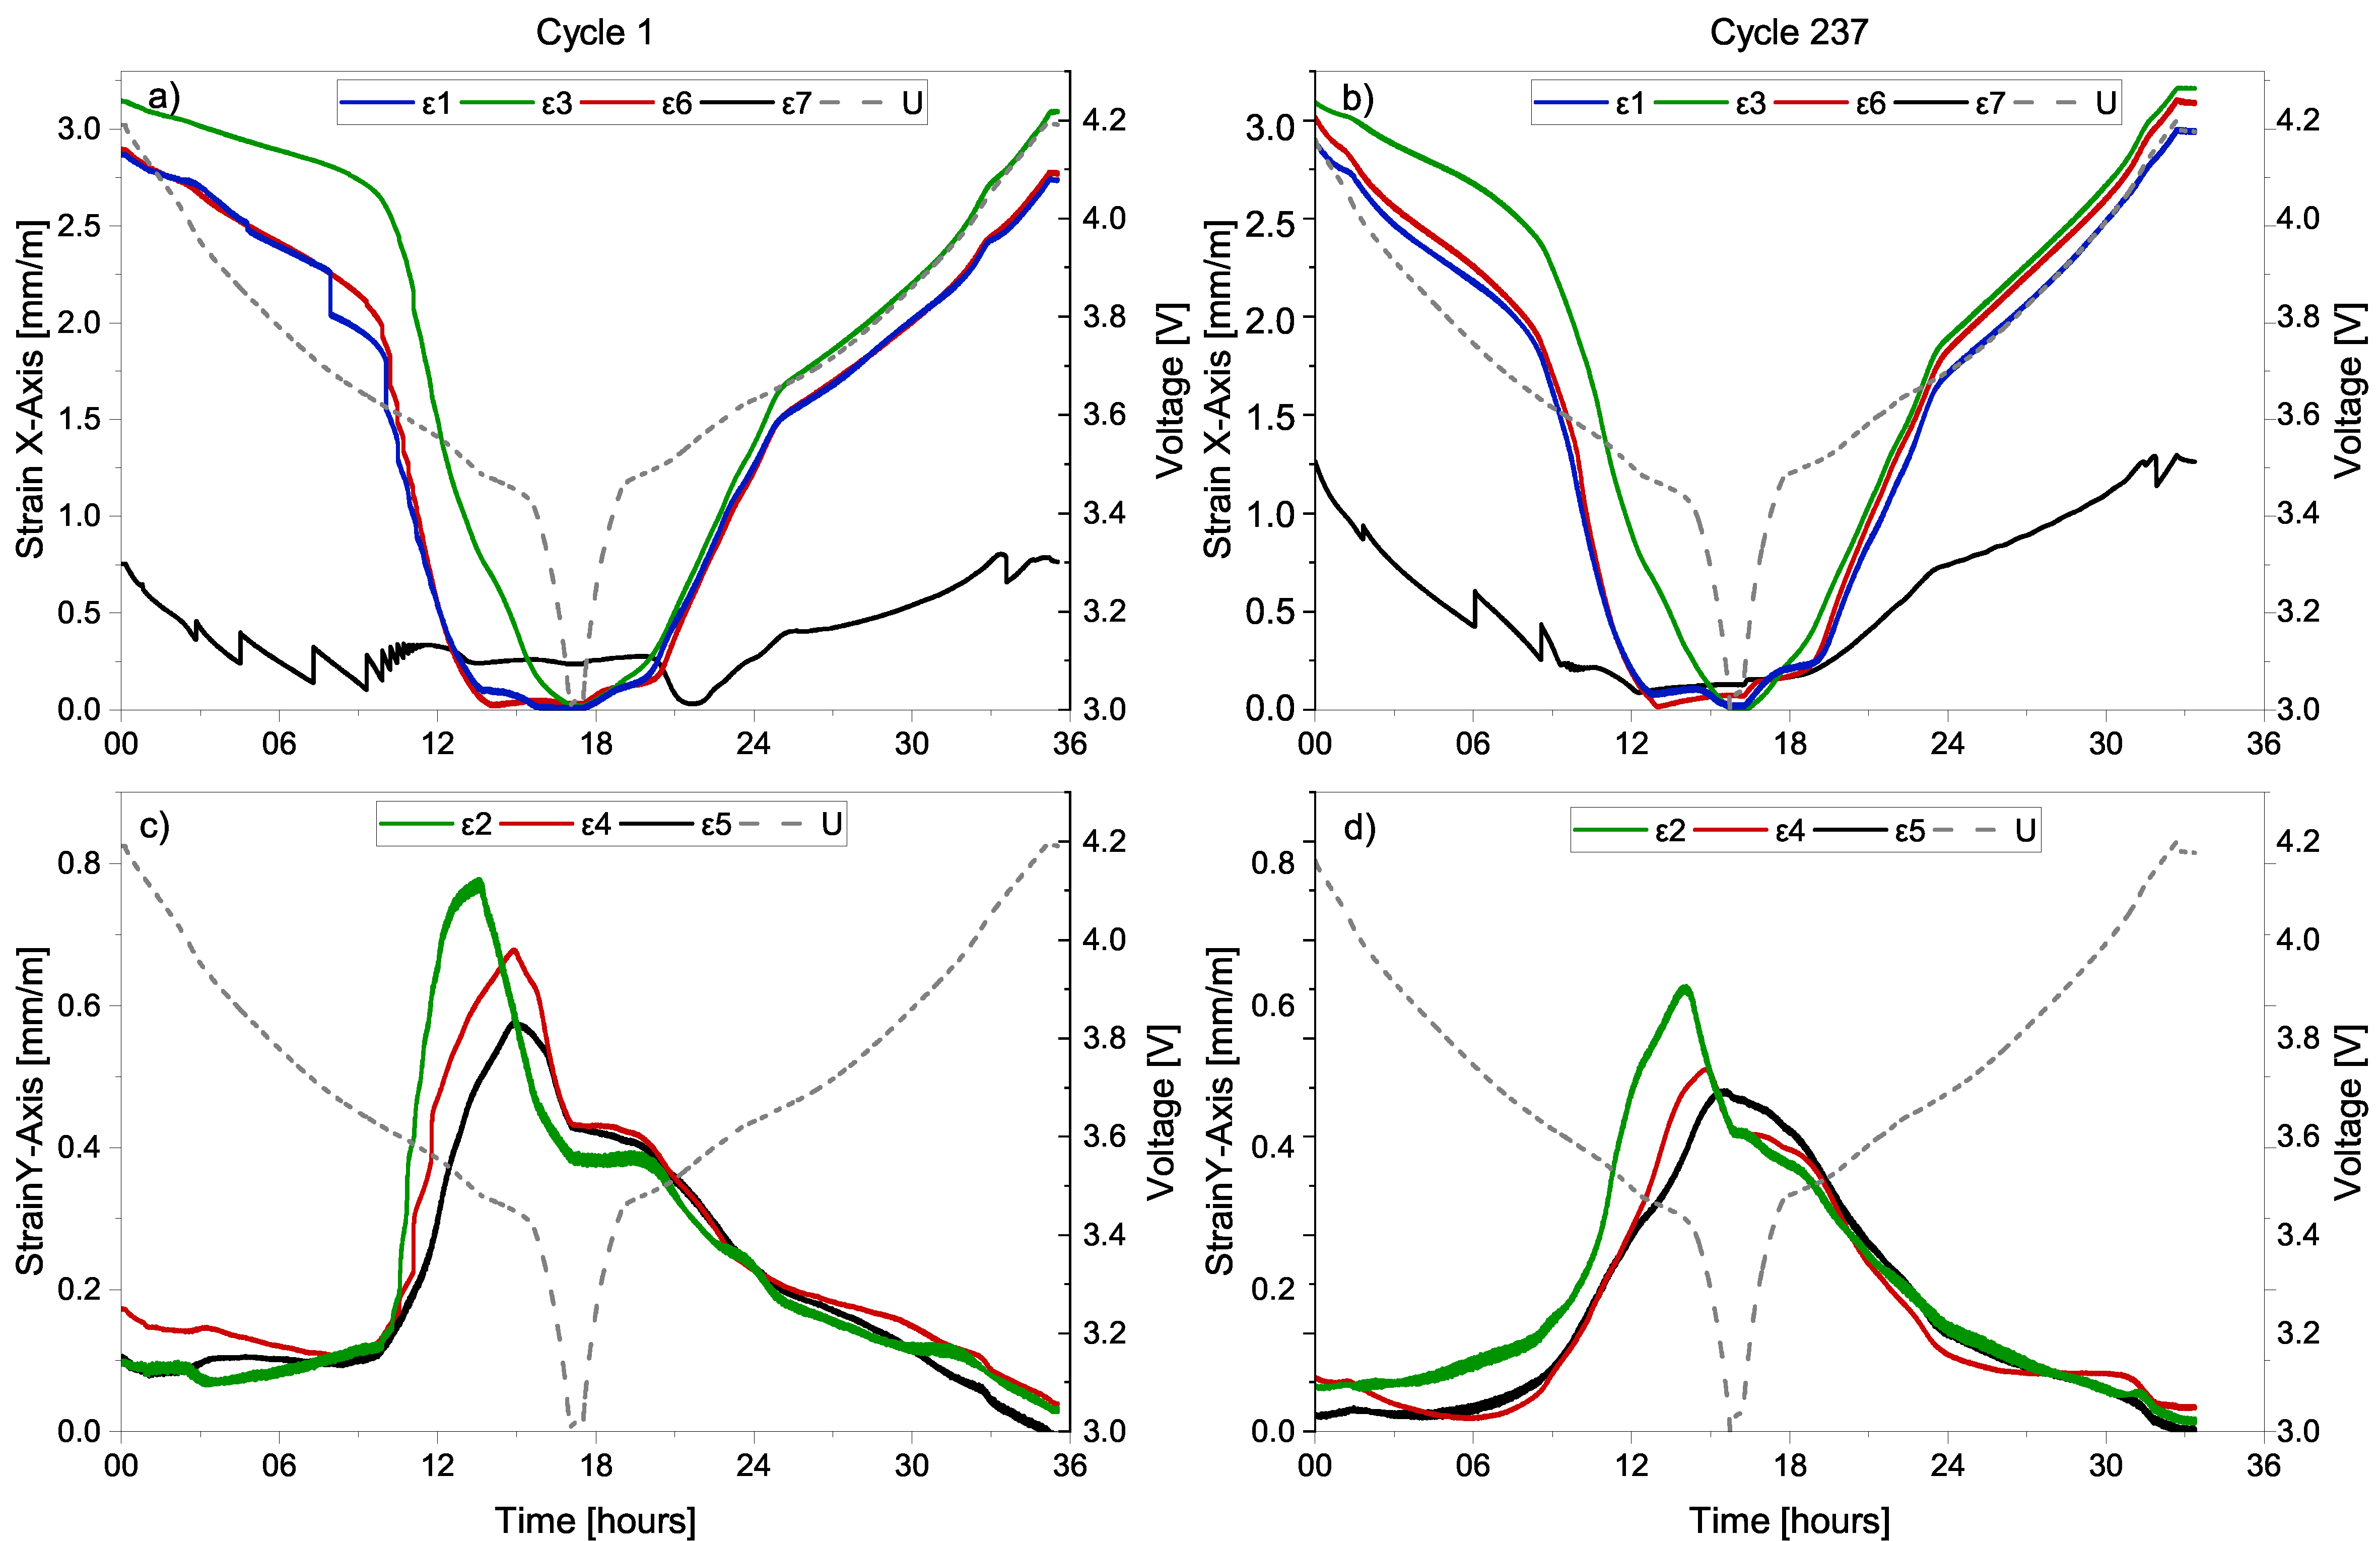
3.1. Cyclical Anode Strain Calculated from Wavelength Shift

For this study, the cells with integrated fiber were cycled over 200 complete cycles according to the test protocol described above. As a reference, cells without integrated fibers were cycled under the same conditions. The implementation of glass fiber into the anode material did not show a significant impact on the aging behavior compared to the reference cells. As previously mentioned, the strain of the internal sensor can be calculated from the measured wavelength shift using Equation (4). The change in signal of each sensor correlates linearly with the internal strain experienced by the anode. However, the conversion factor for each sensor point depends on the initial value of λ B . As depicted in Figure 3, a cyclical correlation of the internally measured strain is observable throughout a check-up cycle. Prior to the start of the measurement protocol, the cells went through a formation process and were charged to Vmax before the initial check-up cycle of this research work, resulting in the initial strain shown in Figure 3a. Furthermore, a dependency on the orientation of the Bragg grating can be seen, resulting in a variation in measured strain for both spatial directions. The X-direction in Figure 3a is more pronounced, showing similarities to the voltage curve over the whole cycle. Conversely, the pattern from the sensors in the Y-direction (Figure 3c) shows an inverse relationship to the voltage, peaking just before full discharge. Furthermore, the maximum measured strain in the Y-direction is generally about 75% smaller than that in the X-direction. When compared to studies utilizing electrical sensors, the observed internal strain of the anode is within the same magnitude [38], and the value of the fiber shows a higher strain value. This difference can be attributed to the fact that the fiber optic sensor, which is integrated directly into a LIB, is capable of measuring the strain of the active material. In contrast, other sensors are typically adhered to the surface or the free collector side and are, therefore, only able to measure the strain of the cell surface that is caused by the deformation of the active material [38]. Moreover, in this case, effective strain detection crucially depends on a precise and durable coupling between the gauge and the surface.
When analyzing the strain patterns over several cycles and the corresponding cell aging, noticeable changes in the features are observed, as illustrated in Figure 3b,d. Nonetheless, the progression and characteristics of these features remain consistent throughout the aging process. The alteration of the features over time will be thoroughly examined in the subsequent part of this work using the newly proposed analysis tools to assess their effectiveness in determining signs of cell aging. Another notable observation is the clear difference in wavelength signal changes between the charging and discharging phases, highlighted by differences in the rate of change for the strain and the tipping points for this rate. Although this effect is also observable for the voltage, due to a hysteresis phenomenon that is caused by diffusion processes between anode and cathode [39,40], it is less distinct compared to the optical strain measurements. Therefore, the optically determined strain may provide additional insight into the lithiation and delithiation processes. For example, the intensity and profile of the measured strains, ε 1 and ε 6, exhibit strong similarities. However, the strain of FBG ε 3 slightly deviates during discharge, with the strain for ε 3 being reduced at a later point with a smaller gradient. In contrast, the charging profiles of all three gratings show strong similarities. Although all Bragg gratings are aligned parallel to each other on the central axis, ε 3 is further away at the bottom of the cell, suggesting that the change in anode strain might be more uniform during charging than during discharging.
For ε 7, located in the corner of the cell, the position appears to influence the amplitude as well as the generated features during cycling. The observed sawtooth effect in FBG ε 7 during discharge, as shown in Figure 3a, can be ruled out as being caused by peak splitting in the wavelength monitor since no significant broadening or change in the wavelength range was detected. Furthermore, this effect can be observed for multiple cells and measurement units. Although this effect diminished throughout the electrical aging protocol, it still persists after over 230 cycles, as shown in Figure 3b. The comparatively low signal strength observed might be explained by the position of the sensor in the corner of the battery. ε 7 is located close to the edge of the anode and, therefore, close to the area of the anode overhang. In this area, the anode active material might not be fully charged, which entails lower anode expansion. The latter results in a lower strain amplitude, as detected for ε 7. Therefore, we confirm that the expansion is not homogeneous throughout the cell [41]. The presence of a sawtooth in the curve of ε 7 is present primarily during cell discharge and mostly absent during charging. It is suggested that this behavior might result from volume changes in the graphite anode during the delithiation process [42,43]. This is supported by the observation that large sawtooth patterns appear during larger volume changes associated with the phase transition from stage 2 to stage 2L [42,43]. In contrast, smaller sawtooth features occur during different stages of intercalation (3L, 4L, and 1L), which occur at lower states of charge [44]. These volume changes may lead to rapid changes in internal stress within the electrode, resulting in the abrupt strain variations observed.
When examining the sensors measuring along the Y-axis, there is a noticeable similarity in the course across all three sensor points. In particular, ε 4 and ε 5 have a strong similarity in their pattern during both the first (Figure 3c) and the last cycles (Figure 3d), which is expected given the close proximity. A noticeable difference of ε 2 is that while reaching a local plateau at the minimal voltage of the cell, the decrease in strain leading to the plateau starts approximately 0.1 V earlier than for both ε 4 and ε 5. When examining the differences, a combination of multiple factors may account for the observed strain curves, with the most significant being the impact of direction on the strain curve. The direction dependence may be attributed to the use of expanded metal rather than foil as the current collector, leading to anisotropic mechanical properties depending on the direction of strain [45]. This could account for the opposing strain behavior observed along the X- and Y-directions, which is not commonly seen in foil-based electrodes and may result from lateral strain effects [46]. Furthermore, this phenomenon may be reinforced by previously reported dimensional differences in displacement [41]. However, the differences in the strain curves for the same direction can be explained by the position of the sensors. This hypothesis is supported by the observation that similar sensors show the same strain curve across multiple samples with variation only in the maximum intensity of the measured strain. These differences in intensity may be caused by inhomogeneities in the active material or differences in the quality of the coupling between the anode and the glass fiber with the Bragg gratings. For simplification, the wavelength shifts have not been converted into strain values in the following sections. The sensor points will be compared over time rather than with each other, ensuring that no information is lost due to potential conversion errors. The unit of the wavelength shift Δ λ B is given in nanometers (nm). For subsequent analysis, primarily one sensor per direction will be considered. For the Y-axis and X-axis, ε 1 and ε 4 have been chosen because of their strong similarity to other sensors, making these measurement points reliable and consistent.

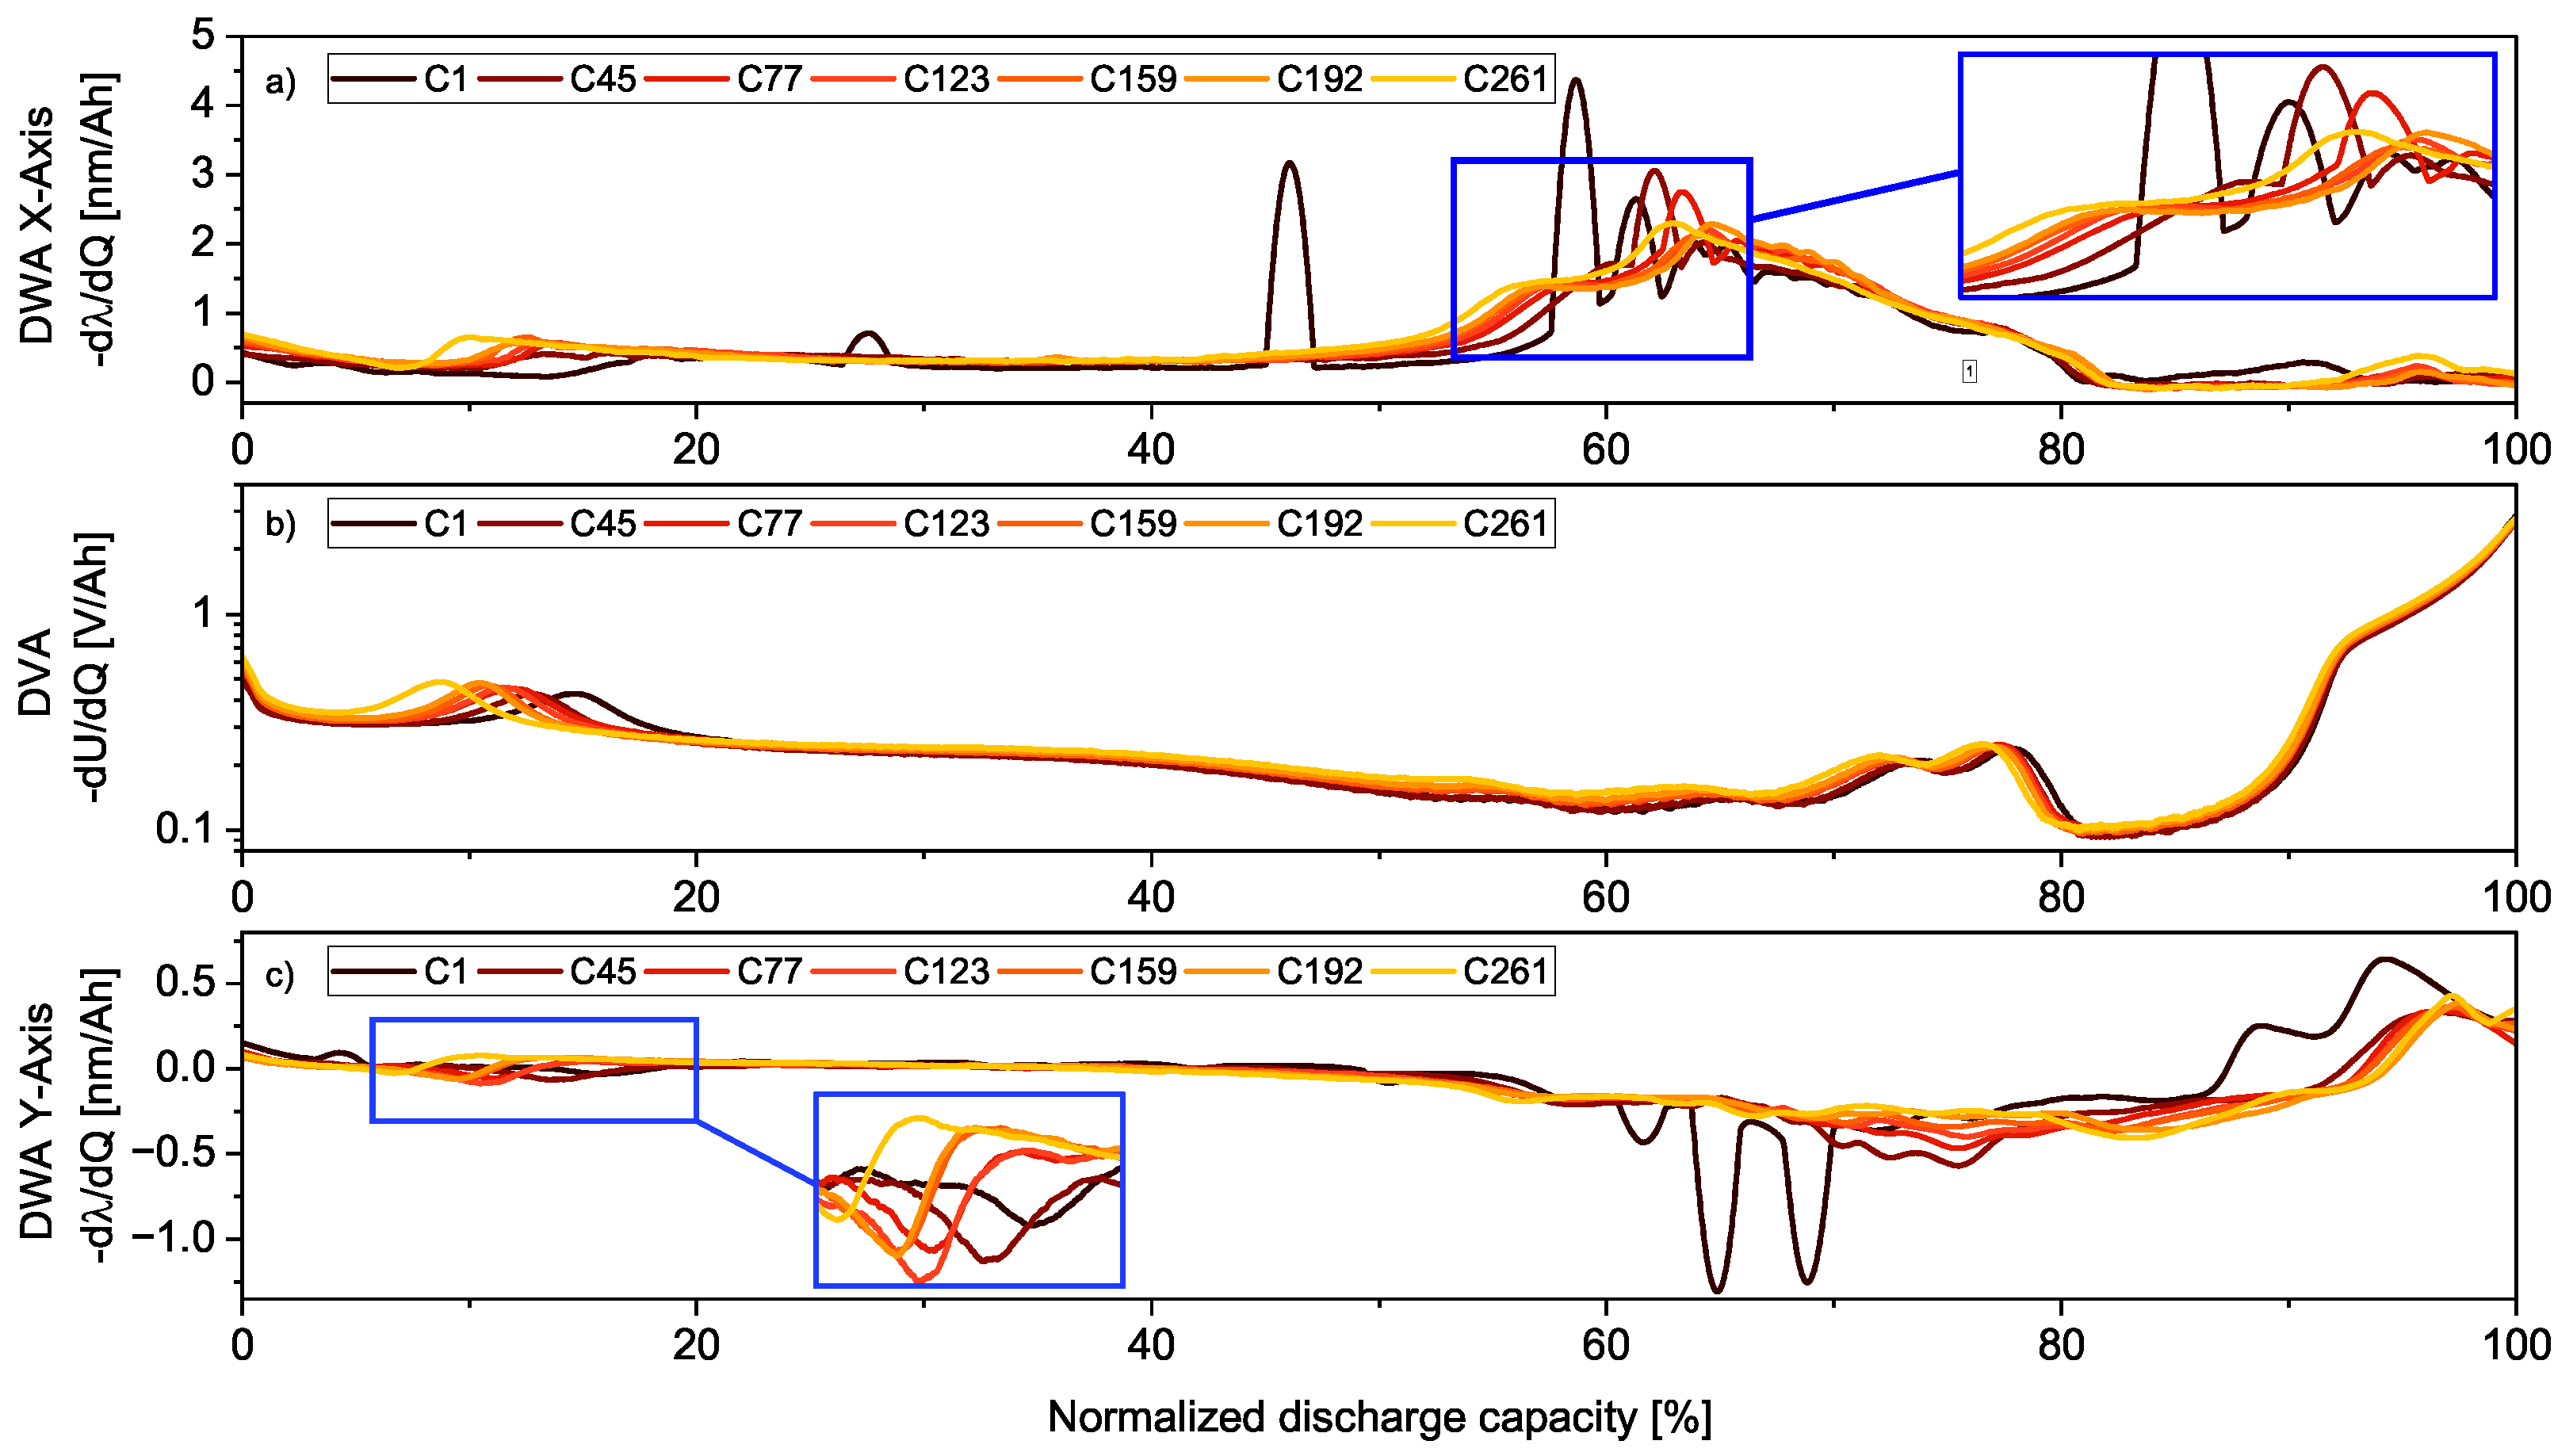
3.2. Differential Analysis

While strain values themselves offer insight into battery status during a specific cycle, it is essential to have a method to visualize changes over time. For electrical data, the DVA is commonly used as a conventional method to estimate capacity degradation in batteries. Given the similarities between the strain and voltage curves presented in Section 3.1, an additional method, termed differential wavelength analysis (DWA), is suggested and explored in the following. This new approach aims to provide added value in understanding the aging process of batteries by taking into account mechanical state variables. This method involves substituting the voltage U with the internal wavelength signal that corresponds to the internal strain. The determination of the DWA is achieved using the following equation:
D V A = d U d Q D W A = d λ B d Q ,
where λ B represents the reflected wavelength of the FBG sensor, and Q denotes the discharge capacity. This method should be viewed as a complementary tool that provides additional information depending on the local strain of a specific point in the active material of the cell. Another advantage of this approach is that the measured wavelength can be used directly without the need to determine the wavelength shift. Furthermore, challenges of optical measurement systems, such as system drift caused by changes in environmental conditions, do not significantly impact the results because DWA benefits from being a differential method.
In Figure 4a,c, check-up cycles are illustrated using Equation (5) for both directions of the optical measurement over the normalized state of charge (SOC). The DVA is presented in the center of Figure 4b, displaying an expected pattern that is comparable to commercial cells of similar anode and cathode composition [47,48]. The DVA has two distinct local peaks at around 10% and 75% SOC. These peaks are suggested to originate from the negative graphite electrode, as NMC does not show distinct peaks on the DVA [48,49,50,51]. The peaks potentially relate to transformations associated with the delithium of the anode, changing from LiC6 to C [50,52]. The shifts of both features correlate with possible loss of active metal (LAM) on the positive electrode (LAMpe) as well as on the negative electrode (LAMne). The changes in the DVA suggest no loss of lithium inventory (LLI) up to this point of aging [53].
The first notable characteristic of the DWA in Figure 4a is the pronounced peaks during the initial check-up cycle (C1). While most peaks diminish already by the second check-up (C45), it takes longer for the peaks in the X-direction at around 65% SOC to decline, as can be seen up to 150 cycles into the aging test. This significant variance in the first check-up is attributed to changes in the SEI, including reversible and irreversible effects for the first full cycles [54,55]. For the DWA, as an instrument for detecting aging-related changes in anode strain, long-term stable peaks are of greater significance. Thus, features that remain for multiple cycles while showing slight changes are of greater priority for further analysis. These kinds of features can be observed for both measurement directions at around 10% and 55% SOC.
The strain in the X-direction (Figure 4a) shows a strong resemblance to the behavior observed in the DVA, particularly in terms of the shift at which the SOC feature occurs during discharge. For the X-direction of the optical sensors, a second distinct feature exists between 50% and 80% of the discharge capacity. Throughout the test protocol, this peak undergoes two significant changes: the overall width increases, accompanied by a steeper initial slope, and the global maxima of the peak shifts to the opposite side, starting later during discharge, with the exception of the last check-up. These changes in the curves of the DWA may be linked to LAMpe or LAMne due to the position of the feature during the discharge process. The second feature of the Y-DWA (Figure 4c) is less pronounced, occurring between 75% and 100% of discharge capacity. In the first part of this second feature, a flattening of the curve can be observed. However, at around 95% of the discharge capacity, a shift in the peak to the right can be observed. A possible reason for that may be changes in the cathode side due to the change occurring on the final stage of discharge. Therefore, a possible reason for these changes could be related to LAMne or LLI. For the anode side, only a small amount of graphite degradation can be observed [56]. Although some features between the DVA and DWA align (e.g., at 10% SOC), this is not true for the majority. In particular, the shift observed in the main peak of the X-axis data suggests that certain features are not associated with specific phase transitions identified in the DVA. Similar discrepancies have also been reported in external strain analyses using fiber-optic sensors to monitor mechanical deformation [57].

3.3. Incremental Analysis

Another non-invasive tool to assess aging-related changes is ICA, which utilizes the same electrical raw data as DVA. ICA, compared to DVA, is more sensitive to changes in resistance and does not need a normalization of the X-axis due to it being represented over the voltage range that remains constant during the lifetime of the cell [58,59]. To incorporate the strain-related changes in wavelength into this method, incremental wavelength analysis (IWA) can be achieved using the following term:
I C A = d Q d U I W A = d λ B d U ,
where the capacity Q is replaced by the wavelength λ B . Using Equation (6) across various check-up cycles, a distinct change in the trend can be determined. To enhance the readability of the ICA signal, a Gaussian filter and a sample size of 0.01 Hz are applied to the electrical data to smooth out the curve [60,61,62]. In Figure 5, the incremental analysis of electrical and optical data during the discharging and charging process is illustrated. IWA is represented in both axial directions of the optical fiber inside the anode, generating a total of three unique aging-related patterns for each direction of current flow. Similar to the DWA for the Y-axis and X-axis, ε 1 and ε 4 were chosen as the sensor points looked at in IWA.
When analyzing the ICA of the charge (Figure 5d) and discharge (Figure 5a), three characteristic features can be identified for both curves [47,63]. The ICA pattern does not indicate significant inhomogeneity. In both directions, the IWA data shown in Figure 3 exhibit changes that correspond to those observed in the ICA. This effect has also been reported in previous studies that included measurements of external strain [57]. Starting from the highest potential, the valley around 4.0 V corresponds to the second peak of the DVA [64], most likely related to the filling of the cathode with lithium ions and changes in the negative electrode content from LiC6 to LiC12 [65]. Due to the different dependencies of the features on electrochemical changes, certain peaks can be attributed to different changes in the composition of the cell. The second feature, around 3.6 V according to the literature, depends on further lithium intercalation within the crystalline structure of the cathode. During this stage, graphite transformations from LiC12 to LiC18 are occurring [63]. The final peak around 3.4 V is mostly graphite, related to the remaining reactions of LiC18 to LiC24 and LiC36 [63]. Based on the shift in voltage and intensity of these features, both an LLI and LAMpe are suggested [59,63].
For ICA, although a peak correlates with changes in both electrodes [66], this is not necessarily the case for IWA, as it is related to the internal strain experienced by the anode material. A key difference between the IWA curve and the ICA curve is the more pronounced difference between charging and discharging. Although the signal of the IWA is noisier compared to the capacity analysis, it is still possible to identify distinct features that change over the lifespan of the cell. These changes can be manifested as variations in the intensity of the feature or position over the voltage range, similar to changes in the conventional analysis method. In the case of discharge, the IWA in the X-direction, as shown in Figure 5b, contains three areas of interest. The first area of interest is between 3.2 V and 3.4 V due to the formation of a peak in the strain derivative over cyclic aging. This effect is even more noticeable during the charging process. This feature cannot be seen in the ICA and could be due to volume changes during the early intercalation stages [42,43]. Since the observed strain changes are linked to structural transformations within the electrode [57], this feature is proposed to indicate the occurrence of LLI and LAMpe. The second feature, around 3.6 V, appears as a peak with the highest intensity for IWA in the X- and Y-directions. While the intensity of this peak remains constant, the overall width is increasing during the aging of the DUT. The shift of this characteristic is observed to change in both directions of voltage, with a more prominent change towards the higher potential, as illustrated in the green highlighted box in Figure 5b. A third, less pronounced feature of the discharge IWA in the X-direction is a peak and valley combination observed around 4.1 V (highlighted blue) that narrows in width during later cycles. The peak starts earlier, and the valley remains at the same voltage position. In addition, the initial value during the discharge of the check-ups grows in intensity as the cells age. While the IWA in Figure 5b is based on strain, the anode experiences the X-direction at a specific sensor point, and the feature around 4.1 V can be attributed to a transformation that involves changes in both the anode and the cathode [63,64]. Resulting in a cross-sensitivity in the anode that can be measured by the optical sensor, therefore enabling the Bragg gratings to detect cathode effects as well. For the IWA in the Y-direction of the discharge (Figure 5c), similar features of interest around both 3.6 V and 4.0 V are identified. The feature at 3.6 V shows a reduction in intensity over the course of the experimental protocol; the width of this peak predominantly expands towards lower potential, up to 3.2 V. For the last seconds, about half of the check-up cycles, a new feature consisting of a valley peaks combination is forming. Changes around this voltage are suggested to be mainly influenced by graphite-related changes [63], such as transformation from LiC24 to LiC36 or even LiC72 [52]. Therefore, this peak emerging after initial aging processes may hint at changes in the anode material or lithium inventory.
When examining the IWA during charging, entirely different IWA patterns emerge for the same FBG sensor compared to those observed during the discharging process. Although the positions of the features remain within a similar voltage range, they appear with reduced intensity and exhibit a steeper gradient at the peak. This variation underscores the distinct responses of the sensor under different operational phases, highlighting the intricate dynamics within the cell during charging. For the X-direction, as shown in Figure 5e, the feature at 3.6 V shifts to a higher potential while maintaining the feature width. Furthermore, three peaks can be observed as part of the feature. The first (3.5 V) and third (3.65 V) peaks increase in intensity over time, while the second peak (3.5 V) decreases. At around 4.1 V, in addition to the shift, both a decrease in intensity and a narrowing of the peak are observed, similar to changes during discharge. As the direction of measurement within the DUT is relevant, the Y-direction in Figure 5f shows an inverted pattern compared to Figure 5e. The changes around 3.5 V and 4.1 V appear with a similar intensity, unlike the previous IWA curves. Similar to the discharge, a widening of the valley can be seen. However, this time, the shift can be seen towards a higher potential, with the intensity being constant with regard to the aging process. For the changes in strain around 4.1 V, mostly a shift combined with a widening of the valley could be observed.
While the ICA captures the electrochemical changes across the cell potential, the location-dependent strain can be further elucidated using the IWA. Despite the integration of fiber into the anode active material, cathode processes also influence the strain experienced by the anode due to their interactions. To further understand and highlight the occurring changes in strain that can be observed by internal fiber optics, the voltage shifts of exemplary peaks have been illustrated in Figure 6, with F1 relating to a change around 3.6 V and F2 to a shift at around 4.1 V, respectively. The majority of discrete features demonstrate a strong linear correlation compared to the loss of capacity, with the coefficient of determination being higher than 95% for multiple points chosen. A relation between internal strain and cell degradation has been shown, which can be visualized by the IWA, enabling the method to be used for possible determination of the state of health, similar to the ICA [64,67,68]. Most changes in the IWA resulted in a shift of the curve towards a higher voltage or a widening of the features, which results in a longer duration for the anode strain to rise or fall as the cell experiences aging. When analyzing these shifts compared with the changes in the ICA, a loss of lithium inventory is suggested. Furthermore, a rise in ohmic resistance might partially explain the changes observed [59].

3.4. Load Cycles

The check-up cycles reveal age-related changes in both the ICA and IWA. However, under high currents, the precision and interpretability of the ICA is compromised [69]. In contrast, the IWA pattern remains distinctly visible during initial cycles, even under higher current rates of C/2, as prominently illustrated in Figure 7a. This is consistent with strain measurements obtained from dilatometric analysis performed at various charge rates [70]. This effect might be in relation to the findings of Tavassol et al., which claim that the strain follows the capacity response [71]. Furthermore, a significant advantage of IWA is that the changes in features during the early cycles are more pronounced, making it an effective tool for detecting subtle variations in the mechanical properties of the battery components that are not as easily detectable with the ICA for early cycles. The sensor depicted in Figure 7 correlates to the discharge in the Y-direction shown in Figure 5c, further emphasizing the consistency and reliability of IWA under varying operational conditions.
The primary characteristics of the C/2 IWA include a shrinking peak around 3.3 V and a valley around 3.5 V, with ongoing ripple effects, as shown in Figure 7a. For the check-ups in Figure 7c with a current of C/20, the pattern around 3.5 V is visible throughout multiple check-ups, even in the later stages of aging. While this feature predominantly fades in Figure 7b, it can still be partially observed during the first cycle after the check-up. Compared to ICA, the optical analysis more prominently highlights differences after the check-up. Furthermore, looking at the pattern of IWA in Figure 7c, a slight recovery can be seen for the first cycle during aging. While this behavior is also present for the ICA, it is less evident. Therefore, internal strain seems to recover to some degree after a check-up routine, similar to a regeneration that the cell can see after rest times [72].
It seems that for later cycles, the properties of IWA converge with ICA (Figure 7c,d). Furthermore, Figure 7d shows only a slight difference from Figure 7c, and a change can be observed for the last two depicted cycles. This may be a first indicator of increased aging or a change in a chemical composition. Supporting this theory is the fact that the final check-ups of ICA (Figure 5) and DWA (Figure 4) show a pronounced deviation from the previous check-ups. Meanwhile, no anomalies can be seen in the ICA of Figure 7d. When comparing Figure 7a,d, it is observed that the valley around 3.5 V of the IWA shifts by a proportion comparable to the corresponding valley in the ICA. This change is assumed to be related to an increase in ohmic resistance. In addition, it appears that in later cycles, the properties of the IWA begin to converge with those of the ICA (Figure 7c,d). Subsequently, a valley around 4.0 V is starting to form for the IWA, similar to the ICA. For the later cycle under load in Figure 7d, only slight differences from Figure 7c can be observed. However, a noticeable change in the last two cycles is shown, which may be an early indicator of increased aging or changes in chemical composition. In support of this theory, the final check-ups in the ICA (Figure 5) and DWA (Figure 4) show pronounced deviations from previous check-ups, highlighting significant changes. Meanwhile, no anomalies are observed in the ICA of Figure 7d, suggesting that IWA, which is directly related to internal strain, may capture subtle aging effects that are not as apparent in ICA.

4. Conclusions

In this publication, glass fiber with inscribed FBGs is integrated into the anode material of a LIB. Detection of internal strain could be observed, demonstrating a dependency between the location and orientation of the Bragg grating as well as the state of charge of the battery. Furthermore, a correlation between differential and incremental analysis methods utilizing optical strain data and aging is presented. The observed strain did not exhibit significant aging-related changes in amplitude, although variations in the overall progression of the strain during cycling were observed.
Additionally, we propose modifications to the DVA and ICA using optical data, which provide supplementary insight into aging-related changes within the cell through strain-related information from wavelength shifts. Notably, the novel introduction of IWA has shown potential as an addition to ICA by more distinctly highlighting differences in strain between anode- and cathode-related changes. Particularly in the first cycles, with a current of at least C/2, IWA provided more information than ICA. After aging, however, both methods tend to converge in their responses, thus enabling IWA as a possible tool for improving cells for high-current applications. Further investigation is necessary to dissect the unique peaks and valleys observed in DWA and IWA. This process is currently being advanced through the use of electrochemical impedance spectroscopy in addition to internal glass fiber. Moreover, a post-mortem analysis is planned after further capacity loss to validate the effectiveness of this additional sensor beyond the scope of this publication.

Author Contributions

Conceptualization, L.K., F.L. and T.O.; methodology, L.K.; validation, L.K. and F.L.; formal analysis, L.K. and T.O.; investigation, L.K.; resources, A.B. and L.K.; data curation, L.K.; writing—original draft preparation, L.K.; writing—review and editing, T.O., A.B. and A.N.; visualization, L.K.; supervision, A.N., A.W. and W.S.; All authors have read and agreed to the published version of the manuscript.

Funding

This research was funded by the German Federal Ministry of Education and Research (BMBF) with the grant number 03XP0350.

Data Availability Statement

The data presented in this study are available upon request from the corresponding author (L.K.).

Acknowledgments

The authors gratefully acknowledge the support from the Open Access Publishing Fund of Clausthal University of Technology.

Conflicts of Interest

The authors declare no conflict of interest.

Abbreviations

The following abbreviations are used in this manuscript:
DAQData acquisition unit
DUTDevice under test
DVADifferential voltage analysis
DWADifferential wavelength analysis
FBGFiber Bragg grating
ICAIncremental capacity analysis
IWAIncremental wavelength analysis
LIBLithium-ion battery
LLILoss of lithium inventory
LAMneLoss of active material (negative electrode)
LAMpeLoss of active material (positive electrode)
NMCNickel-Manganese-Cobalt-oxide
SOCState of charge

References

  1. Deng, H.; Aifantis, K.E. Applications of Lithium Batteries; Wiley: Hoboken, NJ, USA, 2022. [Google Scholar] [CrossRef]
  2. Zubi, G.; Dufo-López, R.; Carvalho, M.; Pasaoglu, G. The lithium-ion battery: State of the art and future perspectives. Renew. Sustain. Energy Rev. 2018, 89, 292–308. [Google Scholar] [CrossRef]
  3. Xu, J.; Cai, X.; Cai, S.; Shao, Y.; Hu, C.; Lu, S.; Ding, S. High-Energy Lithium-Ion Batteries: Recent Progress and a Promising Future in Applications. Energy Environ. Mater. 2023, 6, e12450. [Google Scholar] [CrossRef]
  4. Dolotko, O.; Senyshyn, A.; Mühlbauer, M.J.; Nikolowski, K.; Scheiba, F.; Ehrenberg, H. Fatigue Process in Li-Ion Cells: An In Situ Combined Neutron Diffraction and Electrochemical Study. J. Electrochem. Soc. 2012, 159, A2082–A2088. [Google Scholar] [CrossRef]
  5. Darma, M.S.D.; Lang, M.; Kleiner, K.; Mereacre, L.; Liebau, V.; Fauth, F.; Bergfeldt, T.; Ehrenberg, H. The influence of cycling temperature and cycling rate on the phase specific degradation of a positive electrode in lithium ion batteries: A post mortem analysis. J. Power Sources 2016, 327, 714–725. [Google Scholar] [CrossRef]
  6. Iturrondobeitia, A.; Aguesse, F.; Genies, S.; Waldmann, T.; Kasper, M.; Ghanbari, N.; Wohlfahrt-Mehrens, M.; Bekaert, E. Post-Mortem Analysis of Calendar-Aged 16 Ah NMC/Graphite Pouch Cells for EV Application. J. Phys. Chem. C 2017, 121, 21865–21876. [Google Scholar] [CrossRef]
  7. Xiong, R.; Pan, Y.; Shen, W.; Li, H.; Sun, F. Lithium-ion battery aging mechanisms and diagnosis method for automotive applications: Recent advances and perspectives. Renew. Sustain. Energy Rev. 2020, 131, 110048. [Google Scholar] [CrossRef]
  8. Cannarella, J.; Arnold, C.B. Stress evolution and capacity fade in constrained lithium-ion pouch cells. J. Power Sources 2014, 245, 745–751. [Google Scholar] [CrossRef]
  9. Clerici, D.; Mocera, F.; Somà, A. Experimental Characterization of Lithium-Ion Cell Strain Using Laser Sensors. Energies 2021, 14, 6281. [Google Scholar] [CrossRef]
  10. Jin, C.; Wang, Y.; Borujerdi, A.S.; Li, J. Stress evolution and thickness change of a lithium-ion pouch cell under various cycling conditions. J. Power Sources Adv. 2022, 16, 100103. [Google Scholar] [CrossRef]
  11. Krause, T.; Nusko, D.; Pitta Bauermann, L.; Vetter, M.; Schäfer, M.; Holly, C. Methods for Quantifying Expansion in Lithium-Ion Battery Cells Resulting from Cycling: A Review. Energies 2024, 17, 1566. [Google Scholar] [CrossRef]
  12. Mukhopadhyay, A.; Sheldon, B.W. Deformation and stress in electrode materials for Li-ion batteries. Prog. Mater. Sci. 2014, 63, 58–116. [Google Scholar] [CrossRef]
  13. Wang, L.; Duan, X.; Liu, B.; Li, Q.; Yin, S.; Xu, J. Deformation and failure behaviors of anode in lithium-ion batteries: Model and mechanism. J. Power Sources 2020, 448, 227468. [Google Scholar] [CrossRef]
  14. Pistorio, F.; Clerici, D.; Mocera, F.; Somà, A. Review on the Experimental Characterization of Fracture in Active Material for Lithium-Ion Batteries. Energies 2022, 15, 9168. [Google Scholar] [CrossRef]
  15. Schulze, C.; Birke, K.P. Method for analyzing in-situ volume change of large format lithium-ion hard case cells. J. Energy Storage 2022, 55, 105736. [Google Scholar] [CrossRef]
  16. Xie, S.; Ren, L.; Yang, X.; Wang, H.; Sun, Q.; Chen, X.; He, Y. Influence of cycling aging and ambient pressure on the thermal safety features of lithium-ion battery. J. Power Sources 2020, 448, 227425. [Google Scholar] [CrossRef]
  17. Berecibar, M.; Gandiaga, I.; Villarreal, I.; Omar, N.; Van Mierlo, J.; Van den Bossche, P. Critical review of state of health estimation methods of Li-ion batteries for real applications. Renew. Sustain. Energy Rev. 2016, 56, 572–587. [Google Scholar] [CrossRef]
  18. Ansean, D.; Garcia, V.M.; Gonzalez, M.; Blanco-Viejo, C.; Viera, J.C.; Pulido, Y.F.; Sanchez, L. Lithium-Ion Battery Degradation Indicators Via Incremental Capacity Analysis. IEEE Trans. Ind. Appl. 2019, 55, 2992–3002. [Google Scholar] [CrossRef]
  19. Gao, Y.; Jiang, J.; Zhang, C.; Zhang, W.; Jiang, Y. Aging mechanisms under different state-of-charge ranges and the multi-indicators system of state-of-health for lithium-ion battery with Li(NiMnCo)O2 cathode. J. Power Sources 2018, 400, 641–651. [Google Scholar] [CrossRef]
  20. Zhu, J.; Dewi Darma, M.S.; Knapp, M.; Sørensen, D.R.; Heere, M.; Fang, Q.; Wang, X.; Dai, H.; Mereacre, L.; Senyshyn, A.; et al. Investigation of lithium-ion battery degradation mechanisms by combining differential voltage analysis and alternating current impedance. J. Power Sources 2020, 448, 227575. [Google Scholar] [CrossRef]
  21. Mohtat, P.; Lee, S.; Sulzer, V.; Siegel, J.B.; Stefanopoulou, A.G. Differential Expansion and Voltage Model for Li-ion Batteries at Practical Charging Rates. J. Electrochem. Soc. 2020, 167, 110561. [Google Scholar] [CrossRef]
  22. Kim, S.; Raj, A.; Li, B.; Dufek, E.J.; Dickerson, C.C.; Huang, H.Y.; Liaw, B.; Pawar, G.M. Correlation of electrochemical and mechanical responses: Differential analysis of rechargeable lithium metal cells. J. Power Sources 2020, 463, 228180. [Google Scholar] [CrossRef]
  23. Daubinger, P.; Ebert, F.; Hartmann, S.; Giffin, G.A. Impact of electrochemical and mechanical interactions on lithium-ion battery performance investigated by operando dilatometry. J. Power Sources 2021, 488, 229457. [Google Scholar] [CrossRef]
  24. Bezsonov, I.I.; Waller, G.H.; Ko, J.; Nadimpalli, S.P. In operando measurement of surface strain of 18650 Li-ion cells during cycling. J. Power Sources 2024, 592, 233915. [Google Scholar] [CrossRef]
  25. Han, G.; Yan, J.; Guo, Z.; Greenwood, D.; Marco, J.; Yu, Y. A review on various optical fibre sensing methods for batteries. Renew. Sustain. Energy Rev. 2021, 150, 111514. [Google Scholar] [CrossRef]
  26. Nedjalkov, A.; Meyer, J.; Gräfenstein, A.; Schramm, B.; Angelmahr, M.; Schwenzel, J.; Schade, W. Refractive Index Measurement of Lithium Ion Battery Electrolyte with Etched Surface Cladding Waveguide Bragg Gratings and Cell Electrode State Monitoring by Optical Strain Sensors. Batteries 2019, 5, 30. [Google Scholar] [CrossRef]
  27. Fortier, A.; Tsao, M.; Williard, N.; Xing, Y.; Pecht, M. Preliminary Study on Integration of Fiber Optic Bragg Grating Sensors in Li-Ion Batteries and In Situ Strain and Temperature Monitoring of Battery Cells. Energies 2017, 10, 838. [Google Scholar] [CrossRef]
  28. Nascimento, M.; Ferreira, M.; Pinto, J. Simultaneous Sensing of Temperature and Bi-Directional Strain in a Prismatic Li-Ion Battery. Batteries 2018, 4, 23. [Google Scholar] [CrossRef]
  29. Bae, C.; Manandhar, A.; Kiesel, P.; Raghavan, A. Monitoring the Strain Evolution of Lithium-Ion Battery Electrodes using an Optical Fiber Bragg Grating Sensor. Energy Technol. 2016, 4, 851–855. [Google Scholar] [CrossRef]
  30. Morey, W.W.; Meltz, G.; Glenn, W.H. Fiber Optic Bragg Grating Sensors. In Proceedings of the Fiber Optic and Laser Sensors VII, Boston, WA, USA, 5–7 September 1989; DePaula, R.P., Udd, E., Eds.; SPIE: Bellingham, WA, USA, 1990. [Google Scholar] [CrossRef]
  31. Rao, Y.J. In-fibre Bragg grating sensors. Meas. Sci. Technol. 1997, 8, 355–375. [Google Scholar] [CrossRef]
  32. Werneck, M.M.; Allil, R.C.S.B.; Ribeiro, B.A.; de Nazaré, F.V.B. A Guide to Fiber Bragg Grating Sensors. In Current Trends in Short- and Long-Period Fiber Gratings; InTech: London, UK, 2013. [Google Scholar] [CrossRef]
  33. Sahota, J.K.; Gupta, N.; Dhawan, D. Fiber Bragg grating sensors for monitoring of physical parameters: A comprehensive review. Opt. Eng. 2020, 59, 1. [Google Scholar] [CrossRef]
  34. O’Dwyer, M.J.; Ye, C.C.; James, S.W.; Tatam, R.P. Thermal dependence of the strain response of optical fibre Bragg gratings. Meas. Sci. Technol. 2004, 15, 1607–1613. [Google Scholar] [CrossRef]
  35. Frazão, O.; Santos, J.L. Simultaneous measurement of strain and temperature using a Bragg grating structure written in germanosilicate fibres. J. Opt. A Pure Appl. Opt. 2004, 6, 553–556. [Google Scholar] [CrossRef]
  36. Degen, F.; Winter, M.; Bendig, D.; Tübke, J. Energy consumption of current and future production of lithium-ion and post lithium-ion battery cells. Nat. Energy 2023, 8, 1284–1295. [Google Scholar] [CrossRef]
  37. Bosia, F.; Giaccari, P.; Botsis, J.; Facchini, M.; Limberger, H.G.; Salathé, R.P. Characterization of the response of fibre Bragg grating sensors subjected to a two-dimensional strain field. Smart Mater. Struct. 2003, 12, 925–934. [Google Scholar] [CrossRef]
  38. Zhu, S.; Yang, L.; Fan, J.; Wen, J.; Feng, X.; Zhou, P.; Xie, F.; Zhou, J.; Wang, Y.N. In-situ obtained internal strain and pressure of the cylindrical Li-ion battery cell with silicon-graphite negative electrodes. J. Energy Storage 2021, 42, 103049. [Google Scholar] [CrossRef]
  39. Baccouche, I.; Jemmali, S.; Manai, B.; Nikolian, A.; Omar, N.; Essoukri Ben Amara, N. Li-ion battery modeling and characterization: An experimental overview on NMC battery. Int. J. Energy Res. 2021, 46, 3843–3859. [Google Scholar] [CrossRef]
  40. EL Aouam, A.; Sabi, N.; Aziam, H.; Touag, O.; Dolotko, O.; Mansori, M.; Dsoke, S.; Dollé, M.; Saadoune, I. Development and understanding of the lithiation/de-lithiation mechanism of a low cobalt and nickel-rich cathode material for lithium-ion batteries. J. Power Sources 2024, 606, 234551. [Google Scholar] [CrossRef]
  41. Li, W.; Xia, Y.; Zhu, J.; Luo, H. State-of-Charge Dependence of Mechanical Response of Lithium-Ion Batteries: A Result of Internal Stress. J. Electrochem. Soc. 2018, 165, A1537–A1546. [Google Scholar] [CrossRef]
  42. Qi, Y.; Guo, H.; Hector, L.G.; Timmons, A. Threefold Increase in the Young’s Modulus of Graphite Negative Electrode during Lithium Intercalation. J. Electrochem. Soc. 2010, 157, A558. [Google Scholar] [CrossRef]
  43. Schweidler, S.; de Biasi, L.; Schiele, A.; Hartmann, P.; Brezesinski, T.; Janek, J. Volume Changes of Graphite Anodes Revisited: A Combined Operando X-ray Diffraction and In Situ Pressure Analysis Study. J. Phys. Chem. C 2018, 122, 8829–8835. [Google Scholar] [CrossRef]
  44. Ovejas, V.; Cuadras, A. State of charge dependency of the overvoltage generated in commercial Li-ion cells. J. Power Sources 2019, 418, 176–185. [Google Scholar] [CrossRef]
  45. Bhattacharya, D.; Reese, C.W.; Bobel, A.; Kim, Y.; Toner, J.; Sayed, S.Y.; Sachdev, A.K. Mechanical performance of lithium metal anodes manufactured using two-dimensional and three-dimensional current collectors. J. Mater. Res. 2025. [Google Scholar] [CrossRef]
  46. Wang, L.; Yin, S.; Zhang, C.; Huan, Y.; Xu, J. Mechanical characterization and modeling for anodes and cathodes in lithium-ion batteries. J. Power Sources 2018, 392, 265–273. [Google Scholar] [CrossRef]
  47. Dubarry, M.; Beck, D. Analysis of Synthetic Voltage vs. Capacity Datasets for Big Data Li-ion Diagnosis and Prognosis. Energies 2021, 14, 2371. [Google Scholar] [CrossRef]
  48. Lee, S.; Siegel, J.B.; Stefanopoulou, A.G.; Lee, J.W.; Lee, T.K. Electrode State of Health Estimation for Lithium Ion Batteries Considering Half-cell Potential Change Due to Aging. J. Electrochem. Soc. 2020, 167, 090531. [Google Scholar] [CrossRef]
  49. Bloom, I.; Walker, L.K.; Basco, J.K.; Abraham, D.P.; Christophersen, J.P.; Ho, C.D. Differential voltage analyses of high-power lithium-ion cells. 4. Cells containing NMC. J. Power Sources 2010, 195, 877–882. [Google Scholar] [CrossRef]
  50. Guo, J.; Li, Y.; Meng, J.; Pedersen, K.; Gurevich, L.; Stroe, D.I. Understanding the mechanism of capacity increase during early cycling of commercial NMC/graphite lithium-ion batteries. J. Energy Chem. 2022, 74, 34–44. [Google Scholar] [CrossRef]
  51. Simolka, M.; Heger, J.F.; Traub, N.; Kaess, H.; Friedrich, K.A. Influence of Cycling Profile, Depth of Discharge and Temperature on Commercial LFP/C Cell Ageing: Cell Level Analysis with ICA, DVA and OCV Measurements. J. Electrochem. Soc. 2020, 167, 110502. [Google Scholar] [CrossRef]
  52. Deshpande, R.D.; Ridgway, P.; Fu, Y.; Zhang, W.; Cai, J.; Battaglia, V. The Limited Effect of VC in Graphite/NMC Cells. J. Electrochem. Soc. 2014, 162, A330–A338. [Google Scholar] [CrossRef]
  53. Bensaad, Y.; Friedrichs, F.; Sieg, J.; Bähr, J.; Fill, A.; Birke, K.P. Multidimensional estimation of inhomogeneous lithium-ion cell aging via modal differential voltage analysis. J. Energy Storage 2023, 63, 107108. [Google Scholar] [CrossRef]
  54. Tao, R.; Zhu, J.; Zhang, Y.; Song, W.L.; Chen, H.; Fang, D. Quantifying the 2D anisotropic displacement and strain fields in graphite-based electrode via in situ scanning electron microscopy and digital image correlation. Extrem. Mech. Lett. 2020, 35, 100635. [Google Scholar] [CrossRef]
  55. An, S.J.; Li, J.; Daniel, C.; Mohanty, D.; Nagpure, S.; Wood, D.L. The state of understanding of the lithium-ion-battery graphite solid electrolyte interphase (SEI) and its relationship to formation cycling. Carbon 2016, 105, 52–76. [Google Scholar] [CrossRef]
  56. Keil, P.; Schuster, S.F.; Wilhelm, J.; Travi, J.; Hauser, A.; Karl, R.C.; Jossen, A. Calendar Aging of Lithium-Ion Batteries: I. Impact of the Graphite Anode on Capacity Fade. J. Electrochem. Soc. 2016, 163, A1872–A1880. [Google Scholar] [CrossRef]
  57. Sommer, L.W.; Raghavan, A.; Kiesel, P.; Saha, B.; Schwartz, J.; Lochbaum, A.; Ganguli, A.; Bae, C.J.; Alamgir, M. Monitoring of Intercalation Stages in Lithium-Ion Cells over Charge-Discharge Cycles with Fiber Optic Sensors. J. Electrochem. Soc. 2015, 162, A2664–A2669. [Google Scholar] [CrossRef]
  58. Smith, A.J.; Smith, S.R.; Byrne, T.; Burns, J.C.; Dahn, J.R. Synergies in Blended LiMn2O4and Li[Ni1/3Mn1/3Co1/3]O2 Positive Electrodes. J. Electrochem. Soc. 2012, 159, A1696–A1701. [Google Scholar] [CrossRef]
  59. Dubarry, M.; Anseán, D. Best practices for incremental capacity analysis. Front. Energy Res. 2022, 10, 1023555. [Google Scholar] [CrossRef]
  60. Li, X.; Wang, Z.; Zhang, L.; Zou, C.; Dorrell, D.D. State-of-health estimation for Li-ion batteries by combing the incremental capacity analysis method with grey relational analysis. J. Power Sources 2019, 410–411, 106–114. [Google Scholar] [CrossRef]
  61. Huang, M. Incremental Capacity Analysis-Based Impact Study of Diverse Usage Patterns on Lithium-Ion Battery Aging in Electrified Vehicles. Batteries 2019, 5, 59. [Google Scholar] [CrossRef]
  62. Feng, X.; Merla, Y.; Weng, C.; Ouyang, M.; He, X.; Liaw, B.Y.; Santhanagopalan, S.; Li, X.; Liu, P.; Lu, L.; et al. A reliable approach of differentiating discrete sampled-data for battery diagnosis. eTransportation 2020, 3, 100051. [Google Scholar] [CrossRef]
  63. Plattard, T.; Barnel, N.; Assaud, L.; Franger, S.; Duffault, J.M. Combining a Fatigue Model and an Incremental Capacity Analysis on a Commercial NMC/Graphite Cell under Constant Current Cycling with and without Calendar Aging. Batteries 2019, 5, 36. [Google Scholar] [CrossRef]
  64. Li, Y.; Abdel-Monem, M.; Gopalakrishnan, R.; Berecibar, M.; Nanini-Maury, E.; Omar, N.; van den Bossche, P.; Van Mierlo, J. A quick on-line state of health estimation method for Li-ion battery with incremental capacity curves processed by Gaussian filter. J. Power Sources 2018, 373, 40–53. [Google Scholar] [CrossRef]
  65. Dubarry, M.; Truchot, C.; Cugnet, M.; Liaw, B.Y.; Gering, K.; Sazhin, S.; Jamison, D.; Michelbacher, C. Evaluation of commercial lithium-ion cells based on composite positive electrode for plug-in hybrid electric vehicle applications. Part I: Initial characterizations. J. Power Sources 2011, 196, 10328–10335. [Google Scholar] [CrossRef]
  66. Riviere, E.; Venet, P.; Sari, A.; Meniere, F.; Bultel, Y. LiFePO4 Battery State of Health Online Estimation Using Electric Vehicle Embedded Incremental Capacity Analysis. In Proceedings of the 2015 IEEE Vehicle Power and Propulsion Conference (VPPC), Montreal, QC, Canada, 19–22 October 2015. [Google Scholar] [CrossRef]
  67. Han, X.; Feng, X.; Ouyang, M.; Lu, L.; Li, J.; Zheng, Y.; Li, Z. A Comparative Study of Charging Voltage Curve Analysis and State of Health Estimation of Lithium-ion Batteries in Electric Vehicle. Automot. Innov. 2019, 2, 263–275. [Google Scholar] [CrossRef]
  68. Spitthoff, L.; Vie, P.J.; Wahl, M.S.; Wind, J.; Burheim, O.S. Incremental capacity analysis (dQ/dV) as a tool for analysing the effect of ambient temperature and mechanical clamping on degradation. J. Electroanal. Chem. 2023, 944, 117627. [Google Scholar] [CrossRef]
  69. Fly, A.; Chen, R. Rate dependency of incremental capacity analysis (dQ/dV) as a diagnostic tool for lithium-ion batteries. J. Energy Storage 2020, 29, 101329. [Google Scholar] [CrossRef]
  70. Schiffer, Z.J.; Cannarella, J.; Arnold, C.B. Strain Derivatives for Practical Charge Rate Characterization of Lithium Ion Electrodes. J. Electrochem. Soc. 2015, 163, A427–A433. [Google Scholar] [CrossRef]
  71. Tavassol, H.; Jones, E.M.C.; Sottos, N.R.; Gewirth, A.A. Electrochemical stiffness in lithium-ion batteries. Nat. Mater. 2016, 15, 1182–1187. [Google Scholar] [CrossRef]
  72. Lewerenz, M.; Dechent, P.; Sauer, D.U. Investigation of capacity recovery during rest period at different states-of-charge after cycle life test for prismatic Li(Ni1/3Mn1/3Co1/3)O2-graphite cells. J. Energy Storage 2019, 21, 680–690. [Google Scholar] [CrossRef]
Figure 1. The image illustrates the integration of the optical fiber in the DUT. (a) depicts the theoretical internal path along with corresponding measurement points. (b) shows the actual internal route taken with the individual FBG sensors illuminated using a light source in the visible spectrum.
Batteries 11 00218 g001
Figure 2. Setup of the experiment: (a) Schematic overview of the experimental setup inside the climate chamber. (b) Picture of the cycler on the left side and the climate chamber with the DAQ system on top of it. To the left of the climate chamber, the cycler system can be seen.
Batteries 11 00218 g002
Figure 3. The strain measured by the internal sensor over the first full check-up cycle in both measurement axes (a,c). Parts (b,d) of the figure show the changes in strain after 237 load cycles during a final check-up.
Batteries 11 00218 g003
Figure 4. Differential analysis of check-up cycles for (a) the wavelength shift in the X-direction, (b) the voltage, and (c) the wavelength shift in the Y-direction over the normalized discharge capacity.
Batteries 11 00218 g004
Figure 5. Showing (a) the ICA during charging and (d) during discharge cycles. With (b,e) showing the corresponding IWA in the X-direction during charge and discharge cycles. (c,f) represent the IWA in the Y-direction. The cycles shown are check-up cycles using C/20 constant current.
Batteries 11 00218 g005
Figure 6. The change in voltage for several peaks and valleys of the DWA for (a) discharging and (b) charging in relation to the loss of capacity. The colors black and red correspond to changes in the sensor for the Y-axis, and blue and green correspond to changes in the X-axis.
Batteries 11 00218 g006
Figure 7. Incremental capacity and wavelength analysis of the discharge during cyclical aging with C/2. (a) shows the initial 10 load cycles in steps of two. (b) displays the second set of 30 load cycles in steps of five cycles. (c) shows the fifth set and (d) the seventh set of 30 cycles.
Batteries 11 00218 g007
Disclaimer/Publisher’s Note: The statements, opinions and data contained in all publications are solely those of the individual author(s) and contributor(s) and not of MDPI and/or the editor(s). MDPI and/or the editor(s) disclaim responsibility for any injury to people or property resulting from any ideas, methods, instructions or products referred to in the content.

