Article

Multi-Level Thermal Modeling and Management of Battery Energy Storage Systems

1
Beijing HyperStrong Technology Co., Ltd., Building 2C, No. 9 Fenghao East Road, Haidian District, Beijing 100094, China
2
School of Vehicle and Mobility, Tsinghua University, Beijing 100084, China
3
School of Material Science and Engineering, Beijing Institute of Technology, Beijing 100081, China
*
Author to whom correspondence should be addressed.
Batteries 2025, 11(6), 219; https://doi.org/10.3390/batteries11060219
Submission received: 31 March 2025 / Revised: 14 May 2025 / Accepted: 26 May 2025 / Published: 2 June 2025

Abstract

With the accelerating global transition toward sustainable energy, the role of battery energy storage systems (ESSs) becomes increasingly prominent. This study employs the isothermal battery calorimetry (IBC) measurement method and computational fluid dynamics (CFD) simulation to develop a multi-domain thermal modeling framework for battery systems, spanning from individual cells to modules, clusters, and ultimately the container level. Experimental validation confirms the model’s accuracy, with the simulated maximum cell temperature of 36.2 °C showing only a 1.8 °C deviation from the measured value of 34.4 °C under real-world operating conditions. Furthermore, by integrating on-site calibrated thermodynamic parameters of the container, a battery system energy efficiency model is established. Combined with the battery aging engineering model, a coupled lifetime–energy efficiency model is constructed. Six different control strategies are simulated and analyzed to quantify the system’s comprehensive lifecycle benefits. The results demonstrate that the optimized control strategy enhances the overall energy storage station revenue by 2.63%, yielding an additional cumulative profit of CNY 13.676 million over the entire lifecycle. This research provides an effective simulation framework and decision-making basis for the thermal management optimization and economic evaluation of battery ESSs.

1. Introduction

With the unsustainable depletion of non-renewable fossil fuels including petroleum and natural gas, environmental degradation has reached alarming levels globally. Therefore, an international transition to renewable and clean energy systems is critically needed to displace fossil fuel consumption and mitigate its environmental impacts [1]. The deployment of renewable energy technologies, particularly wind and solar power, offers a dual solution, namely, mitigating global energy security concerns while significantly reducing anthropogenic environmental degradation. However, wind power and solar power generation are characterized by intermittency and uncertainty [2]. High-penetration renewable energy grid connections adversely affect power system dynamics, notably diminishing system inertia and increasing frequency regulation challenges due to power imbalance. Therefore, intermediate energy storage solutions are essential for power quality correction, enabling the conversion of stochastic renewable generation into reliable, grid-synchronized output.
At present, energy storage technology, as a key technology to ensure the stable utilization of renewable energy, provides an effective solution to the scalability challenges of emerging and renewable energy solutions [3]. Among many energy storage technologies, battery ESSs have been widely used due to their advantages such as fast response speed and flexible installation [4,5]. Among them, lithium-ion batteries (LIBs) have the advantages of high energy density, fast response speed, low self-discharge rate, long life, etc., and have broad application prospects in energy storage [6]. However, LIBs will generate heat during operation, and poor heat dissipation causes the progressive temperature to increase in battery cells, adversely affecting electrochemical performance, cycle life, and safety parameters. This thermal accumulation may culminate in catastrophic failure modes, including thermal runaway propagation, presenting critical safety concerns for ESSs [7,8]. It is worth noting that large-scale ESS typically integrate hundreds of thousands of batteries through the series parallel structure, and contain a series of complex control systems, thermal management systems, etc. The construction of an accurate system model can help to quantitatively evaluate the related performance of the ESS, so as to formulate an accurate control strategy, which is of great significance for improving the system-wide performance and economy of the ESS.
In recent years, the innovative demands for advanced battery thermal management systems (BTMSs) have grown increasingly urgent, with research hotspots concentrating on three pivotal aspects: cutting-edge cooling technologies, breakthroughs in material architecture, and substantial improvements in system reliability. Qi et al. [9] proposed a multi-group U-shaped continuous bending design, which enhances the turbulence and coverage uniformity of the coolant through branch diversion and return paths, thereby improving heat dissipation efficiency and battery temperature uniformity, effectively addressing the issue of localized hot spots. Wang et al. [10] investigated the impacts of serial, parallel, and fractal tree-like microchannels on battery heat dissipation efficiency through numerical simulations. The fractal tree-like microchannels demonstrated optimal performance in terms of heat dissipation, uniformity and energy efficiency ratio, providing an innovative thermal regulation strategy for LIBs. However, the challenges associated with their fabrication difficulty and maintenance complexity require further consideration and trade-offs. The research team led by Morteza [11,12] developed a novel BTMS utilizing supercritical carbon dioxide as the cooling medium and analyzed its performance. The study revealed that, compared to traditional cooling media, supercritical carbon dioxide significantly enhances the heat transfer coefficient, thereby improving cooling performance while reducing pressure loss. Hussain et al. [13] developed a composite phase change material (PCM) by infiltrating paraffin into nickel foam (porosity > 90%) through chemical vapor deposition (CVD) with subsequent graphene coating. The experimental results demonstrate that the composite PCM exhibited a thermal conductivity 23 times higher than that of pure paraffin. Although a 30% decrease in specific heat capacity was measured relative to pure paraffin under identical test conditions, the enhanced thermal transport properties effectively compensated for the diminished heat storage capacity, achieving a 17% reduction in battery surface temperature rise under 1.7 A discharge conditions.
Numerous studies have conducted extensive simulation and prediction work by establishing electrochemical models, thermal models, and electrochemical–thermal coupling models [14,15,16,17], thereby further enhancing the reliability of the system. Among these studies, Chen et al. [18] theoretically demonstrated that the average current value is a critical parameter affecting battery aging rates and enhancing system safety. The authors developed a coordinated State-of-Health (SOH) and State-of-Charge (SOC) balancing control strategy for multi-unit battery energy storage systems, explicitly incorporating battery degradation characteristics. Simulations verified that this strategy could improve the synchronization balancing degree of SOH and SOC between energy storage units to 92.5%, while extending the system capacity retention rate by 18.7%. Zhao et al. [19] investigated the degradation mechanisms and thermal behavior of commercial-scale LiFePO4 (LFP) battery systems through experimental and simulation approaches. Experimental data demonstrated a significant increase in irreversible heat generation post-aging, while reversible heat contribution remained largely unaffected by degradation processes. Furthermore, the simulation results indicate that battery pack degradation substantially diminishes the thermal management efficiency of BTMSs originally optimized for fresh battery configurations. Zhou et al. [20] developed an electrochemical–mechanical–thermal coupled aging model to investigate capacity fading in LIBs. The results demonstrate that increasing charge/discharge rates exacerbates all forms of degradation losses. Subsequently, they conducted the optimization and analysis of charging/discharging processes to achieve better anti-aging performance and safety characteristics. Bernardi et al. [15] proposed a comprehensive energy balance framework as a thermal model for battery systems. The computational model accurately quantified critical thermal parameters, precisely tracking both spatial temperature distribution and temporal heat generation dynamics within the battery cell. The model was formulated based on two fundamental assumptions: (1) uniform temperature distribution across the cell, and (2) the incorporation of transient thermal effects arising from electrochemical heat generation, environmental heat exchange, and temperature-dependent heat capacity variations. However, in terms of system modeling and control strategy optimization, existing studies mostly focus on cell life [21,22], system cost, complex electricity spot market, etc. [23,24], while the research on ESS performance indicators and their deep coupling relationship is relatively insufficient, and requires the systematic modeling of efficiency and life, and a corresponding optimized control algorithm.
This study primarily investigates thermal management and control optimization in battery ESSs, with emphasis on advanced control strategies to enhance system lifetime, operational efficiency, and reliability. By holistically analyzing the coupling effects among these three critical performance metrics, we develop a multi-physics ESS model centered on thermal dynamics and conduct systematic research on optimization control methodologies. Firstly, a thermophysical model covering cell, battery module, battery cluster and container was constructed to quantitatively capture the thermophysical response of the system under different working conditions. Secondly, combined with the battery aging engineering model, the lifecycle aging–efficiency coupling model was established to quantify the impacts of different thermal management strategies on the comprehensive benefit of the whole life cycle of the system. Based on the Shandong Jinan Huangtai Energy Storage Power Station, the efficacy of the proposed modeling framework and control strategy was rigorously validated. The results show that the maximum cell temperature obtained by the model simulation under actual working conditions was 36.2 °C, and the error was 1.8 °C compared with the measured value of 34.4 °C. Moreover, by optimizing the thermal management strategy, the comprehensive benefit of the energy storage station was increased by 2.63%, and the life cycle benefit was increased by CNY 13.676 million.

2. Experiments and Model

2.1. Construction of the Cell Thermal Model

The thermal model of the battery cell was developed based on heat generation data acquired through IBC. The basic parameters of prismatic LFP energy storage batteries are detailed in Table 1, which correspond to those published in the manufacturer’s product specification sheets. Prior to testing, the cell underwent preconditioning via a 0.5 P (constant power charge/discharge, 448 W) discharge to 2.5 V. The experimental setup comprised a Yangyi BIC-400A battery (Hangzhou Young Instrument Technology Co., Ltd., Hangzhou, China) isothermal calorimeter integrated with a Xinwei CT-4004-5V300A-NFA charge–discharge system (Shenzhen Neware Electronics Co., Ltd., Shenzhen, China).
Stepped heat generation power data within the conventional thermal management temperature range (15–40 °C) were obtained via IBC measurements, enabling the establishment of a correlated thermal model.

2.2. Construction of Battery Module and Battery Clusters Thermal Model

Building upon the established thermal model of battery cells, thermal models were further developed for a 1P20S battery module and an energy storage battery cluster comprising seven battery modules. A three-dimensional transient CFD numerical model was constructed based on a real-time operational data acquisition system. High-fidelity numerical simulations were employed to perform multiphysics-coupled analysis of the thermal dynamic characteristics within the energy storage unit. This approach thereby enabled the multidimensional regulation of the internal thermal environment in containerized ESS.

2.2.1. Construction of System Thermal Load

The thermodynamic load of the system primarily comprises four thermodynamic processes, as follows: (1) heat generation in electrochemical energy storage units; (2) dynamic heat transfer through the envelope structure; (3) forced convective heat exchange in air conditioning systems; (4) thermal dissipation from auxiliary electrical equipment. Among these, the heat generation properties of battery modules are quantitatively characterized using the multi-scale heat generation model for battery cells established in Section 3.1 of the following text. For the heat transfer process of the envelope structure, an engineering thermodynamics calculation method based on steady-state heat transfer theory was adopted. By constructing a thermal resistance network model of the envelope structure and integrating field-measured indoor–outdoor temperature gradient data with building thermal parameters, the environmental heat infiltration was accurately calculated. The mathematical model can be formulated as
P = K F t 1 t 2 d
where Penv is cooling/heating load induced by heat transfer through the envelope structure, α is the temperature difference correction factor for the envelope structure (since the thermal conductivity of the insulation material used is 1.6, take as 1.6), F is the heat transfer area of the envelope structure (approximately 134 m2 for the compartment–exterior interface), t1 and t2 correspondingly represents outdoor and indoor design temperature, and d is the thickness of the envelope structure. According to the climatic conditions of the project site, air conditioning is mainly used for cooling in summer, and the dry bulb temperature calculated for summer air conditioning is 34.8 °C. The cooling load introduced into the room through the maintenance structure is 2530 W.

2.2.2. Construction of Cluster-Level Simulation Model

This study employed a CFD model based on the Finite Volume Method (FVM) to conduct a multiphysics-coupled simulation analysis of thermal management strategies for ESS. The numerical simulations were performed on the ANSYS Fluent 2022R1 platform using a pressure-based solver to resolve the Navier–Stokes equations. The governing equations are as follows (Equations (2)–(4)).
Continuity equation [25]:
ρ t + × ρ u = 0
Momentum conservation equation [26]:
ρ u t + × ρ uu = p + × u eff u + S momentu
Energy conservation equation [27]:
ρ C p T t + × ρ C p ut = × k eff T + S energy
Symbol definitions:
  • ρ—Fluid density;
  • u—Velocity vector;
  • p—Static pressure;
  • ueff—Effective dynamic viscosity;
  • Cp—Specific heat capacity;
  • T—Temperature;
  • keff—Effective thermal conductivity;
  • Smomentum—Momentum source term;
  • Senergy—Energy source term.
The Shear Stress Transport (SST k-ω) turbulence model was adopted, which combines the robustness of the k-ε model in high-Reynolds-number regions with the accuracy of the k-ω model near wall boundaries, making it suitable for simulating complex flow and heat transfer phenomena. The turbulent viscosity (μt) is calculated via Equation (5) [28],
μ t = ρ a 1 k max ( a 1 ω , Ω F 2 )
where k is turbulent kinetic energy, ω is specific dissipation rate, Ω is vorticity magnitude and F2 is blending function.
An adaptive hybrid meshing technique with a polyhedral-structured core and graded prism layers for the viscous boundary layer capture was implemented to balance computational accuracy and efficiency. The total mesh count reached 1.8 × 10⁷, with near-wall y+ values controlled within 1–5 to satisfy wall function requirements. Grid independence verification demonstrated that increasing the mesh count to 2.5 × 10⁷ resulted in less than 1% variation in critical parameters (e.g., temperature and velocity fields), confirming the adequacy of the current mesh resolution.

2.3. Construction of Container Thermal Model

The containerized thermal management system currently available on the market adopts a three-tier cooling architecture, comprising the following: (1) Air-conditioned cold air supply layer—The air conditioning system exchanges heat with the external environment to supply chilled air and a main air duct at the container roof distributes the chilled air to the top of each battery cabinet. (2) Main air duct distribution layer—Two axial fans installed in the cluster-level top ducts draw the chilled air into the battery cabinets. (3) Flow distribution across battery modules—The ingested cooling airflow is redistributed through a pressure-equalizing duct, attaining uniform vertical distribution to multi-tier battery insertion tray units.
The grid configuration, turbulence model, and computational boundaries of the numerical model are defined as follows:
(1)
Natural convection is used for convection heat transfer between the container wall and the external environment, considering heat radiation;
(2)
An anisotropic thermal conductivity model is implemented for battery cells to characterize direction-dependent heat transfer properties;
(3)
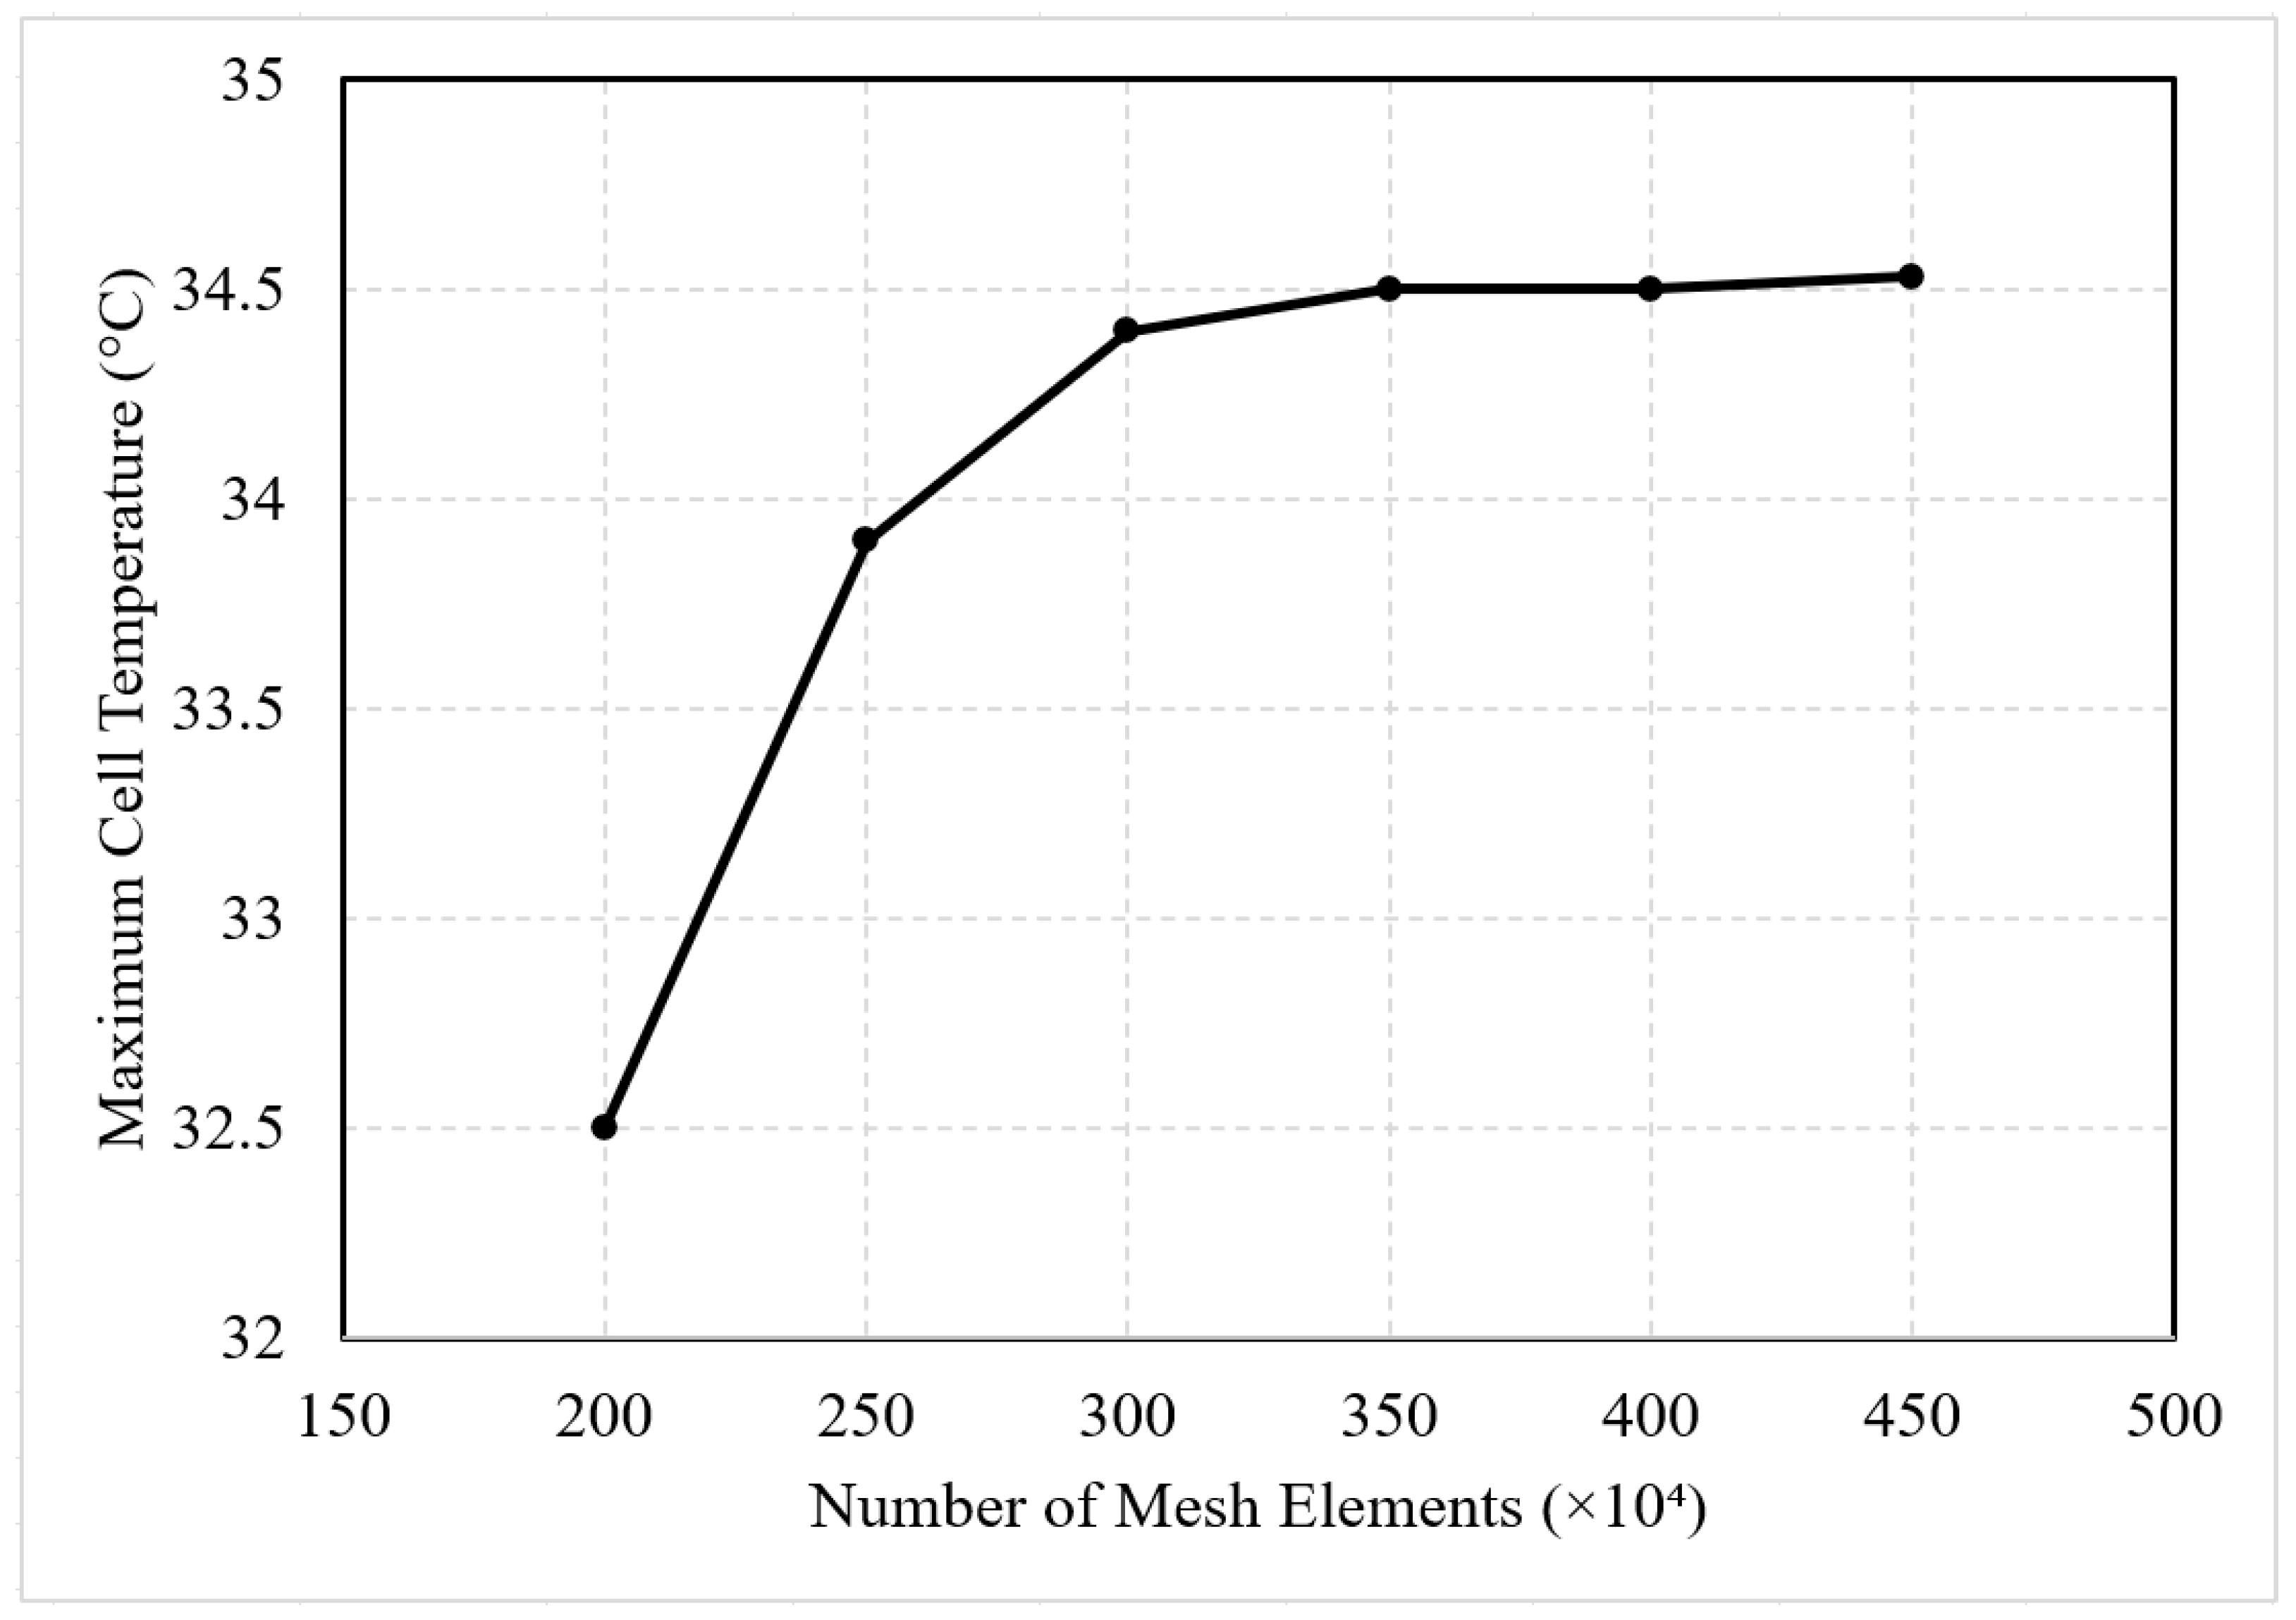
Polyhedral mesh combined with prismatic boundary layers is generated using fluent meshing for the container structure;
(4)
Variable grid sizing is applied across domains to resolve high-velocity gradients while minimizing total mesh count;
(5)
The SST k-ω turbulence model is adopted to precisely capture the viscous sublayer characteristics, thereby enabling the precise evaluation of system heat dissipation capacity.

3. Results and Discussion

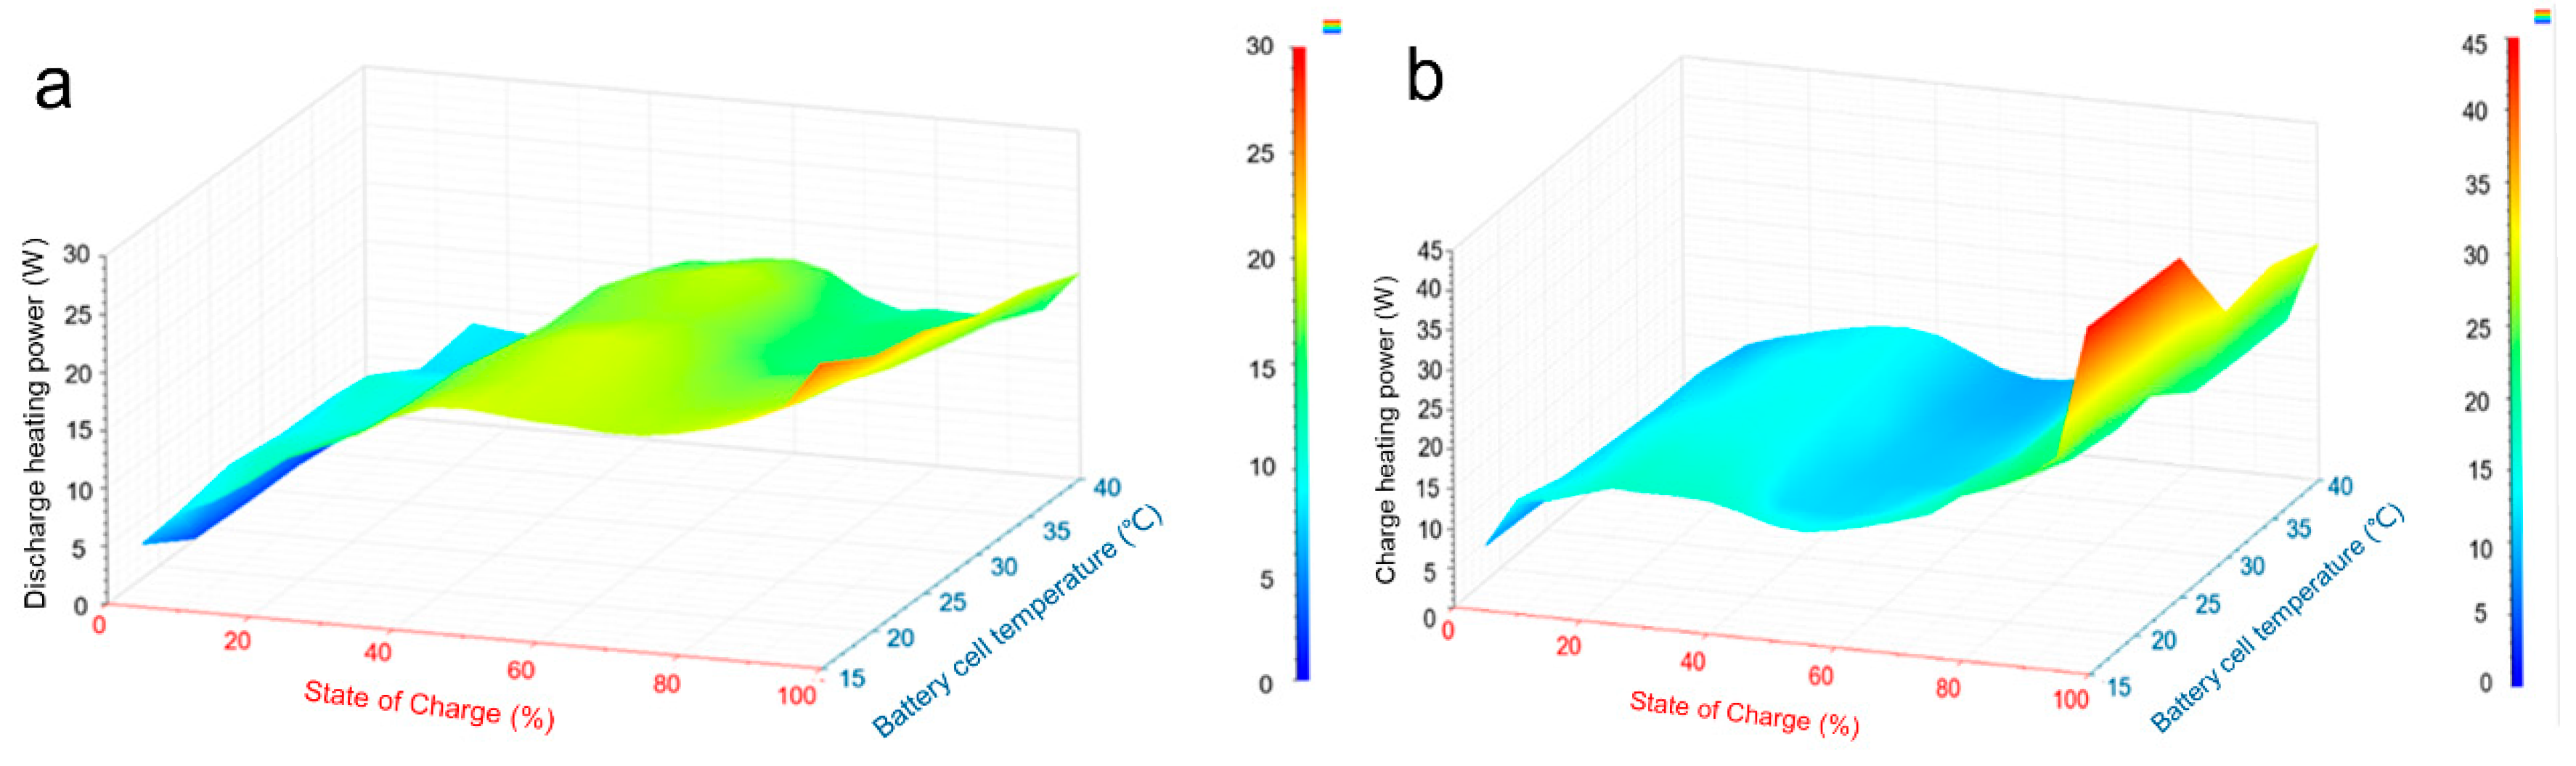
3.1. Heating Power Model of the Battery Cell

To precisely quantify the heat generation characteristics of individual battery cells for subsequent system-level thermal modeling, this investigation utilizes a high-accuracy isothermal calorimeter.
The test used a prismatic LFP energy-type cell (specifications in the table below). Cell dimensions 207.2 × 173.9 × 71.7 mm, nominal capacity 280 Ah, mass 5582.0 g. Prior to testing, the cell underwent pre-treatment with a 0.5 P (448 W) discharge to 2.5 V.
Experimental Equipment and Methodology
The test system consisted of a BIC-400A isothermal battery calorimeter paired with a CT-4004-5V300A-NFA charge/discharge device (Shenzhen Neware Electronics Co., Ltd., Shenzhen, China).
  • Constant-temperature chamber (±0.1 °C accuracy).
  • Multi-channel data acquisition system.
  • Heat flux density sensor array.
  • Vacuum insulation layer.
Test Procedure
(1)
Sample installation: Assemble the thermal equalization block, heating plate, and battery according to specifications to ensure optimal interfacial contact.
(2)
Thermal coupling: Fill interfacial gaps with thermal grease (thermal resistance < 0.05 K·m2/W, based on the product specifications).
(3)
Parameter setup: Configure test conditions based on the operational matrix in the table.
(4)
Data acquisition: Synchronously record temperature, voltage, current, and heat flux data (sampling frequency: 10 Hz).
Test Result
According to the IBC test, the stepped heating power data within the normal temperature control range of 15~40 °C of the cell were obtained, and the relevant models were established, as shown in Figure 1. According to the test of charging and discharging heating power of LIB under different temperature and SOC states, it was found that the battery’s thermal behavior showed significant dependence on both temperature and charge state. Under charging conditions, the heating power increased with the increase in SOC, the heating power at the charging end and the discharge end increased significantly, and the heating effect was aggravated by the low temperature environment. In the actual use process, temperature control and working condition should be adjusted according to the characteristics of the heating power of the cell, which provide key data support for the design of BTMS.

3.2. Simulation Results of Battery Module Cluster Model

For the battery module meshing, hexahedral elements were applied using the ANSYS FLUENT meshing module. Compared to tetrahedral meshes, hexahedral meshes offer higher accuracy with fewer elements. Additionally, localized hexahedral mesh refinement was implemented in critical areas such as the fan, outer surfaces of individual cells, and inner surfaces of the battery enclosure to ensure computational precision. As shown in Figure 2, a mesh independence study was performed to verify the numerical accuracy, evaluating six mesh configurations ranging from 2.0 to 4.5 million elements. The maximum battery temperature stabilized beyond 3.5 million elements. Therefore, a mesh size of 3.5 million elements was selected to balance computational accuracy and efficiency.
The operation characteristic of the fan was analyzed. As shown in Figure 3a, the fan maintained a stable operating point at 202 CFM (0.095 m3/s) with 70 Pa static pressure, while the system exhibited low flow resistance characteristics, which could better actualize the heat dissipation performance of the fan. In Figure 3b, we see that each cartridge achieved consistent cold airflow rates, averaging 1.88 m3/min (±7% variation), demonstrating excellent flow distribution uniformity across the system. The simulation analysis result of the battery cabinet is shown in Figure 3c. The cooling airflow was drawn into the cabinet by the fan and uniformly distributed to all cartridges through the guided deflection system. The temperature distribution across modules exhibited good uniformity, with spatial variations limited to 3 °C at comparable locations. The peak temperature within the battery cluster was 34.9 °C, which meets the thermal management requirements and reflects the consistency of the temperature field. The cooling design of the battery cabinet adopted the dual-path cooling mode at the bottom and side of the module. Figure 3d illustrates the flow field distribution across both the module cross-section and the inter-module gaps. The module cross-sectional flow profile demonstrated bottom cooling efficiency, while the gap section flow characteristics enabled a sidewall convective heat transfer performance.

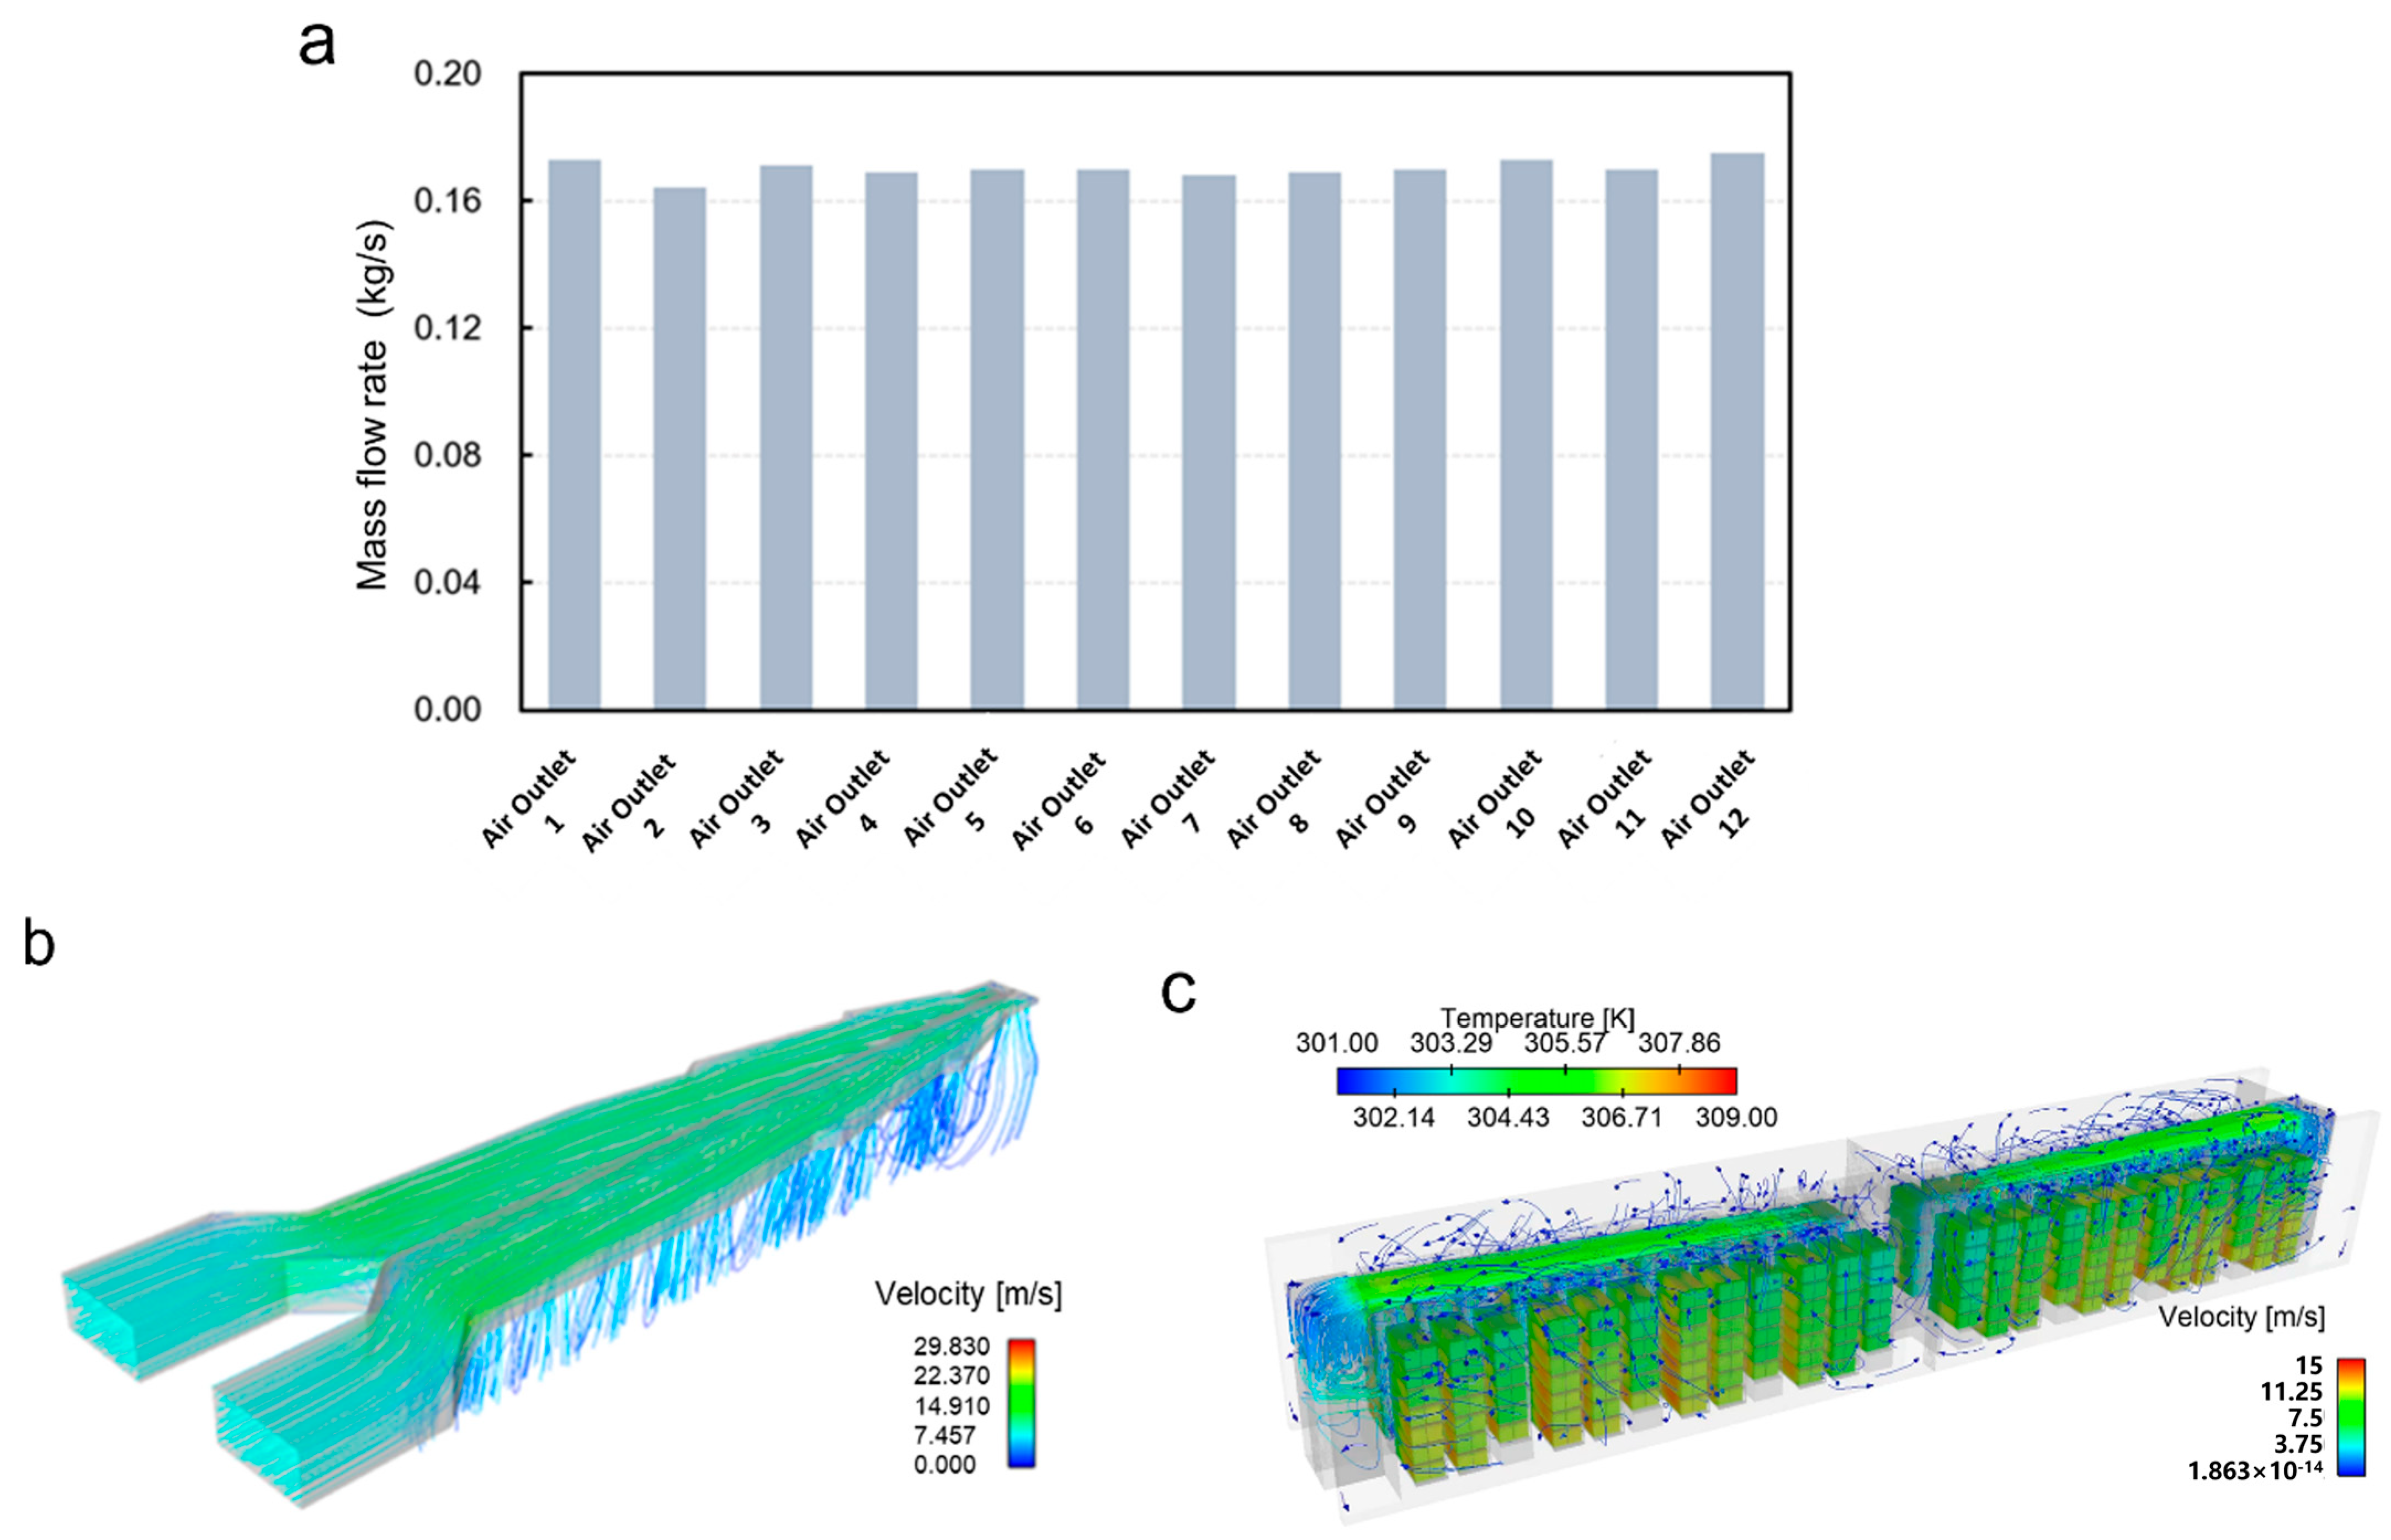
3.3. Simulation Results of Container Model

Fluent software was employed to perform CFD simulations of the air conditioning main duct design, with results validating the configuration’s engineering feasibility. Among them, the air volume of a single air duct was 5000 m3/h, and the simulation physical model was an SST-kw turbulence model. The simulated mass flow rate distribution across duct outlets is presented in Figure 4a. As could be seen from the simulation results, the minimum flow rate of each outlet in the air duct design scheme was 0.164 kg/s, the maximum flow rate was 0.175 kg/s, and the deviation between the maximum and minimum air volumes was 6.7%. The air duct design scheme met the thermal management design requirements, and the air duct flow line is shown in Figure 4b. The Fluent software was used to conduct CFD simulation analysis on the whole container. Four air conditioners were used for the cooling of the container. The air volume of each air conditioner was 5500 m3/h and the cooling capacity was 20 kW. Figure 4c presents the instantaneous cloud distribution at the conclusion of the transient simulation. Under the diversion of the top air duct, the flow distribution of each outlet of the air duct was relatively uniform, which could provide a uniform cooling capacity for each battery cabinet. The container temperature distribution was uniform. The thermal analysis yielded a peak temperature of 36.2 °C with a maximum differential of 3.6 °C across the system.

3.4. Model Accuracy Verification Under Actual Operating Conditions

To validate the thermal model’s accuracy, field operational data from the Huangtai 100 MW/200 MWh energy storage station (Jinan, China) were used for model verification under real-world operating conditions. Then, the model’s accuracy was validated through systematic comparison between experimental measurements and numerical simulations. Figure 5a–c shows the temperature distribution of battery cells, battery modules, and battery clusters in a container. Based on the actual operational data from this power station, the system demonstrates excellent thermal management performance, with battery cell temperatures consistently maintained below 35 °C and temperature differences between cells effectively controlled within 5 °C, fully meeting design specifications. Specifically, the highest temperature of the battery cell appeared under the full load operating condition, reaching 34.4 °C, while the lowest temperature was maintained at about 23.1 °C, and the overall temperature distribution showed good uniformity.
Comparing and analyzing the measured data with the simulation results, it could be found that the two had a high consistency (Figure 5d). Table 2 summarizes the basic statistical comparison between the measured and simulated values. The model predicted 36.2 °C maximum temperature (Tmax) versus the 34.4 °C that was measured (1.8 °C difference). For the minimum temperature (Tmax), the simulated maximum was 31.6 °C, compared to the measured value of 30.2 °C. Regarding temperature differential control (ΔT = Tmax − Tmin), the simulation predicted a maximum ΔT of 4.6 °C, whereas the actual measured maximum ΔT was 4.9 °C. A comparison of the simulated and tested mean temperatures reveals minor deviations in the maximum cell temperature, minimum cell temperature, and ΔT. Further analysis of the temperature distribution characteristics revealed that the simulation results and measured data exhibited consistent trends in temperature variation. During the system startup phase, the simulation model accurately predicted the thermal ramp rate. However, toward the end of the charge/discharge cycles, relatively larger deviations were observed between the simulated and measured maximum/minimum temperatures, with the simulation data being higher than the measured values. During the post-shutdown cooling phase, the simulated and measured temperature curves showed good agreement in their downward trends. Quantitative error analysis was conducted between simulation and experimental data for the battery system. The maximum absolute error and mean absolute error were calculated for the cell’s Tmax, Tmin, and ΔT, as shown in Table 3. The results demonstrate that the current simulation model achieves temperature prediction with an average error within 1 °C, accurately reflecting the actual operational characteristics of the system. Notably, the maximum absolute errors for both temperature extremes occurred at the end of charge/discharge cycles. Further analysis reveals that this discrepancy stems from the experimental temperature sensors being installed on the aluminum tabs welded to the cell terminals, where measurements were significantly affected by the cooling system’s air supply temperature. In contrast, the simulation calculates the cell’s bulk temperature, resulting in systematically higher simulated maximum temperatures compared to experimental measurements. The mean absolute error of the system primarily results from appropriate simplifications in the simulation model’s response mechanism to ambient temperature variations, which exhibited limited fidelity in capturing real-world operational complexities. Furthermore, the Huangtai energy storage station was grid-connected on 29 December 2021, but the experimental data were collected during operation on 5 August 2022. After prolonged operation, the measured temperature differences were slightly larger than simulated predictions. This discrepancy may be attributed to factors such as cell aging and cooling system efficiency degradation, which have not been sufficiently considered in the current simulation model.

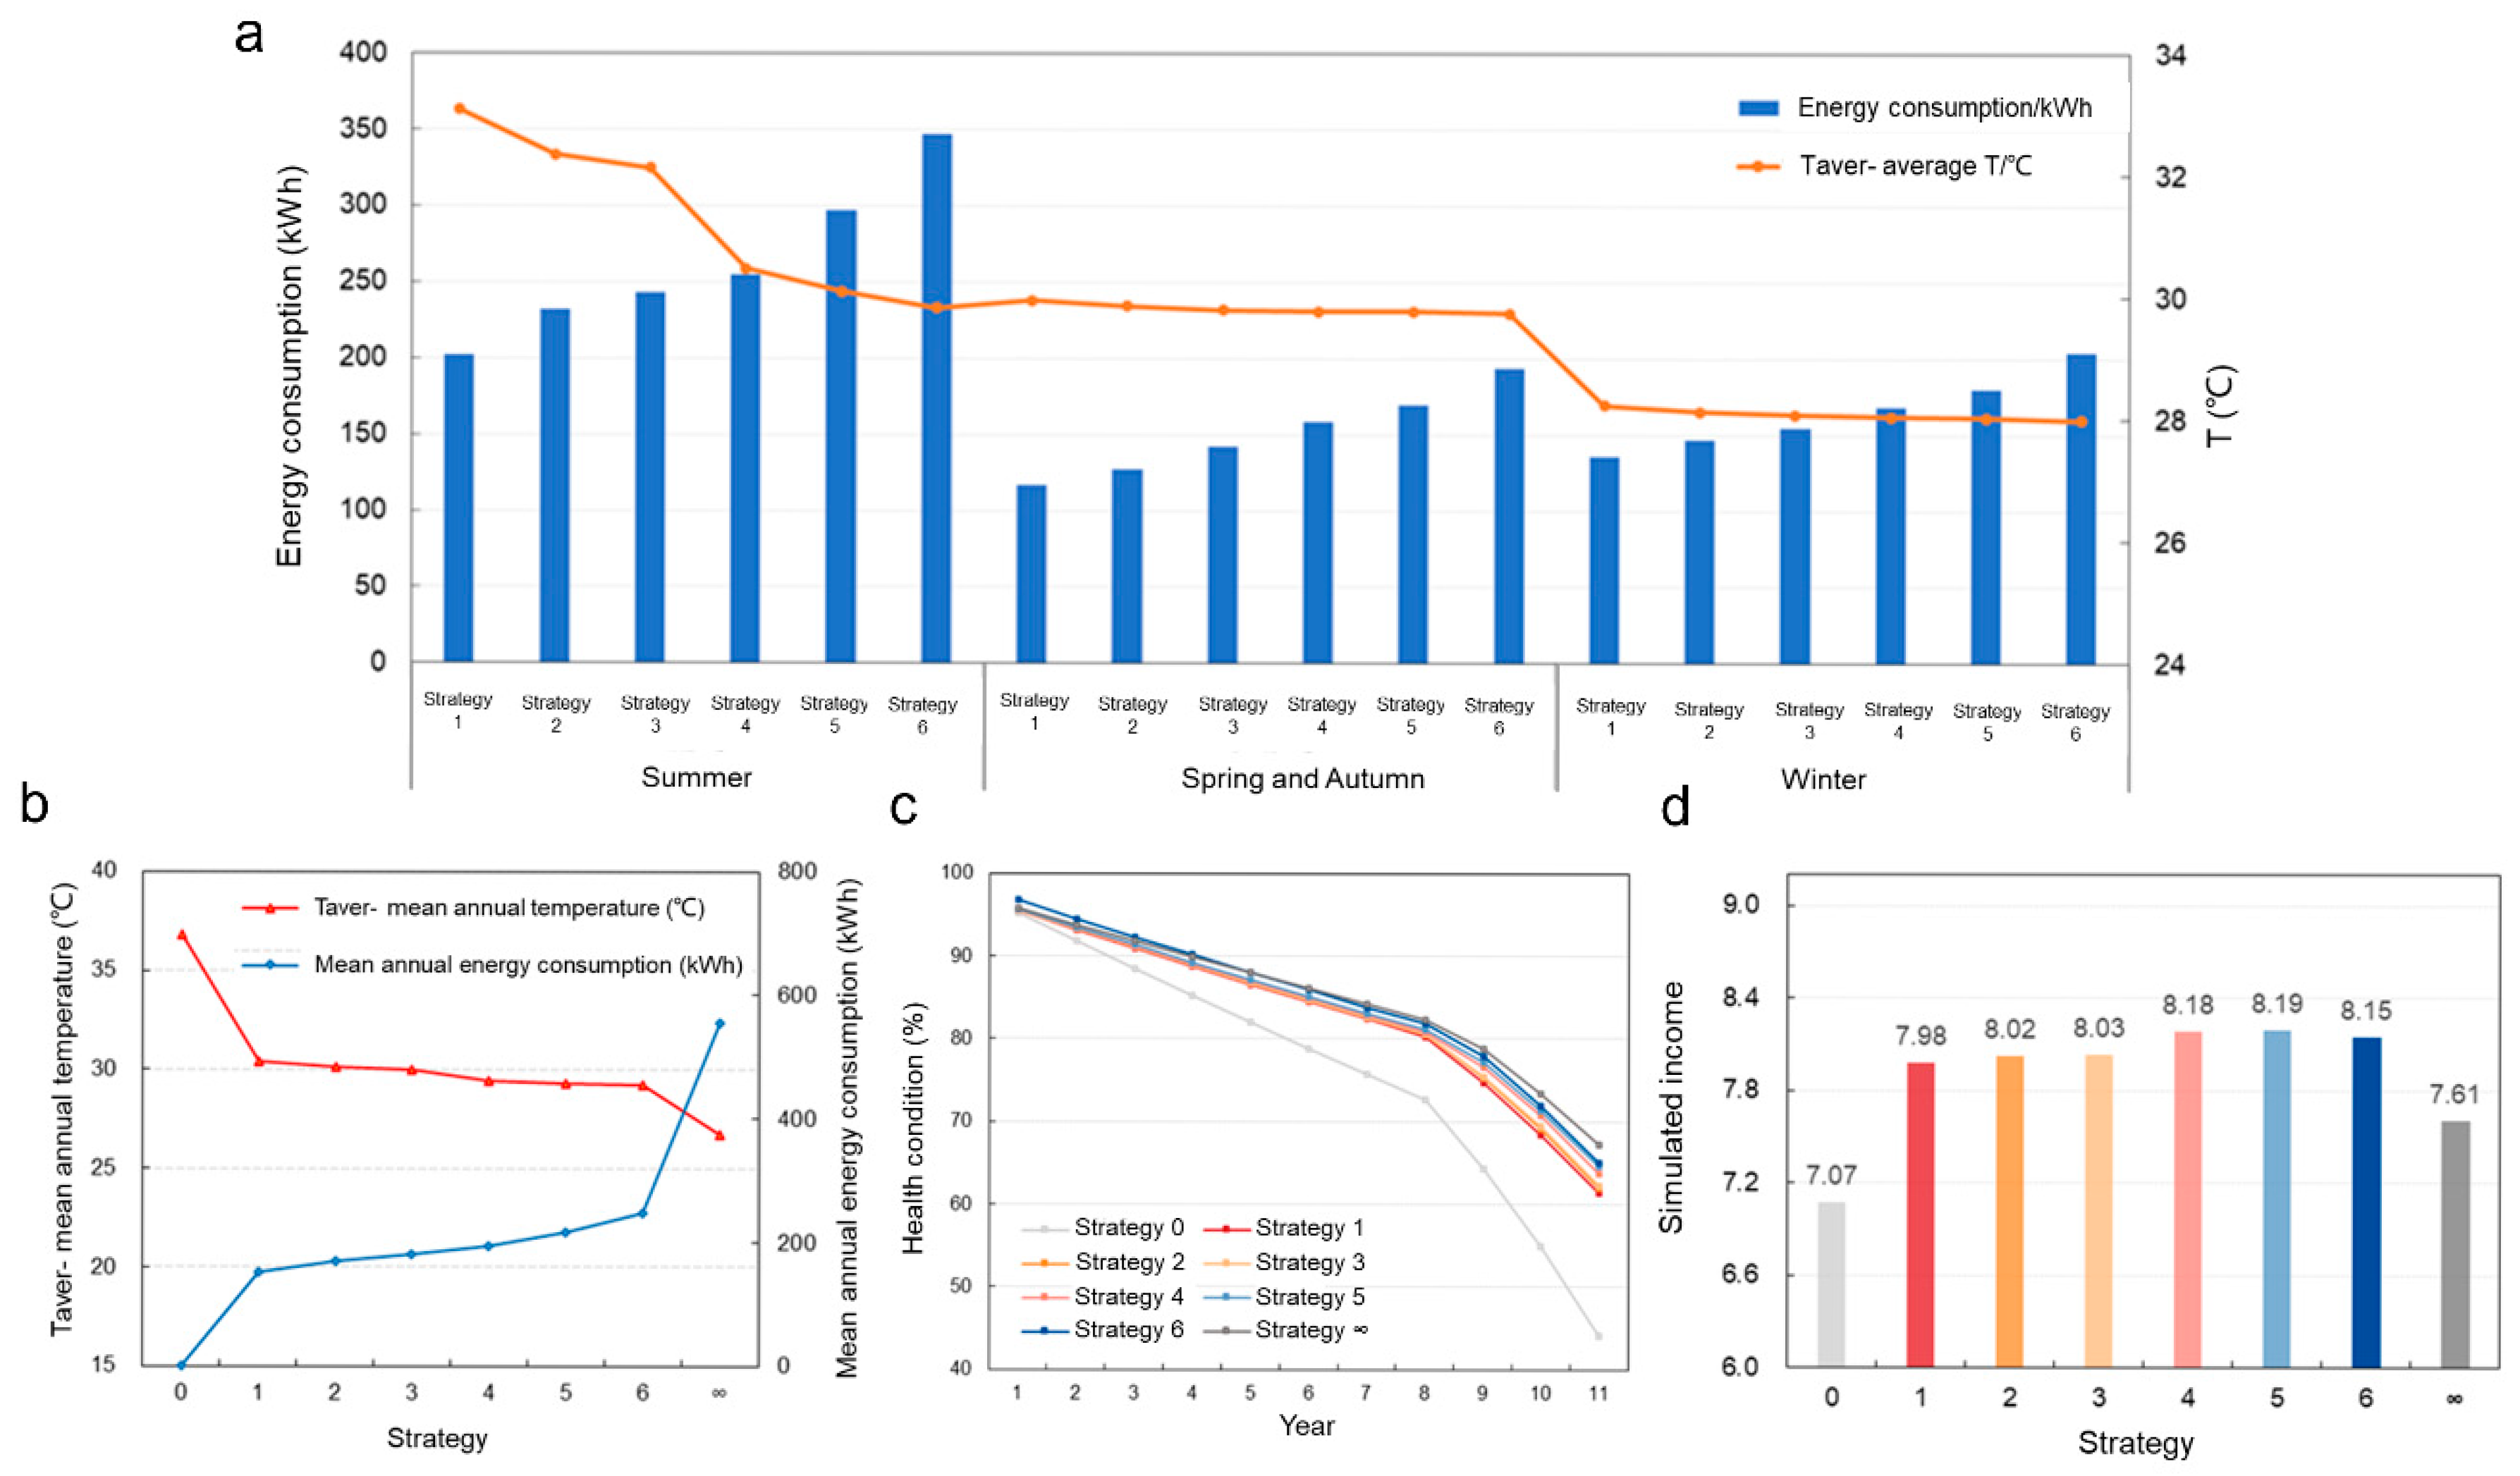
3.5. Optimization of System Control Strategy Based on Comprehensive System Benefit

Temperature control, rate control, DOD control, shelving state and time control are the key parameters of various control strategies used to extend the systematic benefits in ESSs. The objective is to optimize the total energy throughput during the whole life cycle of the system, so as to avoid the one-sided optimization of battery life or energy efficiency. Based on the above considerations, and focusing on the 100 MW/200 MWh energy storage project in Jinan, Shandong Province, we used the battery aging engineering model from a previous work [29], which describes the reduced-order models used for engineered system lifetime assessment. Further, a battery system thermal model was established in this study to further construct the life–energy efficiency coupling model, which was used to carry out the study on the life optimization of the system and thus determine the whole life cycle benefit. The two models are coupled via thermal characteristics, specifically ambient temperature distribution in space and variation in time.
Optimization algorithms such as gradient descent can be applied to solve the optimization problem upon the coupled model. The optimization problem is a typical convex optimization problem, as the thermal model and the aging model are both monotone and show contradictory trends with temperature. Therefore, the optimal strategy can be determined easily.
To comprehensively evaluate the impacts of different thermal management strategies on life span and system benefit, six different thermal management strategies were developed (Table 4). In terms of seasonal performance, under the high-temperature environment in summer, the low energy consumption strategy (e.g., strategy 1) saw a significant increase in temperature due to insufficient temperature control capability, while the high energy consumption strategy (e.g., strategy 6) was shown to maintain a low temperature, but its energy cost increased exponentially. Each thermal management strategy consists of two fundamental parameters, start temperature and end temperature, which define the triggering condition and exit condition of the air conditioner’s refrigeration process. Basically, the average operating temperature is the average of the parameters. For comparison, extreme strategies 0 (no temperature control) and ∞ (continuous temperature control) were set. The extreme strategy 0 and strategy ∞ reveal the boundary conditions of the system temperature and energy consumption, respectively: the former had zero energy consumption but the temperature was uncontrollable to 39 °C average operating temperature, and the latter maintained a 25 °C average operating temperature at the cost of very high energy consumption, which is apparently not economical. In practical applications, the thermal management strategy must be properly selected according to the system’s requirements for temperature stability and energy consumption limitations to achieve the best balance between performance and energy consumption. Further, the battery temperature simulated under different control strategies was put into the battery aging model, and the simulation results of battery aging under different strategies were obtained (Figure 6c). It is obvious that the battery corresponding to strategy 1 showed the fastest attenuation, which corresponded to the smallest system energy consumption and the highest energy efficiency of the station. Strategy 6 corresponded to the slowest battery decay, corresponding to the greatest system energy consumption and the lowest station energy efficiency.
We assume that the SOH corresponding to the system EOL is 70%. The benefit of the station is the integration of the comprehensive energy efficiency with system life, and a comparison of simulation returns under different strategies could be obtained (Figure 6d). Specifically, with the enhancement of temperature control capability, the simulation benefit of the system gradually increased, and it reached its highest value around strategy 5. After that, the total benefit decreased. There are two main reasons for the above optimization results, as follows: (1) The relationship between battery life and temperature is negative, as the more the temperature increases, the faster the battery life decreases. (2) The relationship between power consumption and average operating temperature is positive, as the more the temperature decreases, the more power consumption increases.

4. Conclusions

In summary, a thermal model of the system comprising the battery cell module and cluster, as well as the container, was built using the IBC measurement method and CFD simulation method, and the accuracy of the model was verified. The Tmax of the battery cell simulated by the model was 36.2 °C under actual working conditions, and the error was 1.8 °C compared with the measured value of 34.4 °C. Furthermore, the thermal model of the battery system was combined with the thermodynamic parameters of the container calibrated at the project site, and the energy efficiency model of the battery system was established. Based on the battery aging engineering model established, the life–energy efficiency coupling model was constructed, and the six control strategies selected were simulated and analyzed. The simulated benefits of the whole life cycles of the different systems were quantitatively calculated, and the optimal control strategy was obtained, which improved the comprehensive benefit of the energy storage station by 2.63% and increased the comprehensive benefit of the whole life cycle by CNY 13.676 million.

Author Contributions

Conceptualization, Z.L.; data curation, Z.L.; formal analysis, Z.S.; funding acquisition, J.Z.; investigation, Z.S.; methodology, Z.L.; project administration, J.Z.; resources, J.Z.; software, Z.S.; supervision, Q.L.; validation, L.W.; visualization, Z.S.; writing—original draft, Z.L.; writing—review and editing, J.Z. All authors have read and agreed to the published version of the manuscript.

Funding

This research received no external funding.

Data Availability Statement

The original contributions presented in this study are included in the article. Further inquiries can be directed to the corresponding authors.

Conflicts of Interest

Authors Zhe Lv, Zhonghao Sun and Lei Wang were employed by the company Beijing HyperStrong Technology Co., Ltd. The remaining authors declare that the research was conducted in the absence of any commercial or financial relationships that could be construed as a potential conflict of interest.

References

  1. Wu, N.; Chen, Y.; Lin, B.; Li, J.; Zhou, X. Experimental assessment and comparison of single-phase versus two-phase liquid cooling battery thermal management systems. J. Energy Storage 2023, 72, 108727. [Google Scholar] [CrossRef]
  2. Song, F.; Cui, J.; Yu, Y. Dynamic volatility spillover effects between wind and solar power generations: Implications for hedging strategies and a sustainable power sector. Econ. Model. 2022, 116, 106036. [Google Scholar] [CrossRef]
  3. Mohd Razif, A.S.; Ab Aziz, N.F.; Ab Kadir, M.Z.A.; Kamil, K. Accelerating energy transition through battery energy storage systems deployment: A review on current status, potential and challenges in Malaysia. Energy Strategy Rev. 2024, 52, 101346. [Google Scholar] [CrossRef]
  4. Al Khafaf, N.; Rezaei, A.A.; Moradi Amani, A.; Jalili, M.; McGrath, B.; Meegahapola, L.; Vahidnia, A. Impact of battery storage on residential energy consumption: An Australian case study based on smart meter data. Renew. Energy 2022, 182, 390–400. [Google Scholar] [CrossRef]
  5. Rosewater, D.; Ferreira, S.; Schoenwald, D.; Hawkins, J.; Santoso, S. Battery Energy Storage State-of-Charge Forecasting: Models, Optimization, and Accuracy. IEEE Trans. Smart Grid 2019, 10, 2453–2462. [Google Scholar] [CrossRef]
  6. Yudhistira, R.; Khatiwada, D.; Sanchez, F. A comparative life cycle assessment of lithium-ion and lead-acid batteries for grid energy storage. J. Clean. Prod. 2022, 358, 131999. [Google Scholar] [CrossRef]
  7. Song, L.; Zheng, Y.; Xiao, Z.; Wang, C.; Long, T. Review on Thermal Runaway of Lithium-Ion Batteries for Electric Vehicles. J. Electron. Mater. 2021, 51, 30–46. [Google Scholar] [CrossRef]
  8. Li, H.; Xiao, X.; Wang, Y.; Lian, C.; Li, Q.; Wang, Z. Performance investigation of a battery thermal management system with microencapsulated phase change material suspension. Appl. Therm. Eng. 2020, 180, 115795. [Google Scholar] [CrossRef]
  9. Qi, W.; Lan, P.; Yang, J.; Chen, Y.; Zhang, Y.; Wang, G.; Peng, F.; Hong, J. Multi-U-Style micro-channel in liquid cooling plate for thermal management of power batteries. Appl. Therm. Eng. 2024, 256, 123984. [Google Scholar] [CrossRef]
  10. Wang, D.; Tang, M.; Wu, C.; Huang, C. Design and Numerical Study of Microchannel Liquid Cooling Structures for Lithium Batteries. Energy Technol. 2024, 12, 2301646. [Google Scholar] [CrossRef]
  11. Khoshvaght-Aliabadi, M.; Ghodrati, P.; Kang, Y.T. Developing a novel battery thermal management system utilizing supercritical CO2 as the cooling medium. Appl. Energy 2025, 381, 125207. [Google Scholar] [CrossRef]
  12. Khoshvaght-Aliabadi, M.; Ghodrati, P.; Kang, Y.T. Performance analysis of supercritical carbon dioxide as a coolant in cold plate systems. Energy 2025, 314, 134301. [Google Scholar] [CrossRef]
  13. Hussain, A.; Abidi, I.H.; Tso, C.Y.; Chan, K.C.; Luo, Z.; Chao, C.Y. Thermal management of lithium ion batteries using graphene coated nickel foam saturated with phase change materials. Int. J. Therm. Sci. 2018, 124, 23–35. [Google Scholar] [CrossRef]
  14. Perez, H.D.; Grossmann, I.E. Recent Advances in Computational Models for the Discrete and Continuous Optimization of Industrial Process Systems. In Advances on Links Between Mathematics and Industry; Springer: Cham, Switzerland, 2021; pp. 1–31. [Google Scholar]
  15. Bernardi, D.M.; Pawlikowski, E.M.; Newman, J. A General Energy Balance for Battery Systems. J. Electrochem. Soc. 1984, 132, 5–12. [Google Scholar] [CrossRef]
  16. Damay, N.; Forgez, C.; Bichat, M.-P.; Friedrich, G. Thermal modeling of large prismatic LiFePO4 /graphite battery. Coupled thermal and heat generation models for characterization and simulation. J. Power Sources 2015, 283, 37–45. [Google Scholar] [CrossRef]
  17. Du, S.; Lai, Y.; Ai, L.; Ai, L.; Cheng, Y.; Tang, Y.; Jia, M. An investigation of irreversible heat generation in lithium ion batteries based on a thermo-electrochemical coupling method. Appl. Therm. Eng. 2017, 121, 501–510. [Google Scholar] [CrossRef]
  18. Chen, G.; Xia, X.; Zhao, X.; Zeng, X.; Ouyang, T.; Feng, H. A balanced SOH-SOC control strategy for multiple battery energy storage units based on battery lifetime change laws. Electr. Eng. 2025, 1–12. [Google Scholar] [CrossRef]
  19. Zhao, W.; Meng, C.; Zhao, Y.; Xie, S.; Wang, X.; Jiang, C.; Li, W.; Jing, R. Research on aging-thermal characteristics coupling and aging thermal management analysis of large-capacity LiFePO4 battery. J. Energy Storage 2025, 114, 115675. [Google Scholar] [CrossRef]
  20. Zhou, H.; Yang, Y.; Zhang, Z.; Wang, W.; Yang, L.; Du, X. Charge and discharge strategies of lithium-ion battery based on electrochemical-mechanical-thermal coupling aging model. J. Energy Storage 2024, 99, 113484. [Google Scholar] [CrossRef]
  21. Dubarry, M.; Baure, G.; Devie, A. Durability and Reliability of EV Batteries under Electric Utility Grid Operations: Path Dependence of Battery Degradation. J. Electrochem. Soc. 2018, 165, A773. [Google Scholar] [CrossRef]
  22. Richardson, R.R.; Osborne, M.A.; Howey, D.A. Gaussian process regression for forecasting battery state of health. J. Power Sources 2017, 357, 209–219. [Google Scholar] [CrossRef]
  23. Mura, R.; Utkin, V.; Onori, S. Energy Management Design in Hybrid Electric Vehicles: A Novel Optimality and Stability Framework. IEEE Trans. Control. Syst. Technol. 2015, 23, 1307–1322. [Google Scholar] [CrossRef]
  24. Bashash, S.; Moura, S.J.; Forman, J.C.; Fathy, H.K. Plug-in hybrid electric vehicle charge pattern optimization for energy cost and battery longevity. J. Power Sources 2011, 196, 541–549. [Google Scholar] [CrossRef]
  25. Anderson, J. Computational Fluid Dynamics: The Basics with Applications. Master’s Thesis, Tsinghua University Press, Beijing, China, 2002. [Google Scholar]
  26. Byron Bird, R.; Stewart, W.E.; Lightfoot, E.N. Transport Phenomena; John Wiley & Sons, Inc.: Hoboken, NJ, USA, 1960. [Google Scholar]
  27. Kays, W.M.; Crawford, M.E.; Weigand, B. Convective Heat and Mass Transfer; McGraw-Hill: New York, NY, USA, 2011. [Google Scholar]
  28. Menter, F.R. Two-equation eddy-viscosity turbulence models for engineering applications. AIAA J. 1994, 32, 1598–1605. [Google Scholar] [CrossRef]
  29. Lv, Z.; Si, H.; Yang, Z.; Cui, J.; He, Z.; Wang, L.; Li, Z.; Zhang, J. Simplified Mechanistic Aging Model for Lithium Ion Batteries in Large-Scale Applications. Materials 2025, 18, 1342. [Google Scholar] [CrossRef]
Figure 1. The simulation results of the discharge (a) and charge (b) heat generation power model under different temperatures and SOC levels.
Batteries 11 00219 g001
Figure 2. Mesh independence verification.
Batteries 11 00219 g002
Figure 3. Stable point of fan operation (a), distribution diagram of air-cooled flow rate of different modules (b), temperature cloud image of cell cluster section (c) and module interface temperature cloud image (d).
Batteries 11 00219 g003
Figure 4. Flow distribution diagram of each air outlet (a), main duct flow diagram (b), and overall temperature cloud image of container (c).
Batteries 11 00219 g004
Figure 5. The maximum and minimum temperature and current change curve of the cell during charge and discharge (a), distribution diagram of the average temperature of each module in the container (b), image of maximum, minimum and maximum temperature difference of each battery cluster in the container and (c) temperature comparison curve between simulation results and measured data (d).
Batteries 11 00219 g005
Figure 6. Energy consumption–temperature correspondence diagram (a), annual average energy consumption–temperature correspondence diagram (b), simulation results of battery life under the typical thermal management strategy (c), and a comparison of the simulated benefits under different strategies (d).
Batteries 11 00219 g006
Table 1. Basic parameters of experimental samples.
NumberParameter NameTechnical Indicator
1Battery typeprismatic lithium iron phosphate
2Rated voltage3.2 V
3Nominal capacity280 Ah
4Mass5340.0 g
5Energy density167.8 Wh/kg
6Test ambient temperature15/20/25/30/35/40 °C
Table 2. Comparison of basic statistical parameters between simulated and measured battery cell temperatures.
ParameterTmax-SimTmax-MeasTmin-SimTmin-MeasΔT-SimΔT-Meas
maximum36.2 °C34.4 °C31.6 °C30.2 °C4.6 °C4.9 °C
minimum26.0 °C26.0 °C23.8 °C23.1 °C2.0 °C1.9 °C
mean30.3 °C30.0 °C26.7 °C26.3 °C3.6 °C3.7 °C
Table 3. Error analysis of measured and simulated cell temperature.
Error MetricTmax (Simulation vs. Measured)Tmin (Simulation vs. Measured)ΔT (Simulation vs. Measured)
maximum absolute error2.3 °C2.5 °C1.30 °C
mean absolute error0.74 °C0.85 °C0.32 °C
Table 4. Summary of thermal management strategies.
No.0123456
Start T,Not
Running
353534333231Persistent
Running
End T.343231302928
Disclaimer/Publisher’s Note: The statements, opinions and data contained in all publications are solely those of the individual author(s) and contributor(s) and not of MDPI and/or the editor(s). MDPI and/or the editor(s) disclaim responsibility for any injury to people or property resulting from any ideas, methods, instructions or products referred to in the content.

