Article

Pulse-Driven Internal Resistance Dynamics Enable Dual-Function Lithium-Plating Diagnosis and Longevity Enhancement in V2G-Optimized Lithium-Ion Batteries

by
Letong Li
1,
Yanan Wang
2,
Dongliang Guo
3,
Xuebing Han
1,*,
Hewu Wang
1,
Lei Sun
3 and
Minggao Ouyang
1,*
1
State Key Laboratory of Intelligent Green Vehicle and Mobility, School of Vehicle and Mobility, Tsinghua University, Beijing 100084, China
2
School of Mechanical and Energy Engineering, Beijing University of Technology, Beijing 100124, China
3
Research Institute, State Grid Jiangsu Electric Power Co., Ltd., Nanjing 211103, China
*
Authors to whom correspondence should be addressed.
Batteries 2025, 11(5), 200; https://doi.org/10.3390/batteries11050200
Submission received: 4 April 2025 / Revised: 16 May 2025 / Accepted: 18 May 2025 / Published: 20 May 2025

Abstract

:
The lithium-plating phenomenon induced by low-temperature fast charging of lithium-ion batteries severely compromises their performance and safety. However, current lithium-plating detection methods predominantly rely on complex hardware systems with insufficient sensitivity, presenting significant challenges for implementation in increasingly prevalent Vehicle-to-Grid (V2G) scenarios. This study proposes a novel bidirectional pulse-current charging method designed to mitigate lithium plating and retard battery aging through intermittent pulse-current application. Experimental results verify a 30–50% reduction in capacity fade rate under fast charging conditions (≥0.5 C rates). Furthermore, by leveraging pulse-current characteristics, we reveal strong correlations between the evolution patterns of charge/discharge internal resistance and lithium plating. An in situ detection criterion requiring no additional hardware is established: the L-shaped decline of charging internal resistance under high-rate conditions coupled with the disappearance of defined reverse-hump curves in discharge resistance profiles serve as precise indicators of lithium-plating onset. Validation through SEM and relaxation voltage differential analysis confirms 100% detection accuracy. This methodology combines rapid detection capability, non-destructive nature, and compatibility with V2G applications, providing new perspectives for enhancing lithium-ion battery longevity and lithium-plating detection.

Graphical Abstract

1. Introduction

Lithium-ion batteries (LIBs) are widely used in electric vehicles, portable electronics, and smart-grid renewable energy [1,2,3] due to their high energy density, long cycle life, low self-discharge rate, and broad operating temperature range [4,5]. However, over time, the performance of lithium-ion batteries declines as they age, and this issue is particularly noticeable under low temperatures [6]. Additionally, during low-temperature charging, lithium-ion batteries are prone to lithium plating, which leads to the formation of lithium dendrites. These dendrites can deteriorate the battery’s thermal stability, potentially triggering thermal runaway [7]. While preheating battery packs remains a commonly implemented strategy to address this issue, the requisite auxiliary heating systems inevitably incur elevated manufacturing expenditures, prolong charging durations, and detrimentally compromise user experience [8]. Thus, research into effective strategies to alleviate battery aging is critical for improving the lifespan and reliability of lithium-ion batteries.
In low-temperature environments, conventional charging methods lead to severe capacity degradation of batteries. This phenomenon arises because the diffusion rate of lithium ions in graphite slows down at reduced temperatures, while the ionic conductivity of the electrolyte decreases dramatically. Concurrently, there is a continuous increase in the impedance of the SEI film and the charge transfer resistance [9]. Simultaneously, the intercalation rate decreases, making lithium-plating reactions on the graphite surface more likely [10,11], leading to capacity loss. This process is considered the aging of the battery. Xiong et al. [12] provide a comprehensive explanation of the aging side reactions that may occur during battery storage and cycling. For well-established battery systems, the growth, breakage, and regeneration of the SEI film, as well as lithium plating, are the primary aging mechanisms. These can typically be described by capacity loss and increased internal resistance [13]. Therefore, capacity and impedance measurements are crucial for assessing the state of health (SOH) and understanding the evolution of the SEI [14].
Lithium plating is one of the primary side reactions during aging [15]. During the charging process of a lithium-ion battery, lithium plating occurs when active lithium storage sites are gradually filled, reducing the intercalation current of lithium ions, while the plating current increases [16]. This is especially true under high charge rates (C-rates) or low-temperature conditions, where electrode polarization causes the anode local potential to drop below equilibrium potential. Under such electrochemical conditions, lithium plating prevails over lithium-ion intercalation in the competitive reaction pathways, thereby inducing metallic lithium deposition on the anode surface [17]. Mainstream lithium-plating detection methods are divided into in situ and non in situ techniques. Non in situ methods such as SEM [18], transmission electron microscopy (TEM) [19], mass spectrometry titration (MST) [20], and X-ray computed tomography (CT) [21] can directly observe and analyze changes in the crystal structure, phase transitions, and surface morphology of electrode materials. However, these methods require complex equipment for destructive battery disassembly, making them unsuitable for most practical scenarios. With the increasing prevalence of V2G systems and the accelerated deployment of bidirectional charging stations [22], charging and discharging data from vehicles can be easily accessed, providing a basis for in situ detection of lithium plating. The voltage plateau method is a common in situ detection approach because the overpotential for lithium stripping is lower compared to the lithium de-intercalation process of the anode. As a result, reversible lithium preferentially strips during discharge, creating a voltage plateau during the initial discharge stage [23,24]. However, when the battery system differs or the degree of lithium plating is mild, the voltage plateau may not be distinct, thus affecting detection sensitivity. Additionally, observing the voltage plateau or performing differential analysis requires long waiting times and extensive computation, which is not ideal for fast real-time monitoring in battery management systems (BMSs).
The rapid development of electric vehicles (EVs) has transformed them into distributed mobile energy storage units [25], enabling bidirectional energy interaction with power grids through V2G technology. Vehicle-to-Grid technology has been extensively researched and deployed globally, with approximately 150 pilot demonstration projects established by early 2025 [26]. For instance, Italy’s largest DrossOne V2G parking project employs 280 bidirectional fast chargers to support grid frequency regulation and load balancing [27]. The large-scale implementation of V2G not only mitigates power fluctuations caused by high renewable-energy penetration in grid systems but also reduces electricity costs through time-of-use pricing policies while generating profits for consumers [28]. This operational paradigm not only delivers critical grid services, including peak shaving and frequency regulation, but also establishes battery proactive incentive mechanisms through dynamic charging/discharging strategies [5]. The diverse battery internal information embedded in these dynamic charging/discharging strategies further expands possibilities for fault diagnosis. When implementing V2G-compatible pulse charging methods, the internal resistance of LIBs can be readily calculated, facilitating convenient impedance tracking to detect lithium-plating occurrences in batteries. Additionally, concerns about battery degradation emerge when users participate in V2G applications [29], creating an urgent demand for charging methodologies that leverage charger-side active incentives to retard battery aging. This approach thereby enables optimal control of EV charging/discharging processes to optimize both economic and environmental benefits.
Impedance-based lithium-plating detection methods have gained increasing attention due to their advantages of simplicity of operation, clear principles, and low cost. When lithium plating occurs during the charging process of lithium-ion batteries (LIBs), the side reactions introduce additional charge transfer impedance. The electrochemical impedance spectroscopy (EIS) and internal resistance method are two primary impedance-based detection techniques. Electrochemical impedance spectroscopy is a powerful tool for analyzing battery impedance characteristics by applying small-amplitude alternating current signals across a wide frequency range, enabling the detection of subtle changes in charge transfer resistance associated with lithium plating. In contrast, the internal resistance method primarily focuses on monitoring direct current resistance variations during charging and discharging processes. Schinlder et al. [30] first proposed using impedance spectra as indicators for lithium-plating detection, identifying the shrinkage of the main semicircle in the anodic charge transfer process and the reduction of high-frequency intersection resistance as primary characteristics of lithium plating. However, EIS measurements require sophisticated equipment and time-consuming testing procedures. Koleti et al. [31] developed a highly sensitive real-time lithium-plating detection method through periodic battery impedance monitoring, enabling effective identification of lithium-plating initiation. Nevertheless, this study focused on critical current rates for lithium plating at different temperatures, where the accuracy could be compromised due to the gradual intensification of lithium plating after the same battery undergoes five cycles at different rates. Pan et al. [32] enriched lithium-plating detection indicators by measuring electrochemical impedance and internal resistance during the rest period after charging. However, internal resistance measurement during relaxation time contradicts the practical scenarios of V2G. Xu et al. [33] achieved battery lifespan extension through bidirectional pulse currents and developed a degradation model coupling SEI growth and lithium-dendrite formation, confirming lithium plating as a critical factor in battery aging. However, their work did not explore practical characterization methods for lithium plating based on bidirectional pulse profiles and degradation model mechanisms, nor did it discuss LiNixCoyMnzO2 (NMC) battery systems.
Therefore, in this paper, we propose a novel charging method based on bidirectional pulse current. Specifically, the intermittent pulse current replaces the constant current (CC) phase of the CC-CV charging mode. The aim is to explore the effect of pulse charging protocols under V2G scenarios on LIB discharge capacity, internal resistance changes, and cycle life. In addition, pulse segment information is extracted and processed to obtain internal resistance values. A real-time online lithium-plating detection method is proposed based on identifying trends in the internal resistance changes. The proposed charging method is verified at different charge rates, pulse amplitudes, and pulse periods. Finally, the battery is disassembled and analyzed using non in situ methods (SEM methods) to observe the internal morphology and degree of lithium plating, verifying the accuracy of the proposed method. Table 1 demonstrates a comparative analysis between the proposed method and other advanced in situ detection techniques, highlighting the advantages of the proposed approach in terms of fast detection speed, minimal data requirements, and broad applicability. By utilizing this bidirectional pulsed charging strategy, fault diagnosis and lifespan prediction of LIBs can be achieved through bidirectional charging infrastructure. This methodology not only contributes to enhancing the longevity and reliability of large-scale automotive and energy storage batteries in future V2G scenarios but also complements and refines existing non-destructive lithium-plating detection methods based on impedance analysis.

2. Experimental

In this experiment, a commercial 5 Ah cylindrical lithium-ion battery (INR21700-M50, LixNi0.8Co0.1Mn0.1O2 cathode/LixC6 anode) was used to validate the proposed pulse charging method. Detailed specifications are listed in Table 2. Prior to testing, all cells underwent three formation cycles with 1/3 C charge/discharge rates at 25 °C to stabilize electrochemical performance. The CT-4008-5V300A-NTFA tester and SC2-400-CD-3 temperature chamber were utilized for cycling tests and thermal environment control.

2.1. Capacity Test

Capacity testing is an important method for quantitatively assessing battery aging. The tests were performed at a constant temperature of 25 °C, and the battery was placed in a temperature-controlled chamber for 1 h before testing to ensure the internal and external temperature of the battery reached equilibrium. During the test, the battery was first charged at a constant current of 1/3 C to 4.2 V, followed by constant voltage charging until the current decreased to 1/20 C. After charging, the battery was allowed to rest for 1 h, and then it was discharged at a constant current of 1/3 C to 2.5 V. This charge–discharge cycle was repeated three times, and the discharge capacity from the last cycle was used as the final capacity test result.

2.2. Low-Temperature Charging Test

Low-temperature charging tests were conducted in this study to accelerate battery aging and induce lithium plating. Batteries were charged at −10 °C using various C-rate CC-CV protocols until reaching the cut-off voltage of 4.2 V. The charging procedure comprised the following steps: initial constant current (CC) charging at different rates (1/6, 1/3, 1/2, 1, and 1.5 C), with the CC phase interrupted every 10 s to apply a bidirectional pulse current. Each charging cycle consisted of 10 s high-rate charging followed by our designed low-rate pulse charging current, repeated cyclically until attaining the cut-off voltage. The charging voltage profile during this process is shown in Figure 1a, while Figure 1b illustrates the distribution of charging current and pulse current during the process. Significant fluctuations are observed in the voltage profile due to the abrupt transition from a high-rate charging current in the CC phase to a negative pulse current in the experimental design. Figure 1c,d present the voltage–current curves of a representative pulse profile. This 0.1 C magnitude (equivalent to 0.5 A) pulse current cycle included sequential phases: 10 s discharge, 10 s rest, 10 s charge, and final 10 s rest, achieving electrical neutrality without affecting the battery’s inherent capacity. After completing the CV phase to the cut-off voltage, batteries underwent a 3 h rest period, followed by discharge to 2.5 V at 1/3 C rate. Each low-temperature charging test comprised 30 cycles, with capacity tests conducted every 5 low-temperature charging cycles.
In order to verify the effectiveness of the proposed method in improving battery aging performance during low-temperature cycling, a control group was set up using CC-CV charging without applying bidirectional pulse current, with all other steps remaining the same. Additionally, to investigate the effects of different pulse current amplitudes and periods on the aging performance of the 5 Ah lithium-ion battery, as shown in Figure 1d, we designed supplementary experiments with different pulse amplitudes (0.1 C, 0.2 C, 0.3 C, and 0.4 C) and pulse periods (40 s, 30 s, 20 s, and 10 s). These 8 sets of batteries underwent 30 cycles of low-temperature charging under the same conditions to analyze the pulse performance and further verify the correctness of the pulse charging method. Table 3 summarizes the C-rates and pulse protocol parameters adopted in all experimental tests. The first digit in the numbering denotes the experimental category (constant current and pulse current under varying C-rates; pulse currents with different amplitudes and durations), while the second digit indicates the battery cell serial number.

2.3. Observing the Anode Using SEM

As the battery undergoes cyclic aging, the degree of fragmentation of the anode’s graphite material gradually increases. Moreover, when lithium plating occurs in the battery, lithium ions deposit in the form of metal on the anode surface. This process can be analyzed non-destructively using SEM to observe the deposited lithium and dendrite formation. To visually and accurately examine the extent of aging and lithium plating on the anode surface, SEM characterization was performed. The anode material from the batteries that underwent 30 cycles under different charge rates using the proposed method was disassembled. The anode was then cleaned using solvents such as dimethyl carbonate (DMC) to remove any residual electrolyte. The cleaned anode material was then observed under SEM in a vacuum environment to analyze the degree of fragmentation and the distribution and characteristics of lithium dendrites.

3. Results

3.1. Capacity Results

The aging mechanisms of lithium-ion batteries, including lithium inventory loss, active material peeling from the electrode, electrolyte decomposition side reactions, and uncontrollable growth of the SEI film, all contribute to the continual deterioration of lithium-ion de-intercalation kinetics. This irreversible capacity decay becomes significantly more severe under high-rate cycling and low-temperature conditions due to the coupling of multiple physical fields. In this study, the relatively short test duration and few cycles mean that capacity decay is primarily caused by lithium inventory loss due to plating. By processing the results from the low-temperature charging tests under different charge rates, the relative capacity change rate, as compared to the initial capacity, is shown in Table 4, where negative values indicate capacity decay.
From the capacity degradation results at the five different charge rates, it was observed that under the 1/6 C and 1/3 C current conditions, the capacity change was relatively small. This is likely due to the low charge rates and few cycles, which result in limited lithium plating, so the battery’s capacity change is more dependent on its initial state. The proposed method did not show significant improvement in capacity loss under these conditions. However, as the charge rate increased, the battery’s capacity loss increased sharply. Especially when the charge rate exceeded 1/2 C, the higher charging current caused polarization, which led to the anode local potential dropping below the equilibrium potential, and the lithium inventory loss due to lithium plating manifested as a change in capacity. Experimental results show that, starting at 1/2 C, the capacity decay rate of batteries using pulse charging was significantly lower than that of batteries charged via the normal CC-CV method. This phenomenon became more pronounced as the charge rate increased. Figure 2 illustrates a schematic diagram of the aforementioned pulse operating conditions based on the hypothesized mechanism. When the intermittent pulse current charging method was applied, the initial discharge pulse raised the anode potential, providing a buffering and recovery effect against the local anode potential falling below 0 V under high charge currents. Meanwhile, the lithium-stripping reaction occurred synchronously, reducing lithium inventory loss and suppressing capacity decay. The subsequent charging pulse, with a smaller current, served to counteract the capacity reduction caused by the discharge pulse, without further promoting lithium plating.
To better illustrate the improvement of the pulse charging method in mitigating capacity loss during cycles, we plotted the capacity decay-rate variation over every five low-temperature cycles under different charging conditions, as shown in Figure 3. Building upon the bar chart of capacity variation rates at every five cycles, we employed cubic spline interpolation to generate a smoothed capacity evolution profile, with experimental error bars (±5%) explicitly incorporated to quantify measurement uncertainties. From Figure 3a–e), it can be observed that when the charge rate exceeds 1/3 C, the capacity decay rate of the batteries using pulse charging is significantly lower than that of the batteries using the normal CC-CV charging method. This trend becomes more pronounced as the charge rate increases. The above analysis indicates that the proposed pulse charging method effectively reduces capacity loss in low-temperature cycling, thus helping to suppress battery aging.

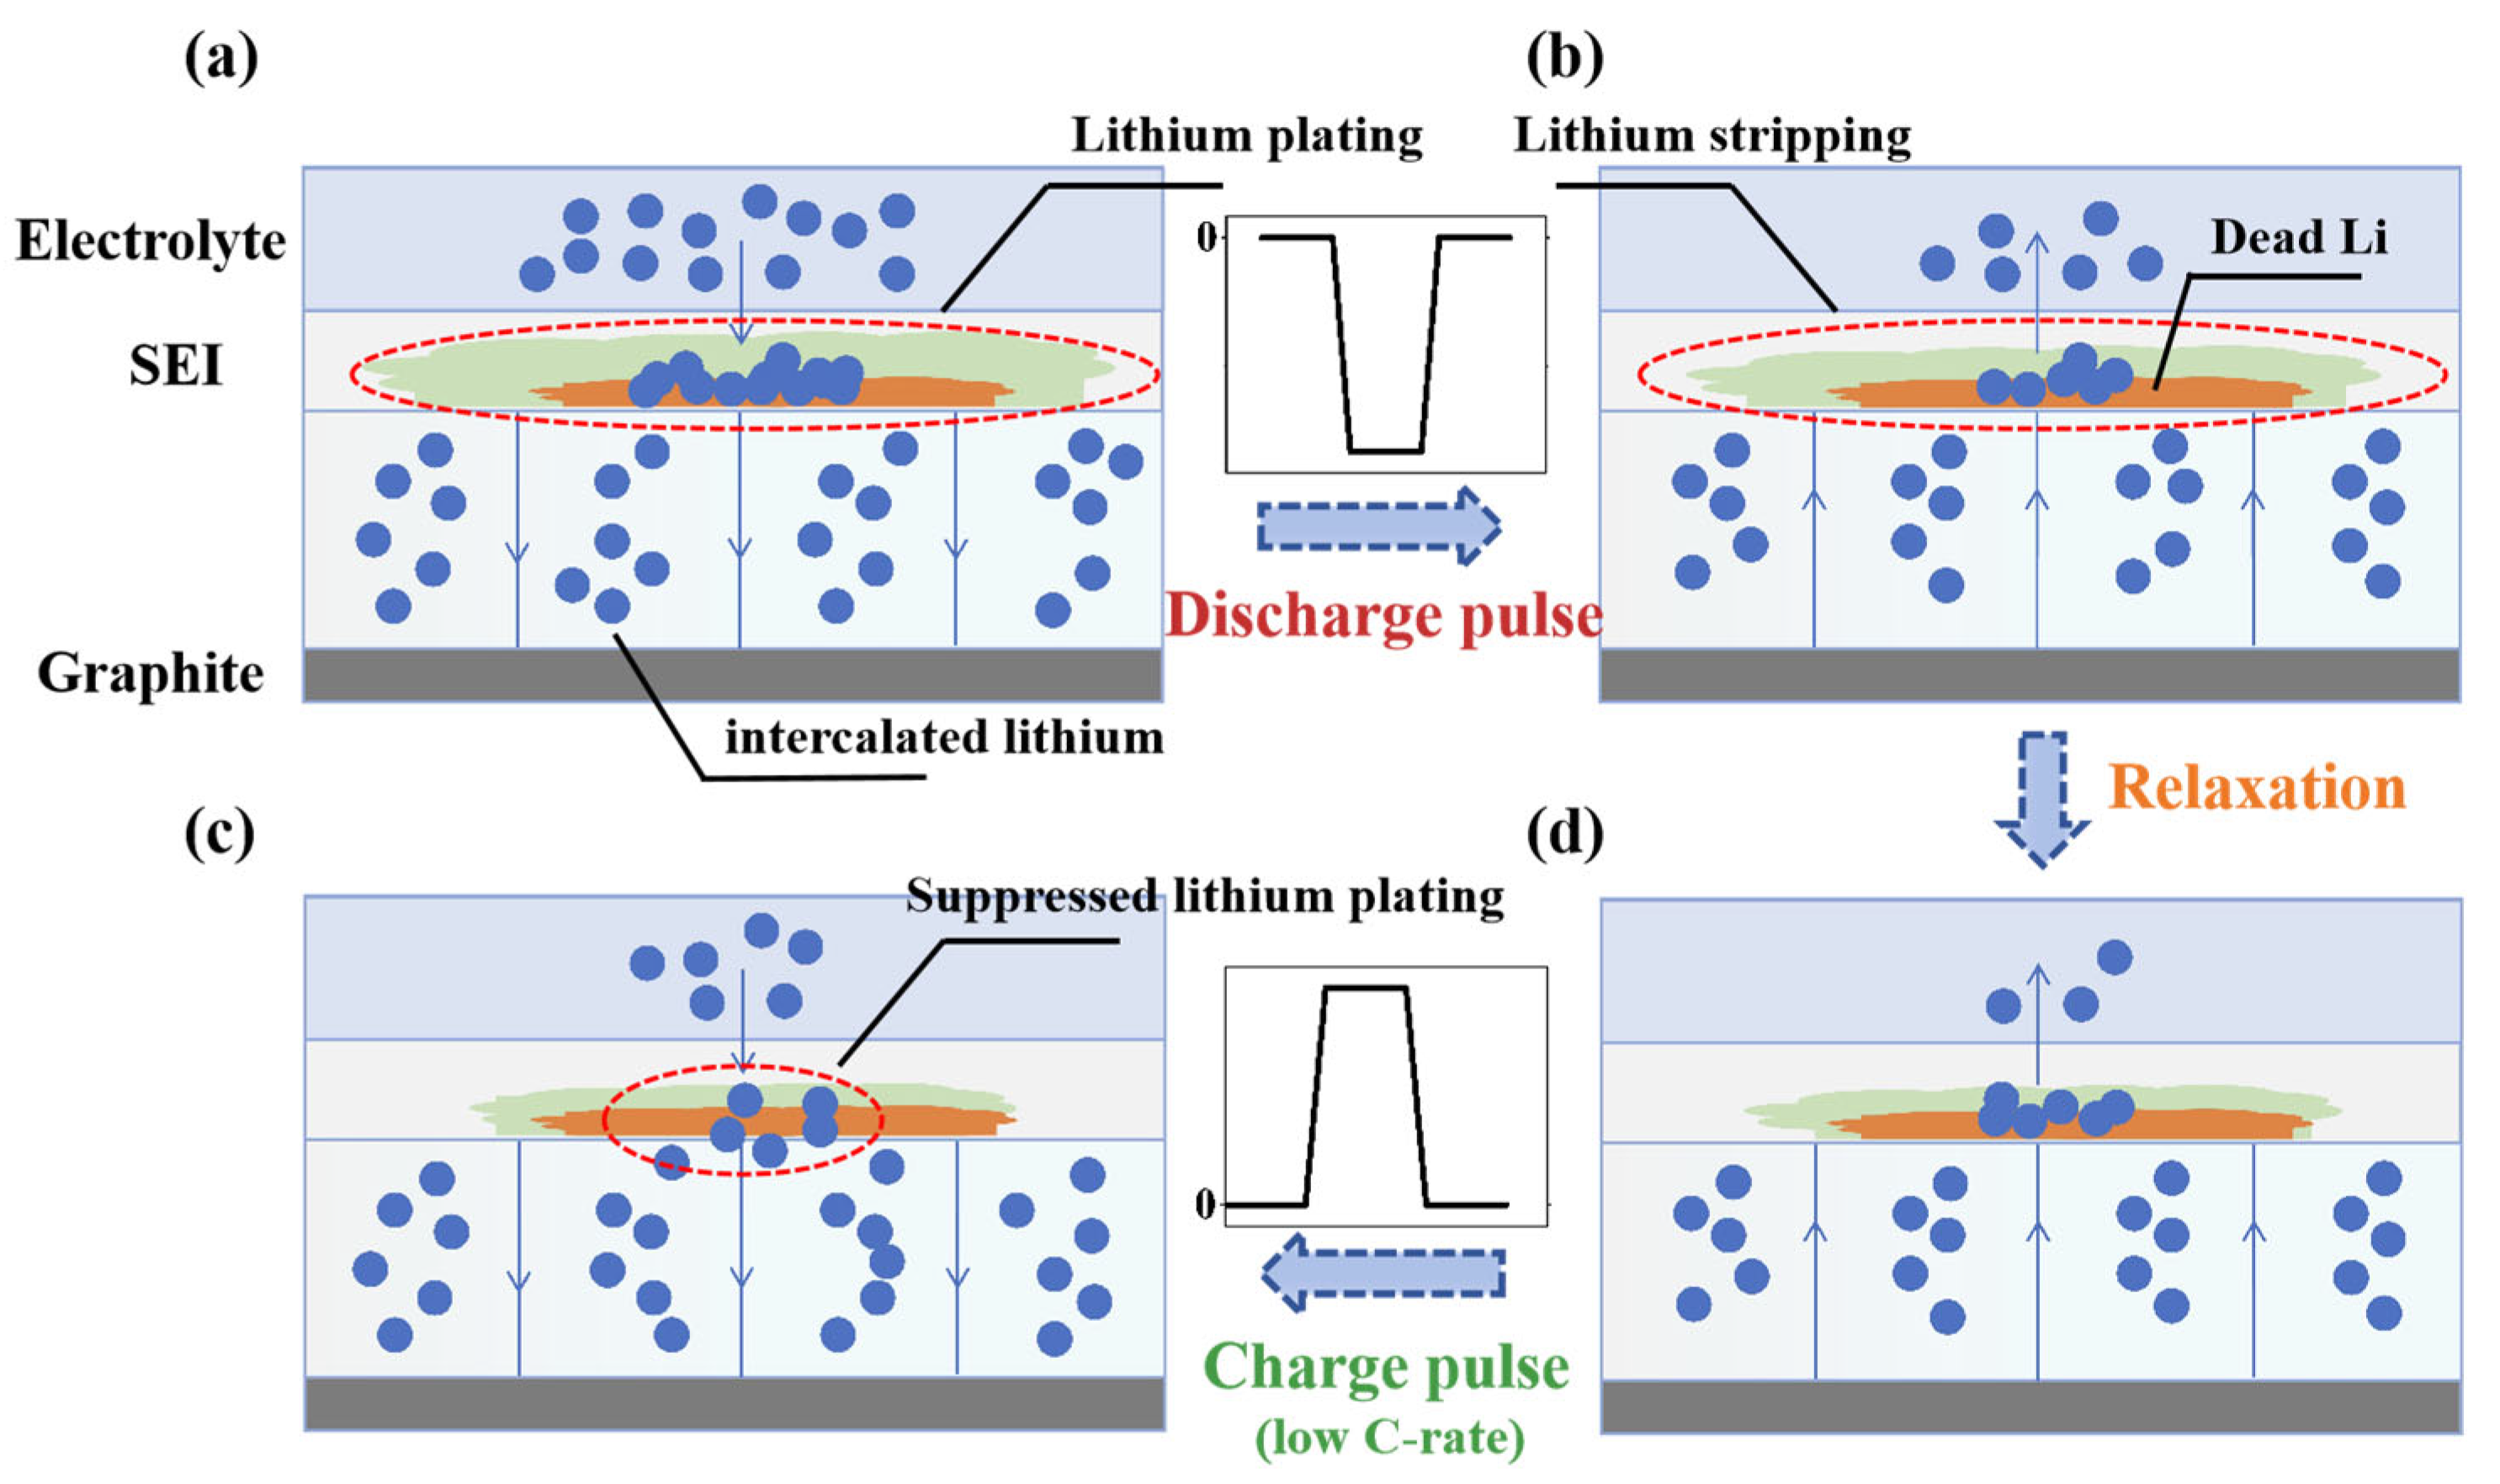
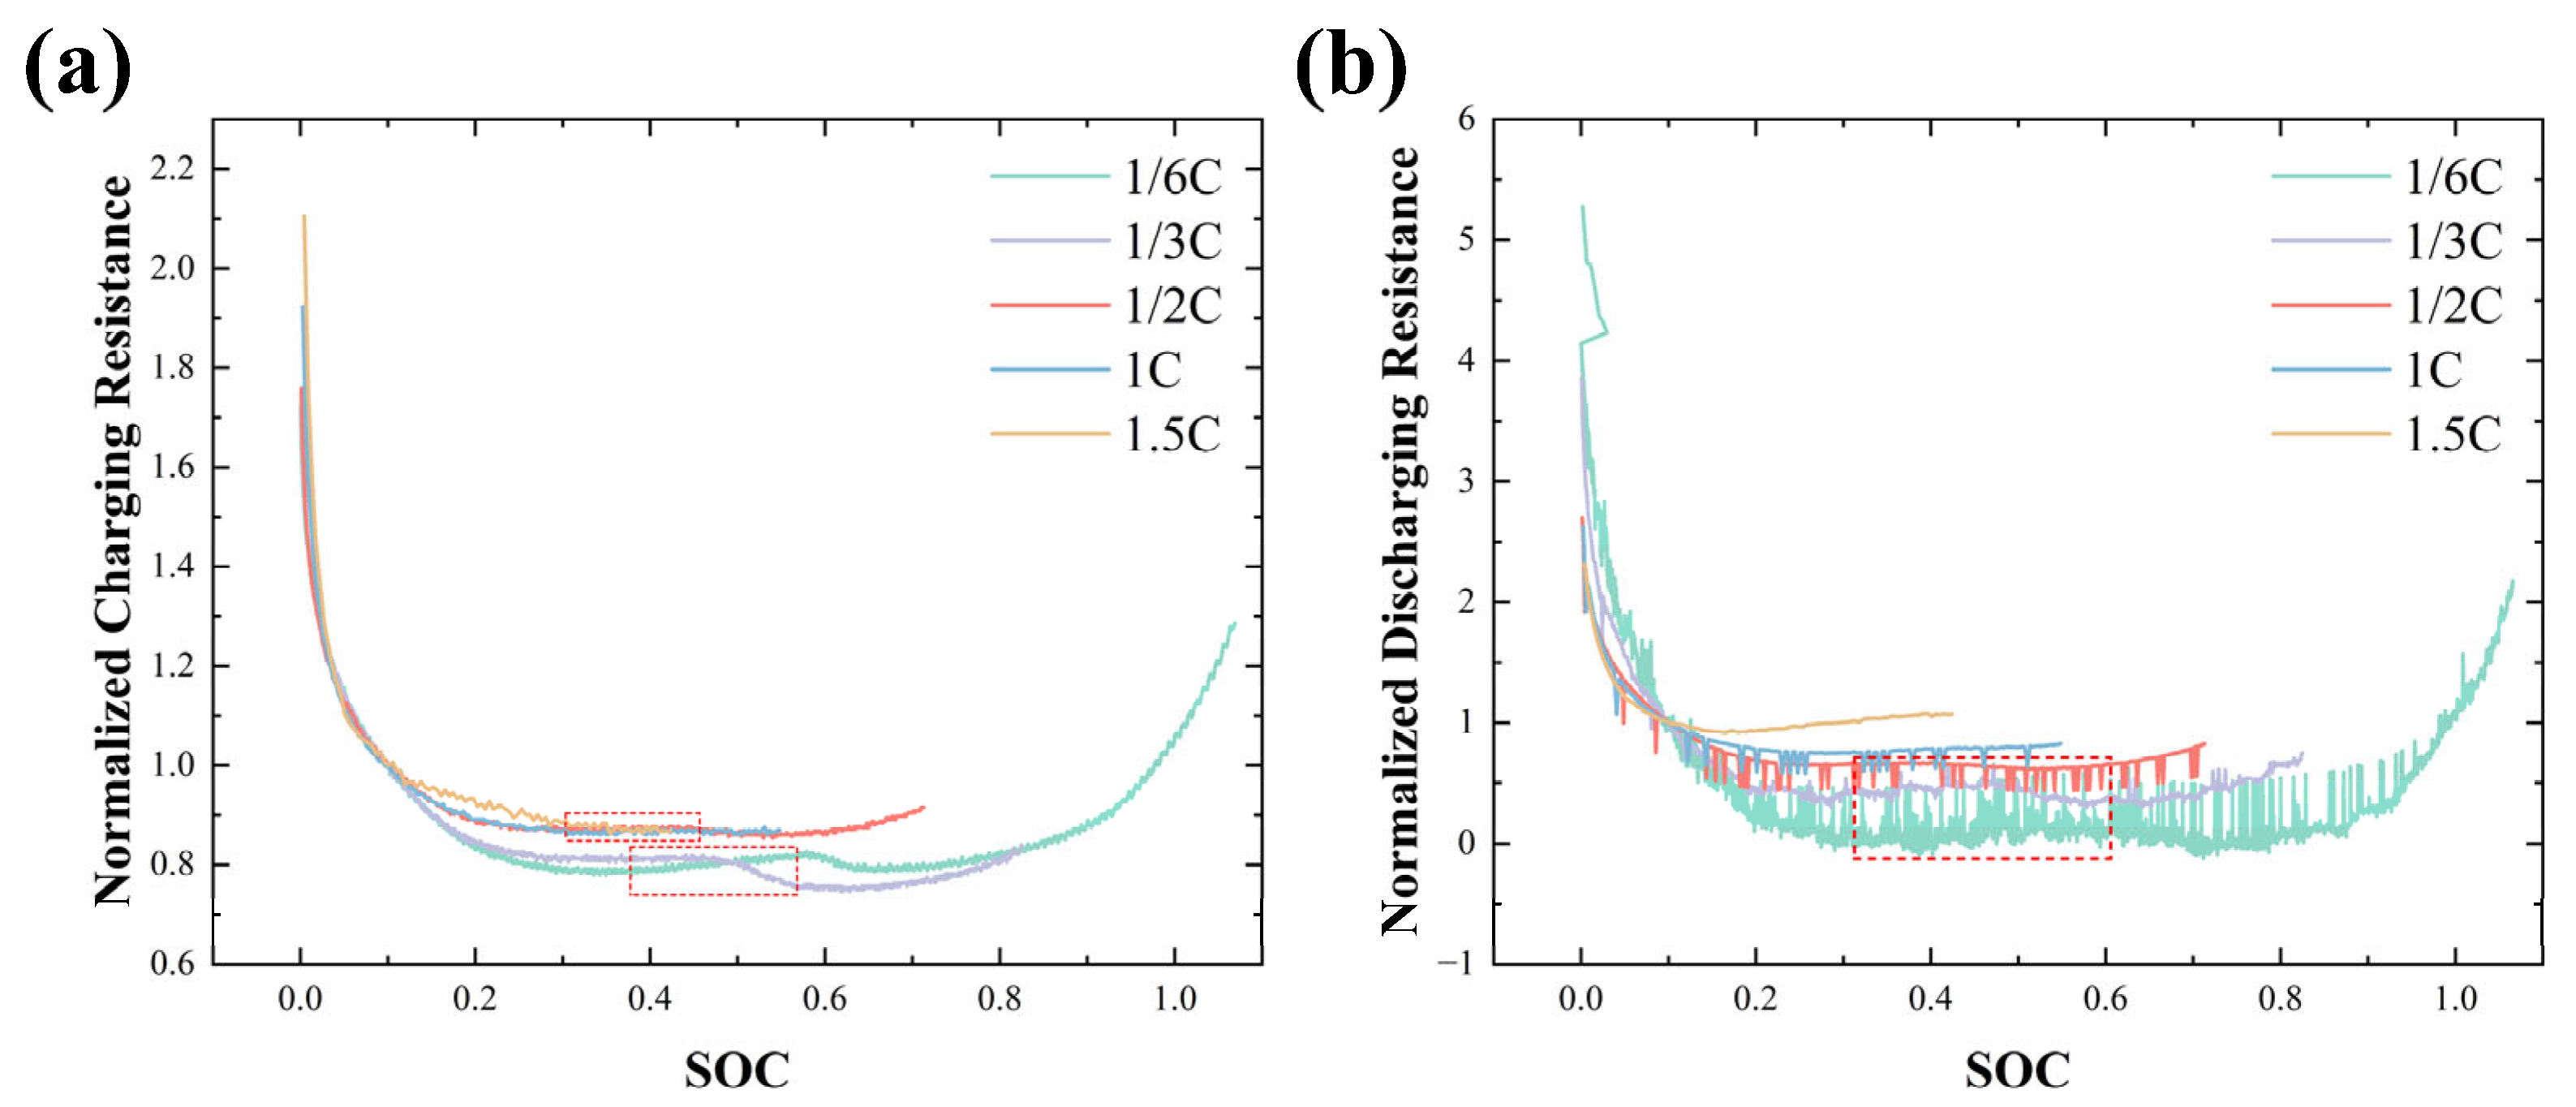
3.2. Pulse Effect Analysis

The pulse current’s amplitude and period directly affect the battery’s CC phase performance under low-temperature cycling, likely involving changes in the local potential of both the anode and cathode during the pulse process. Considering the pulse-current precision achievable by current bidirectional charging stations, we designed eight experimental groups to study the impact of different pulse amplitudes and periods on battery aging. By analyzing the results of the 30 low-temperature cycles under various pulse conditions, we recorded the capacity change curves during the cycles and the final capacity decay rates, as shown in Figure 4. It is noteworthy that the charging current was limited to 1/3 C. The capacity increases in the initial five activation cycles. Then, gradual capacity decay occurs in the subsequent cycles, and the decay rate was determined based on the capacity at the fifth cycle.
As shown in Figure 4a, as the pulse current amplitude increases, the overall remaining discharge capacity of the battery increases, and the capacity decay rate decreases. This phenomenon becomes more evident as the number of cycles increases, especially after the 25th cycle. The final capacity decay rate is inversely proportional to the pulse amplitude. Figure 4b demonstrates the final capacity degradation after 30 cycles. Similarly, as shown in Figure 4c, a larger pulse period also results in better suppression of capacity decay compared to shorter pulse durations. The end-of-cycle capacity results in Figure 4d further support this conclusion. Therefore, it can be inferred that larger pulse amplitudes and longer periods effectively improve the anode potential during the discharge phase and the subsequent rest phase. During this stage, the anode potential gradually increases above 0 V, and some of the lithium metal deposited on the anode surface is stripped and re-intercalated into the graphite anode. This process effectively suppresses lithium plating, delays the battery’s aging process, and demonstrates higher remaining discharge capacity.

3.3. Lithium-Plating Detection Method Under Pulse Charging

We define the internal resistance of the battery during the discharge and charge phases after 10 s of pulse application as R d i s c h a r g i n g and R c h a r g i n g , respectively. The resistance difference can be calculated according to the following formulas.
R d i s c h a r g i n g = V D c h , 10 V D c h , 0 I D c h R c h a r g i n g = V C h a , 10 V C h a , 0 I C h a
where I C h a denotes the charging pulse current (0.5 A), while I D c h represents the discharge pulse current (−0.5 A); V D c h , 0 and V C h a , 0 correspond to the battery voltage before applying the negative and positive pulse current segments, respectively; and V D c h , 10 and V C h a , 10 indicate the voltage after 10 s discharge and charge operations.
By processing the low-temperature charging cycle results at different C-rates, the evolution curves of battery charge/discharge internal resistance versus State of Charge (SOC) were calculated. To eliminate errors caused by dimensional differences in data and enhance data comparability for more accurate lithium-plating detection, we selected the internal resistance at SOC = 0.1 as the normalization reference point. The normalization procedure was algorithmically implemented through the following sequential steps: (1) cubic spline interpolation of the original SOC-dependent resistance distribution with adjacent interpolation points spaced at ΔSOC = 0.1% intervals; (2) extraction of resistance values at SOC = 10 ± 0.5% through a moving average filtering process; and (3) normalization of all resistance values relative to the SOC = 0.1 baseline. Measurement variability in charge–discharge internal resistance was quantified through three independent experimental replicates, with the maximum relative standard deviation generated during baseline resistance determination being consistently maintained below 5% across all trials. The normalized charge/discharge internal resistance results after 30 cycles at −10 °C are presented in Figure 5a and Figure 5b, respectively. Despite variations in CC phase durations across different C-rates, the internal resistance evolution patterns still exhibit systematic regularity.
As illustrated in Figure 5a, the charging internal resistance profiles can be categorized into two distinct evolution patterns: a U-shaped profile characterized by an initial decrease followed by an increase, and an L-shaped profile exhibiting a monotonically decreasing trend. Under low charging rates (1/6 C, 1/3 C, and 1/2 C), the charging resistance demonstrates a characteristic initial-decrease-and-then-increase (U-shaped) pattern—consistent with typical internal resistance evolution during battery charging. This U-shaped resistance profile indicates minimal or negligible lithium-plating occurrence at low C-rates. The low capacity-fade rates observed for pulse current charging at these rates, as documented in Table 4 of Section 3.1, further corroborate this conclusion. However, under high charging rates (1 C and 1.5 C), the charging internal resistance exhibits a persistent-decrease (L-shaped) trend. This phenomenon arises because lithium plating induces subsequent lithium stripping and re-intercalation reactions during the pulse discharge and rest phases, where the anode potential gradually rises above 0 V. This process accompanies the dissipation of concentration polarization and reduction of active material availability, leading to an abnormal decline in relaxation voltage that manifests as the L-shaped resistance profile during late charging stages. Table 4 reveals significant capacity degradation after 30 low-temperature cycles at both high rates, primarily attributed to lithium inventory loss caused by lithium plating. These distinct resistance patterns (U-shaped vs. L-shaped) establish our primary detection criteria for lithium-plating occurrence.
Regarding the discharge internal resistance curves shown in Figure 5b, the evolutionary pattern at the terminal stage is less pronounced compared to the charging internal resistance due to the superposition of relaxation phases and pulse segments. However, when lithium plating does not occur during charging, the impedance manifests a distinctive “reverse-hump curve” behavior—defined as a four-stage sequential variation pattern where internal resistance first decreases, then increases, subsequently decreases again, and finally increases with SOC, consequently exhibiting a characteristic peak. This phenomenon is clearly observable in discharge resistance curves under low C-rate charging conditions, as highlighted by red dashed boxes in the figure. Conversely, such behavior becomes indiscernible at higher C-rates. Notably, similar four-stage reverse-hump curves can also be observed in the charging internal resistance profiles shown in Figure 5a. The presence or absence of this four-stage pattern therefore serves as our secondary detection criterion for lithium-plating occurrence during low-temperature battery charging.
By employing the proposed pulse charging method to extract charge/discharge internal resistance and analyzing the evolution of internal resistance versus SOC under low-temperature conditions, this study elucidates the correlation mechanism between resistance characteristics and lithium-plating behavior. Specifically, at low C-rates (≤1/2 C), the charging internal resistance exhibits a characteristic U-shaped evolution (initial decrease followed by subsequent increase), indicative of negligible lithium plating. In contrast, under high C-rates (≥1 C), the persistent L-shaped decline in charging internal resistance is attributed to lithium-stripping reactions and concentration polarization dissipation triggered by lithium plating. Concurrently, discharge internal resistance manifests the defined reverse-hump curve, a four-stage sequential pattern (decrease–increase–decrease–increase) with SOC under lithium plating-free conditions, and the disappearance of this characteristic quadruple-phase fluctuation post-plating confirms the disruption of anode kinetic equilibrium. This dual-criteria analysis—combining U-shaped/L-shaped charging resistance patterns with reverse-hump curve presence/absence in discharge profiles—establishes robust detection methodology for lithium plating in V2G scenarios. These findings provide a theoretical foundation for optimizing battery health management strategies to enhance both economic and operational reliability in practical applications. While the proposed method demonstrates efficacy in cylindrical NMC/graphite cells, its applicability to other chemistries (e.g., LFP or silicon-based anodes) and form factors (e.g., pouch cells) requires further investigation. For instance, pouch cells exhibit distinct thermal and mechanical behaviors due to their laminated structure and lower internal pressure, which may alter polarization dynamics during pulse charging. Additionally, anode materials with higher lithiation potentials (e.g., LTO) or enhanced lithium diffusion kinetics (e.g., silicon composites) may respond differently to pulse protocols, potentially mitigating or exacerbating lithium plating. Notably, Lyu et al. [37] identified correlations between impedance slope changes and overcharging in pouch cells using online dynamic impedance measurements. This suggests comparable impedance evolution patterns across batteries with distinct form factors, highlighting the need for systematic evaluation of chemistry-dependent and form factor-dependent impacts to refine pulse parameters and detection criteria for broader applicability.

3.4. Validation of Results

To validate the correlation between the evolution of internal resistance and lithium-plating behavior, this study employs a dual-method approach combining both in situ and ex situ methodologies. Specifically, relaxation voltage differential analysis and SEM characterization were implemented to verify the accuracy of the proposed lithium-plating detection algorithm.

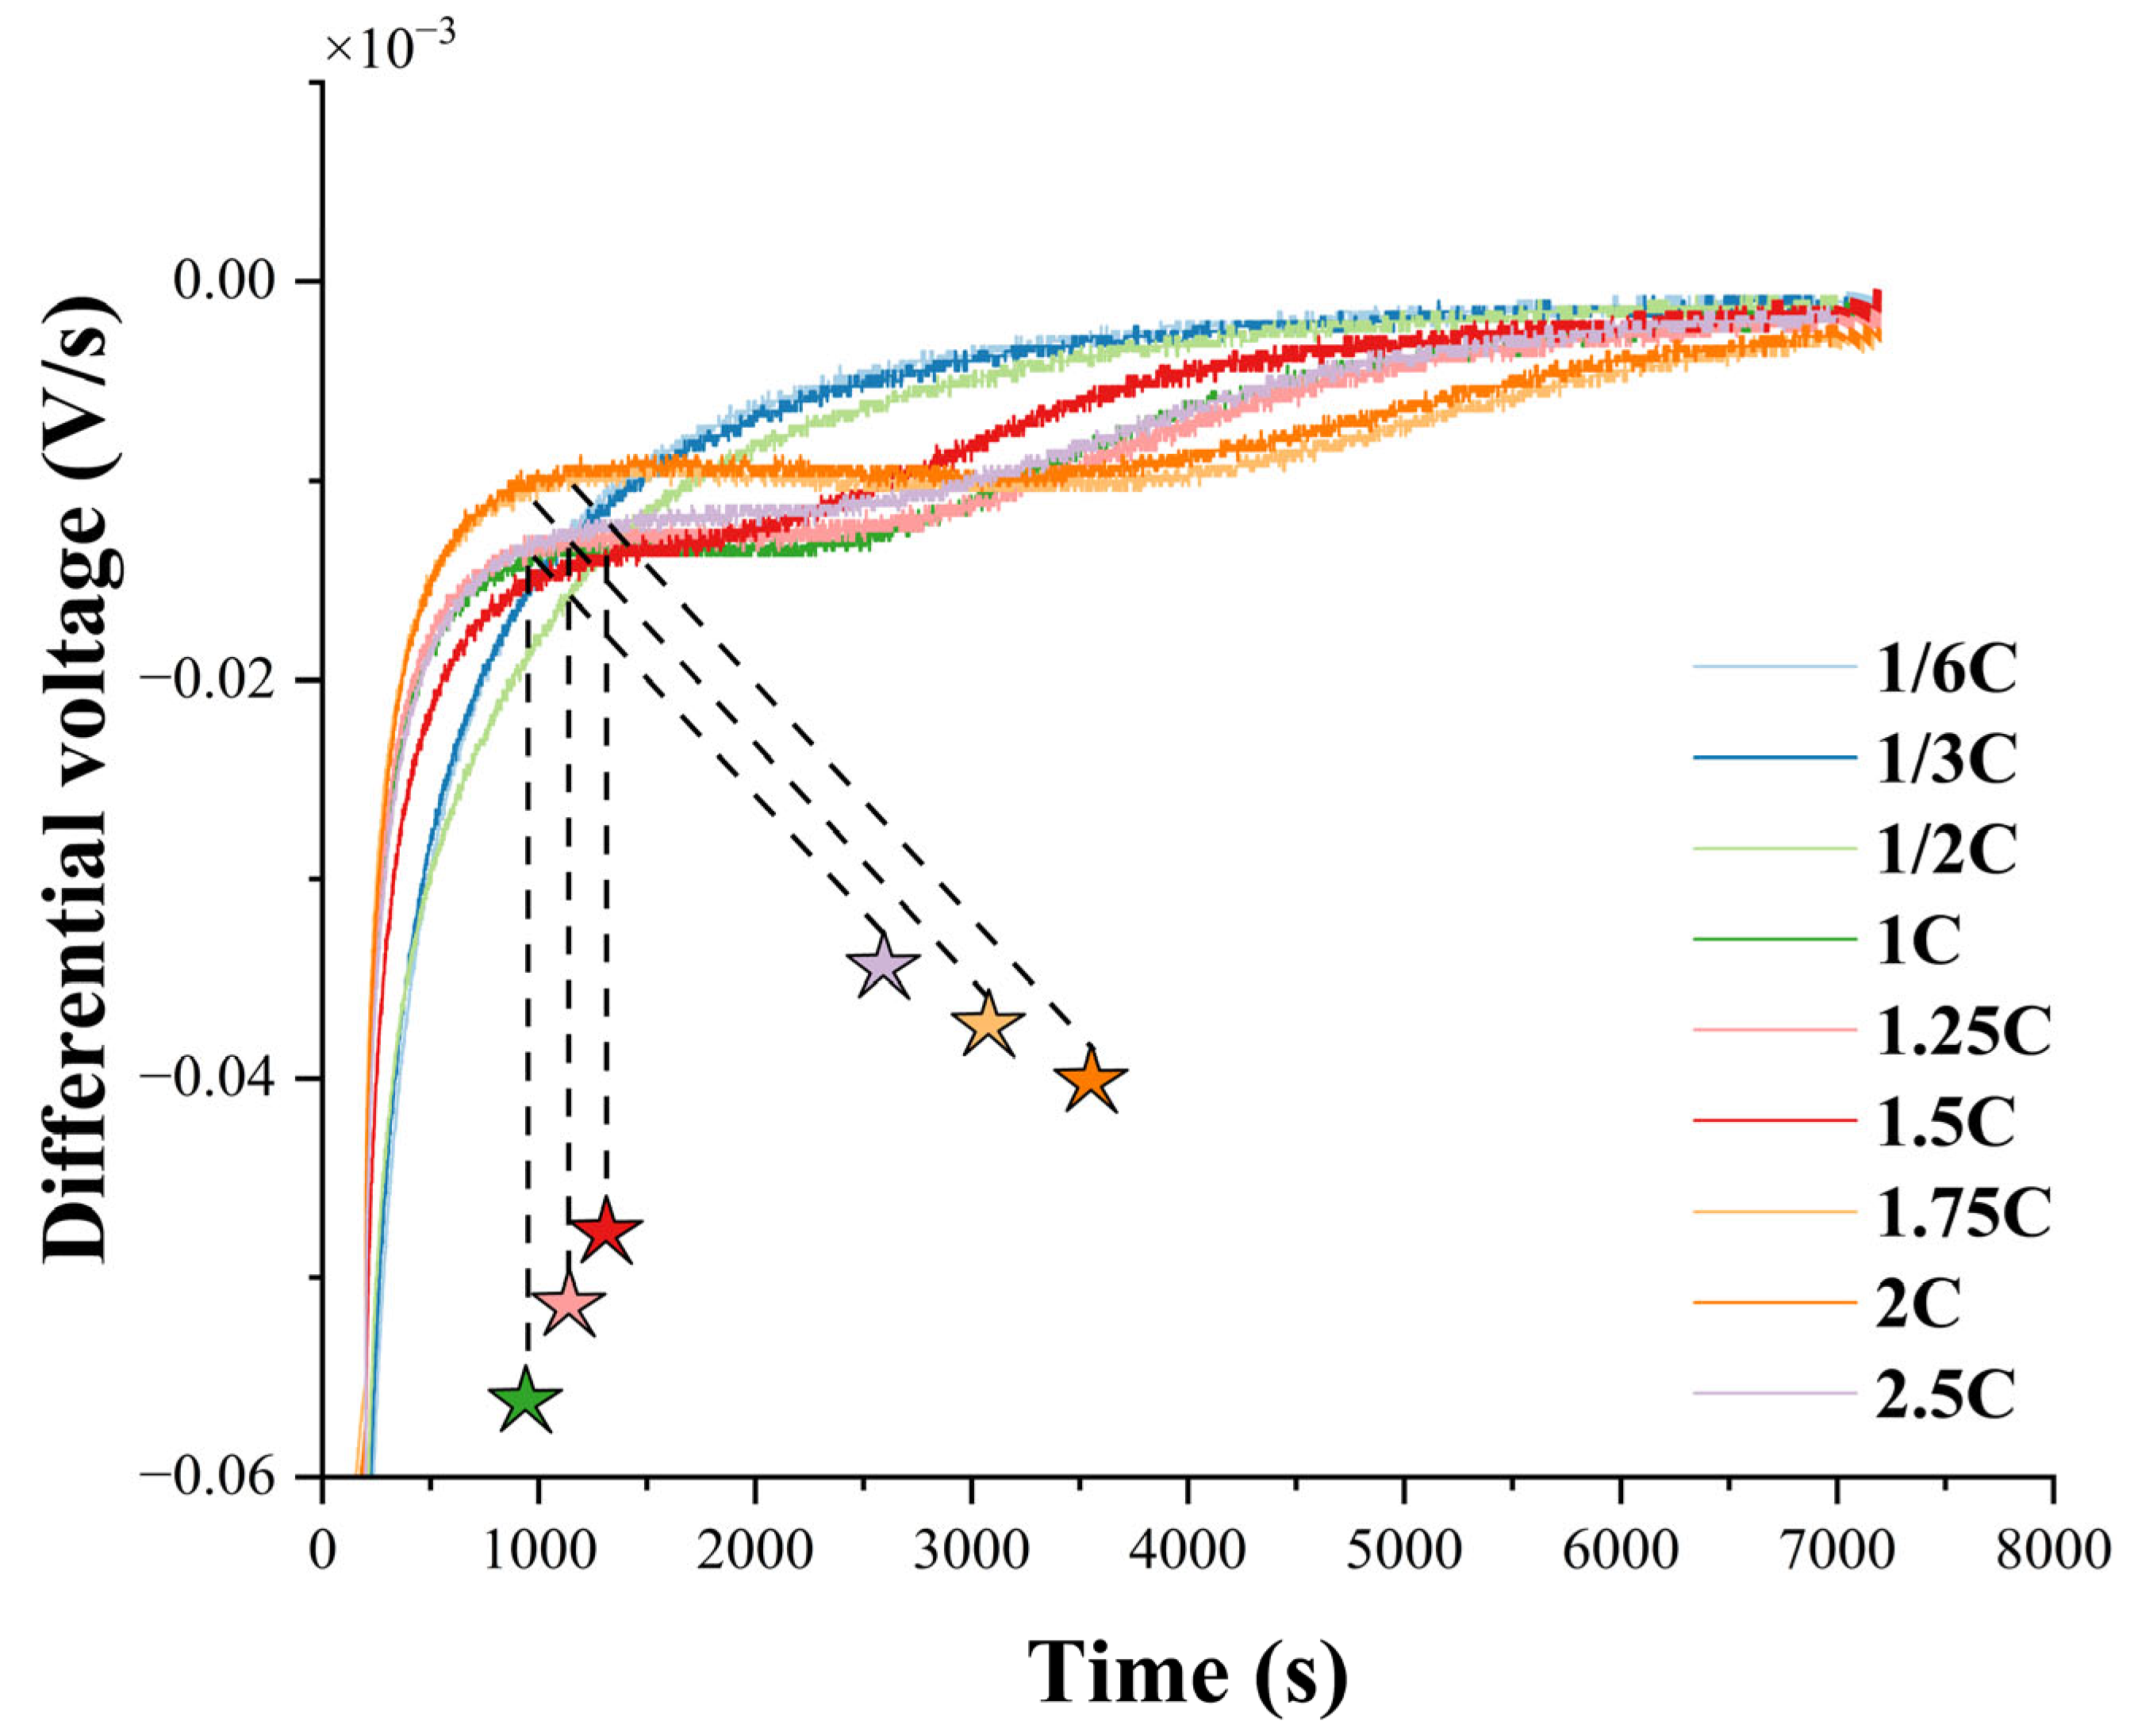
3.4.1. Relaxation Voltage Method

To investigate the critical charging rate for lithium plating in experimental batteries during −10 °C charging, nine identical cylindrical cells were subjected to CC-CV charging tests at different C-rates. Differential voltage curves (Figure 6) were obtained by extracting and differentially processing the relaxation-phase voltage profiles. The dV/dQ analysis revealed distinct rate-dependent characteristics: Starting from 1 C-rate, the dV/dQ curves exhibited a decelerating trend in slope progression during the relaxation period, with the curvature progressively flattening. In contrast, the dV/dQ profiles at 0.5 C and lower rates maintained an exponential increase throughout relaxation. This divergence indicates the emergence of a notable voltage plateau during high-rate operation (≥1 C), suggesting significant lithium plating within the cell, whereas minimal lithium deposition occurred under low-rate conditions. The onset timing of voltage plateau formation was explicitly marked with asterisks in Figure 6. These findings align with the discrimination results derived from internal resistance-trend analysis.

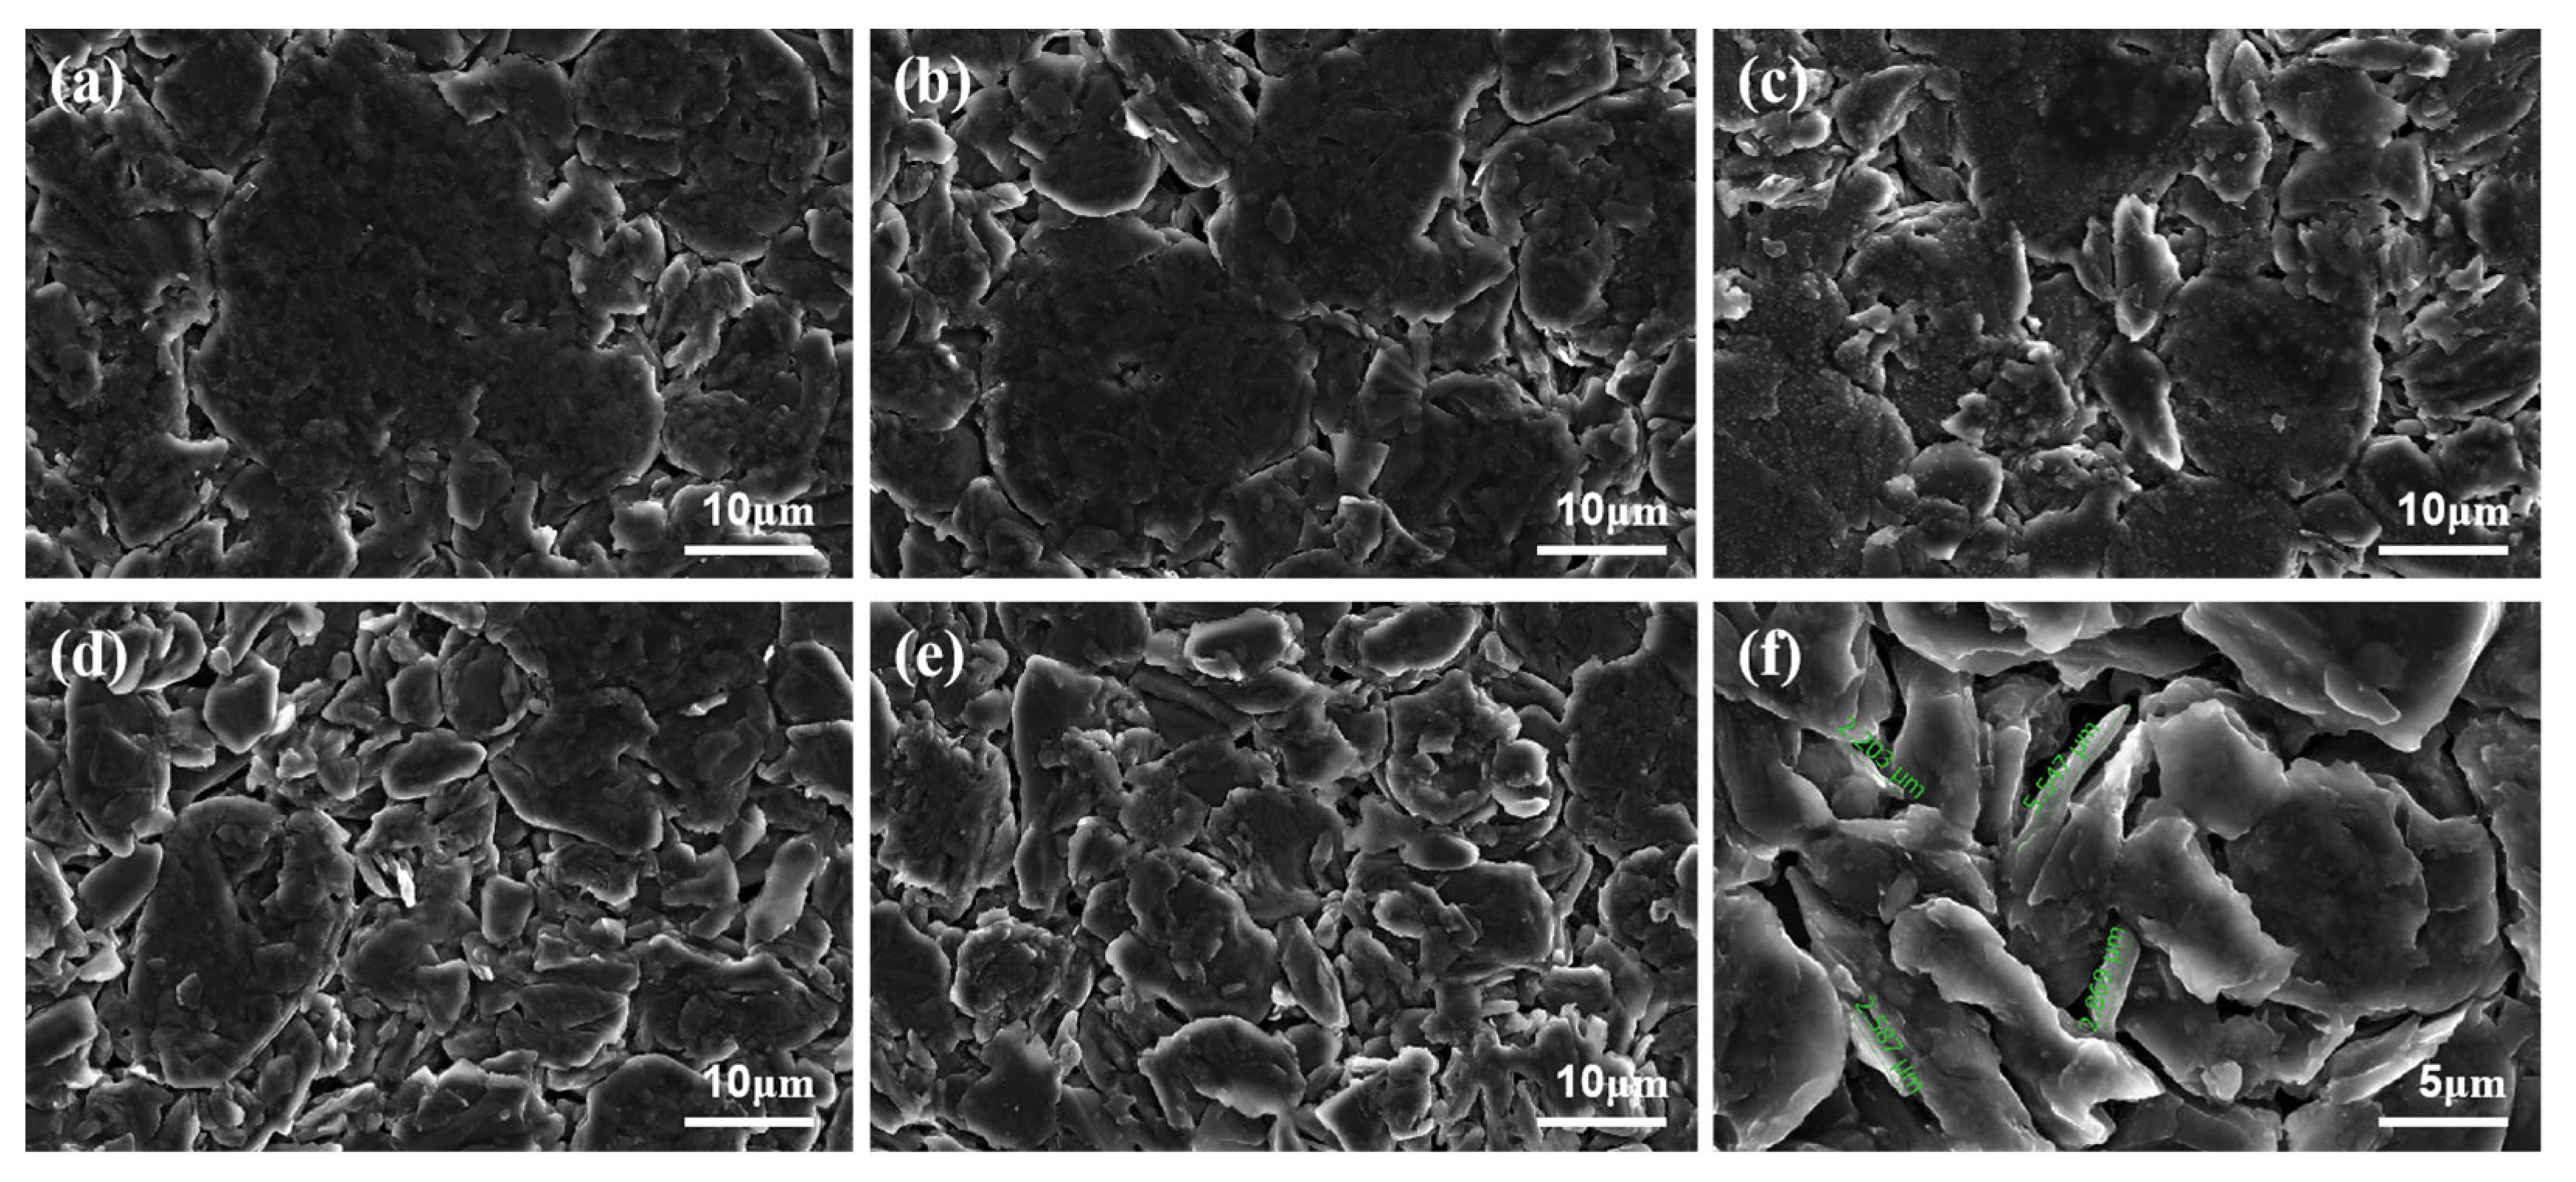
3.4.2. Ex Situ SEM Characterization

To unambiguously assess the battery’s internal aging degree and lithium deposition status on anodes, this study employed an ex situ characterization approach involving cell disassembly and SEM. Five batteries charged via CC-CV protocol at different C-rates were disassembled. Samples collected from identical locations of anode electrodes were immersed in dimethyl carbonate (DMC) to remove residual electrolytes prior to SEM characterization. Figure 7a–f demonstrate a significant positive correlation between anode electrode degradation severity and charging rates. Under 1/6 C low-rate conditions, graphite particles retained intact surface morphology with clear interparticle boundaries and no visible cracks. At 1/3 C, initial cracks preferentially nucleated along crystallographic planes, accompanied by localized delamination of graphite layered structures. When increased to 1.5 C high-rate charging, particle fragmentation rates escalated markedly, forming multi-scale crack networks. Furthermore, graphite interparticle gaps remained pristine at low rates without detectable lithium dendrite growth. However, with charging rates exceeding 1 C, developing lithium dendrites became observable between graphite particles (Figure 7e), a situation that is closely related to SEI failure. Ge et al. [37] demonstrated that a bilayer SEI (inorganic NaF/Na2O inner layer and organic surface) formed at low temperatures effectively suppresses dendrite growth and enhances interfacial stability. The proposed pulse charging method may mitigate localized polarization, promoting homogeneous SEI formation and delaying lithium plating, aligning with the electrolyte-induced SEI regulation mechanisms reported in the literature.
SEM results validate the proposed correlation between capacity fade rates and battery-aging states, with lithium plating identified as the primary causative mechanism. This consistency underscores the accuracy of the proposed pulse charging method in both retarding battery aging and detecting lithium plating.

4. Conclusions

This study addresses capacity degradation and aging issues caused by lithium plating during low-temperature charging of lithium-ion batteries by proposing a novel bidirectional pulse current-charging strategy. Experimental results demonstrate that under −10 °C conditions, this strategy effectively elevates anode potential through intermittent discharge pulses, significantly suppressing lithium dendrite formation and lithium inventory loss. Compared to conventional CC-CV charging, pulse charging achieves a 30–50% reduction in capacity degradation rates at ≥1/2 C, with suppression efficacy intensifying at higher C-rates. Further optimization of pulse parameters enhances dynamic recovery of anode potential, mitigating graphite fragmentation and lithium deposition. The proposed lithium-plating detection method, based on charge/discharge internal resistance trends, reveals that the L-shaped decline in high-rate charging resistance directly correlates with polarization dissipation induced by lithium plating, whereas low-rate charging resistance follows a characteristic U-shaped pattern. The disappearance of the defined reverse-hump curve in discharge resistance further serves as a lithium-plating indicator. Reliability is confirmed through combined relaxation voltage analysis and SEM characterization. Furthermore, this strategy aligns with the pulsed charging/discharging characteristics of V2G scenarios, enabling battery health management using existing bidirectional charging infrastructure while ensuring economic viability and scalability. This work provides theoretical and technical foundations for mitigating low-temperature lithium plating in lithium-ion batteries, offering critical implications for enhancing safety and longevity in electric vehicles and energy storage systems.
While this study focuses on −10 °C conditions where lithium plating is dominant, the method’s applicability under ambient or high-temperature scenarios requires further validation. Future work will investigate temperature-dependent internal resistance variations and extend the approach to diverse battery chemistries and form factors to enhance practicality across broader operating conditions. Furthermore, solid-state electrolytes intrinsically suppress lithium dendrite growth through their mechanical rigidity, while pulse current modulation dynamically regulates lithium-ion flux. This synergistic strategy represents a promising candidate for next-generation battery systems.

Author Contributions

Conceptualization, L.L. and X.H.; methodology, L.L. and Y.W.; software, D.G. and H.W.; validation, L.L., Y.W., and D.G.; formal analysis, L.L.; investigation, L.L.; resources, X.H. and M.O.; data curation, Y.W. and D.G.; writing—original draft preparation, L.L.; writing—review and editing, Y.W. and X.H.; visualization, L.L.; supervision, X.H. and H.W.; project administration, M.O.; funding acquisition, L.S. and M.O. All authors have read and agreed to the published version of the manuscript.

Funding

This work is supported by National Key R&D Program of China under the Grant No. 2023YFC3009900.

Data Availability Statement

The data presented in this study are available from the corresponding author upon request.

Conflicts of Interest

Authors Dongliang Guo and Lei Sun were employed by the company State Grid Jiangsu Electric Power Co., Ltd. The remaining authors declare that the research was conducted in the absence of any commercial or financial relationships that could be construed as a potential conflict of interest.

References

  1. Chigbu, B.I. Advancing sustainable development through circular economy and skill development in EV lithium-ion battery recycling: A comprehensive review. Front. Sustain. 2024, 5, 1409498. [Google Scholar] [CrossRef]
  2. Morita, Y.; Saito, Y.; Yoshioka, T.; Shiratori, T. Estimation of recoverable resources used in lithium-ion batteries from portable electronic devices in Japan. Resour. Conserv. Recycl. 2021, 175, 105884. [Google Scholar] [CrossRef]
  3. Salkuti, S.R. Electrochemical batteries for smart grid applications. Int. J. Electr. Comput. Eng. 2021, 11, 1849–1856. [Google Scholar] [CrossRef]
  4. Du, H.; Zhang, X.; Yu, H. Design of high-energy-density lithium batteries: Liquid to all solid state. eTransportation 2025, 23, 100382. [Google Scholar] [CrossRef]
  5. Nasajpour-Esfahani, N.; Garmestani, H.; Bagheritabar, M.; Jasim, D.J.; Toghraie, D.; Dadkhah, S.; Firoozeh, H. Comprehensive review of lithium-ion battery materials and development challenges. Renew. Sustain. Energy Rev. 2024, 203, 114783. [Google Scholar] [CrossRef]
  6. Wu, S.; Wang, C.; Luan, W.; Zhang, Y.; Chen, Y.; Chen, H. Thermal runaway behaviors of Li-ion batteries after low temperature aging: Experimental study and predictive modeling. J. Energy Storage 2023, 66, 107451. [Google Scholar] [CrossRef]
  7. Wu, H.; Chen, S.; Hong, Y.; Xu, C.; Zheng, Y.; Jin, C.; Chen, K.; He, Y.; Feng, X.; Wei, X. Thermal safety boundary of lithium-ion battery at different state of charge. J. Energy Chem. 2024, 91, 59–72. [Google Scholar] [CrossRef]
  8. Tang, X.; Guo, Q.; Li, M.; Wei, C.; Pan, Z.; Wang, Y. Performance analysis on liquid-cooled battery thermal management for electric vehicles based on machine learning. J. Power Sources 2021, 494, 229727. [Google Scholar] [CrossRef]
  9. Essl, C.; Golubkov, A.W.; Fuchs, A. Influence of aging on the failing behavior of automotive lithium-ion batteries. Batteries 2021, 7, 23. [Google Scholar] [CrossRef]
  10. Divakaran, A.M.; Minakshi, M.; Bahri, P.A.; Paul, S.; Kumari, P.; Divakaran, A.M.; Manjunatha, K.N. Rational design on materials for developing next generation lithium-ion secondary battery. Prog. Solid State Chem. 2021, 62, 100298. [Google Scholar] [CrossRef]
  11. Minakshi, M.; Sharma, N.; Ralph, D.; Appadoo, D.; Nallathamby, K. Synthesis and characterization of Li(Co0.5Ni0.5)PO4 cathode for Li-ion aqueous battery applications. Electrochem. Solid-State Lett. 2011, 14, A86. [Google Scholar] [CrossRef]
  12. Xiong, R.; Pan, Y.; Shen, W.; Li, H.; Sun, F. Lithium-ion battery aging mechanisms and diagnosis method for automotive applications: Recent advances and perspectives. Renew. Sustain. Energy Rev. 2020, 131, 110048. [Google Scholar] [CrossRef]
  13. Xie, W.; He, R.; Gao, X.; Li, X.; Wang, H.; Liu, X.; Yan, X.; Yang, S. Degradation identification of LiNi0.8Co0.1Mn0.1O2/graphite lithium-ion batteries under fast charging conditions. Electrochim. Acta 2021, 392, 138979. [Google Scholar] [CrossRef]
  14. Hoque, M.A.; Nurmi, P.; Kumar, A.; Varjonen, S.; Song, J.; Pecht, M.G.; Tarkoma, S. Data driven analysis of lithium-ion battery internal resistance towards reliable state of health prediction. J. Power Sources 2021, 513, 230519. [Google Scholar] [CrossRef]
  15. Luo, G.; Zhang, Y.; Tang, A. Capacity degradation and aging mechanisms evolution of lithium-ion batteries under different operation conditions. Energies 2023, 16, 4232. [Google Scholar] [CrossRef]
  16. Chen, R.; Miao, S.; Peng, J.; Zhang, K.; Li, Z.; Cai, W.; Jia, Y.; Zhang, X.; Wu, F.; Zhao, J. A review of detecting Li plating on graphite anodes based on electrochemical methods. J. Mater. Chem. A 2024, 12, 33427–33447. [Google Scholar] [CrossRef]
  17. Gao, Z.; Xie, H.; Yang, X.; Niu, W.; Li, S.; Chen, S. The dilemma of c-rate and cycle life for lithium-ion batteries under low temperature fast charging. Batteries 2022, 8, 234. [Google Scholar] [CrossRef]
  18. Zhang, G.; Wei, X.; Han, G.; Dai, H.; Zhu, J.; Wang, X.; Tang, X.; Ye, J. Lithium plating on the anode for lithium-ion batteries during long-term low temperature cycling. J. Power Sources 2021, 484, 229312. [Google Scholar] [CrossRef]
  19. Deng, Z.; Lin, X.; Huang, Z.; Meng, J.; Zhong, Y.; Ma, G.; Zhou, Y.; Shen, Y.; Ding, H.; Huang, Y. Recent progress on advanced imaging techniques for lithium-ion batteries. Adv. Energy Mater. 2021, 11, 2000806. [Google Scholar] [CrossRef]
  20. Tao, M.; Xiang, Y.; Zhao, D.; Shan, P.; Yang, Y. Protocol for quantifying inactive lithium in anode-free lithium batteries by mass spectrometry titration. Commun. Mater. 2022, 3, 50. [Google Scholar] [CrossRef]
  21. Huang, Y.; Perlmutter, D.; Fei-Huei Su, A.; Quenum, J.; Shevchenko, P.; Parkinson, D.Y.; Zenyuk, I.V.; Ushizima, D. Detecting lithium plating dynamics in a solid-state battery with operando X-ray computed tomography using machine learning. Npj Comput. Materials 2023, 9, 93. [Google Scholar] [CrossRef]
  22. Min, H.; Yang, Z.; Yang, F.; Hu, W.; Lei, Y.; Luo, S. Design And Application Of A Smart Interactive Distribution Area For Photovoltaic, Energy Storage And Charging Piles. In Proceedings of the 2023 IEEE 6th International Electrical and Energy Conference (CIEEC), Hefei, China, 12–14 May 2023; pp. 2251–2256. [Google Scholar]
  23. Koseoglou, M.; Tsioumas, E.; Ferentinou, D.; Panagiotidis, I.; Jabbour, N.; Papagiannis, D.; Mademlis, C. Lithium plating detection using differential charging current analysis in lithium-ion batteries. J. Energy Storage 2022, 54, 105345. [Google Scholar] [CrossRef]
  24. Chen, X.; Li, L.; Liu, M.; Huang, T.; Yu, A. Detection of lithium plating in lithium-ion batteries by distribution of relaxation times. J. Power Sources 2021, 496, 229867. [Google Scholar] [CrossRef]
  25. Mojumder, M.R.H.; Ahmed Antara, F.; Hasanuzzaman, M.; Alamri, B.; Alsharef, M. Electric vehicle-to-grid (V2G) technologies: Impact on the power grid and battery. Sustainability 2022, 14, 13856. [Google Scholar] [CrossRef]
  26. Du, P.; Liu, T.; Chen, T.; Jiang, M.; Zhu, H.; Shang, Y.; Goh, H.H.; Zhao, H.; Huang, C.; Kong, F. Enhancing green mobility through vehicle-to-grid technology: Potential, technological barriers, and policy implications. Energy Environ. Sci. 2025. [Google Scholar] [CrossRef]
  27. Kumar, D.S.; Krishnan, S.B.; Sharma, A.; Tak, T.K.; Rathore, A.K. Vehicle-to-Grid (V2G) Technology: Global Scenario, Future Scope, Challenges, and Implementation. In Proceedings of the 2024 IEEE International Conference on Power Electronics, Drives and Energy Systems (PEDES), Mangalore, India, 18–21 December 2024; pp. 1–6. [Google Scholar]
  28. Sufyan, M.; Rahim, N.; Muhammad, M.A.; Tan, C.K.; Raihan, S.R.S.; Bakar, A. Charge coordination and battery lifecycle analysis of electric vehicles with V2G implementation. Electr. Power Syst. Res. 2020, 184, 106307. [Google Scholar] [CrossRef]
  29. Leippi, A.; Fleschutz, M.; Murphy, M.D. A review of ev battery utilization in demand response considering battery degradation in non-residential vehicle-to-grid scenarios. Energies 2022, 15, 3227. [Google Scholar] [CrossRef]
  30. Schindler, S.; Bauer, M.; Petzl, M.; Danzer, M.A. Voltage relaxation and impedance spectroscopy as in-operando methods for the detection of lithium plating on graphitic anodes in commercial lithium-ion cells. J. Power Sources 2016, 304, 170–180. [Google Scholar] [CrossRef]
  31. Koleti, U.R.; Dinh, T.Q.; Marco, J. A new on-line method for lithium plating detection in lithium-ion batteries. J. Power sources 2020, 451, 227798. [Google Scholar] [CrossRef]
  32. Pan, Y.; Ren, D.; Han, X.; Lu, L.; Ouyang, M. Lithium plating detection based on electrochemical impedance and internal resistance analyses. Batteries 2022, 8, 206. [Google Scholar] [CrossRef]
  33. Xu, X.; Tang, S.; Han, X.; Lu, L.; Qin, Y.; Du, J.; Wu, Y.; Li, Y.; Yu, C.; Sun, X. Flexible bidirectional pulse charging regulation achieving long-life lithium-ion batteries. J. Energy Chem. 2024, 96, 59–71. [Google Scholar] [CrossRef]
  34. Waldmann, T.; Wilka, M.; Kasper, M.; Fleischhammer, M.; Wohlfahrt-Mehrens, M. Temperature dependent ageing mechanisms in Lithium-ion batteries–A Post-Mortem study. J. Power Sources 2014, 262, 129–135. [Google Scholar] [CrossRef]
  35. Chen, Y.; Torres-Castro, L.; Chen, K.-H.; Penley, D.; Lamb, J.; Karulkar, M.; Dasgupta, N.P. Operando detection of Li plating during fast charging of Li-ion batteries using incremental capacity analysis. J. Power Sources 2022, 539, 231601. [Google Scholar] [CrossRef]
  36. Zhang, Y.; Li, X.; Su, L.; Li, Z.; Liaw, B.Y.; Zhang, J. Lithium plating detection and quantification in Li-ion cells from degradation behaviors. ECS Trans. 2017, 75, 37. [Google Scholar] [CrossRef]
  37. Ge, B.; Deng, J.; Wang, Z.; Liang, Q.; Hu, L.; Ren, X.; Li, R.; Lin, Y.; Li, Y.; Wang, Q. Aggregate-Dominated Dilute Electrolytes with Low-Temperature-Resistant Ion-Conducting Channels for Highly Reversible Na Plating/Stripping. Adv. Mater. 2024, 36, 2408161. [Google Scholar] [CrossRef]
Figure 1. Experimental setup. (a) Overall charging voltage profile. (b) Partial charging current profile. (c) Single-cycle pulse voltage. (d) Single-cycle pulse current.
Batteries 11 00200 g001
Figure 2. Schematic illustration of lithium plating/stripping during pulsed charging processes. (a) CC charging phase. (b) Discharge pulse. (c) Charge pulse. (d) Relaxation.
Batteries 11 00200 g002
Figure 3. Capacity decay rate for different charging conditions at −10 °C: (a) 1/6 C, (b) 1/3 C, (c) 1/2 C, (d) 1 C, and (e) 1.5 C. Data are smoothed by spline function.
Batteries 11 00200 g003
Figure 4. Capacity variation curves and final decay rates during cycling with (a,b) varying pulse amplitudes and (c,d) varying pulse periods.
Batteries 11 00200 g004
Figure 5. Normalized internal resistance profiles under various C-rates: (a) charging internal resistance and (b) discharging internal resistance. The reference resistance was acquired at SOC = 0.1.
Batteries 11 00200 g005
Figure 6. Relaxation voltage curves at different C-rates at −10 °C. Dotted lines with stars denote the initiation time of voltage plateau formation.
Batteries 11 00200 g006
Figure 7. Morphological evolution of anode electrodes under varied C-rates and localized lithium dendrite characterization: (ae) SEM micrographs of anode surfaces at 1/6 C, 1/3 C, 1/2 C, 1 C, and 1.5 C. (f) Higher-magnification SEM image of localized lithium dendrite formation.
Batteries 11 00200 g007
Table 1. Proposed method vs. State-of-the-Art in situ strategies for lithium-plating detection.
MethodDetection
Accuracy
Testing
Duration
V2G Application Feasibility
Arrhenius method [34]QualitativeLongNo
Incremental capacity analysis [35]QuantitativeShortNo
Internal resistance-capacity method [36]QualitativeLongYes
Voltage relaxation method [23,24]QuantitativeModerateNo
Electrochemical impedance spectroscopy analysis [30]QualitativeShortNo
Dynamic discharge detection method [32]QualitativeModerateYes
Proposed methodQualitativeShortYes
Table 2. Detailed information of the tested lithium-ion battery.
INR21700-M50 NMC Li-Ion Batteries
Positive electrodeNMC811
Dimensions (D × H)21.44 mm × 70.60 mm
Weight68.2 g ± 1.0 g
Nominal voltage3.69 V
Nominal capacity5000 mAh
Charging cut-off voltage4.20 V
Discharging cut-off voltage2.50 V
ManufacturerLG-Chem
Table 3. Detailed setup of the experiments.
No.Charging
C-Rate
Pulse ParametersNo.Charging
C-Rate
Pulse Parameters
AmplitudePeriodAmplitudePeriod
#1-11/6 CWithout Pulse#2-11/6 C0.1 C40 s
#1-21/3 C#2-21/3 C
#1-31/2 C#2-31/2 C
#1-41 C#2-41 C
#1-51.5 C#2-51.5 C
#3-11/3 C0.1 C40 s#4-11/3 C0.1 C40 s
#3-20.2 C#4-230 s
#3-30.3 C#4-320 s
#3-40.4 C#4-410 s
All pulse protocols consist of sequential phases: 10 s discharge, 10 s rest, 10 s charge, and 10 s final rest, yielding a duty cycle of 50%.
Table 4. Capacity change ratio of low-temperature charging.
Constant CurrentPulse Current
C-RateCapacity Change RatioC-RateCapacity Change Ratio
1/6 C−0.371/6 C−0.61
1/3 C−0.721/3 C−1.03
1/2 C−1.091/2 C−0.25
1 C−4.891 C−0.70
1.5 C−12.101.5 C−3.72
Disclaimer/Publisher’s Note: The statements, opinions and data contained in all publications are solely those of the individual author(s) and contributor(s) and not of MDPI and/or the editor(s). MDPI and/or the editor(s) disclaim responsibility for any injury to people or property resulting from any ideas, methods, instructions or products referred to in the content.

