Article

A Thermal Runaway Protection Strategy for Prismatic Lithium-Ion Battery Modules Based on Phase Change and Thermal Decomposition of Sodium Acetate Trihydrate

1
Hubei Research Center for New Energy & Intelligent Connected Vehicle, School of Automotive Engineering, Wuhan University of Technology, Wuhan 430070, China
2
School of Naval Architecture, Ocean and Energy Power Engineering, Wuhan University of Technology, Wuhan 430063, China
3
Research Institute of State Grid Zhejiang Electric Power Co., Ltd., Hangzhou 310006, China
4
School of Mechanical and Automotive Engineering, Shanghai University of Engineering Science, Shanghai 201620, China
*
Authors to whom correspondence should be addressed.
Batteries 2025, 11(5), 198; https://doi.org/10.3390/batteries11050198
Submission received: 16 April 2025 / Revised: 11 May 2025 / Accepted: 15 May 2025 / Published: 17 May 2025
(This article belongs to the Section Battery Modelling, Simulation, Management and Application)

Abstract

:
With the rapid development of battery energy storage technology, the issue of thermal runaway (TR) in lithium-ion batteries has become a key challenge restricting their safe application. This study presents an innovative protection strategy that integrates liquid cooling with sodium acetate trihydrate (SAT)-based composite phase change materials (CPCM) to mitigate TR and its propagation in prismatic battery modules. Through numerical simulation, this study systematically investigates the TR protection mechanism and optimization pathways for prismatic battery modules. The results indicate that pure SAT exhibits poor latent heat performance due to its low thermal conductivity. In contrast, the incorporation of expanded graphite (EG) significantly enhances thermal conductivity and improves the overall latent heat performance. Compared to traditional paraffin-expanded graphite (PA-EG), SAT-EG, with a latent heat 4.8 times higher than that of PA-EG, demonstrates more than six times the effectiveness in delaying thermal runaway propagation (TRP). When combined with liquid cooling, the TR protection effect is further enhanced, and TR will not be triggered when the initial abnormal heat generation rate is relatively low. Even if an abnormal battery experiences TR, its propagation will be prevented when the thickness of the SAT-EG exceeds 12 mm. Ambient temperature influences both the peak temperature and the timing of its occurrence in the battery module. Among the different liquid cooling layouts, the combined bottom and side cooling scheme exhibits superior performance compared to the standalone schemes.

1. Introduction

Lithium-ion batteries, due to their high energy density, long cycle life, and low environmental impact, have become the mainstream choice for electric vehicles and energy storage systems [1,2]. The energy density of commercial batteries has nearly doubled in recent years, increasing from 150 Wh/kg to 300 Wh/kg, primarily due to improvements in cathode materials [3]. To further enhance specific energy, manufacturers optimize material systems by adopting high-specific-energy cathode materials, thickening electrodes, and thinning separators and current collectors, while also developing larger-capacity single batteries [4]. However, this pursuit of high energy density is pushing the battery closer to its safety limits [5], and under extreme conditions, it may lead to TR, resulting in safety incidents [6,7].
The TR process in lithium-ion batteries is complex and is typically initiated by internal exothermic reactions, leading to a rapid rise in temperature. This involves the decomposition of cathode and anode materials, side reactions in the electrolyte, and the melting of the separator, among other processes [8]. These side reactions usually do not occur under normal operating conditions but are triggered under abuse conditions, such as mechanical abuse (compression, puncture) [9,10,11], electrical abuse (overcharge, overdischarge, short circuit) [12,13,14,15], or thermal abuse (external high temperatures or poor heat dissipation) [16,17,18,19]. When the temperature exceeds a threshold, TR is triggered, potentially causing the battery temperature to rise rapidly above 600 °C [20], resulting in battery rupture and fire.
To address the issue of TR, various thermal management technologies have been developed. Xu et al. [21] proposed protecting prismatic batteries through a microchannel cooling system; however, TR may still occur if the liquid cooling system fails, highlighting the need for redundant cooling solutions. Phase change materials (PCMs), as passive thermal management methods, regulate battery temperature by absorbing and releasing heat, demonstrating significant advantages [22,23]. Virendra et al. [24] found that the use of CPCM materials could delay the triggering time of TR by approximately 20 min. Krishnadash et al. [25] proposed a hybrid cooling method combining PCM with cooling plates, which effectively prevents the TR chain reaction and limits temperature rise.
However, many organic PCM materials are highly flammable, which may exacerbate the TRP in batteries [26]. In contrast, inorganic PCMs, such as hydrated salts, possess high latent heat and non-flammable properties, leading to increasing research on the application of inorganic PCMs in battery thermal management systems (BTMS) [27]. Kharbanda et al. [28] simulated the dissociation process of MgSO4·7H2O using a model, while Stengler et al. [29] found that SrBr2·H2O exhibited superior thermal energy storage performance at high temperatures. Ling et al. [30] improved the stability of inorganic PCMs through multi-scale encapsulation. Galazutdinova et al. [31] experimentally verified the effectiveness of inorganic PCMs in delaying TR, reducing the trigger temperature from 200 °C to 100 °C, with the adjacent battery temperature reaching 63.5 °C. Cao et al. [32] proposed a passive BTMS based on a SAT-EG composite and successfully established and validated the two-stage heat storage process of SAT.
Although inorganic PCMs have great potential in BTMS, research on their applications remains limited. Studies have shown that SAT, as a thermochemical heat storage material, demonstrates significant potential in TR protection for batteries. When combined with EG, SAT’s thermal conductivity is significantly enhanced, allowing it to more efficiently regulate battery temperature. During TR, the thermal decomposition of SAT effectively suppresses the TRP, thereby reducing safety risks. The raw material cost of SAT is significantly lower than that of PA, making SAT-EG more economical for large-scale applications. Although composite preparation and encapsulation processes may introduce some additional costs, the higher latent heat per unit mass of SAT-EG ensures a superior overall cost–performance ratio. In terms of processing, the preparation of SAT-EG requires strict control of temperature, humidity, and mixing conditions to prevent premature dehydration and phase separation. While PA-EG is simpler to process, it is more prone to leakage at high temperatures, which places higher demands on packaging stability. Regarding lifecycle and cycling stability, SAT-EG’s phase change process is reversible under normal operating conditions, offering some level of cycling stability. However, prolonged cycling over time may lead to a decline in latent heat performance. Although irreversible dehydration may occur under extremely high temperatures, SAT-EG still outperforms PA-EG in TR scenarios, demonstrating superior thermal protection capability.
Battery energy storage stations represent a critical application scenario for TR protection, typically facing fewer spatial layout constraints but imposing stricter thermal safety requirements. To address these challenges, this study proposes a TR protection strategy that integrates hydrated salt with a liquid cooling system. By combining the batteries, liquid cooling components, and SAT into a unified battery module, this strategy aims to prevent or delay the onset and propagation of TR, thereby ensuring the safe operation of battery energy storage stations.

2. Numerical Model

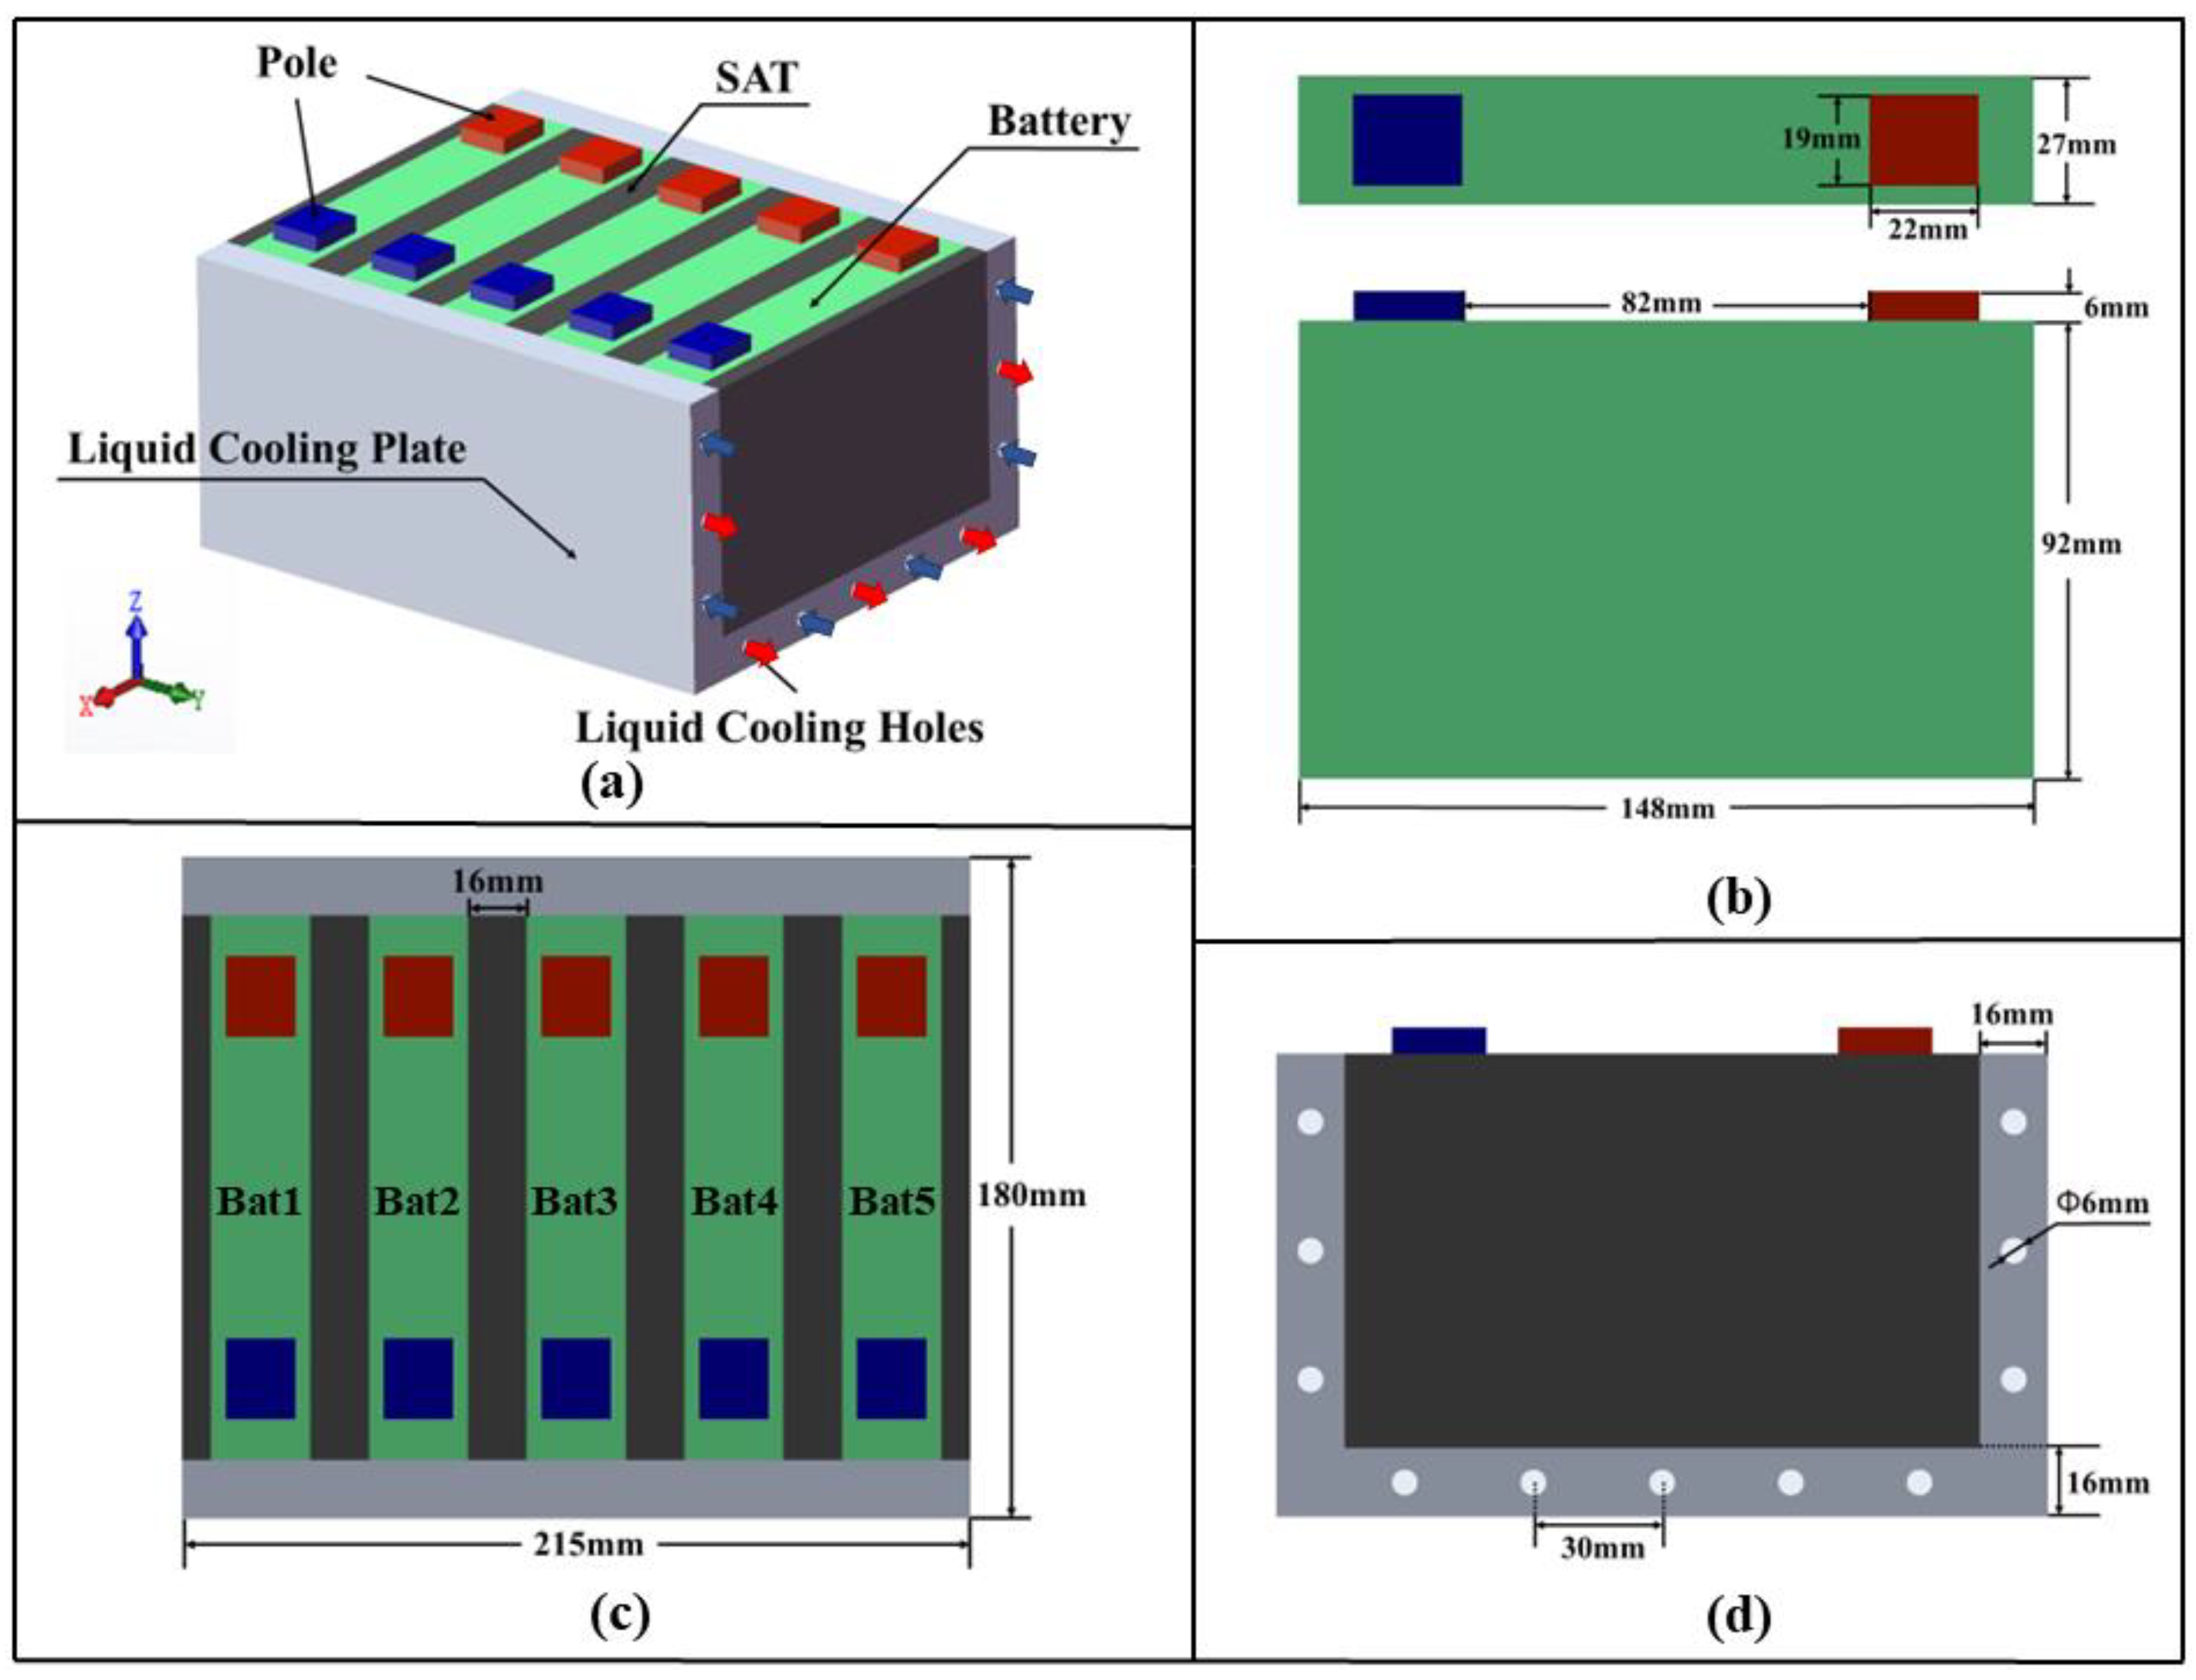
2.1. Geometric Model

In practical battery energy storage station scenarios, the CPCM is encapsulated between batteries, with a certain external pressure applied to both ends of the module. However, freedom of expansion is retained along the grouping direction, which effectively reduces internal pressure within the module. In addition, the SAT-EG exhibits flexibility, providing mechanical buffering to accommodate battery swelling. This study focuses on TR protection for a battery module consisting of five prismatic batteries, as shown in Figure 1a.
Liquid cooling plates are arranged on both the bottom and sides of the battery module. The cooling plates contain parallel circular channels and utilize a counterflow arrangement, with water as the coolant. The material properties of the battery and the liquid cooling system are listed in Table 1. A certain thickness of SAT [32] is filled between each individual battery, with the material properties provided in Table 2. Figure 1b–d depict the dimensions of a single battery, the battery numbering, and the channel dimensions, respectively.
Prior to establishing the simulation model, the lithium-ion battery is modeled under the following assumptions: (1) battery materials are considered uniform, with constant density throughout operation; (2) owing to limited electrolyte mobility, internal convective and radiative heat transfer are neglected; (3) both specific heat capacity and thermal conductivity are treated as fixed values; (4) battery swelling is neglected; (5) the batteries and their behavior are assumed to be identical.

2.2. Mathematical Model of Battery

2.2.1. Battery Thermal Runaway Heat Generation Model

The heat generation rate of the battery varies significantly under different abuse conditions, and the occurrence times of side reactions and internal short circuits also differ. Therefore, in this study, the initial abnormal heat generation rate of the battery is set as P0 (W), and by varying the value of P0, the TR triggering process of the battery module under different heating conditions is simulated.
The primary heat source for battery TR comes from chemical reactions. The chemical reaction rate d c r x n d τ varies with temperature T, and is modeled using an empirical equation [33]:
d c rxn d τ = 0 ( T T 1 ) M C p Δ H A ( T T Ref ) b ( 0 c rxn 1 ,   T 1 < T T 2 ) C ( 0 c rxn 1 ,   T > T 2 )
where T 1 = 99 °C is the temperature at which side reactions begin. Before the temperature reaches T 1 , the heat generated by the side reactions can be neglected. T 2 = 132.7 °C is the critical temperature for TR, and once the temperature exceeds T 2 , the battery undergoes rapid TR and releases a large amount of heat. M and Cp is the mass and specific heat capacity of the battery, respectively. Δ H = 582.9 kJ is the total energy released by the battery during the entire TR process, A = 0.92 s−1 is the pre-exponential factor, b = 28.5 is the reaction order, and the constant C = 12 s−1.
During the TR process, the rate of temperature rise in the battery d T d τ can be determined by the following relationship:
Δ H d c rxn d τ = M C p d T d τ

2.2.2. Battery Heat Transfer Model

A portion of the heat generated by the battery is absorbed by the battery itself, leading to a temperature rise, while the rest is dissipated to the environment through conduction, convection, and radiation. Since radiation heat transfer is relatively small, and the convection effect is weak due to the limited flow of the electrolyte, these two heat dissipation mechanisms are typically neglected in engineering calculations. Therefore, heat conduction is the dominant mechanism for heat transfer in the battery, and its process follows Fourier’s law. The accumulation of heat in the battery is determined by both internal heat generation and external heat flow. By extending Fourier’s law to a three-dimensional coordinate system and combining it with the principle of energy conservation, the heat conduction governing equation can be obtained:
ρ C p T t = λ x 2 T x 2 + λ y 2 T y 2 + λ z 2 T z 2 + Q v
where ρ is the volume density (kg/m3), C p is the specific heat capacity at constant pressure (J/(kg·K)), λ x , λ y , and λ z are the thermal conductivities in the x/y/z directions (W/(m·K)), and Q v is the volumetric heat generation rate (W/m3). This equation quantifies the anisotropic heat transfer through the thermal conductivity tensor.

2.3. Mathematical Model of SAT Phase Change and Thermal Decomposition

In the simulation, SAT is assumed to exhibit the following characteristics: (1) each phase maintains constant physical properties; (2) the liquid phase is treated as incompressible; (3) the material is homogeneous with isotropic thermal conductivity.
The heat storage mechanism of SAT includes sensible, latent, and thermochemical heat. During the process, when the temperature of the SAT increases from the initial temperature to the phase change temperature, heat is absorbed in the form of sensible heat. During the phase change process, a large amount of heat is stored in the SAT in the form of latent heat. After the phase change is complete, the SAT temperature continues to rise, and heat is absorbed again in the form of sensible heat. When the SAT temperature exceeds the decomposition temperature, the SAT undergoes decomposition, absorbing a large amount of heat through chemical reactions. After thermal decomposition, SAT primarily produces anhydrous sodium acetate (ASA) and water vapor. ASA is a non-flammable stable solid, posing no direct risk to batteries. Although water vapor may cause a local increase in humidity, its impact can be controlled through proper sealing and system design.
For the sensible and latent heat of SAT, the apparent heat capacity method is used, expressed as:
ρ SAT C p , e f f T t = ( k SAT T )
where ρ SAT , C p , e f f , and k SAT are the density, equivalent specific heat capacity, and thermal conductivity of the SAT, respectively. C p , e f f varies with temperature as follows:
C p , e f f = C p , s T T s ( 1 β ) C p , s + β C p , l + L SAT T l T s T s < T < T l C p , l T T l
β = 0   T T s T SAT T s T l T s   T s < T < T l 1   T T l
where T s and T l represent the critical temperatures at the onset (solid phase) and completion (liquid phase) of the phase change, respectively. C p , s and C p , l represent the specific heat capacities of the SAT in solid and liquid phases, respectively. L SAT is the phase change enthalpy of SAT, T SAT is the temperature of SAT, and β is the liquid fraction of SAT.
During the thermochemical heat storage phase, the heat absorbed per unit time can be calculated by multiplying the reaction heat by the reaction rate:
q ˙ = Δ H dec r
where q ˙ is the heat from the reaction per unit time, Δ H dec is the chemical reaction heat of SAT, and r is the reaction rate.
As the chemical reaction progresses, the concentration of SAT ( C A ) gradually decreases, and r is the rate of change of concentration with respect to time, calculated as the derivative of C A with respect to time:
r = d C A d t = d [ C A 0 ( 1 α ) ] d t = C A 0 d α d t = C A 0 d α d T d T d t = C A 0 β d α d T
where C A 0 is the initial concentration of SAT, α is the degree of chemical reaction, and β is the heating rate of the SAT.
d α d t can be calculated using the Arrhenius equation:
d α d t = A e x p ( E a R T ) G ( α )
where A is the pre-exponential factor, with a value of 7.841 × 10¹⁶ s−1, E a is the activation energy, with a value of 1.4767 × 10⁵ J/mol [32].

2.4. Mathematical Model of Liquid Cooling

Liquid cooling achieves heat exchange through convective heat transfer. The mass, momentum, and energy equations are as follows:
ρ w t + ( ρ w v ) = 0
t ( ρ w ν ) + ( ρ w ν ν ) = p + ( μ ν )
t ρ w C p , w T w + ρ w C p , w v T w = ( k w T w )
where ρ w , v , and μ represent the density, velocity vector, and dynamic viscosity of the cooling fluid, respectively. C p , w , T w , k w , and p denote its specific heat capacity, temperature, thermal conductivity, and static pressure, respectively.

2.5. Boundary and Initial Conditions

The convective heat transfer boundary conditions between the battery and SAT, the battery and the Al plate, and the SAT and the Al plate are as follows:
k b T b n b = k SAT T SAT n SAT
k b T b n b = k Al T Al n Al
k SAT T SAT n SAT = k Al T Al n Al
where n represents the outward normal direction of each component’s outer surface, and T n represents the corresponding temperature gradient. T b   T SAT , and T Al denote the temperatures of the battery, SAT, and Al plate, respectively, while k b , k SAT , and k Al are their respective thermal conductivities.
In a non-adiabatic environment, the heat transfer between the battery module and its surrounding environment must be taken into account, which primarily involves the natural convection heat transfer process. According to Newton’s law of cooling, this heat transfer can be expressed as:
q = h ( T m T amb )
where q represents the heat flux density (W/m2); h is the convective heat transfer coefficient between the surface of the battery module and the environment (W/(m2·K)). T m and T amb denote the surface temperature of the battery module and the ambient temperature, respectively (K).
In addition, the initial conditions are set as T = Tamb and v = v0, where v0 denotes the inlet velocity of the coolant. The inlet of the cooling hole is defined as a velocity inlet boundary condition, the outlet is set as a pressure outlet boundary condition, and no-slip boundary conditions are applied to all other surfaces.

3. Results and Discussion

3.1. Model Validation

3.1.1. Validation of the Thermal Runaway Model

To validate the accuracy of the TR model for lithium-ion batteries, this study reproduces the experimental conditions from reference [33] and constructs the geometric model shown in Figure 2a. In addition to the four adjacent batteries, the model also includes a heater composed of six heating rods, with a total heating power of 1700 W. In the 3D model, temperature measurement points are set at the center of the four batteries to maintain consistency with the experiment.
The simulation values for each temperature probe are compared with the experimental values, as shown in Figure 2b. The simulated temperatures are slightly lower than the experimental values, consistent with the trend observed in reference [33]. In the experiment, the TR times for Bat1, Bat2, Bat3, and Bat4 were 624 s, 724 s, 850 s, and 982 s, respectively. In the simulation, the TR times were 617 s, 728 s, 845 s, and 962 s. The accuracy of the simulation model in predicting the battery TR time is over 95%, showing good agreement with the experimental data.

3.1.2. Validation of the SAT Phase Change and Thermal Decomposition Model

To verify the accuracy of the SAT phase change and thermal decomposition model, this study also constructed a corresponding simulation model based on the experiment [32]. In this model, a heating rod is used to replace the 18,650 battery, and a 5 mm thick SAT layer is wrapped around the outer surface of the heating rod. The positions of the temperature probes are the same as in the experiment.
Figure 3 compares the temperature curves of the probes for the simulation and experimental results. It can be observed that in the scheme without SAT, even without considering the natural convection heat dissipation from the heating rod, the theoretical temperature is still slightly lower than the experimental value. It can be seen that in the scheme with SAT, the Tb curve exhibits two distinct gentle regions, corresponding to the latent heat of SAT’s phase change and thermal decomposition reaction. The simulated Ta slightly underestimates the experimental value before approximately 300 s, while the simulated Tb slightly overestimates it after approximately 300 s. Since the detailed material properties and structural parameters of the heating rod are not provided in the reference, this study assigned the shell material properties (stainless steel 304) to the entire rod, likely resulting in an overestimated specific heat capacity and lower simulated temperatures. Meanwhile, the model did not account for thermal radiation to the environment, leading to higher simulated temperatures after 300 s. The relative average errors between the simulation and experimental values for Ta and Tb are 11% and 8%, respectively, which are generally in agreement, demonstrating the effectiveness and accuracy of the SAT phase change and thermal decomposition model.

3.2. Latent Heat Performance of SAT

Pure SAT has high phase change and chemical decomposition enthalpy, but its thermal conductivity is too low, making it difficult to effectively utilize the latent heat. After adding EG, although the latent heat decreases, the thermal conductivity increases significantly (the thermophysical properties of pure SAT and SAT-EG are shown in Table 3), allowing the two-stage latent heat of SAT to be fully utilized.
Figure 4 compares the latent heat performance of SAT before and after adding EG under the condition of a CPCM thickness of 20 mm and an initial abnormal heat generation rate P0 of 200 W. In the pure SAT configuration, the TR time of Bat3 (646 s) occurs much earlier than that in the SAT-EG configuration (1236 s) due to the low thermal conductivity of pure SAT, which effectively forms an insulating layer around the battery. The heat from Bat3 cannot be effectively transferred to SAT, which limits the utilization of SAT’s latent heat and prevents it from effectively suppressing the TR of the battery with abnormal heat generation.
The most commonly used CPCM in BTMS is PA-EG (material properties are shown in Table 3). Compared to PA-EG, SAT-EG has higher overall latent heat (approximately 4.8 times that of PA-EG) and advantages such as being non-flammable. Figure 5 compares the latent heat performance of different thicknesses of PA-EG and SAT-EG schemes under an initial abnormal heat generation rate P0 of 200 W.
Figure 6 compares the TR times of each battery under different scenarios in detail. When the CPCM thickness is 8 mm, the TR times of Bat3 under the PA-EG and SAT-EG schemes are 978 s and 1007 s, respectively. When the CPCM thickness is increased to 20 mm, the TR times of Bat3 under the two schemes are delayed to 1331 s and 1236 s, respectively. The delay effect on Bat3’s TR is similar for both materials, with PA-EG performing slightly better at a larger CPCM thickness. This is mainly due to the phase change temperature and thermal conductivity: PA-EG has a phase change temperature of 48 °C and a thermal conductivity of 7.2 W·m−1·K−1, while SAT-EG has values of 58 °C and 4.96 W·m−1·K−1. When the CPCM thickness is smaller, both materials fully undergo phase change, but as the thickness increases, PA-EG, with its lower phase change temperature and higher thermal conductivity, has a higher phase change ratio and exhibits a certain advantage in delaying the TR of the abnormal heat-producing battery.
However, the phase change latent heat alone is not sufficient to fully prevent TR. In the case of PA-EG, the latent heat is depleted before the TR of Bat3 occurs, causing the TR to rapidly spread to Bat4 and Bat5. When the CPCM thickness is 20 mm, TR reaches Bat5 in only 115 s. On the other hand, SAT-EG has decomposition latent heat. With a CPCM thickness of 16 mm, TR spreads to Bat4 and Bat5 in 121 s and 380 s, respectively. At a thickness of 20 mm, it takes 234 s and 696 s, respectively. This demonstrates that SAT-EG is significantly more effective in suppressing the TRP than PA-EG.

3.3. Thermal Runaway Protection Based on Liquid Cooling and SAT

3.3.1. Mesh Independence Verification

This section proposes a TR protection strategy that combines the advantages of liquid cooling for efficient heat dissipation and the two-stage latent heat of SAT. Liquid cooling compensates for the limited latent heat of SAT, while SAT addresses the disadvantages of liquid cooling, such as its inability to provide insulation and delay heat propagation.
Due to the numerous small-diameter cooling channels, local mesh refinement is required during grid generation. To reduce computational cost while ensuring accuracy, a comparison of the highest temperatures of the battery module at the same time step for seven different mesh densities was conducted. The mesh counts were 369,186, 635,066, 869,114, 977,053, 1,157,720, 1,301,231, and 1,562,770.
As shown in Figure 7a, when the number of meshes reaches 977,053, further mesh refinement has a negligible impact on the calculation results, with the maximum temperature of the battery module stabilizing around 119.27 °C. Considering both the computational time cost and accuracy, the mesh number selected for the subsequent research in this paper is 977,053, and the model mesh is shown in Figure 7b.

3.3.2. Simulation of Thermal Runaway Protection

This section studies the TRP within the battery module by triggering TR in the central battery. The liquid cooling plate is arranged at the bottom and side of the battery module, with the initial abnormal heat generation rate P0 of the central battery set to 500 W and the ambient temperature Tamb at 25 °C. The thickness of SAT-EG is 16 mm. The battery module’s individual battery numbering is shown in Figure 1c. The temperature distribution of the battery module is highly symmetrical, and the temperatures of Bat3, Bat4, and Bat5 are selected for study. Figure 8 shows the temperature distribution of the battery module at three different times under the liquid cooling combined with the SAT scheme. It can be observed that the high-temperature region of the battery module remains near Bat3 at all three times: just before TR, when the module temperature reaches its peak, and after the TR risk is alleviated (when the temperature drops below T2).
Figure 9 compares the maximum and average temperatures of Bat3, Bat4, Bat5, and the liquid cooling plate. Bat3 undergoes TR around 554 s, with its maximum temperature rapidly rising above 800 °C. Due to the high thermal conductivity of the liquid cooling plate, which ensures temperature uniformity, the heat from Bat3’s TR is quickly transferred through the liquid cooling plate to Bat4 and Bat5. As a result, the temperatures of Bat4 and Bat5 briefly rise, reaching their first peak at 567 s and 570 s, respectively. As heat is conducted through the SAT-EG, the temperature of Bat4 gradually increases, reaching a second peak of 120 °C at 725 s. In contrast, the temperature of Bat5 is less affected by thermal propagation along the SAT-EG path, reaching its second peak of 31.3 °C at about 1002 s.
Figure 10 shows the temperature distribution when Bat3, Bat4, and Bat5 first reach their peak temperatures. In Bat3, under the influence of liquid cooling and the water hydrate, the high-temperature region appears U-shaped. Bat4 is affected by thermal propagation from both the liquid cooling plate and SAT-EG, with an uneven high-temperature region due to the alternating flow direction of the coolant. Bat5, at this time, is not affected by thermal propagation along the SAT-EG path, with high temperatures only caused by the liquid cooling plate. Figure 11 shows the temperature distribution when Bat4 and Bat5 reach their second peak temperatures. In both batteries, the second temperature peaks are caused by thermal propagation along the SAT-EG, with the high-temperature regions also appearing U-shaped.
Figure 9 shows that after TR ends, the temperature of Bat4 continues to decrease under the effect of liquid cooling. However, between 1000 s and 1200 s, the rate of decrease slows down, forming a plateau. Figure 12 explains this phenomenon: after the TR of Bat3, the surrounding SAT rapidly dehydrates and absorbs heat, converting to ASA, thus losing its phase change ability. At this point, there is still a significant amount of SAT around Bat4 that has not fully dehydrated, and during the cooling process, it returns to the phase change temperature and releases heat, delaying the temperature decrease.
Figure 13 shows the effect of liquid cooling on TR protection. In the scenario without liquid cooling, Bat3, Bat4, and Bat5 experience TR at 248 s, 441 s, and 725 s, respectively. In the liquid cooling scenario, Bat3’s TR is delayed until 530 s, a delay of 282 s compared to the no liquid cooling case, and no TR occurs in Bat4 and Bat5, proving that the addition of liquid cooling significantly enhances the system’s TR protection capability.

3.4. Study on the Influencing Factors of Thermal Runaway Protection Performance

3.4.1. Effect of Initial Abnormal Heat Generation Rate

This section studies the effect of the initial abnormal heat generation rate (P0) on TR behavior, under the conditions of an ambient temperature (Tamb) of 25 °C and a SAT-EG thickness of 16 mm. Figure 14a compares the TR behavior of Bat3 under different initial abnormal heat generation rates. When P0 is below 450 W, as the battery temperature increases, the temperature difference between the battery and the liquid cooling plate increases, improving the cooling efficiency, and Bat3 does not experience TR. However, when the initial abnormal heat generation rate reaches 450 W, Bat3 triggers TR at 1160 s. As the heat generation rate increases further, the triggering time becomes significantly shorter. Figure 14b shows that as the heat generation rate increases, the shortening trend of the TR time gradually slows down. For example, when the heat generation rate increases from 450 W to 475 W, the TR time shortens by 459 s, while when it increases from 575 W to 600 W, the shortening is only by 43 s. This is because, for high heat generation rates, the cooling effect of the liquid cooling plate gradually weakens, and as the heat generation rate continues to increase, this weakening approaches its limit.

3.4.2. Effect of Ambient Temperature

In this section, with an initial abnormal heat generation rate of 500 W and a SAT-EG thickness of 16 mm, the influence of ambient temperature Tamb on TR and its propagation behavior is studied by varying the ambient temperature. Figure 15a compares the maximum temperature of Bat3 under different ambient temperatures. As the ambient temperature increases, the TR time of Bat3 gradually shortens. Figure 15b compares the TR time of Bat3 under different ambient temperatures. When the ambient temperature is 20 °C, TR occurs at 731 s, while at 40 °C, the TR time is 304 s, 427 s earlier. This is because the increase in ambient temperature reduces the temperature difference between the battery and its surroundings, decreasing the heat dissipation efficiency, which leads to an earlier TR.
Figure 16 shows the effects of ambient temperature on the maximum temperatures of Bat4 and Bat5. It can be seen that the increase in ambient temperature not only causes the temperature peaks to occur earlier but also results in higher peak values. The first temperature peaks for Bat4 and Bat5 are due to the large amount of heat released transiently from the TR of Bat3 and transferred via the liquid cooling plate, and their variations with the ambient temperature are both about 20 °C. For the second temperature peak, the large amount of TR heat transferred to Bat4 via the SAT results in its peak temperature being only slightly affected by ambient temperature. Meanwhile, the TR heat transferred to Bat5 is small, and its peak temperature is greatly affected by the ambient temperature.

3.4.3. Effect of Thickness of SAT-EG

This section investigates the effect of SAT-EG thickness on TR and its propagation behavior, under the conditions of an initial abnormal heat generation rate P0 of 500 W and an ambient temperature Tamb of 25 °C. Figure 17 shows the maximum temperature of Bat4 and Bat5 under different SAT-EG thicknesses. Bat4 experiences TR when the SAT-EG thickness is 8 mm, 10 mm, or 12 mm, but as the thickness increases, the TR time is delayed. When the thickness reaches 14 mm or more, Bat4 does not experience TR. Due to Bat5 being farther from the TR center, it has a lower risk of TR. The results indicate that when the SAT-EG thickness exceeds 12 mm, Bat5 will not experience TR.
To visually compare the TRP risks of different SAT-EG thickness schemes, the maximum temperatures of Bat4 and Bat5 under each scheme were recorded. If the temperature exceeds T2, it indicates that the battery has undergone TR. Table 4 shows the results.
Based on Table 4, to prevent the TR from propagating to Bat4, the SAT-EG thickness needs to be at least 14 mm; to prevent it from propagating to Bat5, a thickness of 12 mm is required. To reserve a certain safety margin, the SAT-EG thickness can be designed at 16 mm. Further increasing the thickness will reduce the compactness of the battery module, resulting in lower energy density at the module or pack level. This strategy needs to consider the balance between safety and energy density in practical applications.

3.4.4. Effect of Liquid Cooling Layouts

Since the battery module is usually integrated with current collectors and wiring harnesses on top, the liquid cooling plate is generally installed at the bottom or on the side. Therefore, this study designs four cooling schemes: no liquid cooling, bottom liquid cooling, side liquid cooling, and combined liquid cooling (as shown in Figure 18). The TR protection performance for different liquid cooling plate arrangements is compared under the conditions of an initial abnormal heat generation rate P0 of 500 W, an ambient temperature Tamb of 25 °C, and a SAT-EG thickness of 16 mm.
Figure 19 compares the TR behavior of Bat3 under different liquid cooling schemes and initial abnormal heat generation rates. When the initial abnormal heat generation rate is 300 W, TR occurs only in the no liquid cooling and bottom liquid cooling schemes. At an initial abnormal heat generation rate of 400 W, TR does not occur in the combined liquid cooling scheme. When the heat generation rate is 500 W and 600 W, TR occurs in all schemes.
Figure 20 further compares the TR time of Bat3 under different initial abnormal heat generation rates for the four schemes. The results show that when the heat generation rate is 300 W, the bottom liquid cooling scheme delays TR by 573 s compared to the no liquid cooling scheme, while the side and combined liquid cooling schemes do not result in TR. As the heat generation rate increases to 350 W and 400 W, the side liquid cooling scheme delays TR by 509 s and 181 s compared to the bottom liquid cooling scheme, while the combined liquid cooling scheme still prevents TR.
When the heat generation rate reaches 450 W or higher, all schemes experience TR. Although the combined liquid cooling scheme significantly delays TR compared to the other schemes, as the heat generation rate increases further, the effectiveness of the liquid cooling systems in delaying TR diminishes, and the time differences across the schemes gradually decrease.
Figure 21 compares the temperature curves of the battery module under four liquid cooling schemes at different SAT-EG thicknesses. It can be seen that with the increase in SAT-EG thickness, the suppression effect on TRP is significantly enhanced for all four schemes, although differences exist among the schemes.
Table 5 summarizes the maximum temperatures of Bat4 and Bat5 under different schemes. Without the use of liquid cooling plates, although increasing the SAT-EG thickness can delay TRP, it cannot completely prevent it. With the liquid cooling scheme, when the SAT-EG thickness is 12 mm, only the combined liquid cooling scheme effectively prevents TR from propagating to Bat5. When the thickness is increased to 14 mm, bottom and side liquid cooling prevent TR in Bat5, while combined liquid cooling prevents TR in Bat4. At 16 mm, all liquid cooling schemes completely prevent the TRP.
Table 5 also shows that when the SAT-EG thickness is 16 mm, the maximum temperatures of Bat4 under the bottom, side, and combined liquid cooling schemes are 131.5 °C, 124.2 °C, and 120.1 °C, respectively. Compared to the bottom liquid cooling, the combined liquid cooling reduces the maximum temperature by more than 10 °C, significantly lowering the TR risk.
Figure 9 compares the maximum and average temperatures of Bat3, Bat4, and Bat5. Bat3 undergoes TR around 554 s, with its maximum temperature rapidly rising above 800 °C. Due to the high thermal conductivity of the liquid cooling plate, which ensures temperature uniformity, the heat from Bat3’s TR is quickly transferred through the liquid cooling plate to Bat4 and Bat5. As a result, the temperatures of Bat4 and Bat5 briefly rise, reaching their first peak at 567 s and 570 s, respectively. As heat is conducted through the SAT-EG, the temperature of Bat4 gradually increases, reaching a second peak of 120 °C at 725 s. In contrast, the temperature of Bat5 is less affected by thermal propagation along the SAT-EG path, reaching its second peak of 31.3 °C at 1002 s.

3.4.5. Comparison of Thermal Runaway Protection Performance of SAT-EG and PA-EG Combined with Liquid Cooling

Section 3.2 has already demonstrated the advantage of SAT-EG over traditional PA-EG in delaying TRP. In this section, under the conditions of an initial abnormal heat generation rate of 500 W and an ambient temperature of 25 °C, liquid cooling is combined with different thicknesses of PA-EG and SAT-EG CPCMs to further compare the TR protection performance of the two materials.
Figure 22 compares the battery module temperatures under different schemes. It can be observed that after combining liquid cooling with PA-EG, the effect of delaying TR in Bat3 is still slightly better than that of SAT-EG, which is consistent with the comparison results when not combined. However, in the PA-EG scheme, once TR occurs, it quickly propagates to Bat4 and Bat5, indicating that the liquid cooling combined with PA-EG scheme still has poor performance in preventing TRP.
Figure 23 shows the TR times of each single battery under different schemes. In the liquid cooling combined with the PA-EG scheme, although the TR times of Bat3, Bat4, and Bat5 are delayed with the increase in CPCM thickness, TRP between the batteries is never prevented. In the liquid cooling combined with the SAT-EG scheme, due to the high-temperature dehydration heat absorption ability of SAT, which PA does not possess, the effect of delaying TRP is significantly better than that of the PA-EG scheme. With the increase in CPCM thickness, TRP can be prevented within different ranges.
Table 6 provides a detailed comparison of the TR protection performance of PA-EG and SAT-EG with different thicknesses before and after being combined with liquid cooling. It is evident that the TRP time increases with the CPCM thickness in all schemes, and further extends after integrating liquid cooling. However, only the SAT-EG combined with the liquid cooling scheme successfully prevents TRP, and this requires the CPCM thickness to reach at least 12 mm.

4. Conclusions

This study addresses the issue of thermal runaway propagation in prismatic lithium-ion battery modules and proposes a collaborative protection strategy based on a sodium acetate trihydrate composite phase change material and a liquid cooling system. The main conclusions are as follows:
  • The low thermal conductivity of pure SAT forms an insulating layer around the battery, which exacerbates thermal runaway. After doping with EG, the thermal conductivity is significantly improved, allowing the latent heat properties of SAT to be fully utilized. For a 20 mm thick SAT-EG scheme, the thermal runaway time of Bat3 is delayed by 590 s compared to the pure SAT scheme.
  • By comparing SAT-EG with traditional PA-EG materials, it was found that under the 20 mm PA-EG scheme, thermal runaway propagates to Bat5 in just 115 s. In contrast, under the 20 mm SAT-EG scheme, thermal runaway propagates to Bat5 in 696 s, about six times longer than the PA-EG scheme, demonstrating the significant advantage of SAT materials in thermal runaway protection.
  • When combined with liquid cooling, the thermal runaway protection effect is further improved, significantly delaying the battery’s thermal runaway time. Furthermore, when the initial abnormal heat generation rate is below 450 W, the battery does not trigger thermal runaway. Even if an abnormal battery experiences thermal runaway, with a SAT-EG thickness of 12 mm, thermal runaway only propagates once; when the SAT-EG thickness exceeds 14 mm, thermal runaway does not propagate.
  • As the ambient temperature increases, the peak temperature of the battery is reached earlier, and the peak temperature also rises. In terms of liquid cooling layout, the combined liquid cooling scheme (bottom and side) performs far better than individual bottom or side liquid cooling schemes.
  • Even when combined with liquid cooling, the traditional PA-EG material fails to prevent the propagation of thermal runaway. However, when combined with liquid cooling, the SAT-EG material significantly outperforms the traditional solution, and with an increase in CPCM thickness, it can effectively prevent the propagation of thermal runaway over various ranges.
This strategy offers a novel approach for the thermal safety design of battery energy storage stations. However, in the modeling and simulation of the battery module, this study assumes that all batteries and their behaviors are identical, which differs from real battery modules. Further research will incorporate non-uniformity factors to make the model and strategy more applicable to practical scenarios. Additionally, related experimental validation and cost–benefit analysis will be conducted in the future.

Author Contributions

Conceptualization, L.X. and M.L.; methodology, T.Y. and H.X.; software, C.X. and Q.X.; validation, H.X. and L.C.; formal analysis, J.Z. and H.Z.; investigation, L.C. and Q.X.; resources, J.Z.; data curation, L.X.; writing—original draft preparation, T.Y. and H.X.; writing—review and editing, L.X. and M.L.; visualization, C.X.; supervision, J.X.; project administration, T.Y. and M.L.; funding acquisition, H.Z. and J.X. All authors have read and agreed to the published version of the manuscript.

Funding

This research was funded by the Joint Fund Project of Natural Science Foundation of Hubei Province (2025AFD087), the Research Project of Wuhan University of Technology Chongqing Research Institute (YF 2021-08), the National Natural Science Foundation of China (52476079), the 111 Project of China (B17034), and the Innovative Research Team Development Program of the Ministry of Education of China (IRT_17R83).

Data Availability Statement

The data are contained within the article.

Conflicts of Interest

Authors Min Liu and Lingyu Chen were employed by the company Research Institute of State Grid Zhejiang Electric Power Co., Ltd. The remaining authors declare that the research was conducted in the absence of any commercial or financial relationships that could be construed as a potential conflict of interest.

References

  1. Zheng, Y.; Ouyang, M.; Han, X.; Lu, L.; Li, J. Investigating the error sources of the online state of charge estimation methods for lithium-ion batteries in electric vehicles. J. Power Sources 2018, 377, 161–188. [Google Scholar] [CrossRef]
  2. He, M.; Chartouni, D.; Landmann, D.; Colombi, S. Safety Aspects of Stationary Battery Energy Storage Systems. Batteries 2024, 10, 418. [Google Scholar] [CrossRef]
  3. Qiao, Y.; Deng, H.; He, P.; Zhou, H. A 500 Wh/kg Lithium-Metal Cell Based on Anionic Redox. Joule 2020, 4, 1445–1458. [Google Scholar] [CrossRef]
  4. Wang, H.; Du, Z.; Rui, X.; Wang, S.; Jin, C.; He, L.; Zhang, F.; Wang, Q.; Feng, X. A comparative analysis on thermal runaway behavior of Li (NixCoyMnz) O2 battery with different nickel contents at cell and module level. J. Hazard. Mater. 2020, 393, 122361. [Google Scholar] [CrossRef]
  5. Börger, A.; Mertens, J.; Wenzl, H. Thermal runaway and thermal runaway propagation in batteries: What do we talk about? J. Energy Storage 2019, 24, 100649. [Google Scholar] [CrossRef]
  6. Wang, Q.; Wen, J.; Stoliarov, S. Special Issue on Lithium Battery Fire Safety. Fire Technol. 2023, 59, 1027–1028. [Google Scholar] [CrossRef]
  7. Zhou, Z.; Zhou, X.; Cao, B.; Yang, L.; Liew, K. Investigating the relationship between heating temperature and thermal runaway of prismatic lithium-ion battery with LiFePO4 as cathode. Energy 2022, 256, 124714. [Google Scholar] [CrossRef]
  8. Lu, L.; Han, X.; Li, J.; Hua, J.; Ouyang, M. A review on the key issues for lithium-ion battery management in electric vehicles. J. Power Sources 2013, 226, 272–288. [Google Scholar] [CrossRef]
  9. Feng, X.; Ouyang, M.; Liu, X.; Lu, L.; Xia, Y.; He, X. Thermal runaway mechanism of lithium ion battery for electric vehicles: A review. Energy Storage Mater. 2018, 10, 246–267. [Google Scholar] [CrossRef]
  10. Zhao, R.; Liu, J.; Gu, J. Simulation and experimental study on lithium ion battery short circuit. Appl. Energy 2016, 173, 29–39. [Google Scholar] [CrossRef]
  11. Zhang, C.; Santhanagopalan, S.; Sprague, M.; Persaran, A. Coupled mechanical-electrical-thermal modeling for short-circuit prediction in a lithium-ion cell under mechanical abuse. J. Power Sources 2015, 290, 102–113. [Google Scholar] [CrossRef]
  12. Jiang, L.; Luo, Z.; Wu, T.; Shao, L.; Sun, J.; Liu, C.; Li, G.; Cao, K.; Wang, Q. Overcharge behavior and early warning analysis of LiNi0.5Co0.2Mn0.3O2/C lithium-ion battery with high capacity. J. Electrochem. Soc. 2019, 166, A1055–A1062. [Google Scholar] [CrossRef]
  13. Fernandes, Y.; Bry, A.; de Persis, S. Identification and quantification of gases emitted during abuse tests by overcharge of a commercial Li-ion battery. J. Power Sources 2018, 389, 106–119. [Google Scholar] [CrossRef]
  14. Lai, X.; Zheng, Y.; Zhou, L.; Gao, W. Electrical behavior of overdischarge-induced internal short circuit in lithium-ion cells. Electrochim. Acta 2018, 278, 245–254. [Google Scholar] [CrossRef]
  15. Ohsaki, T.; Kishi, T.; Kuboki, T.; Takami, N.; Shimura, N.; Sato, Y.; Sekino, M.; Satoh, A. Overcharge Reaction of Lithium-ion Batteries. J. Power Sources 2005, 146, 97–100. [Google Scholar] [CrossRef]
  16. Lammer, M.; Konigseder, A.; Hacker, V. Holistic methodology for characterisation of the thermally induced failure of commercially available 18650 lithium ion cells. RSC Adv. 2017, 7, 24425–24429. [Google Scholar] [CrossRef]
  17. Liu, X.; Ren, D.; Hsu, H.; Feng, X.; Xu, G.; Zhuang, M.; Gao, H.; Lu, L.; Han, X.; Chu, Z. Thermal runaway of lithium-ion batteries without internal short circuit. Joule 2018, 2, 2047–2064. [Google Scholar] [CrossRef]
  18. Feng, X.; Fang, M.; He, X.; Ouyang, M.; Lu, L.; Wang, H.; Zhang, M. Thermal runaway features of large format prismatic lithium ion battery using extended volume accelerating rate calorimetry. J. Power Sources 2014, 255, 294–301. [Google Scholar] [CrossRef]
  19. Finegan, D.; Scheel, M.; Robinson, J.; Tjaden, B.; Hunt, I.; Mason, T.; Millichamp, J.; Michiel, M.; Offer, G.; Hinds, G.; et al. In-operando high-speed tomography of lithium-ion batteries during thermal runaway. Nat. Commun. 2015, 6, 6924. [Google Scholar] [CrossRef]
  20. Abada, S.; Marlair, G.; Lecocq, A.; Petit, M.; Sauvant-Moynot, V.; Huet, F. Safety focused modeling of lithium-ion batteries: A review. J. Power Sources 2016, 306, 178–192. [Google Scholar] [CrossRef]
  21. Xu, J.; Lan, C.; Qiao, Y.; Ma, Y. Prevent thermal runaway of lithium-ion batteries with minichannel cooling. Appl. Therm. Eng. 2017, 110, 883–890. [Google Scholar] [CrossRef]
  22. Wilke, S.; Schweitzer, B.; Khateeb, S.; Al-Hallaj, S. Preventing thermal runaway propagation in lithium ion battery packs using a phase change composite material: An experimental study. J. Power Sources 2017, 340, 51–59. [Google Scholar] [CrossRef]
  23. Ahmadian-Elmi, M.; Zhao, P. Review of Thermal Management Strategies for Cylindrical Lithium-Ion Battery Packs. Batteries 2024, 10, 50. [Google Scholar] [CrossRef]
  24. Talele, V.; Moralı, U.; Khaboshan, H.; Patil, M.; Panchal, S.; Fraser, R.; Fowler, M. Improving battery safety by utilizing composite phase change material to delay the occurrence of thermal runaway event. Int. Commun. Heat Mass Transf. 2024, 155, 107527. [Google Scholar] [CrossRef]
  25. Krishnadash, S.; Yoon, Y.; Gye, H. Preventing heat propagation and thermal runaway in electric vehicle battery modules using integrated PCM and micro-channel plate cooling system. Appl. Therm. Eng. 2019, 159, 113797. [Google Scholar]
  26. Liu, H.; Wei, Z.; He, W.; Zhao, J. Thermal issues about Li-ion batteries and recent progress in battery thermal management systems: A review. Energy Convers. Manag. 2017, 150, 304–330. [Google Scholar] [CrossRef]
  27. Mohamed, S.; Al-Sulaiman, F.; Ibrahim, N.; Zahir, M.; Al-Ahmed, A.; Saidur, R.; Yılbas, B.; Sahin, A. A review on current status and challenges of inorganic phase change materials for thermal energy storage systems. Renew. Sustain. Energy Rev. 2017, 70, 1072–1089. [Google Scholar] [CrossRef]
  28. Kharbanda, J.; Yadav, S.; Soni, V.; Kumar, A. Modeling of heat transfer and fluid flow in epsom salt (MgSO4·7H2O) dissociation for thermochemical energy storage. J. Energy Storage 2020, 31, 101712. [Google Scholar] [CrossRef]
  29. Stengler, J.; Bürger, I.; Linder, M. Thermodynamic and kinetic investigations of the SrBr2 hydration and dehydration reactions for thermochemical energy storage and heat transformation. Appl. Energy 2020, 277, 115432. [Google Scholar] [CrossRef]
  30. Ling, Z.; Li, S.; Cai, C.; Lin, S.; Fang, X.; Zhang, Z. Battery thermal management based on multiscale encapsulated inorganic phase change material of high stability. Appl. Therm. Eng. 2021, 193, 117002. [Google Scholar] [CrossRef]
  31. Galazutdinova, Y.; Ushak, S.; Farid, M.; Al-Hallaj, S.; Grágeda, M. Development of the inorganic composite phase change materials for passive thermal management of Li-ion batteries: Application. J. Power Sources 2021, 491, 229624. [Google Scholar] [CrossRef]
  32. Cao, J.; Ling, Z.; Lin, S.; He, Y.; Fang, X.; Zhang, Z. Thermochemical heat storage system for preventing battery thermal runaway propagation using sodium acetate trihydrate/expanded graphite. Chem. Eng. J. 2022, 433, 133536. [Google Scholar] [CrossRef]
  33. Jin, C.; Sun, Y.; Wang, H.; Zheng, Y.; Wang, S.; Rui, X.; Xu, C.; Feng, X.; Wang, H.; Ouyang, M. Heating power and heating energy effect on the thermal runaway propagation characteristics of lithium-ion battery module: Experiments and modeling. Appl. Energy 2022, 312, 11876. [Google Scholar] [CrossRef]
Figure 1. A schematic diagram of the battery module: (a) battery module composition; (b) single battery dimensions; (c) single battery numbering; (d) channel dimensions.
Batteries 11 00198 g001
Figure 2. Validation of the lithium-ion battery TR model: (a) geometric model; (b) comparison of simulation values and experimental values [33].
Batteries 11 00198 g002
Figure 3. Validation of the latent heat model of the SAT [32].
Batteries 11 00198 g003
Figure 4. Effect of adding EG on SAT latent heat performance.
Batteries 11 00198 g004
Figure 5. Comparison of latent heat performance of PA-EG and SAT-EG at different thicknesses.
Batteries 11 00198 g005
Figure 6. The TR times of single batteries with different thicknesses of PA-EG and SAT-EG.
Batteries 11 00198 g006
Figure 7. Mesh independence verification (a) and schematic diagram of the model mesh (b).
Batteries 11 00198 g007
Figure 8. Temperature distribution of the battery module near TR (a) when the temperature reaches the peak (b), and after the TR risk is eliminated (c).
Batteries 11 00198 g008
Figure 9. Maximum and average temperatures of each battery and the liquid cooling plate: Bat3 (a); Bat4 (b); Bat5 (c); and liquid cooling plate (d).
Batteries 11 00198 g009
Figure 10. Temperature distribution at the first peak temperature of each single battery: Bat3 (a), Bat4 (b), and Bat5 (c).
Batteries 11 00198 g010
Figure 11. Temperature distribution at the second peak temperature of each single battery: Bat4 (a) and Bat5 (b).
Batteries 11 00198 g011
Figure 12. Dehydration ratio distribution of SAT at 1000 s.
Batteries 11 00198 g012
Figure 13. Effect of liquid cooling on TR protection.
Batteries 11 00198 g013
Figure 14. Effects of the initial abnormal heat generation rate on TR behavior: maximum temperature of Bat3 (a) and the TR time (b).
Batteries 11 00198 g014
Figure 15. The effects of ambient temperature on TR behavior: comparison of the maximum temperature of Bat3 (a) and the TR time (b).
Batteries 11 00198 g015
Figure 16. The effects of ambient temperature on maximum temperatures of Bat4 (a) and Bat5 (b).
Batteries 11 00198 g016
Figure 17. The effects of SAT-EG thickness on TRP behavior of Bat4 (a) and Bat5 (b).
Batteries 11 00198 g017
Figure 18. Schematic diagram of the four schemes: no liquid cooling (a); bottom liquid cooling (b); side liquid cooling (c); and combined liquid cooling (d).
Batteries 11 00198 g018
Figure 19. The TR behavior of Bat3 under different liquid cooling schemes and initial abnormal heat generation rates: 300 W (a); 400 W (b); 500 W (c); and 600 W (d).
Batteries 11 00198 g019aBatteries 11 00198 g019b
Figure 20. The TR time of Bat3 under different liquid cooling schemes and initial abnormal heat generation rates.
Batteries 11 00198 g020
Figure 21. The TRP behavior of the battery module under different liquid cooling schemes and SAT-EG thicknesses: 10 mm (a); 12 mm (b); 14 mm (c); and 16 mm (d).
Batteries 11 00198 g021
Figure 22. The TRP behavior of battery modules under liquid cooling combined with different thicknesses of PA-EG and SAT-EG.
Batteries 11 00198 g022
Figure 23. The TR times of single batteries under liquid cooling combined with different thicknesses of PA-EG and SAT-EG.
Batteries 11 00198 g023
Table 1. Material properties of the battery and liquid cooling system.
ComponentDensity (kg·m−3)Specific Heat Capacity (J/(kg·K))Thermal Conductivity (W/(m·K))
Battery Core2300107218.5, 18.5, 1.5
Positive Pole2719871202.4
Negative Pole8978381387.6
Liquid Cooling Plate2719871202.4
Cooling Liquid998.241280.6
Table 2. Material properties of SAT-EG.
PropertyValue
Density (kg·m−3)800
Thermal Conductivity (W/(m·K))4.96
Specific Heat Capacity (J/(kg·K))3200
Phase Change Enthalpy (J/g)225.1
Chemical Decomposition Enthalpy (J/g)568.3
Phase Change Temperature (°C)58.49
Decomposition Temperature (°C)106.5
Table 3. A comparison of thermophysical properties of different CPCMs [22,32].
PropertyPure SATSAT-EGPA-EG
Density (kg·m−3)1450800875
Thermal Conductivity (W/(m·K))0.454.967.2
Phase Change Enthalpy (J/g)283.6225.1165
Chemical Decomposition Enthalpy (J/g)716.1568.3-
Table 4. Maximum temperatures of batteries at different SAT-EG thicknesses.
Maximum Temperature (°C)The Thickness of SAT-EG (mm)
8101214161820
Bat4>T2>T2>T2130.9120.1111.8105.1
Bat5>T2>T2125.532.131.230.529.9
Table 5. Maximum temperatures of the batteries under different liquid cooling schemes and SAT-EG thicknesses.
Maximum Temperature (°C)The Thickness of SAT-EG (mm)
10121416
Bat4Without>T2>T2>T2>T2
Bottom>T2>T2>T2131.5
Side>T2>T2>T2124.2
Combined>T2>T2130.7120.1
Bat5Without>T2>T2>T2>T2
Bottom>T2>T2130.339.3
Side>T2>T2122.234.3
Combined>T2125.532.131.2
Table 6. The TR protection performance of PA-EG and SAT-EG with different thicknesses before and after combining with liquid cooling.
SchemeTRP Time (s)Whether TRP Is Prevented
CPCMLiquid CoolingThickness (mm)To Bat4To Bat5
PA-EGWithout8731No
121150No
162180No
2031115No
With8940No
121561No
162695No
2053158No
SAT-EGWithout82484No
1260192No
16123381No
20234697No
With839112No
1274No TRYes
16No TRNo TRYes
20No TRNo TRYes
Disclaimer/Publisher’s Note: The statements, opinions and data contained in all publications are solely those of the individual author(s) and contributor(s) and not of MDPI and/or the editor(s). MDPI and/or the editor(s) disclaim responsibility for any injury to people or property resulting from any ideas, methods, instructions or products referred to in the content.

