1. Introduction
Lithium-ion batteries (LIBs) have become indispensable in modern technological advancements, powering applications ranging from portable electronics to electric vehicles and large-scale renewable energy storage systems [
1,
2,
3]. Their popularity stems from their high energy density, extended lifespan, and operational efficiency, which collectively address the growing demand for sustainable energy solutions [
4,
5]. However, with the increasing deployment of LIBs, accurately estimating their State of Health (SOH) has become crucial for ensuring safety, optimizing performance, and extending their service life [
6]. Beyond first-life applications, the SOH estimation is also critical for assessing a battery’s suitability for second-life uses, such as stationary energy storage or backup power systems [
7]. An effective SOH estimation promotes the sustainable utilization of resources, reduces waste, and enhances the overall lifecycle value of lithium-ion batteries.
Electrochemical Impedance Spectroscopy (EIS) is widely regarded as a fundamental technique for evaluating battery health by analyzing the impedance response of a cell across a range of frequencies. This diagnostic approach captures key electrochemical properties, including internal resistance, charge transfer behavior, and capacitive dynamics, which are directly linked to the aging mechanisms of the battery. Despite its utility, EIS has notable limitations when analyzing overlapping electrochemical processes. EIS encounters limitations when overlapping processes share similar characteristic frequencies leading to merged semicircles in the Nyquist plot, the ambiguous mapping of circuit elements in equivalent circuit modeling, single-frequency-based representation rather than a more revealing time-domain breakdown, susceptibility to measurement noise and constrained frequency resolution, and ultimately an ill-posed parameter estimation process make it difficult to accurately isolate and interpretate the electrochemical mechanism of the battery systems [
8,
9].
The Distribution of Relaxation Times (DRT) has emerged as an advanced technique to refine the impedance analysis and overcome its limitations [
10]. By deconvoluting impedance spectra, the DRT provides a higher resolution of distinct electrochemical processes and their timescales, enabling a deeper understanding of the internal dynamics that influence battery performance. Integrating EIS with the DRT allows for a more detailed analysis of the internal chemical behavior of the battery and contributes to improving the Equivalent Circuit Models (ECMs) traditionally developed using EIS methods, as highlighted in the recent literature [
11], thereby creating a robust framework for assessing battery health. Also, ref. [
12] apply a full-spectrum DRT-CNN with Grad-CAM and achieve better accuracy, and ref. [
13] employs static regression on multiple DRT features from both cycling and calendar-aging datasets, while our approach focuses solely on the most aging-related information peak parameters across the SOC intervals and feeding them into a LSTM, demonstrating that accurate, dynamic SOH estimations can be achieved with far less and simpler data and a more generalized model. This study leverages both methods to improve the accuracy of SOH estimations in lithium-ion batteries, particularly focusing on applications for second-life usages [
3,
10].
This paper utilizes the DRT method to analyze EIS data, aiming to extract key parameters that reflect detailed internal processes within lithium-ion batteries. The charge transfer peak, a prominent feature in the DRT spectrum, is utilized to train a Long Short-Term Memory (LSTM) model for estimating the SOH of Galaxy S9+ battery cells. By integrating DRT-derived features into an AI-based model, this approach establishes an advanced framework to enhance the accuracy of SOH estimations, supporting data-driven strategies for monitoring the long-term performance of lithium-ion batteries. For comparison, our model was quantitatively validated against an ECM-based neuro-fuzzy model, and the notably lower Mean Absolute Error (MAE) and Root Mean Squared Error (RMSE) highlight the superior accuracy and robustness of the proposed DRT-based LSTM approach in capturing complex, overlapping electrochemical processes in battery degradation.
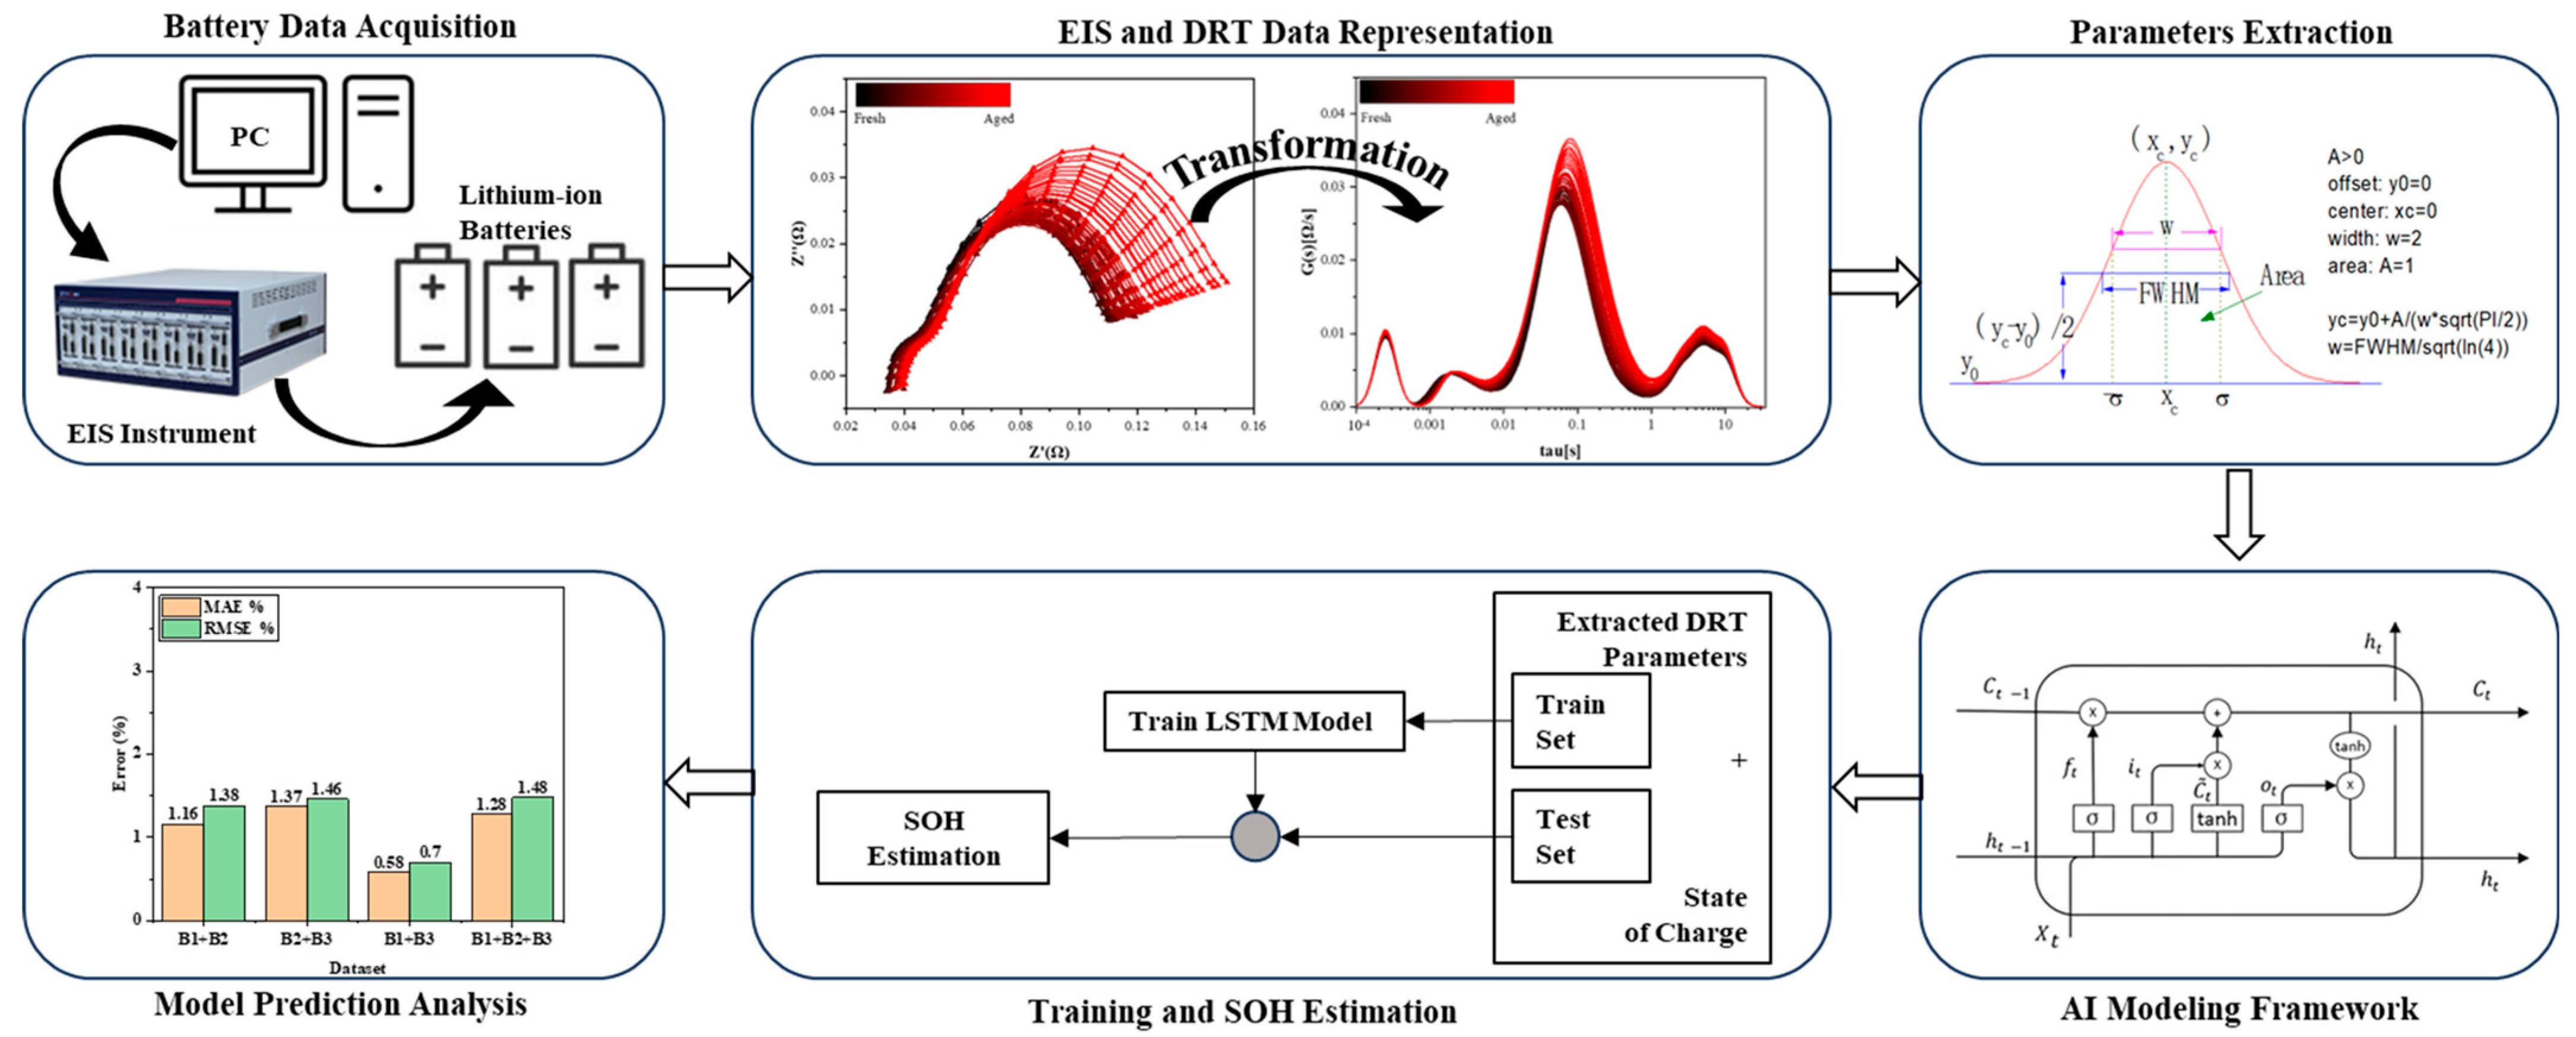
The overall framework for the proposed methodology is summarized in
Figure 1, which outlines the key steps involved in the process. First, lithium-ion batteries undergo cycling tests and EIS measurements to evaluate their degradation behavior. The EIS data are then processed using the DRT method, which deconvolutes the impedance spectra to isolate critical processes, particularly the charge transfer peak. Key DRT parameters are extracted as quantitative features reflecting the charge transfer resistance and associated aging mechanisms [
14]. These features are analyzed and subsequently used as inputs to a LSTM model, which is trained to predict the SOH of the batteries. Finally, the performance of the LSTM model is evaluated using prediction results and error metrics, confirming the accuracy and robustness of the approach. This integrated framework demonstrates the effective combination of an advanced electrochemical analysis with AI-based modeling for accurate SOH estimations.
2. Data Acquisition Method
The battery aging test was conducted on three lithium-ion batteries extracted from the Galaxy S9+ smartphone to evaluate their performance degradation over 1000 charge–discharge cycles, and specifications are shown in
Table 1. Capacity and impedance spectra measurements were performed at intervals of every 20 cycles using EIS. The aging tests were conducted in a controlled environment using a HYSCLAB chamber to maintain a constant temperature of 25 °C, ensuring consistency throughout the experimental duration. WonATech WBCS3000 M2 equipment was used to perform the charge–discharge cycling, while ZIVE MP2A was employed for EIS measurements. The charge and discharge profile, as illustrated in
Figure 1, included distinct phases designed to simulate real operating conditions. During the charging phase, a constant current (CC) of 2 A (0.57C) was applied until the battery reached its termination voltage of 4.4 V, at which point the process transitioned into constant voltage (CV) charging [
3]. In the CV phase, charging was completed when the current decreased to 0.02C (70 mA). Discharging was performed at an accelerated rate of 1.35C (4.71 A), and the process terminated when the voltage dropped to 2.8 V. To stabilize the battery before initiating the next cycle, a 1 h rest period was introduced after each discharge phase.
Impedance spectra measurements were taken every 20 cycles, as shown in
Figure 2, at six State of Charge (SOC) intervals (0%, 20%, 40%, 60%, 80%, and 100%) to capture the evolution of the battery impedance under varying states. In galvanostatic mode, a small perturbation voltage of 100 mA was applied across a frequency range from 0.1 Hz to 4 kHz to ensure accurate and reliable impedance measurements [
8]. After completing EIS measurements at a 100% SOC, the battery was fully discharged at a current of 0.2C until the voltage reached 2.8 V, and the next cycle of charge–discharge testing commenced. The decision to perform EIS measurements at 20-cycle intervals strikes a balance between obtaining sufficient impedance data for analysis and minimizing the additional stress imposed on the battery during testing, which could independently accelerate battery degradation. This strategy ensured that the aging behavior of the batteries remained representative of real-world usage conditions without excessively extending the testing duration.
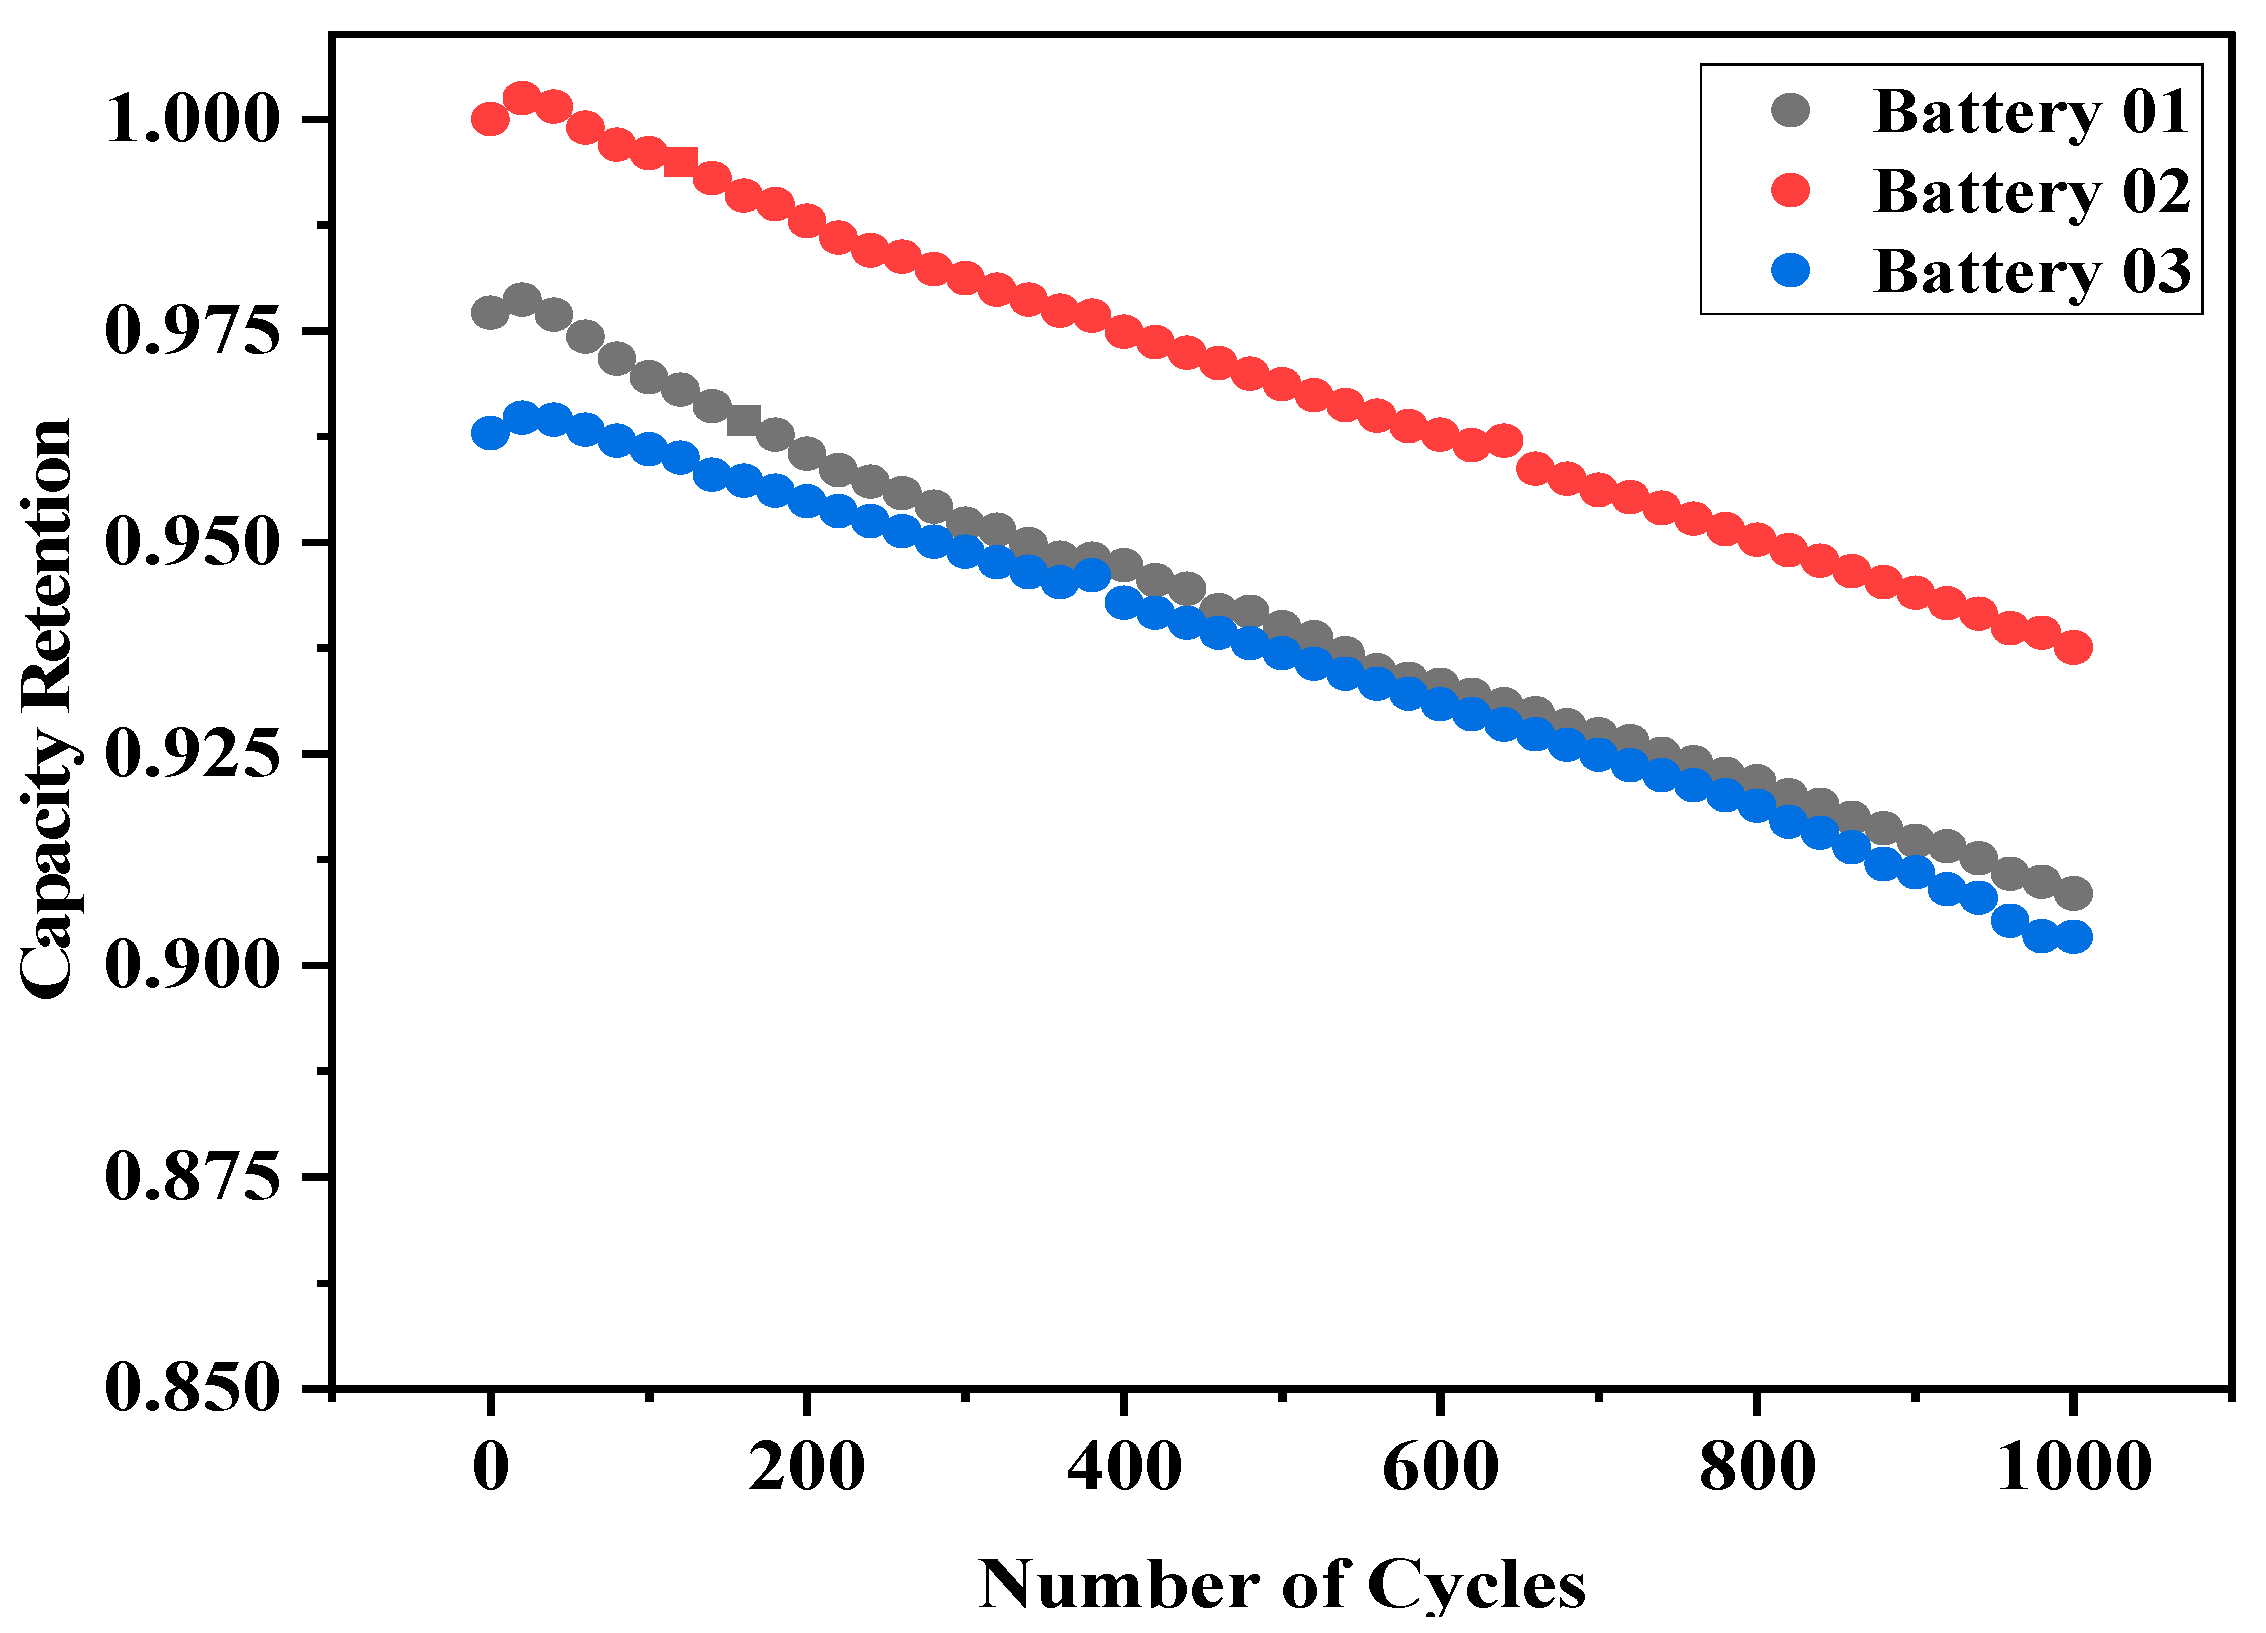
The results of the 1000-cycle aging test revealed distinct trends in capacity retention across the three battery cells. Coulombic counting was used to calculate the initial and remaining capacities relative to the nominal capacity of 3500 mAh. As presented in
Figure 3, the capacities of all three batteries declined gradually over the test duration, with variations between the cells. After completing 1000 cycles, the remaining capacities for Battery 1, Battery 2, and Battery 3 were recorded as 90.76%, 93.76%, and 90.34%, respectively, as shown in
Figure 3. These results demonstrate a consistent aging pattern while highlighting minor variations in capacity fading, likely due to intrinsic differences between the cells despite their identical specifications.
3. Analysis of Electrochemical Impedance Spectroscopy and Distribution of Relaxation Times
EIS is a fundamental technique for analyzing the internal dynamics of the battery by measuring impedance and observing electrochemical processes over a range of frequencies. In this study, EIS measurements were performed every 20 charge–discharge cycles at six State of Charge (SOC) levels (0%, 20%, 40%, 60%, 80%, and 100%) to monitor and evaluate changes in the internal processes of the three lithium-ion cells as they aged over 1000 cycles. The resulting impedance data are visualized using Nyquist plots, which are crucial for understanding the progression of the battery degradation by identifying and analyzing distinct electrochemical phenomena, such as ohmic resistance, Solid Electrolyte Interphase (SEI) layer resistance, charge transfer resistance, and diffusion processes [
14].
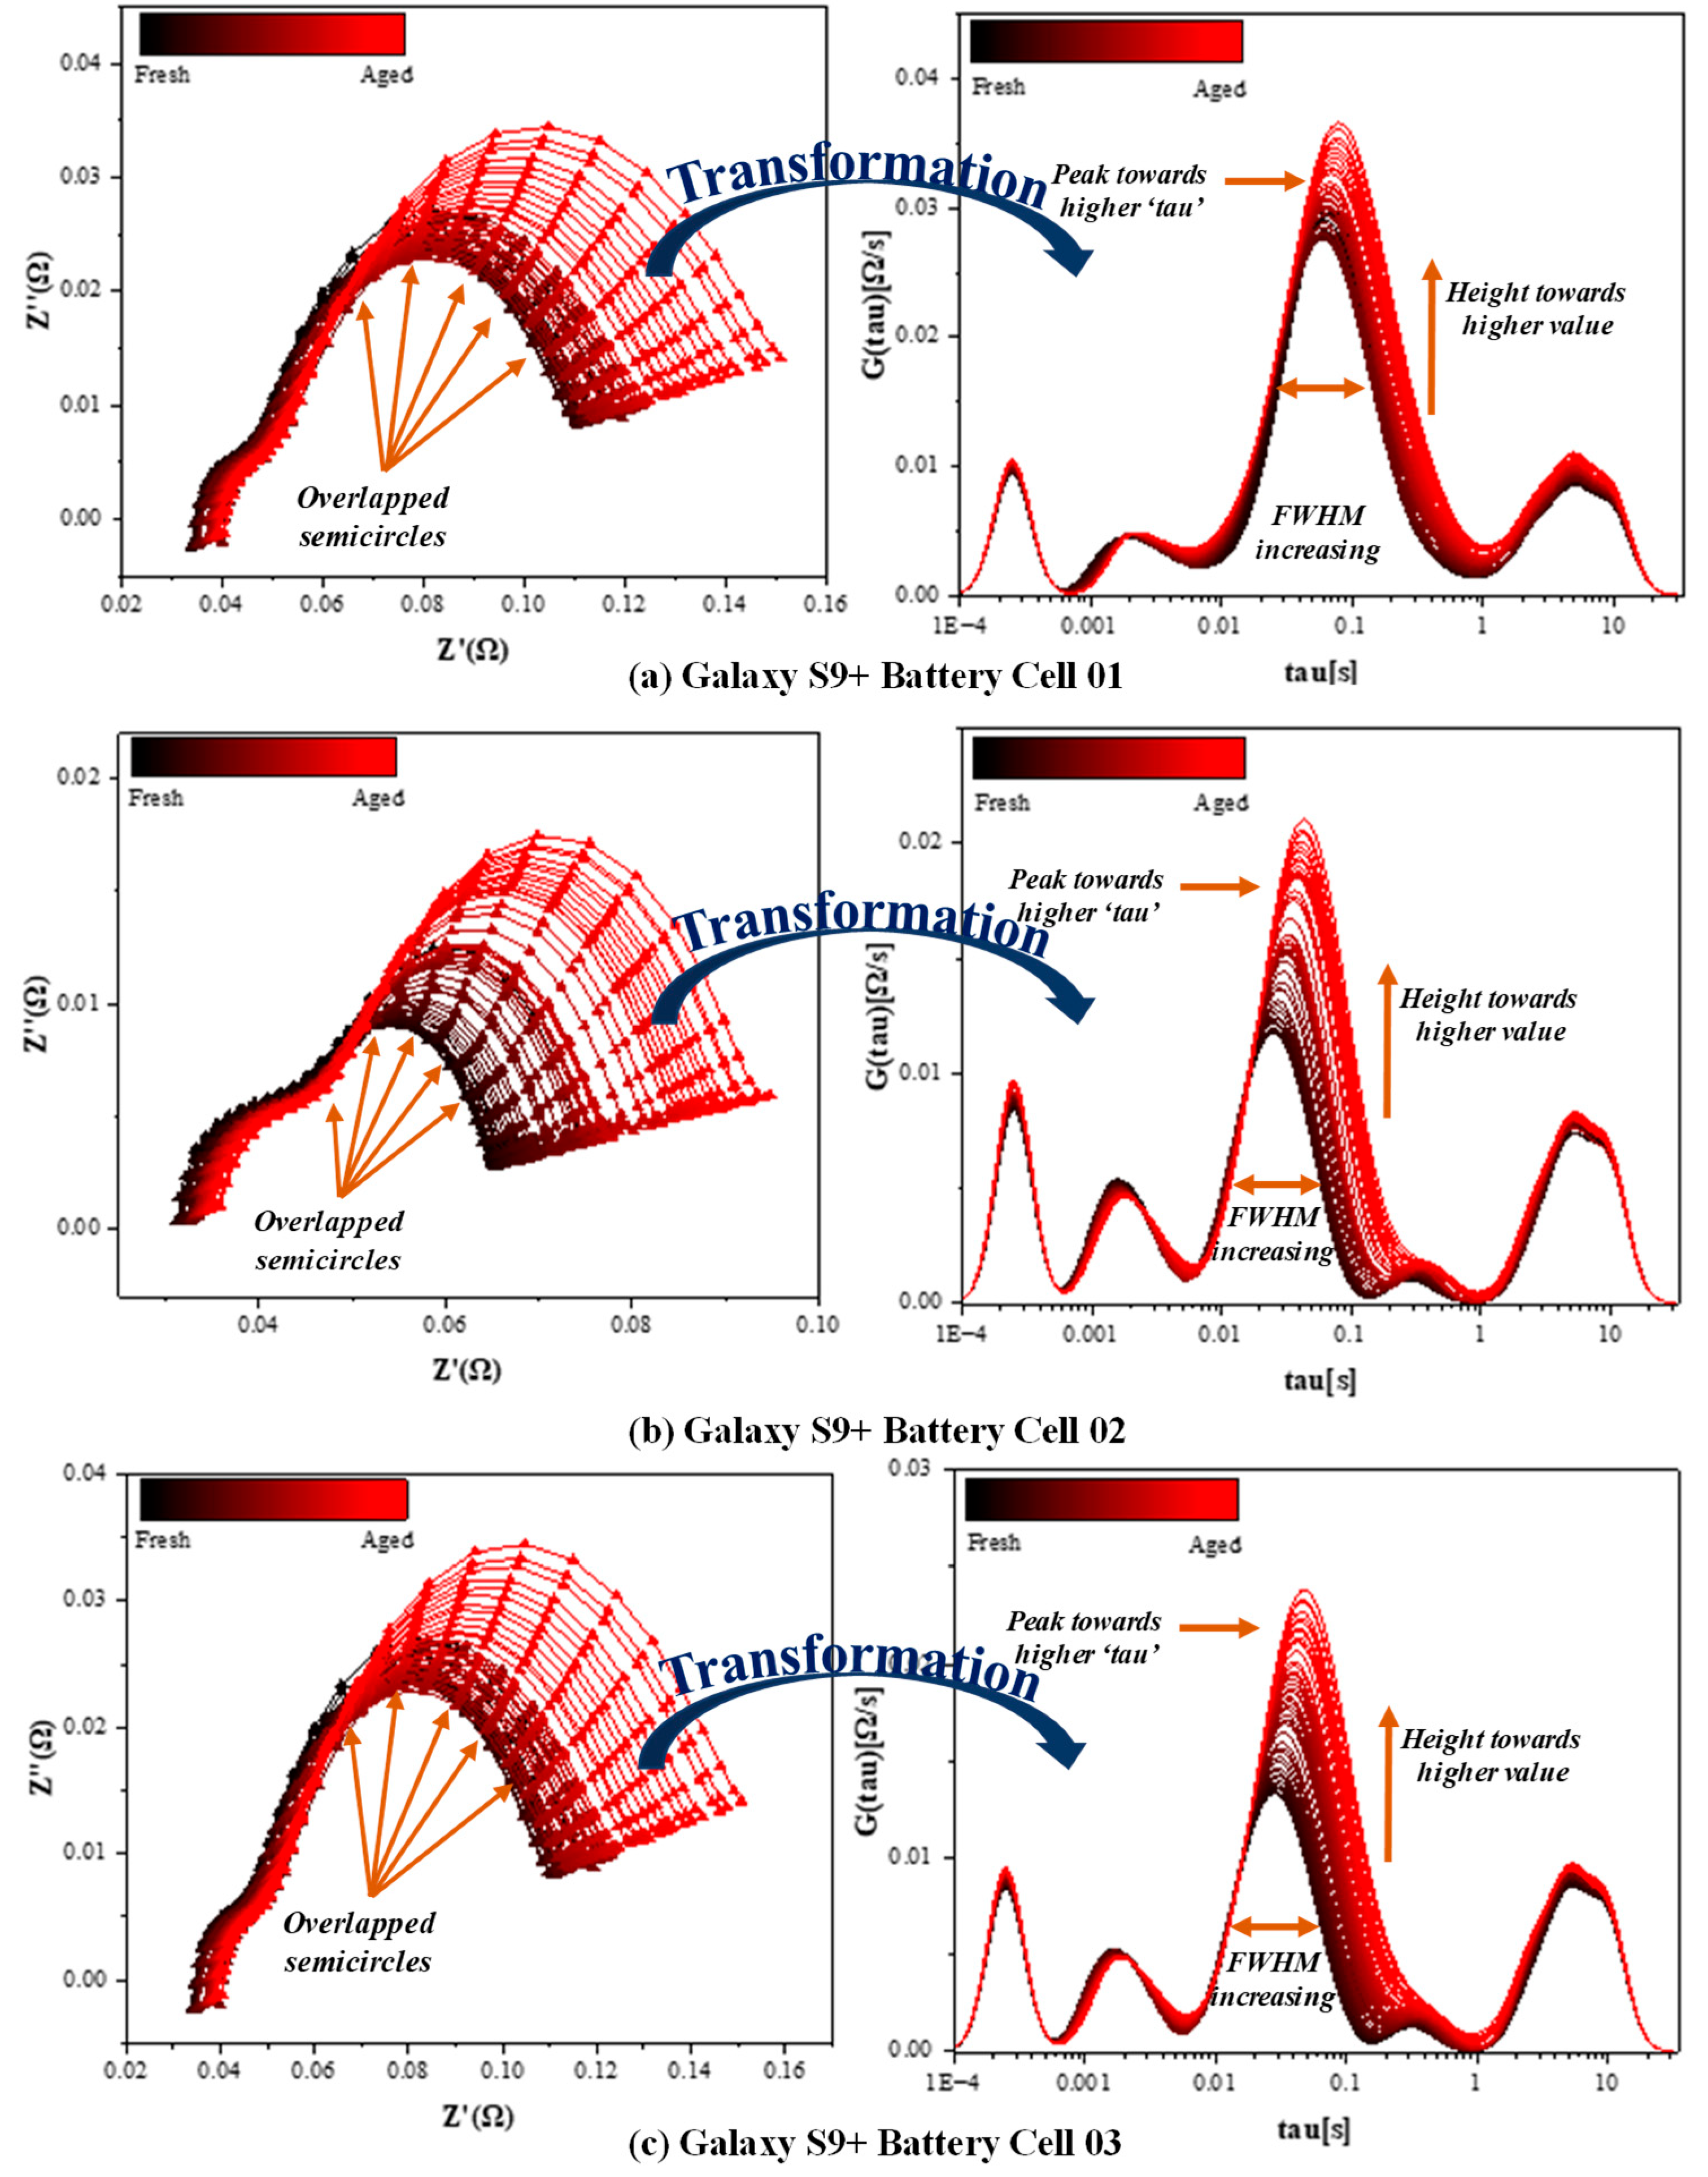
Figure 4 displays the Nyquist plots of the impedance spectra at 100% SOC for all three cells across the cycling duration, from 0 cycles to 1000 cycles. These plots illustrate the progressive changes in impedance, which reflect the internal degradation mechanisms. The high-frequency intercept on the real axis, representing ohmic resistance, remains relatively stable during the early stages of cycling but gradually increases as cycling progresses. An increase in ohmic resistance, or contact resistance, indicates reduced electrical conductivity, often stemming from electrolyte consumption and decomposition. Similarly, the semi-circular arc in the high-to-mid-frequency range, associated with the SEI layer resistance, demonstrates a gradual increase in the diameter with cycling. This trend highlights the continuous formation and thickening of the SEI layer, which increases the internal resistance and impacts performance.
The second semi-circular arc observed in the mid-frequency region, linked to charge transfer resistance, shows a more pronounced evolution compared to other components. As cycling progresses, the charge transfer resistance increases significantly, indicating slower electrochemical reactions at the electrode–electrolyte interface [
15]. This is a critical marker of aging, as it reflects the deterioration of active materials and the growing difficulty in facilitating ion transfer during charge and discharge processes. The diameter of this arc expands over time for all three cells, suggesting that charge transfer resistance plays a dominant role in the observed capacity fade and performance decline. Despite the detailed insights provided by the Nyquist plots, the low-frequency tail of the spectra, indicative of diffusion processes or Warburg impedance, is not fully captured due to the limited frequency range of the measurements. Additionally, overlapping semi-circular arcs with similar reaction time constants obscure the clear separation of electrochemical processes [
16], complicating the interpretation of battery aging mechanisms solely from EIS data.
To overcome these limitations, the DRT analysis was employed for a more precise deconvolution of the impedance spectra. In our study, we adopt a Tikhonov Regularization (TR) approach with Gaussian basis functions for the DRT inversion of the Electrochemical Impedance Spectroscopy (EIS) data. Unlike Nyquist plots, the DRT analysis breaks down the impedance response into distinct peaks, each corresponding to a specific internal process, such as ohmic resistance, SEI layer resistance, charge transfer resistance, and diffusion [
17]. This enables a deeper and more detailed insight into the individual contributions of various electrochemical processes over time.
As shown in
Figure 4 (right), in the DRT spectrum, the peaks moving left to right correspond to the ohmic resistance, Solid Electrolyte Interphase (SEI) layer resistance, charge transfer resistance (the primary focus of this work), and diffusion (Warburg impedance) at low frequencies. The charge transfer peak, which is the most dynamic feature of the spectrum, exhibits several clear trends with the cycling across all three cells. Firstly, the peak shifts to longer relaxation times (τ), indicating slower charge transfer processes as the battery ages. This shift reflects the growing resistance at the electrode–electrolyte interface and the declining efficiency of the ion transport. Secondly, the peak height increases noticeably, confirming a steady rise in resistive behavior due to material degradation and structural changes in the electrodes. Additionally, the FWHM (Full Width at Half Maximum) of the charge transfer peak widens over the cycling duration, suggesting increased heterogeneity in the electrode reactions and reduced uniformity in the material properties. The overall area under the charge transfer peak also increases significantly, underscoring the critical role of charge transfer resistance in the aging process and its direct correlation with battery degradation.
Other peaks observed in the DRT analysis, such as those corresponding to ohmic resistance and SEI layer resistance, show comparatively minor changes during the 1000-cycle test. The ohmic resistance peak remains stable for the initial cycles but increases slightly as the aging process progresses, reflecting a growing internal resistance. The SEI layer resistance peak also demonstrates a modest increase in magnitude, which is consistent with the gradual thickening of the SEI layer [
18]. The diffusion-related processes, which manifest at longer relaxation times, are observed but remain less pronounced due to the limited frequency range. However, their presence highlights the cumulative effects of aging on ion transport and mass diffusion, even if these mechanisms are less dominant compared to charge transfer resistance.
Overall, the DRT analysis reveals that charge transfer resistance is the most significant indicator of battery aging across all three cells. The progressive changes in the charge transfer peak provide critical insights into the mechanisms underlying the capacity fade and performance degradation. By enabling a clearer separation and quantification of electrochemical processes, the DRT analysis serves as a valuable tool for accurately assessing battery health and improving SOH estimation models. In summary, the enhanced clarity offered by the DRT is particularly useful for identifying key aging mechanisms and evaluating their impact on the battery performance over time.
4. Correlation of Aging and DRT Parameters Evolution
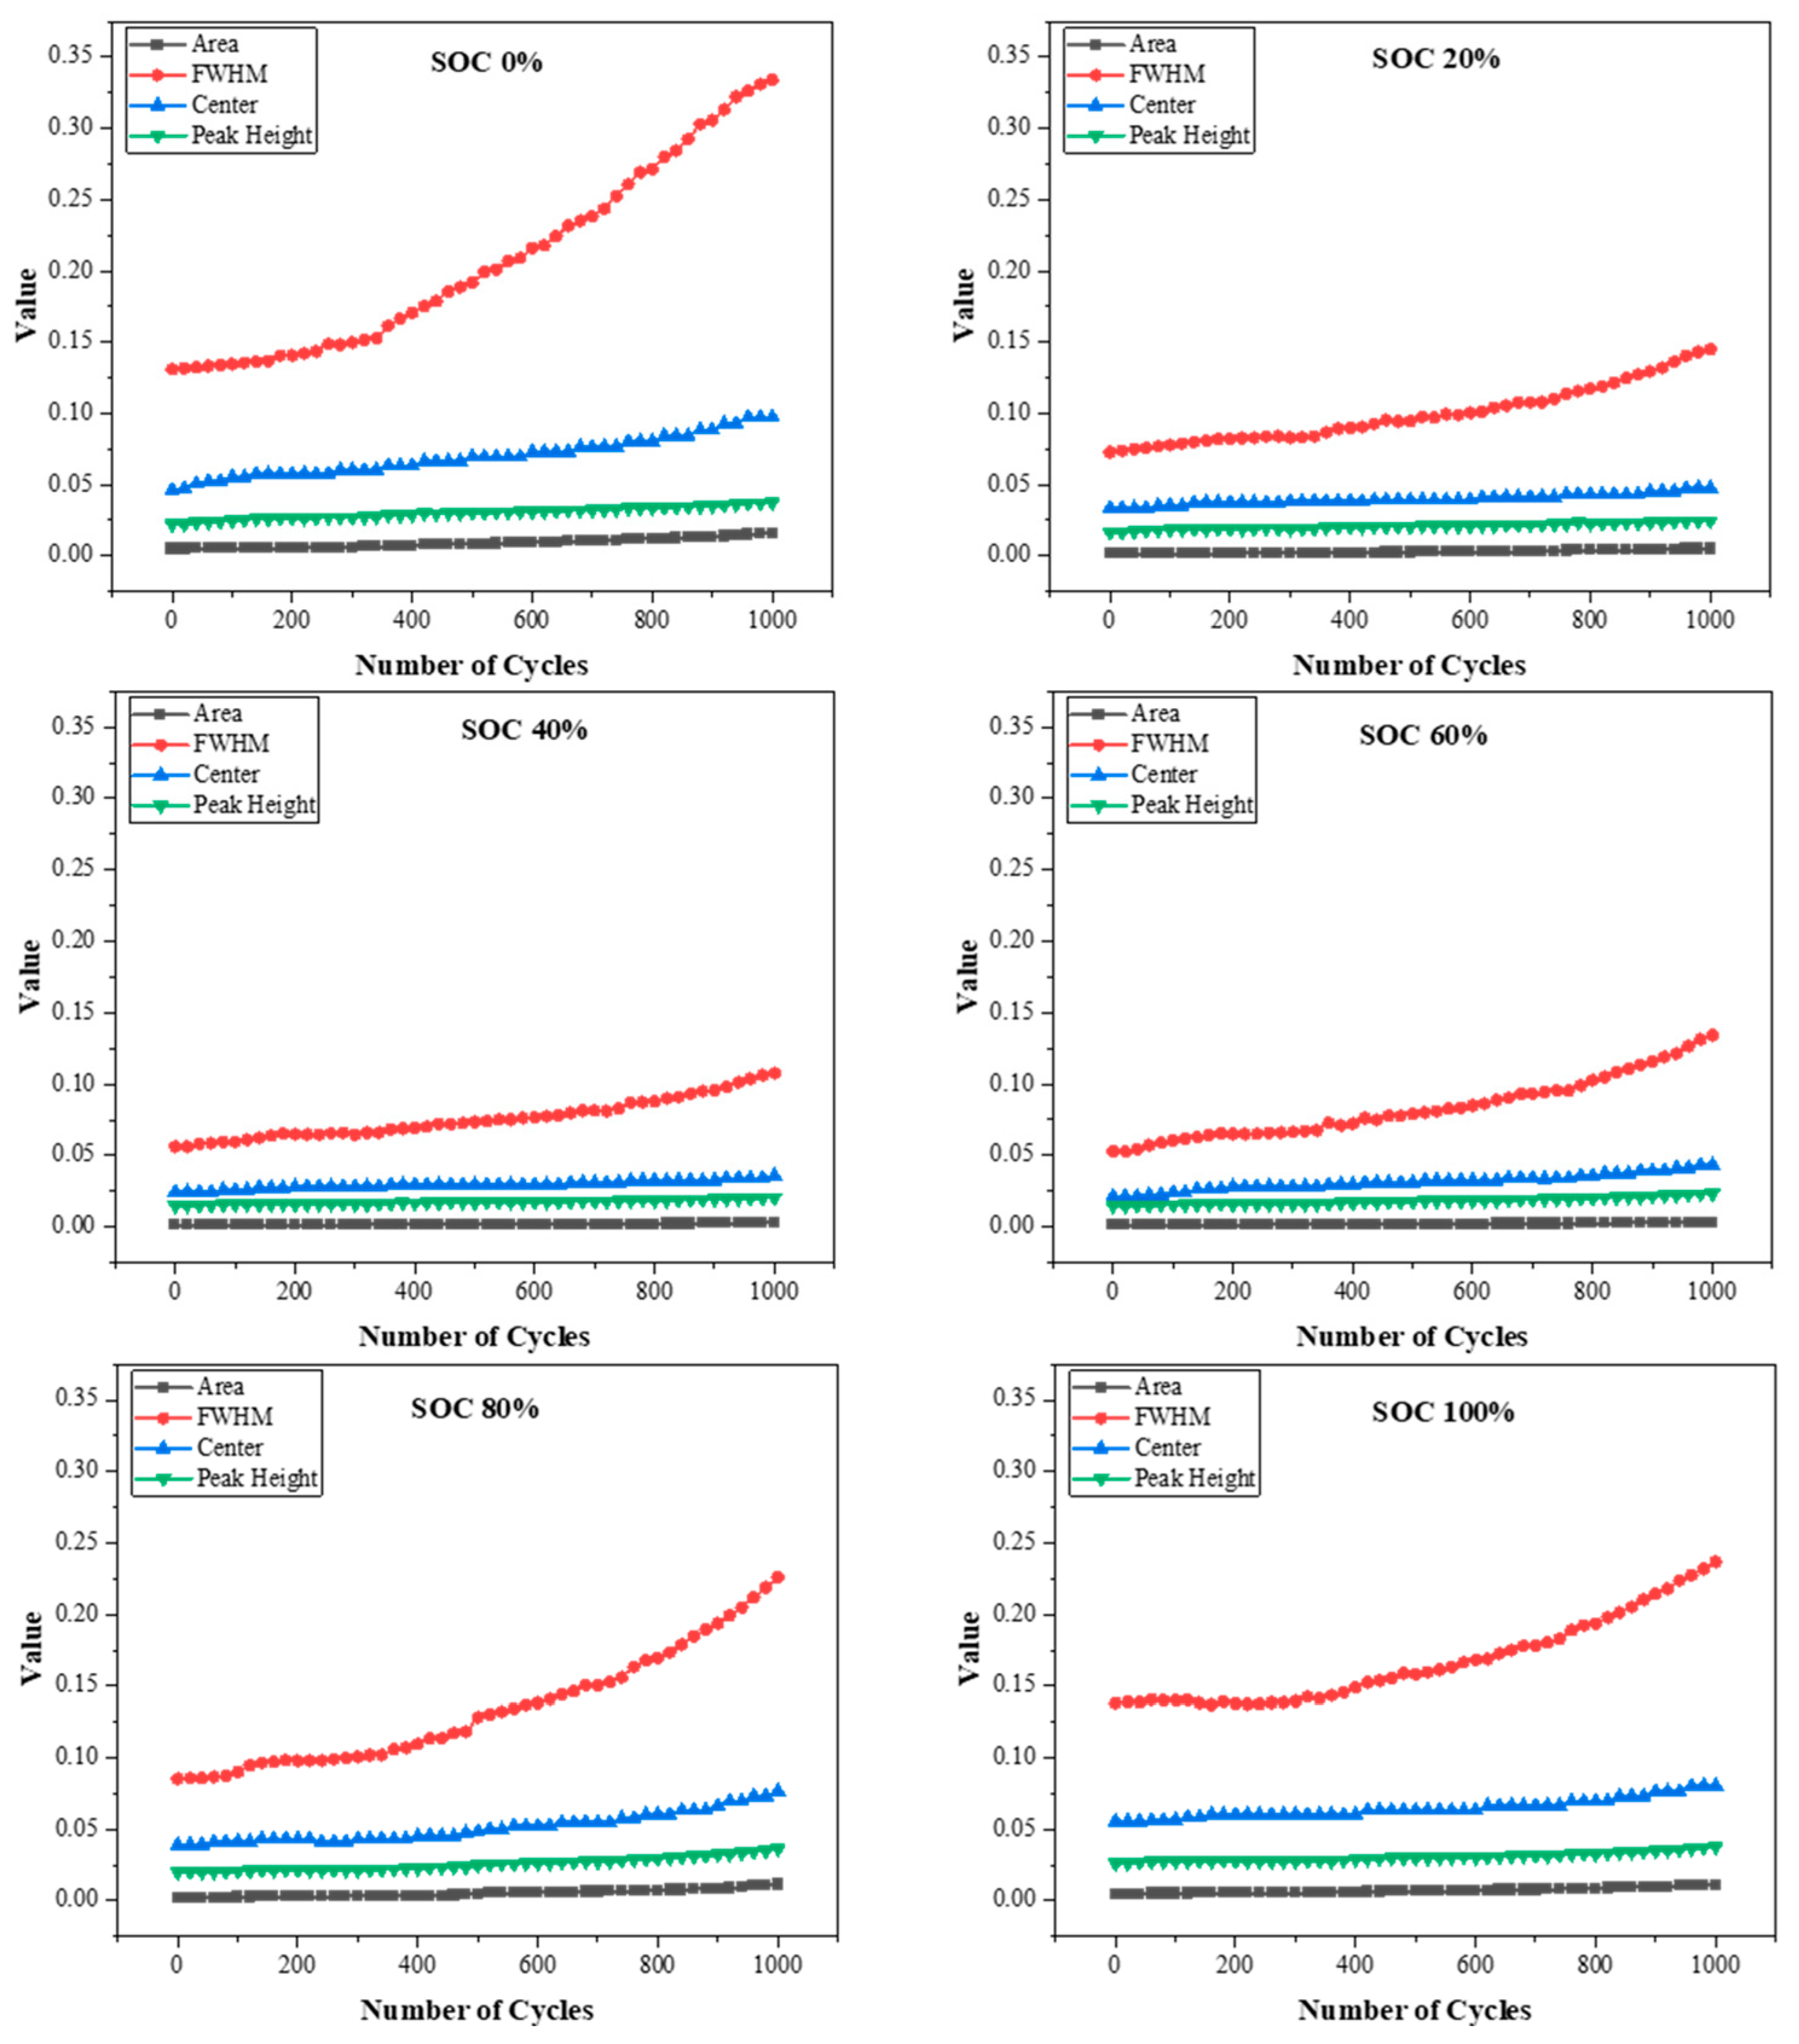
Figure 5 shows the evolution of key DRT-derived parameters, including the peak area, FWHM, center relaxation time, and peak height for the charge transfer peak in the DRT plots of Cell 01 over 1000 cycles at six different SOC levels. These parameters were extracted through the Gaussian fitting of the charge transfer peaks, ensuring a precise quantification. The results reveal consistent trends influenced by both the cycle number and SOC, reflecting the progression of battery aging mechanisms. As the battery ages, the charge transfer resistance, which dominates the mid-frequency region of the impedance spectrum, increases significantly.
This resistance is indicated by the widening of the FWHM, the gradual increase in peak area and height, and the shift in the center relaxation time to longer values. The changes become more pronounced at both ends of SOC levels, where aging effects tend to accelerate, signaling slower reaction kinetics and reduced transport efficiency. These trends suggest that the charge transfer process becomes increasingly complex and heterogeneous over time, making it a key factor in understanding battery degradation [
19].
Furthermore, the observed consistency across all three cells reinforces the robustness and reliability of the analysis. By monitoring DRT parameters at multiple SOC levels, a comprehensive understanding of internal battery processes and their evolution over time is achieved, offering critical insights for developing accurate battery state estimation models.
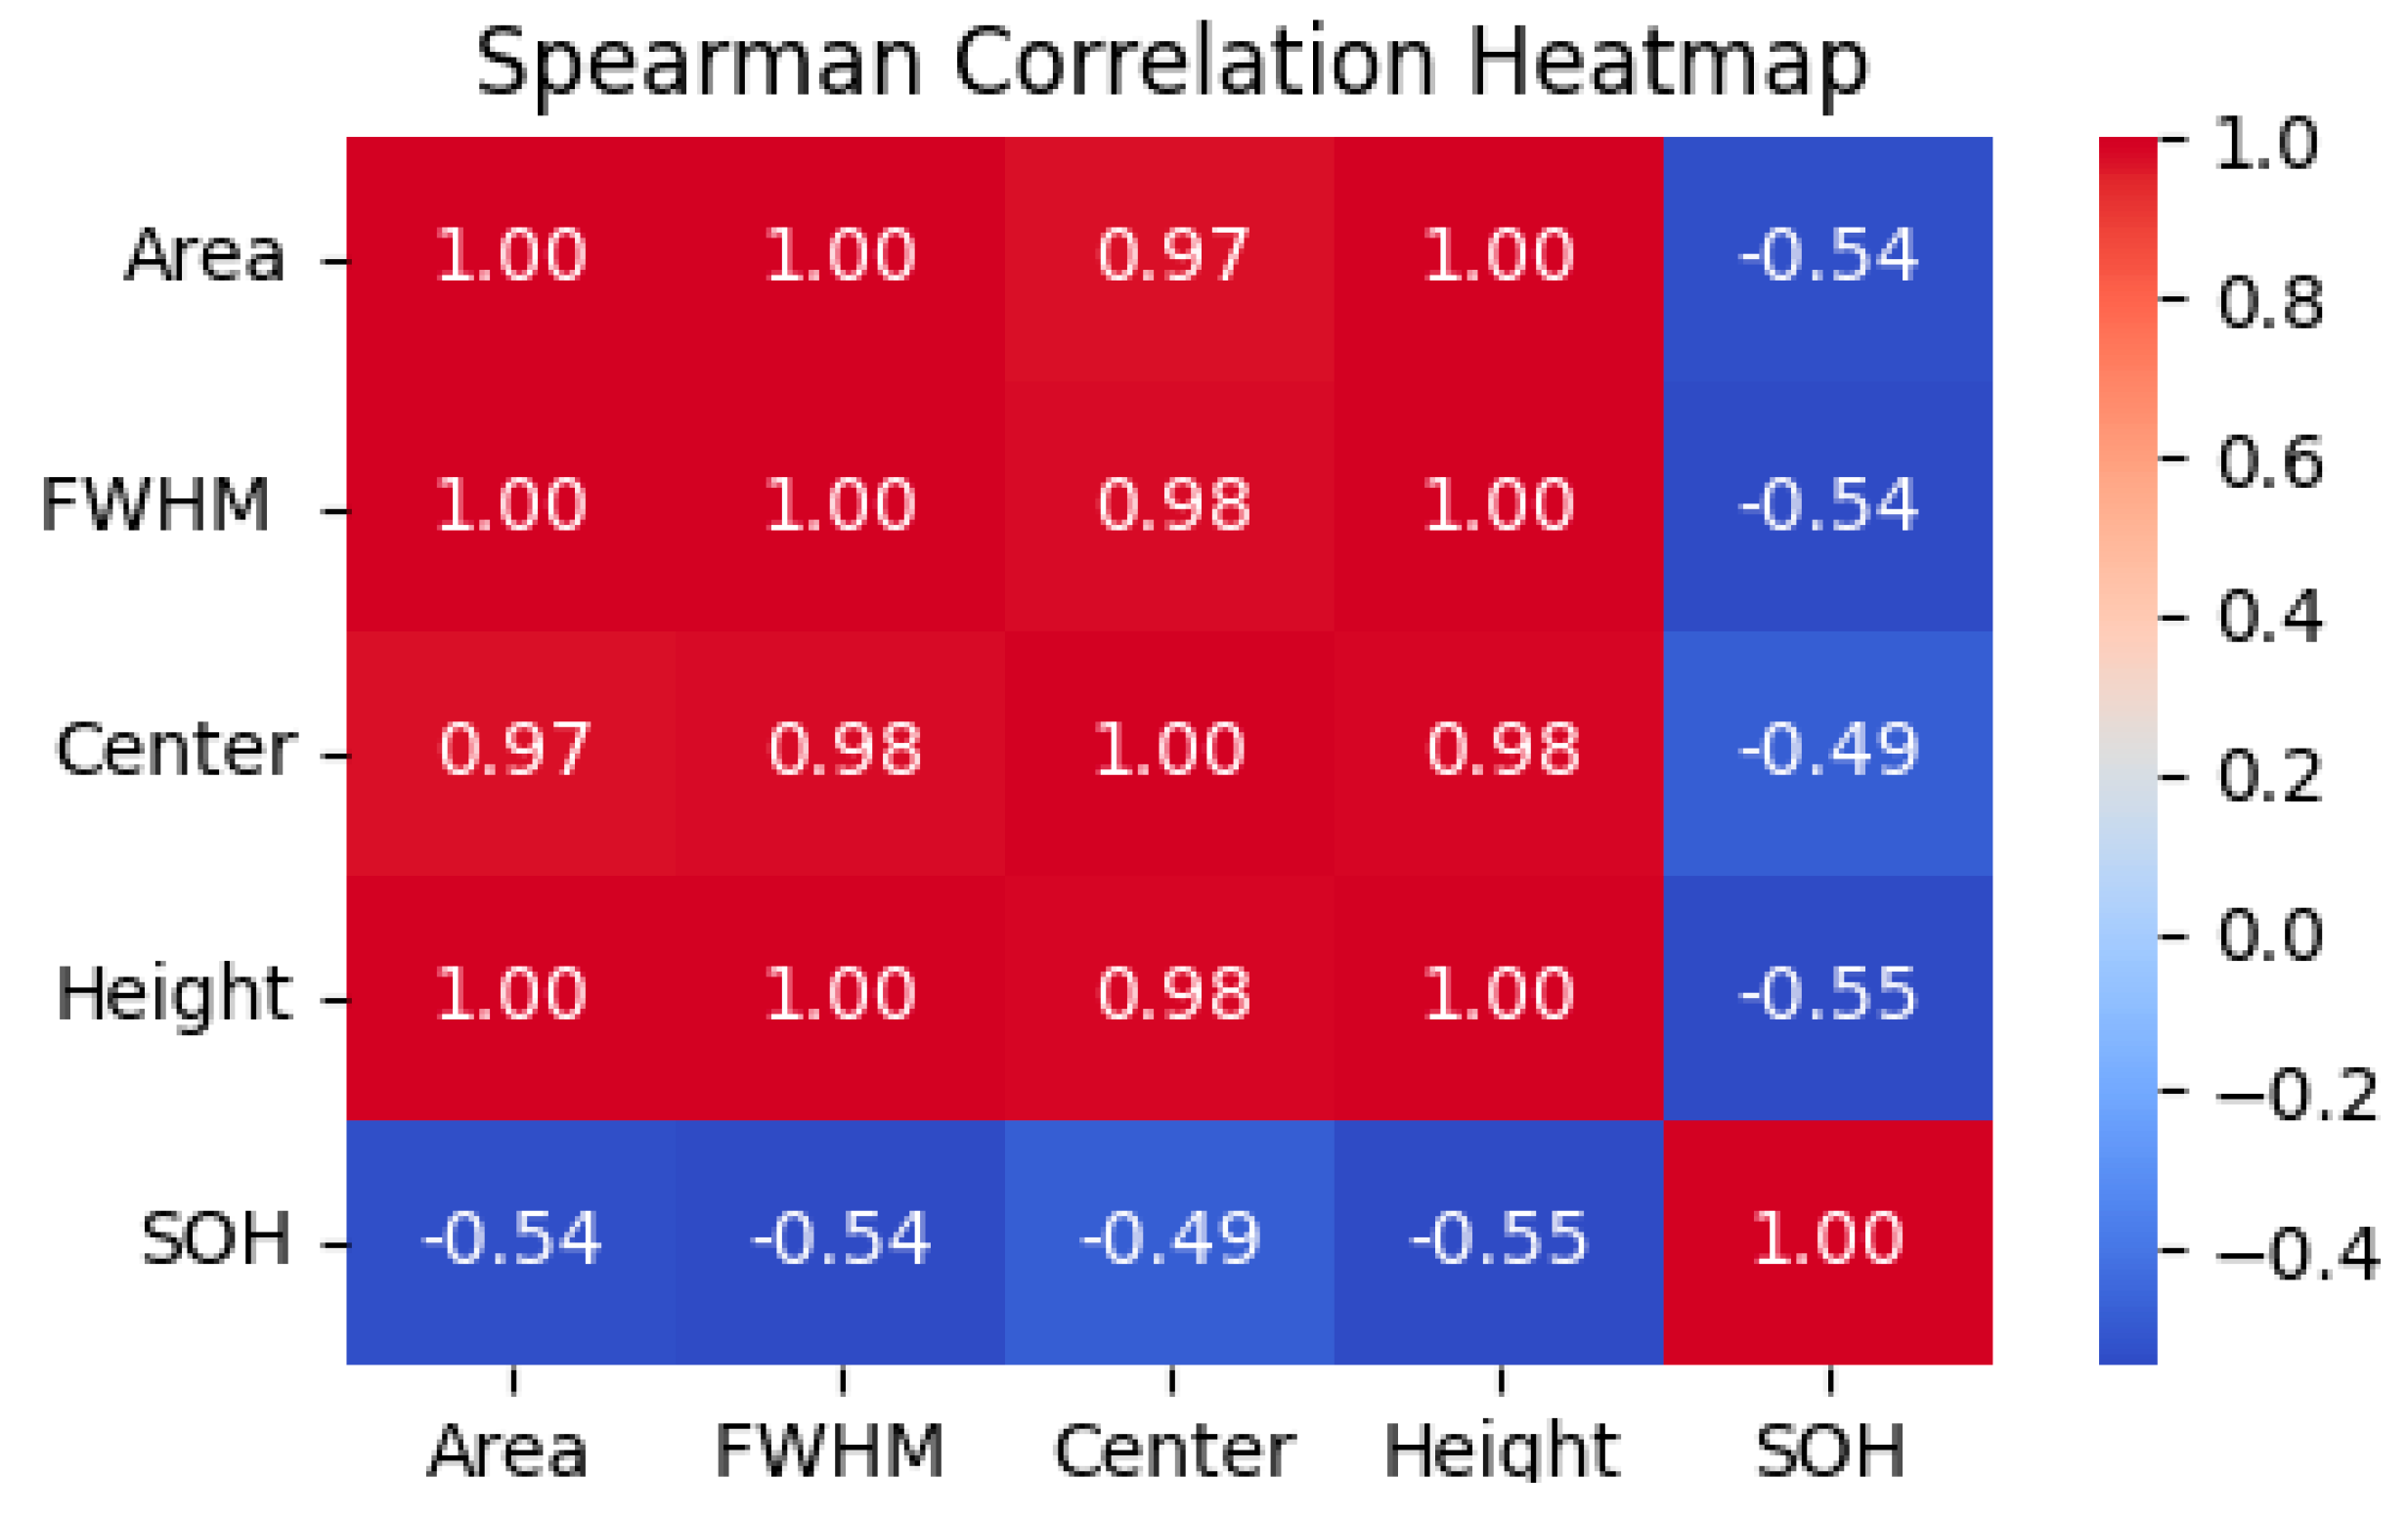
In order to clarify the links between these variables, a heatmap was created using the correlation matrix in
Figure 6 using the Spearman correlation matrix. The Spearman correlation coefficient (
ρ) is a non-parametric measure that evaluates the strength and direction of these relationships [
20] and is calculated using below equation.
where
di is the rank difference between the corresponding values of two variables, and
n is the total number of observations. The analysis reveals a strong positive correlation among the DRT-derived parameters, indicating their collective representation of the same underlying charge transfer relaxation process. As the battery ages, these parameters demonstrate consistent trends, reflecting the gradual increase in the charge transfer resistance. In contrast, the correlation between the DRT parameters and SOH exhibits a consistent negative trend, with correlation coefficients ranging from −0.49 to −0.55. This negative relationship highlights the sensitivity of the charge transfer relaxation process to SOH degradation—as the SOH declines, the charge transfer resistance peak becomes more prominent, further emphasizing its importance as a reliable indicator of battery health.
The findings from the Spearman correlation analysis confirm the strong interdependence among the DRT-derived parameters and their inverse relationship with the SOH, establishing them as effective indicators for tracking battery degradation. By incorporating these parameters into machine learning-based models, such as LSTM, for a SOH prediction, the predictive accuracy can be significantly enhanced.
5. LSTM Model for SOH Estimation
5.1. Architecture
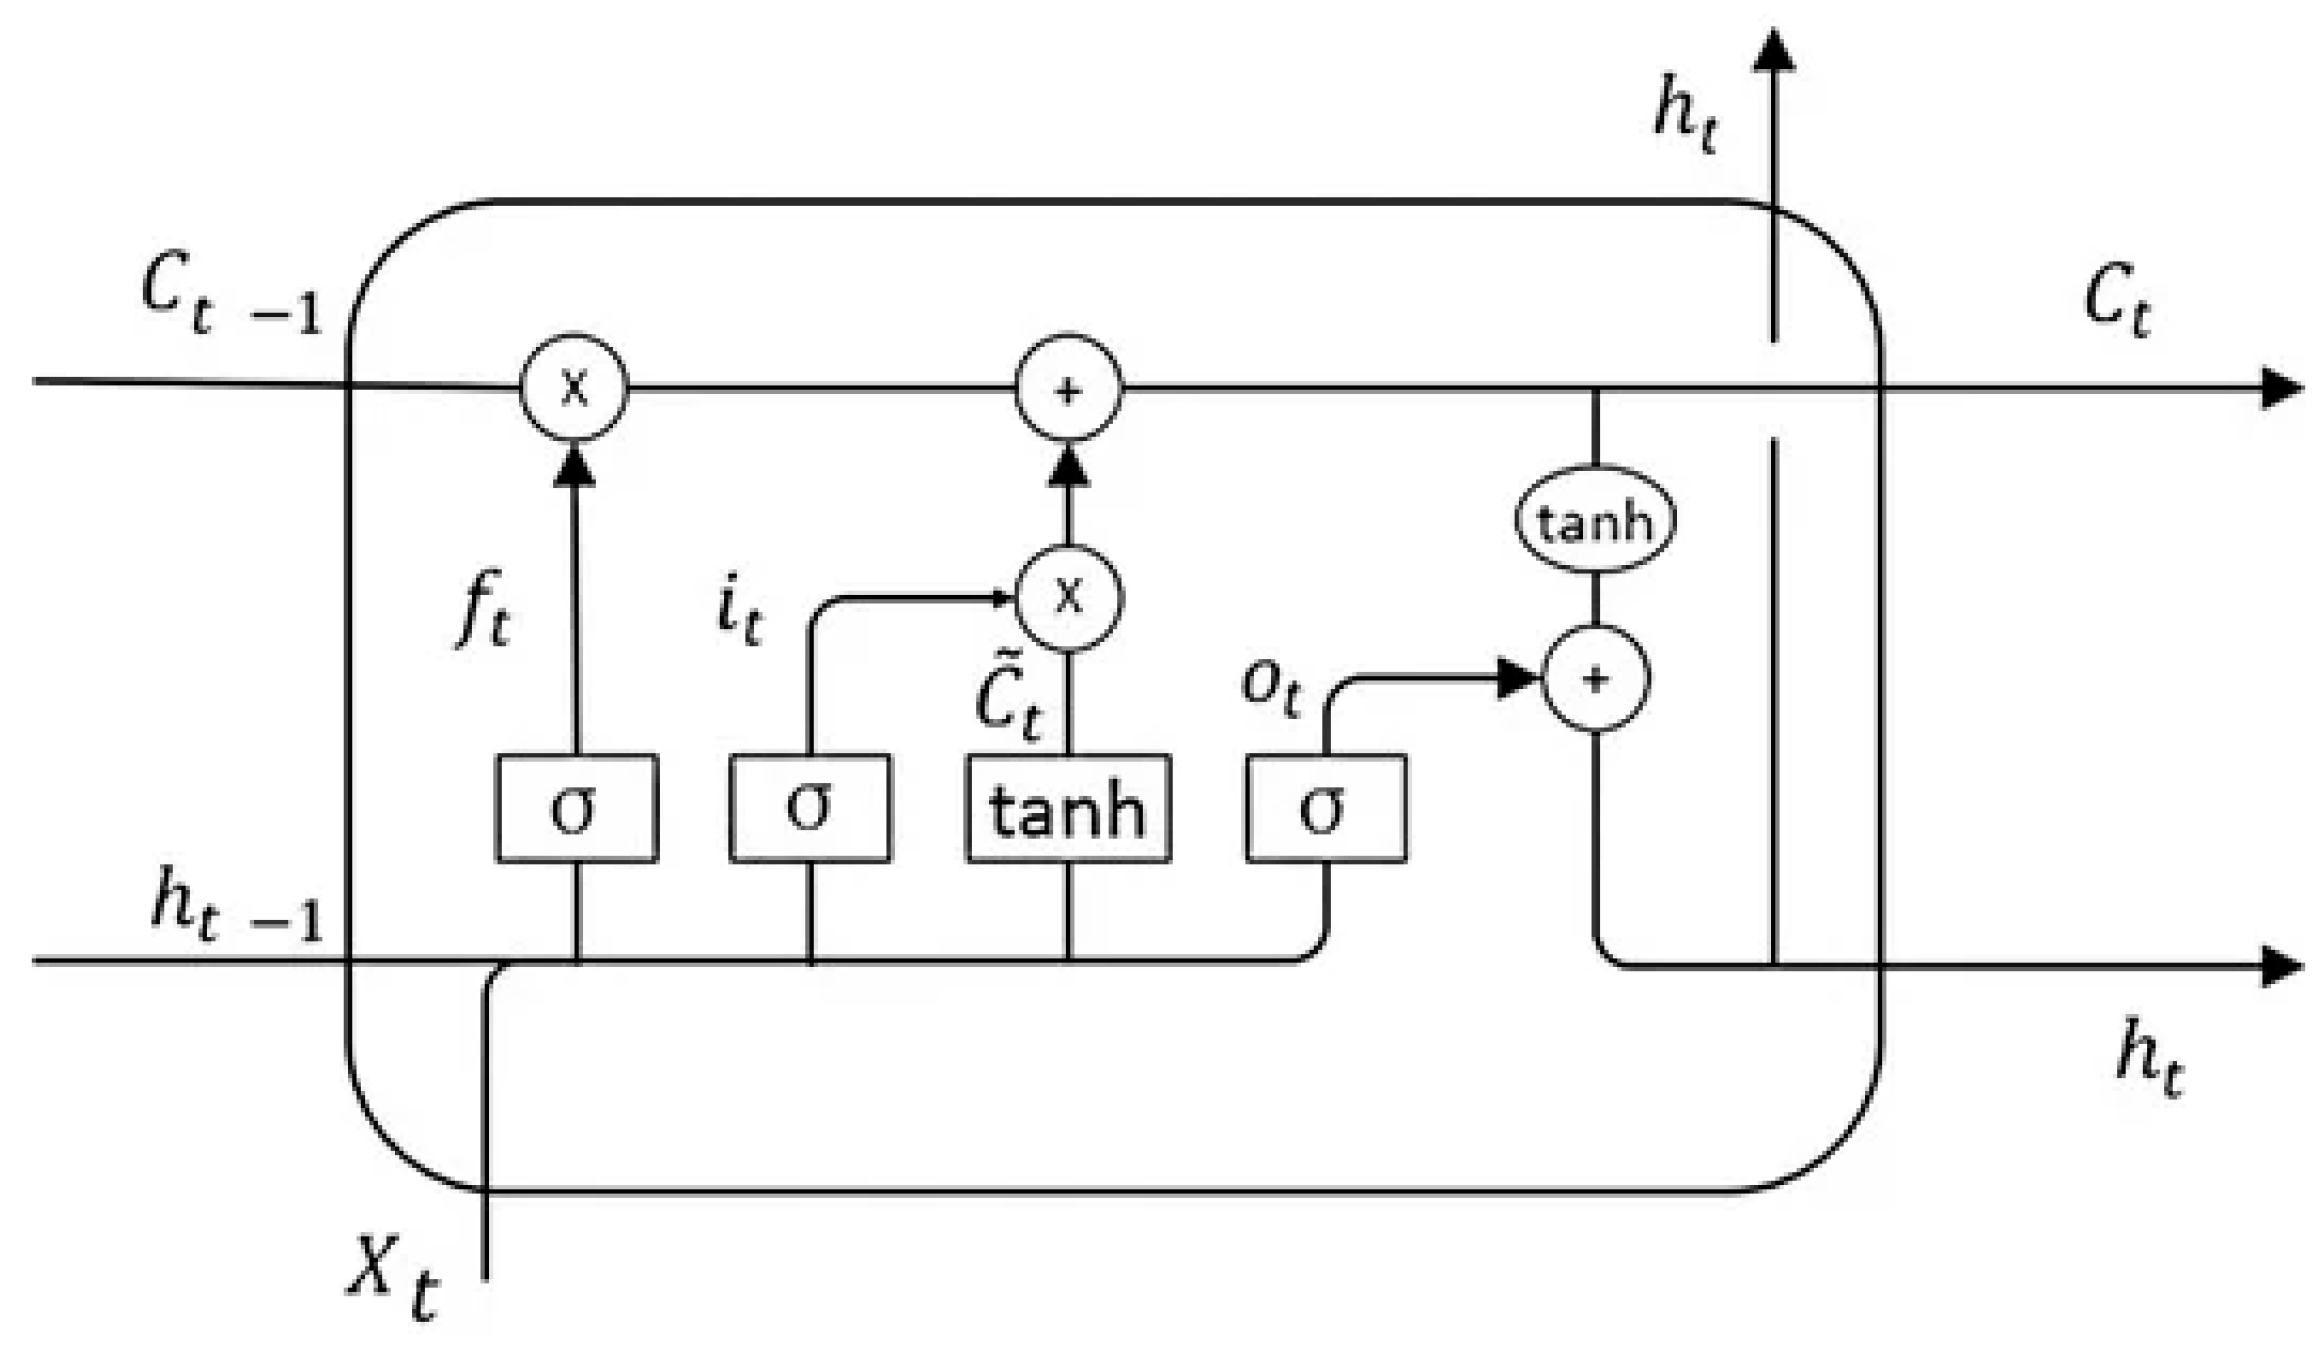
The Long Short-Term Memory (LSTM) model is a type of neural network designed for sequential data, with a unique memory feature that enables it to retain and update relevant information over time [
21,
22,
23]. The architecture of an LSTM cell, as shown in
Figure 7, comprises four key gates, the forget gate, input gate, cell state update, and output gate, which work together to manage the flow of information.
The forget gate decides how much of the previous cell state
Ct−1 should be retained or discarded. It uses the previous hidden state
ht−1 and the current input
xt, along with a weight matrix
Wf and bias
bf, to compute the forget vector
ft using a sigmoid activation function [
21]. The sigmoid
σ ensures the output ranges between 0 and 1.
The input gate determines what new information should be added to the cell state. It involves two components: the input gate vector
it, which determines the proportion of new information to incorporate, and the candidate cell state
which holds potential new values for the cell state [
24]. While
it is computed using a sigmoid function,
is calculated using a
tanh activation function to scale its output between −1 and 1.
The cell state update combines the outputs from the forget gate and input gate to update the cell state
Ct. The forget gate scales down the previous cell state
Ct−1, while the input gate determines how much of the candidate cell state
should be added. This enables the model to selectively retain old information and incorporate new information effectively.
The output gate determines what information from the updated cell state
Ct should be passed forward as the current hidden state
ht. The output gate vector
ot is calculated using a sigmoid function, while the updated cell state is scaled using a
tanh function to produce the final hidden state. This hidden state serves as both the output of the LSTM cell and the input for the next time step [
25].
5.2. Model Training
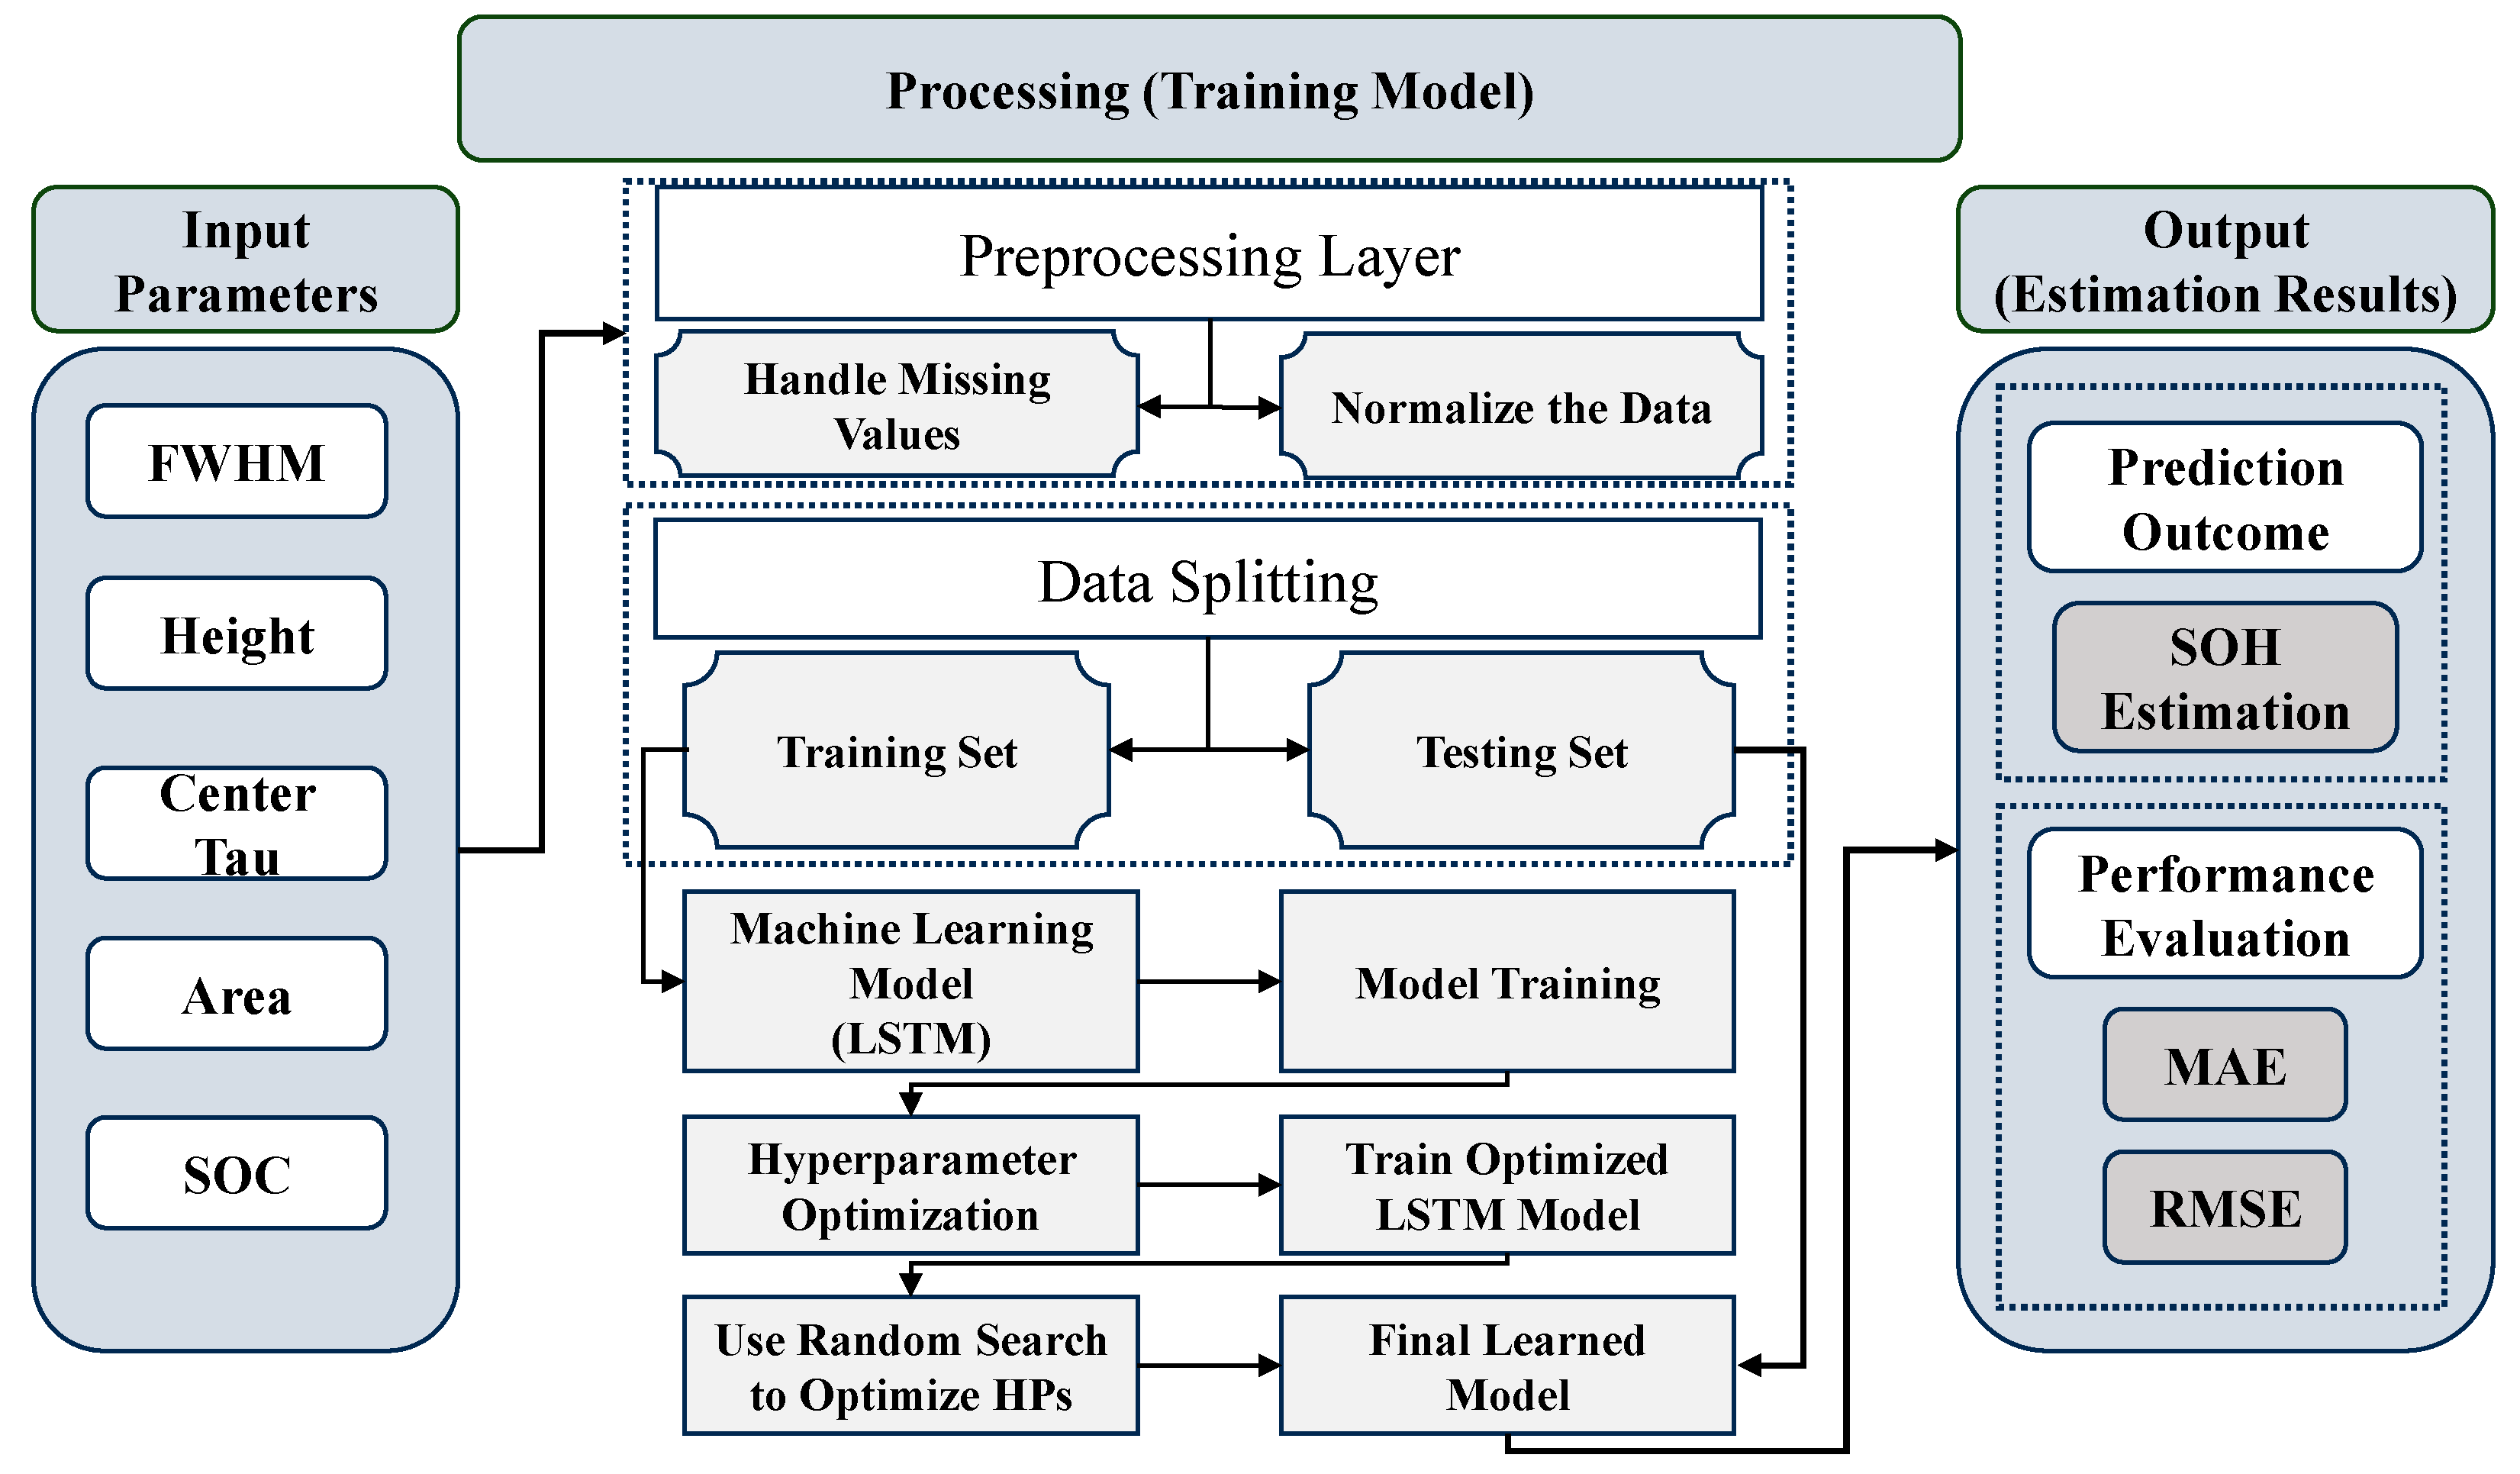
In this study, the LSTM model is trained as described in
Figure 8. The process begins with the selection of key electrochemical features as input parameters, which include DRT parameters along with the SOC to cover the different state of charge applications. In the data processing stage, the input data undergo two critical preprocessing steps. First, any missing values are handled typically when the Gaussian fitting produced outliers that interrupted the smooth trend parameters, ensuring that the dataset is complete and reliable. Second, the data are normalized to bring all input features to a consistent scale between 0 and 1, which helps improve the convergence of the model during training. After preprocessing, the dataset is split with the ratio of 80% and 20% as a training set to train the model and a testing set to evaluate its performance, respectively.
The model training process involves an LSTM model with two hidden layers, each consisting of 200 units. To prevent overfitting and improve generalization, L2 regularization and a dropout rate of 0.4 are applied. A dense output layer predicts the SOH values. The model is trained using the Adam optimizer, which efficiently adjusts weights to minimize the prediction error. The Mean Squared Error (MSE) loss function guides the training process over 250 epochs with a batch size of 32 [
26]. Additionally, hyperparameter optimization is performed using Random Search to identify the optimal values for the configuration of the model.
5.3. Model Performance
Once the final trained LSTM model is obtained, it is used to predict the SOH values for the testing set. The performance of the model is evaluated using metrics such as the Mean Squared Error (MSE) and Root Mean Squared Error (RMSE), which measure the accuracy of the predictions by quantifying the difference between the predicted and actual SOH values.
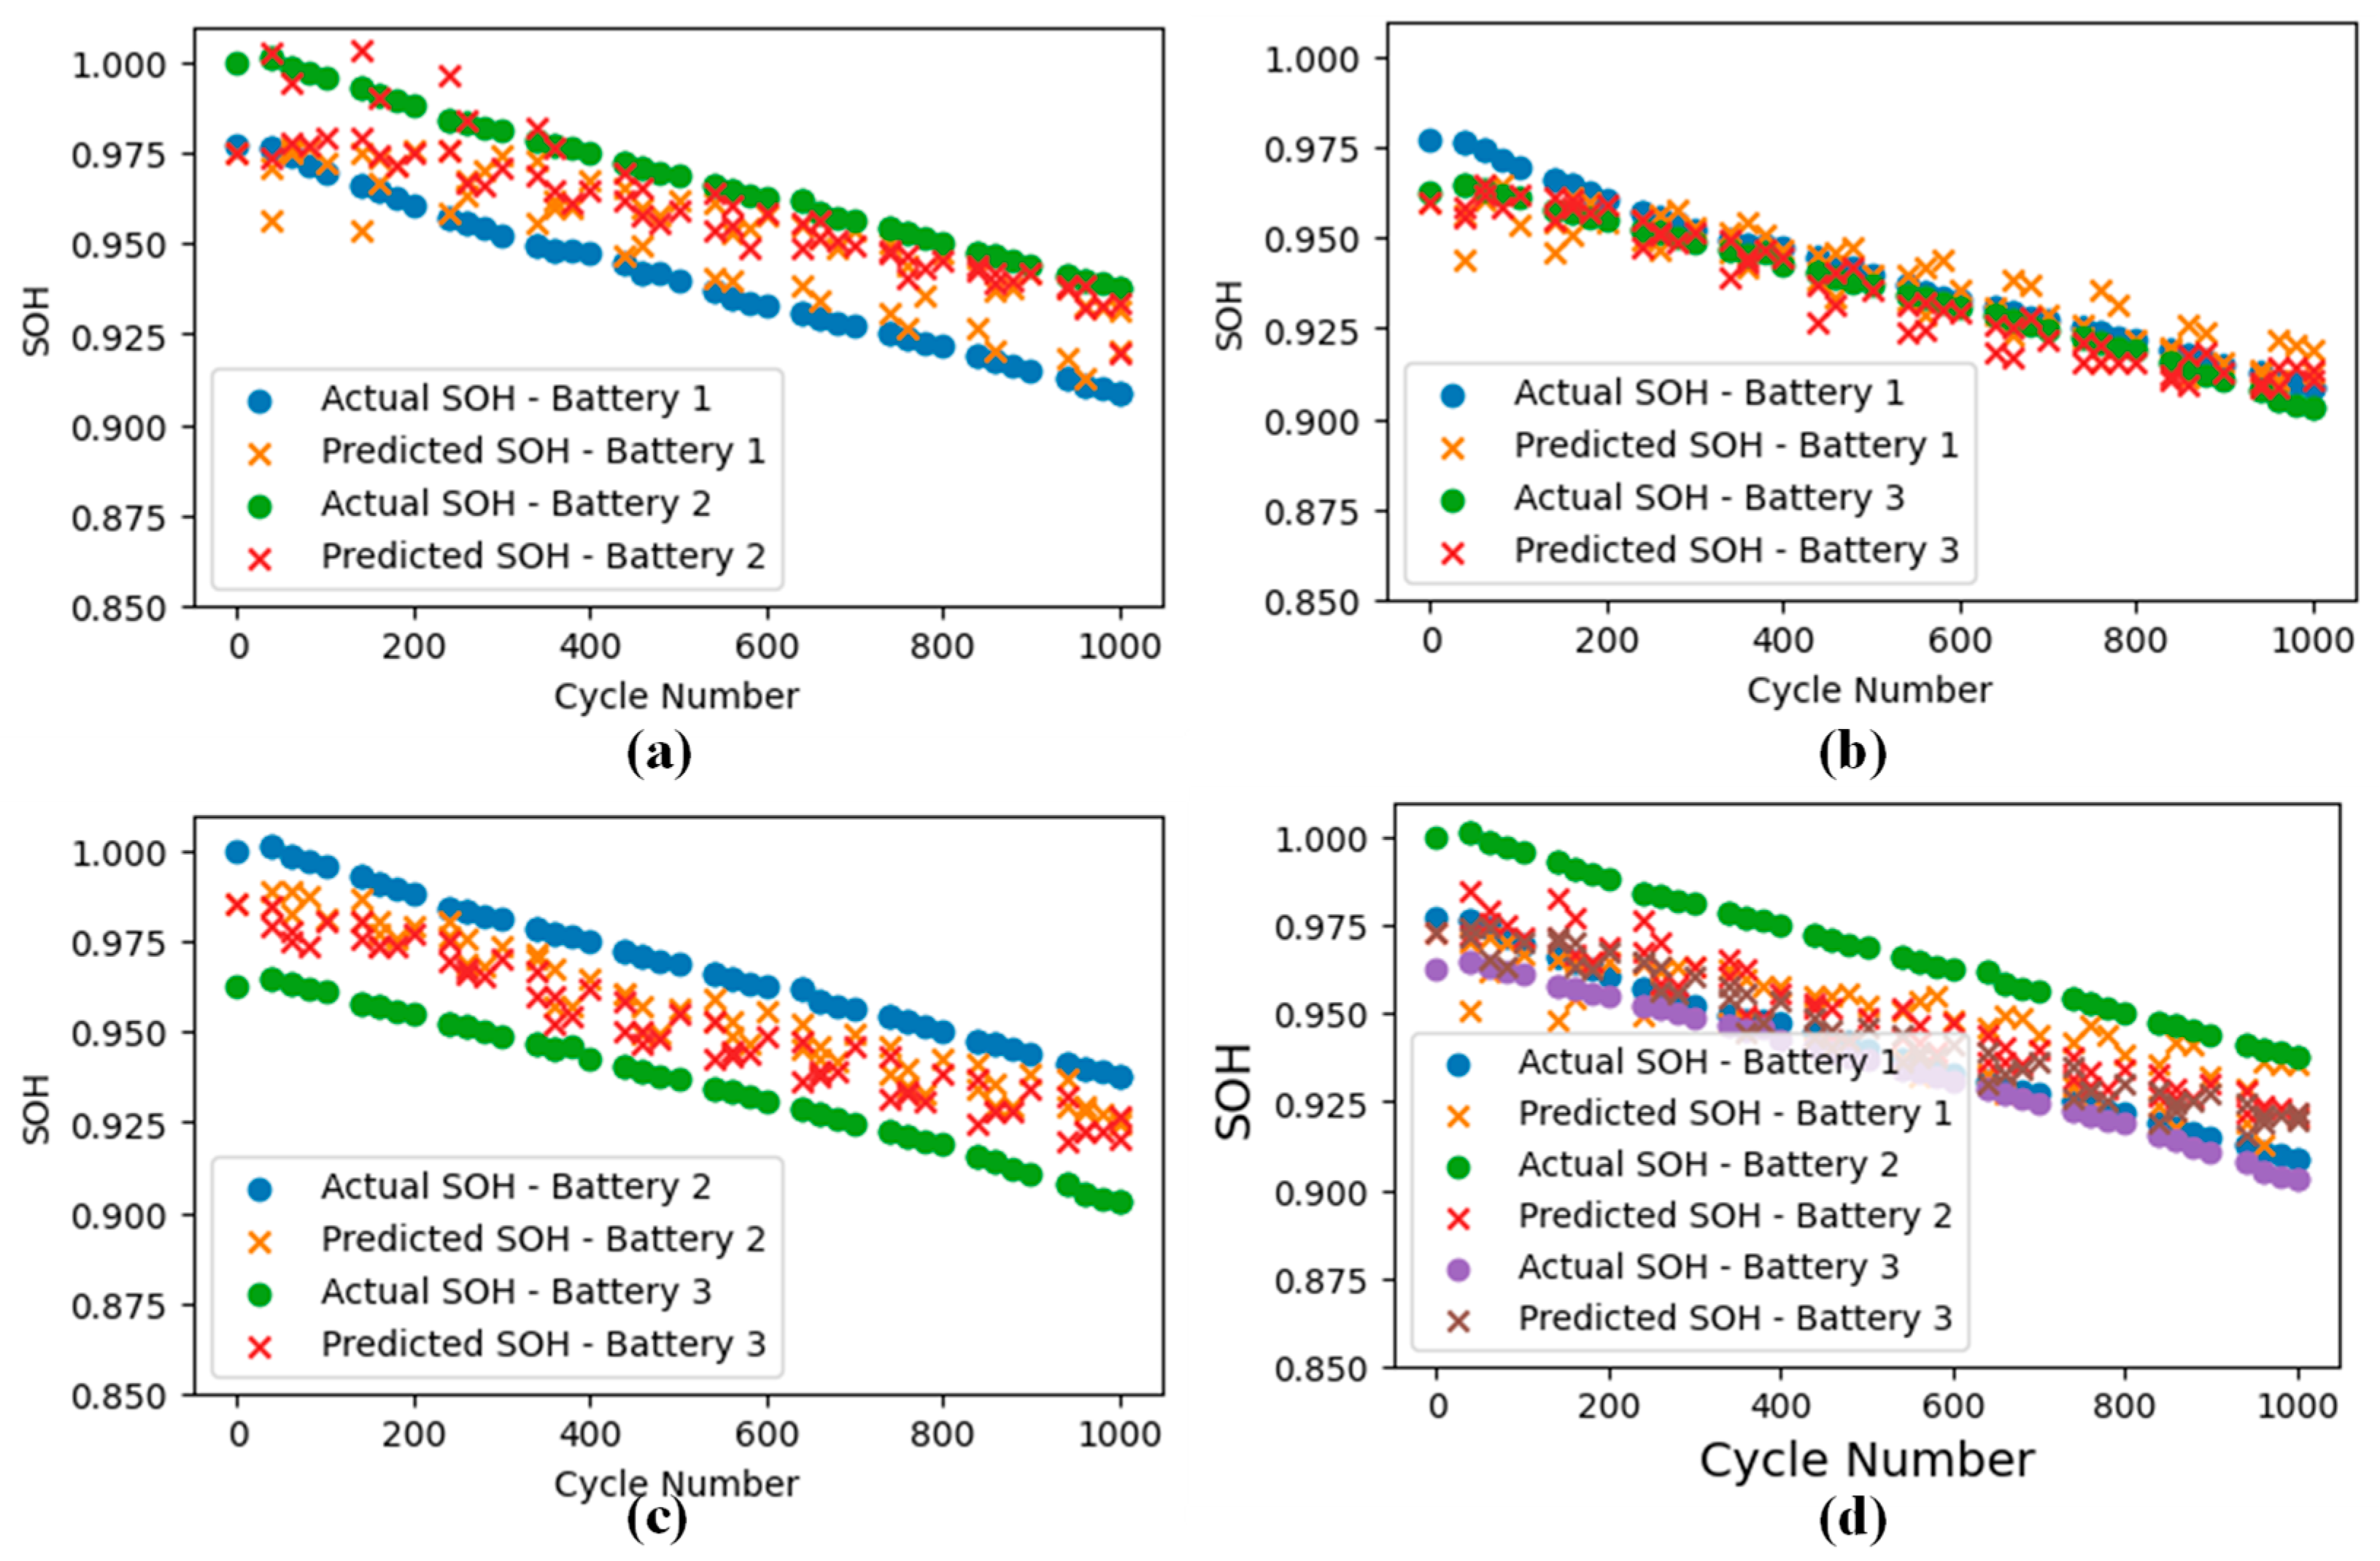
The LSTM model was employed to predict the State of Health (SOH) of three lithium-ion batteries across 1000 cycles. The results demonstrate the ability of the model to accurately capture the degradation trends of the batteries using key DRT parameters (FWHM, Height, Center Relaxation Time, and Area) and the SOC as input features. The analysis was performed using four datasets: (a) Battery 1 and Battery 2, (b) Battery 1 and Battery 3, (c) Battery 2 and Battery 3, and (d) a combined dataset including all three batteries.
Figure 9 presents a comparison of the actual SOH and predicted SOH for these datasets. The results indicate that when the LSTM model was trained and tested with datasets from Battery 1 and Battery 3, the prediction accuracy was the highest. This can be attributed to the fact that the initial capacity difference between Battery 1 and Battery 3 is minimal, approximately 1%, resulting in smaller deviations and a closer alignment between the predicted and actual SOH. The performance metrics for this dataset were particularly impressive, achieving a Mean Absolute Error (MAE) of 0.58% and a Root Mean Squared Error (RMSE) of 0.70%.
In contrast, when the model was trained and tested with datasets from Battery 1 and Battery 2 or Battery 2 and Battery 3, the prediction errors were slightly higher. The combined dataset (all three batteries) captured a wider range of capacity variations, leading to a comparatively higher error. However, the combined dataset provides a more realistic representation of real-time scenarios by incorporating diverse aging patterns across different batteries. Despite the slightly increased error, the LSTM model still outperformed traditional EIS-based ECM methods using the same dataset for a predictive battery health estimation using neuro-fuzzy [
8]. The Mean Absolute Error (MAE) and Root Mean Squared Error (RMSE), as defined below, were used to evaluate the performance of the model [
27].
where
is the total number of data points, and
represents the error for each prediction. To validate our method, we compared our proposed DRT-based SOH estimation method with an EIS-based Equivalent Circuit Model (ECM) approach by [
8]. The
Table 2 below presents the comparative quantitative error metrics, Mean Absolute Error (MAE) and Root Mean Squared Error (RMSE), for the four battery datasets.
The results demonstrate that the proposed method achieves lower error metrices across all the datasets, which clearly highlights the improvement and accuracy of the method. The inclusion of data from three cells with different capacities essentially averages out the differences across these varying capacities. It indicates that the LSTM model converges toward stable and reliable predictions by including more data. Although the higher capacity retention of Battery 2 influences the combined dataset, the model shows a better estimation capability when applied to a range of battery behaviors. Since batteries with the same chemistry share similar trends, collecting data across multiple cells ultimately leads to a more generalized model for the SOH estimation. In turn, this kind of broad coverage ensures the model can handle real-world variability and deliver a consistent performance, even when faced with different capacities within the same battery chemistry.
6. Conclusions
This study highlights the effectiveness of integrating a Distribution of Relaxation Times (DRT) analysis with EIS to achieve an advanced and accurate SOH estimation for lithium-ion batteries. By systematically analyzing DRT peak parameters (Area, FWHM, Center Relaxation Time, and Height) over 1000 cycles at six distinct SOC levels, the developed LSTM model demonstrated its capability to capture the complex temporal dependencies associated with battery aging. The model achieved an MAE of 1.28% and an RMSE of 1.41% when tested with combined datasets from three batteries, underscoring its robust prediction capability for real-time SOH estimations across varying cell capacities. The highest predictive accuracy was observed when using datasets from batteries with minimal initial capacity differences, such as Battery 1 and Battery 3, where the model achieved an MAE of 0.58% and an RMSE of 0.70%. These values underline the strength of the proposed methodology in accurately predicting the SOH while accommodating variations in battery aging trends. Comparatively, the LSTM model trained with DRT parameters outperformed the traditional ECM parameters-based estimation model by achieving a higher accuracy across different combinations of datasets.
This work establishes a reliable and scalable framework for enhancing battery health monitoring and prediction across diverse real-world applications, including portable electronics, electric vehicles, and energy storage systems. The integration of DRT parameters with advanced machine learning techniques like LSTM not only improves the accuracy of SOH estimations but also highlights the potential of leveraging electrochemical features for long-term battery performance monitoring. As this research is limited to the standard testing conditions and same kind of battery cells, future work directions will focus on analyzing the dataset of different battery chemistries and various testing scenarios to reflect real-world conditions. It will also focus on incorporating more detailed electrochemical parameters, such as those representing other processes, to provide a more comprehensive understanding of battery degradation mechanisms.


