Article

Novel Test Procedure for Assessing Lead–Acid Batteries for Partial-State-of-Charge Duty Using Internal Resistance Charge Acceptance Technique

by
Max Parker
* and
Richard McMahon
WMG, University of Warwick, Coventry CV4 7AL, UK
*
Author to whom correspondence should be addressed.
Batteries 2025, 11(4), 131; https://doi.org/10.3390/batteries11040131
Submission received: 9 January 2025 / Revised: 11 March 2025 / Accepted: 20 March 2025 / Published: 28 March 2025
(This article belongs to the Section Aqueous Batteries)

Abstract

:
Battery energy storage systems (BESSs) are often used in partial-state-of-charge (PSOC) operation due to the desire for flexibility of charge and discharge. Lead–acid batteries are a good candidate to be used in battery energy storage due to their safety, recyclability, and long cycle life; however, the correct battery, cell, and regime should be chosen to ensure effective use. Manufacturers rarely publish data on PSOC performance of their batteries. During PSOC use, the charge acceptance of lead–acid batteries reduces both reversibly and, sometimes, irreversibly as the battery is cycled. Typical dynamic charge acceptance tests target the performance required in car batteries and do not adequately demonstrate the charge acceptance expected in BESS use. This paper demonstrates a representative charge acceptance degradation test which far more closely replicates the charge acceptance degradation seen in real-world PSOC BESS use using partial state of charge, coulomb control, and a charge-factor-controlled full charge. Full charges are shown to reverse the internal resistance associated with partial-state-of-charge operation. This is the case in the Leoch lead–carbon cells and 12 V battery tested. This shows that partial-state-of-charge operation degrades the charge acceptance and increases the internal resistance of a lead–acid battery, although with a charge-factor-based full-charge approach, the charge acceptance could be reset to baseline.

1. Introduction

Battery energy storage systems (BESSs) are growing in popularity [1] for home systems, microgrids, and grid connections.
Grid-connected BESSs can be used to meet short-term energy demands, such as for frequency control [2], whereas smaller-scale home systems and microgrids are often designed for increasing self-consumption of renewable sources [3,4]. However, these can be cloud-linked to create grid-scale responses [5]. Increasing grid penetration of renewable energy sources reduces the frequency stability of the grid and the voltage regulation [2,6,7,8], although this can be overcome by using energy storage [9].
In traditional UPS or reserve applications, the battery pack algorithm is simple, as the pack is kept at 100% state of charge and only discharged when a need arises, such as during a power cut. Contrast this with a self-consumption scenario, where the battery is frequently cycled and often cycled without being fully charged or discharged. This is known as partial-state-of-charge (PSOC) operation and is often performed in BESS use [4,10].
Lithium batteries are frequently the chemistry of choice for energy storage due to their high energy density [1] despite needing specialised control circuitry to control such systems. However, lithium batteries have issues with recyclability [11,12,13] and fires due to inflammability [14]. For these reasons, insurers consider lithium battery fires an important risk factor [15], and the AIG insurance group called lithium–ion battery energy storage systems “one of the most important emerging risks today” [16]. Lithium batteries are, of course, used without any safety issues in many cases; nevertheless, the risks of failure and fire are present.
Lead–acid batteries are often used in BESSs, with advantages such as non-flammable electrolytes and active material [17]. End-of-life lead batteries can be recycled without performance degradation [18] into new lead–acid batteries, and with a recycling rate of 100%, they are the most recycled consumer product in the USA [19]. In some cases, the environmental impact of manufacturing lithium batteries can be four times greater than lead batteries [20]; however, this depends on the exact methods of manufacture, analysis, and chemistry. The algorithm for control of lead–acid batteries that permits high bidirectional current flow to be achieved and high uptime and that maintains capacity is uncertain. This paper demonstrates a different test method that can be used to test batteries to assess their use in self-consumption scenarios, which require high bidirectional current flow.
Lead–acid batteries are not without flaws, such as low gravimetric and volumetric energy density and gas emission, and when used in a BESS, the battery is often cycled without reaching the extremes of states of charge. In lead–acid batteries, this brings advantages of greater charge speed [21], avoiding the deleterious side reactions that occur at high states of charge [22,23] and avoiding the damage that can be caused by deep discharge [24]. However, the more a lead–acid battery is cycled without a full charge, the more the charge acceptance decreases and the non-ohmic internal resistance increases [25]. Periodic full charges are critical for good lifespan of the cell [26] and also help to maintain charge acceptance. The timing of these full charges is dependent on many factors, such as cell type, temperature, cyclic history [27], etc. Thus, a method for establishing timing of the full charge is of great benefit for any user wishing to operate a BESS pack.
The general reaction of a lead–acid battery is shown below [28] in Equation (1), with the fully charged state on the left and the fully discharged state on the right. The positive electrode is made of lead dioxide and the negative is lead, with an electrolyte of sulphuric acid of usually 1.28 kg/L [29] (around 30% by volume); the electrolyte is used in the reaction.
P b O 2 + P b + 2 H 2 S O 4 2 P b S O 4 + 2 H 2 O
P b S O 4 , or lead sulphate, is formed during discharge and self-discharge, and it forms crystals on the surface of and within the plates [22]. Upon recharge, the crystals are dissolved. It is the dissolution of these lead sulphate crystals, particularly in the negative active mass, that is often the limiting factor in the charge speed of a lead–acid battery [30]. Increasing the charging voltage does not significantly increase charge speed beyond a point [30]; however, it does increase the rate of gas generation in the battery and the rates of corrosion.
The sulphate crystals are only fully dissolved when fully charged, which means that in PSOC, where the battery is rarely fully charged, there are sulphate crystals present at almost all times. Every subsequent cycle causes the sulphate crystals to grow larger and larger in a process known as Ostwald ripening [31]; this is because it is thermodynamically preferable for a crystal to get larger rather than for a new crystal to form, and the charge acceptance decreases.
Charge acceptance is primarily dictated by state of charge, cell design, and charge/ discharge history. Cell design can be changed to improve the charge acceptance by using a different particle size in the plates, thinner plates, a smaller pore size, or additives such as carbon [32]. The charge and discharge history alters the charge acceptance: if the battery is cycled without full charges, the charge acceptance decreases, and it increases following full charge [33] (assuming the same SOC).
For automotive batteries, there are standardised dynamic charge acceptance (DCA) tests, which have been used and modified in many papers [33,34,35,36,37,38], and standards such as EN 50342-6 [39] and the Japanese SBA S0101 2014 [40], but these tests are not at all representative of BESS use. This is due to standard automotive testing on the battery being conducted following a recent discharge, as the discharge increases the charge acceptance by around three times [33]; being combined with a ripple, such as EIS, which can add an additional 50% to the charge acceptance [38]; or, additionally, being tested following a recent full charge. None of these scenarios are analogous to BESS use.
For these reasons, a new test procedure that is closer to real-life use was created. Instead of focusing on creating a scenario for optimum charge acceptance, the test focuses on realistic use-case cycle-by-cycle degradation in charge acceptance, the increase in internal resistance, and charge-time monitoring. A periodic full charge is used to reset the charge acceptance; this is the charge factor to be controlled.
Based on the results of the test, cells or batteries can be compared and a suitable cyclic regime for each cell can be developed. PSOC operation was reported to cause rapid capacity loss in certain cases [25,41,42], although with the correct regime and battery, this is not a significant issue. This test allows comparable datasets to be created if the exact same regime is tested.
Two different batteries were used for the demonstration of this test regime: two sub-types of valve-regulated lead–acid batteries, which are often used in energy storage situations [43], AGM (absorbed glass mat) and gel. AGM batteries adsorb the liquid electrolyte into a fibreglass mat. In gel-type batteries, the electrolyte is mixed with silica, forming a brittle, gel-like substance [44]. Both constructions recombine the water that is electrolysed, so gas emission is minimal [45].
The first type of cell tested was a 2 V valve-regulated lead–acid absorbed-glass-mat cell provided by Leoch UK, and the second type was an LDC12-15, which is a 12 V Leoch 15 Ah lead–carbon AGM–gel battery. The AGM–gel hybrid can improve lifespan [44], and lead–carbon can improve dynamic charge acceptance and lifespan; however, the exact effect depends on the type of carbon used and its proportions [46]. The charge acceptance of the batteries was assessed, and the charge times were compared. The 12 V battery was charged by a constant voltage, as dictated by the datasheet, of 14.7 V or 2.45 V per cell, whereas the (nominally 2 V) cells were fully charged by a constant voltage, as dictated by the datasheet, of 2.35 V per cell. The higher charge voltage likely decreases charge time, but it may negatively impact the lifespan.

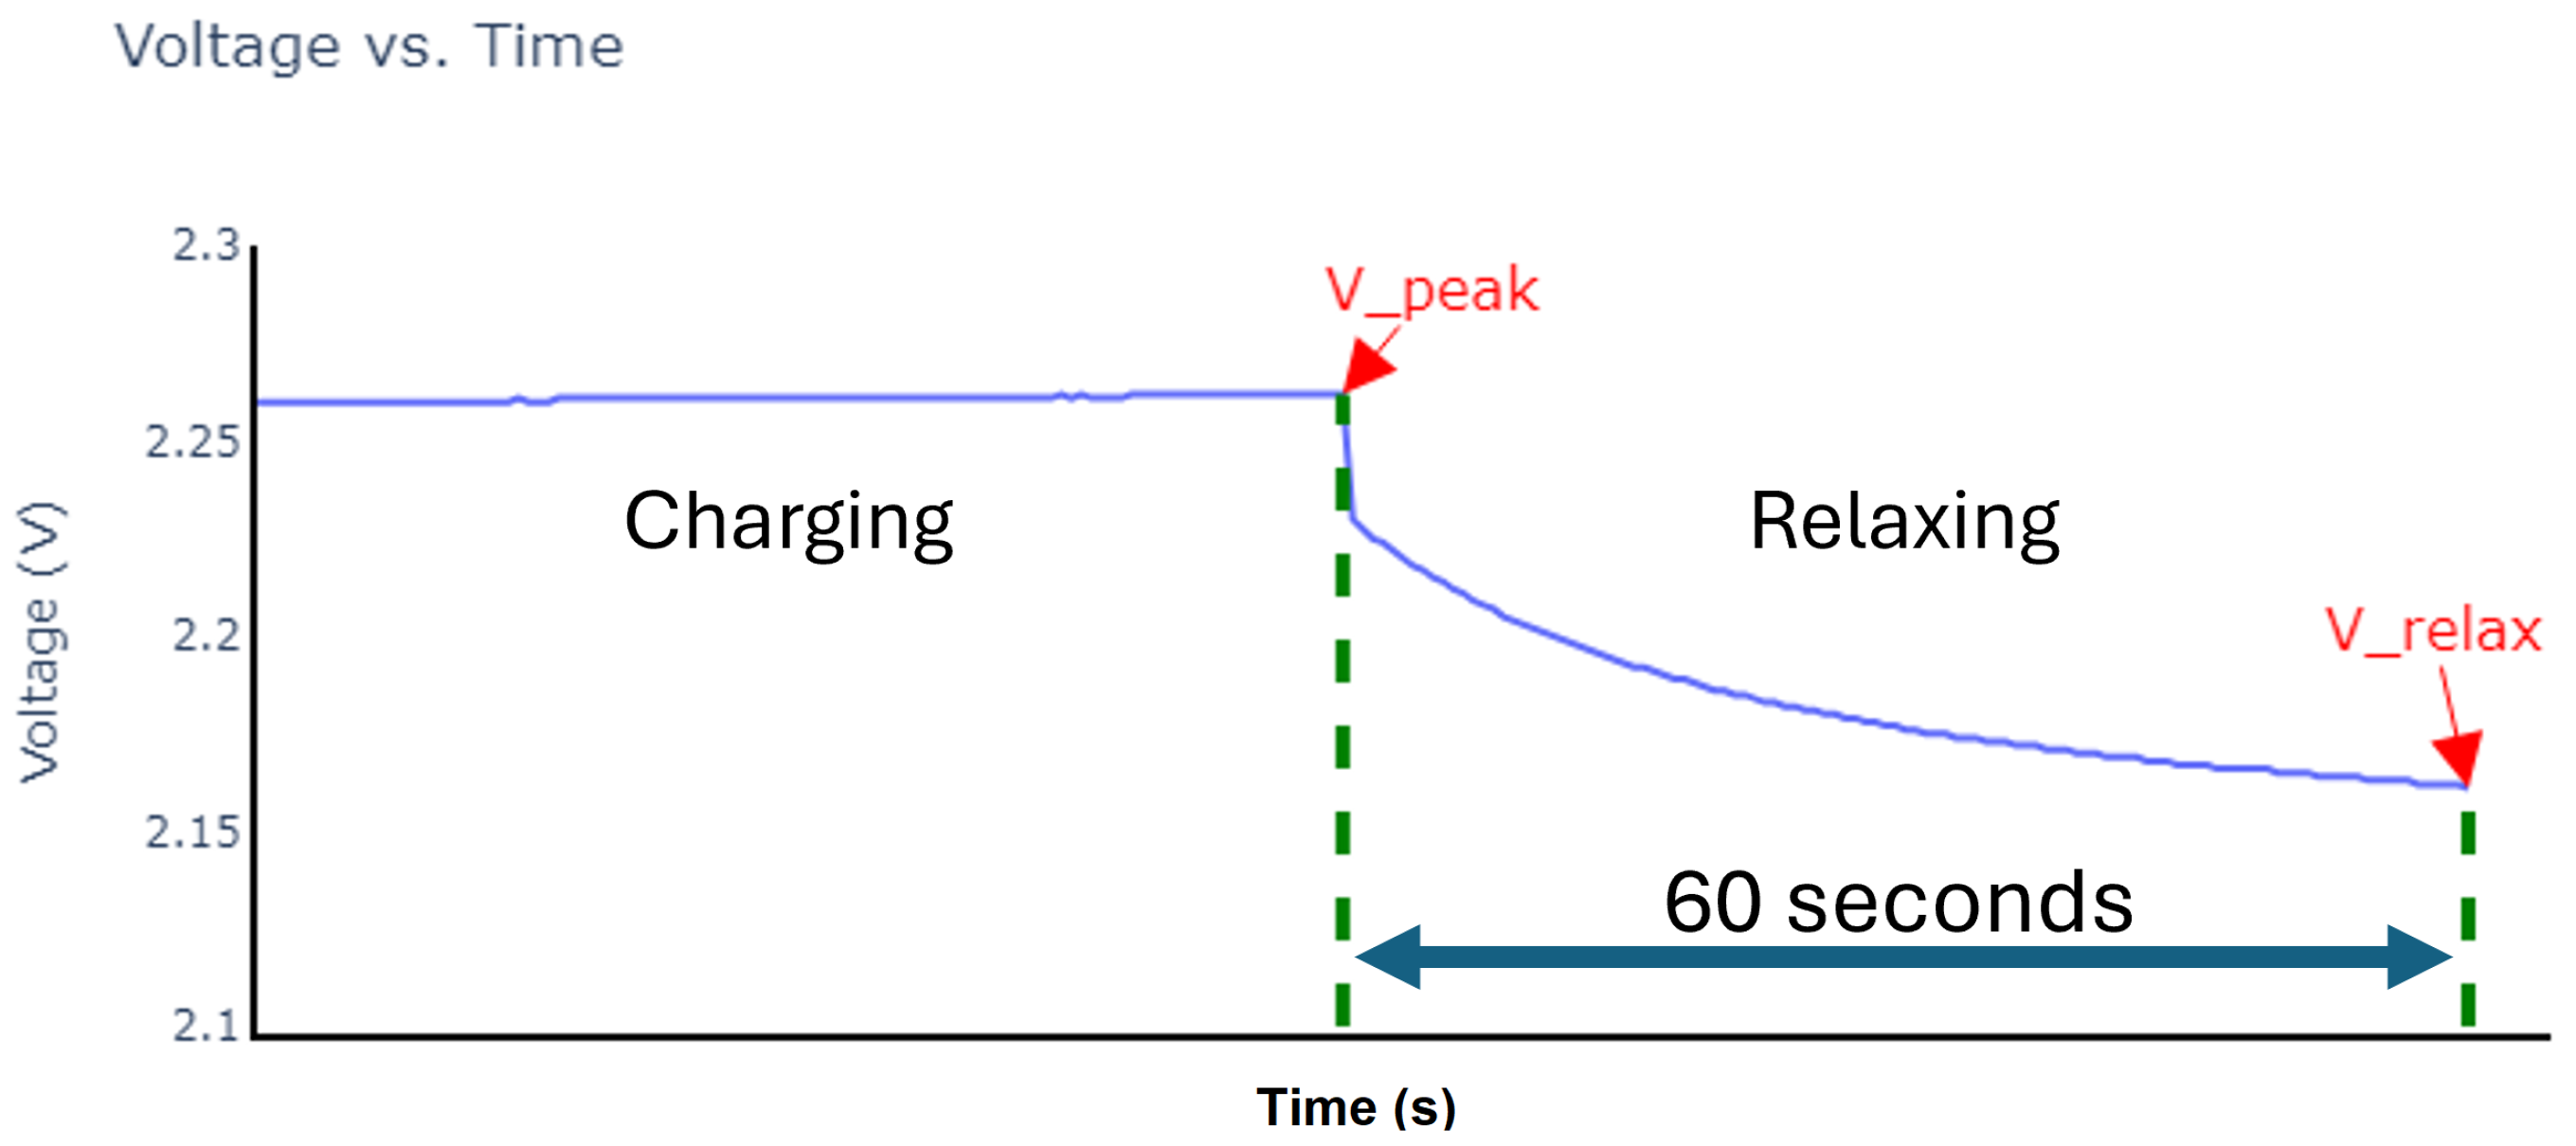
2. Test Design and Setup

The Leoch LRC2-300 cells were bought from Leoch, and an initial charge procedure was followed based on conversations with Leoch. The cell is an AGM absorbed-glass-mat type with silicon dioxide dissolved in the electrolyte, like a gel battery—this helps to resist stratification effects [44]—with acetylene black and carbon black additives, increasing conductivity-limiting pore size [32], which can limit maximum sulphate crystal size. The use of B a S O 4 additives allows for a greater number of nucleation sites, further reducing sulphate crystal size [47]. The design of this cell means that the cell was a good candidate for PSOC use and hence was a good candidate for testing in this paper.
The initial charge procedure was as follows: a CC/CV charge at 0.1 C (30 A) until 2.35 V, maintain the CV step for 16 h, rest for 2 h, then discharge at 0.1 C for 4 h, charge at 0.1 C until 2.35 V, maintain for 16 h, then capacity-test at 0.1 C. This was the procedure followed, and the capacity test results were as follows: Cell 1: 374.08 Ah; Cell 2: 374.74 Ah.
During testing, the partial state of charge can be voltage-controlled, such as in the work of Franke and Kowal [48]; however, due to the variable charging resistance, this leads to variable SOC ranges. A better method, as suggested in this work, is coulomb control, cycling with specific Ah throughput per cycle. This allows the voltage to be the dependent variable [49] in this experiment and is what is measured.
The cells were contained in a thermal chamber set to 20 degrees, and this temperature was maintained throughout the experiment to isolate the effect of changing temperatures on the voltage and resistance in the battery. A Bitrode cycler was used to cycle the cells and log the data.
A 12 V battery, also an AGM–gel hybrid type, was used to test the proposed regime. This was an LDC12-15 15 Ah battery not designed specifically for BESS use; however, it was used as a point of comparison. Cycling for this was performed at room temperature in a climate-controlled room set to 21 degrees Celsius, and all measurements were performed using a Biologic SP-300, Biologic is a French manufacturer, based in Seyssinet-Pariset near Grenoble, and sells equipment directly to universities and companies, the SP-300 is a single channel cycler and potentiostat.
The upper and lower state-of-charge limits used in this work were 80% and 40%, respectively. This is reflective of the goals of a grid-connected BESS where maximum input and output current should be available at all times. As mentioned earlier, full discharges should be avoided for better lifespan [50], and a periodic full charge is essential for maintaining the health, chargeability, and capacity [51]. The full charges were not time-controlled and were instead charge-factor-controlled. Charge factor is the ratio of charge input vs. charge output and should always be greater than 1. High-precision equipment was used for this test, and all channels used for this test were recently calibrated by the manufacturer. The actual time to fully charge a lead–acid battery is variable and depends on the level of sulphation and the battery history [49]. A charge factor of 1.05 was used as a result of conversations with Leoch; full charges that are inadequate cause degradation due to not adequately removing sulphate crystals [51]. Charge-factor control aims to ensure that the overcharge provided is adequate but not excessive.
The charge rate for the cells tested was based on C/7 of the nominal capacity, despite the actual capacity being around 125% of the nominal, and began from a timed full charge based on the datasheet. This full charge became the 100% SOC nominal; discharging 20% made the SOC 80%, and another 40% set the SOC to 40%. Cycling with 40% throughput per cycle was repeated until the required number of cycles were complete, and then the cell was fully charged. Because all of the charges in and out are based on the original capacity, the cyclic regime can be prepared in advance. The capacity for the test is assumed to be constant and does not change with battery degradation, which, over the short test period, was minimal; as such, the algorithms were for the same throughout.
E q u a t i o n s u s e d f o r C o u l o u m b c o n t r o l :
A h 1 = A h t o g e t f r o m 100 % S O C t o 80 % S O C = 0.2 × B a t t e r y C a p a c i t y
A h 2 = A h t o g e t f r o m 80 % S O C t o 40 % S O C = 0.4 × B a t t e r y C a p a c i t y
A h 3 = A h t o g e t f r o m 40 % S O C t o 80 % S O C = 0.4 × B a t t e r y C a p a c i t y
T o t a l C h a r g e O u t = A h 1 + ( C y c l e s × A h 2 )
T o t a l C h a r g e I n = A h 1 + ( C y c l e s × A h 3 )
A h 4 = E x t r a A h o n c e b a t t e r y i s a t 100 % t o m a k e c h a r g e f a c t o r 1.05 :
A h 4 = ( T o t a l C h a r g e O u t × C h a r g e F a c t o r ) ( T o t a l C h a r g e I n )
The data available from this short test were indicative of the performance in PSOC. The time it takes to reach a state of full charge can be compared, and a cell that reaches full charge faster is more beneficial because this may be indicative of smaller average sulphate crystal size, which can be influenced by smaller average pore size [32]. The voltage reached on a cycle-by-cycle basis can also be useful; if the cell reaches excessively high voltages due to the increasing internal resistance, this is indicative of a cell that is not suitable for the regime, and a lower SOC or current is needed. The difference between the upper voltage reached and the relaxation voltage can be used to find the voltage drop or resistance to charge, which is a combination of the ohmic resistance of the cell due to current flow through the current collectors and the electrochemical resistance of the cell. As the cell ages, this test can be repeated, with higher voltage drops being indicative of degradation, such as water loss [52], greater positive grid corrosion [53], or greater sulphation [43].
When the battery reaches 80% SOC, determined by coulomb counting, charging stops, and the battery or cell is allowed to rest for one minute. The difference between this peak voltage at 80% and the relaxation voltage after one minute is then found as shown in Figure 1. As shown in Figure 1, the voltage increases with constant current application, however as the current application ceases, the voltage immediately drops down and decreases over time. The difference between the peak voltage and the relaxation voltage can then be used to find the internal resistance or, more specifically, the resistance to charging at that current and state of charge. Relaxation open-circuit voltage after one minute is not exactly equal to the true open-circuit voltage [54], but providing the time is consistent between tests, comparisons can be made both between the same cell or battery at different stages of cycling and between different cells or batteries. This voltage drop technique is similar to the Galvanostatic Intermittent Titration Technique (GITT) tests used in lithium batteries, but the repetitive cycling aspect used in this test is more representative of the expected use case of lead–acid batteries in BESS service. This work was also inspired by the work of Franke and Kowal [48], who used the difference between charge and discharge voltages to find internal resistance. However, in that work, the upper SOC limit was voltage-controlled, meaning that due to each cycle having a higher internal resistance than the last, the SOC that the internal resistance was measured at decreased in each cycle. Charge acceptance, as mentioned earlier, is partly SOC-dependent [21].
C h a r g e R e s i s t a n c e = V p e a k V r e l a x I

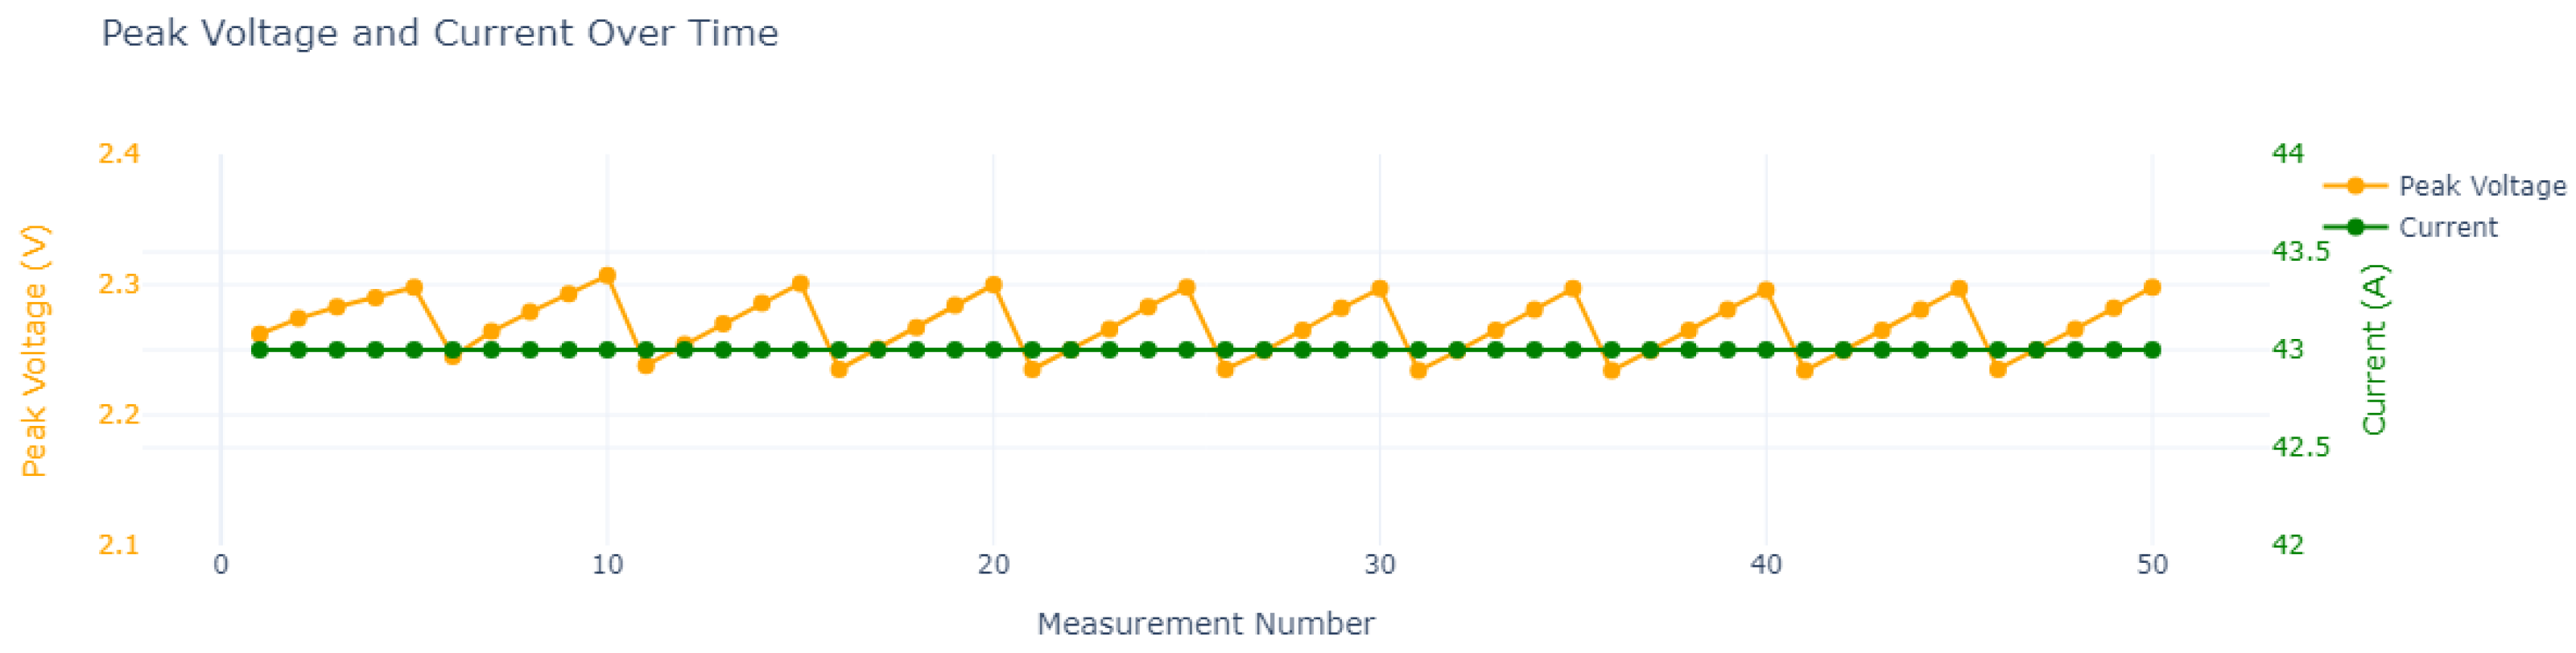
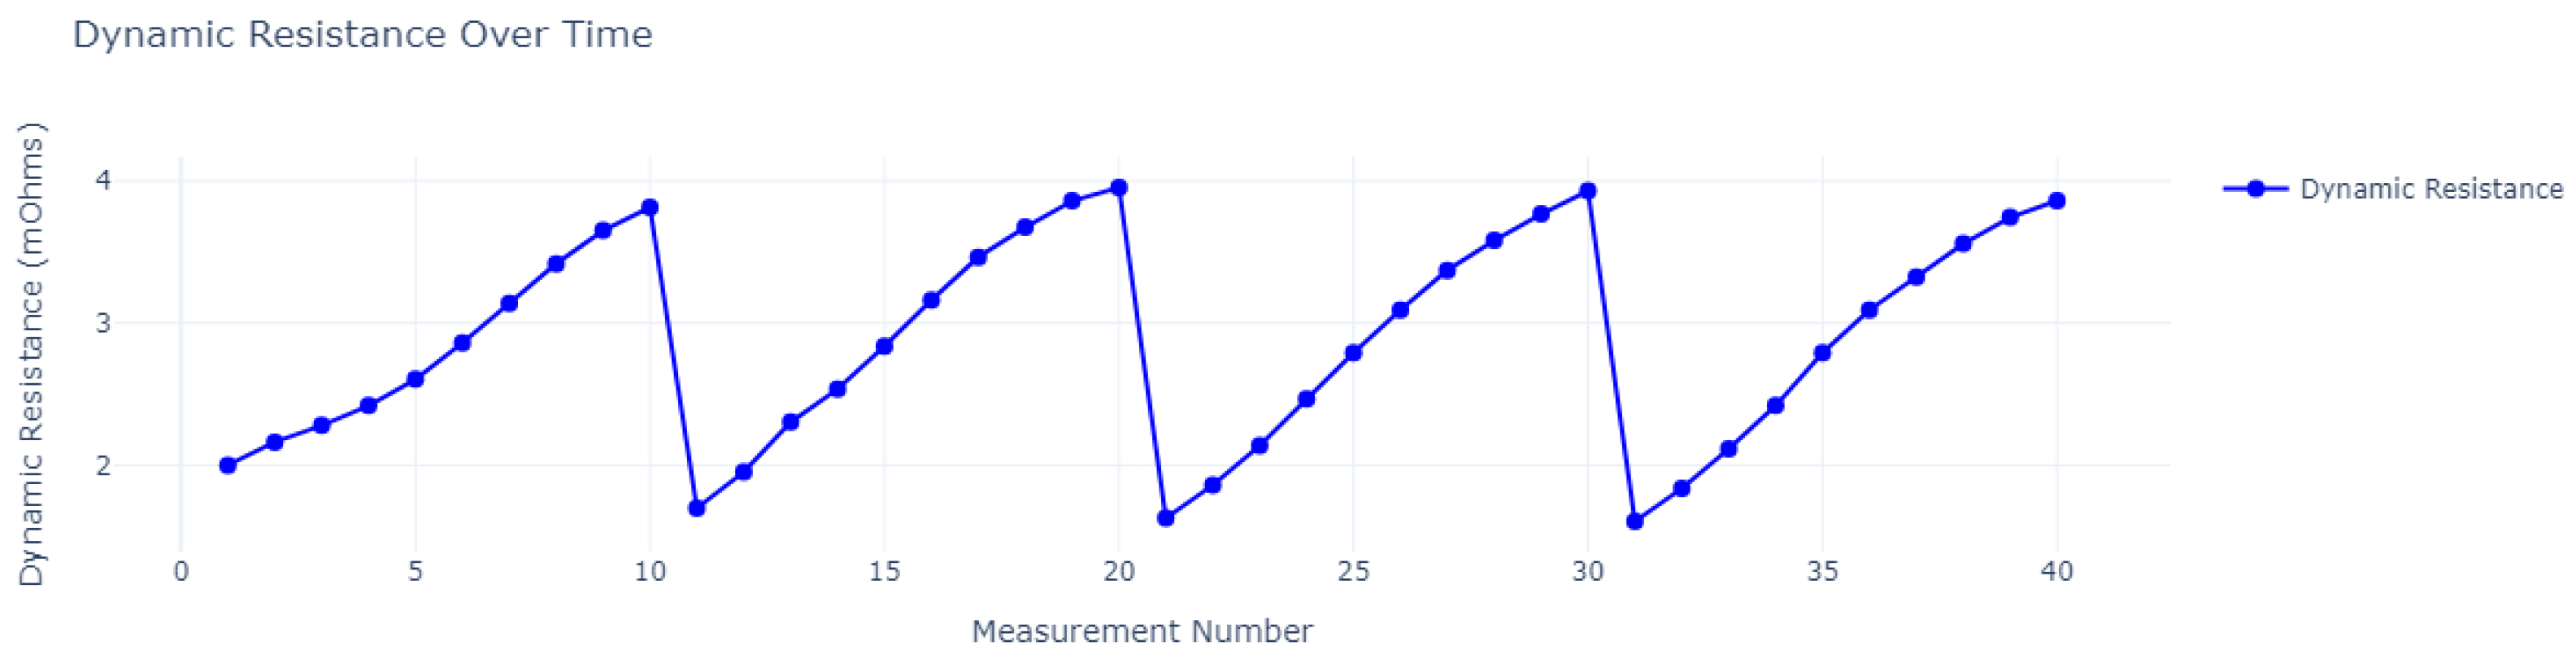
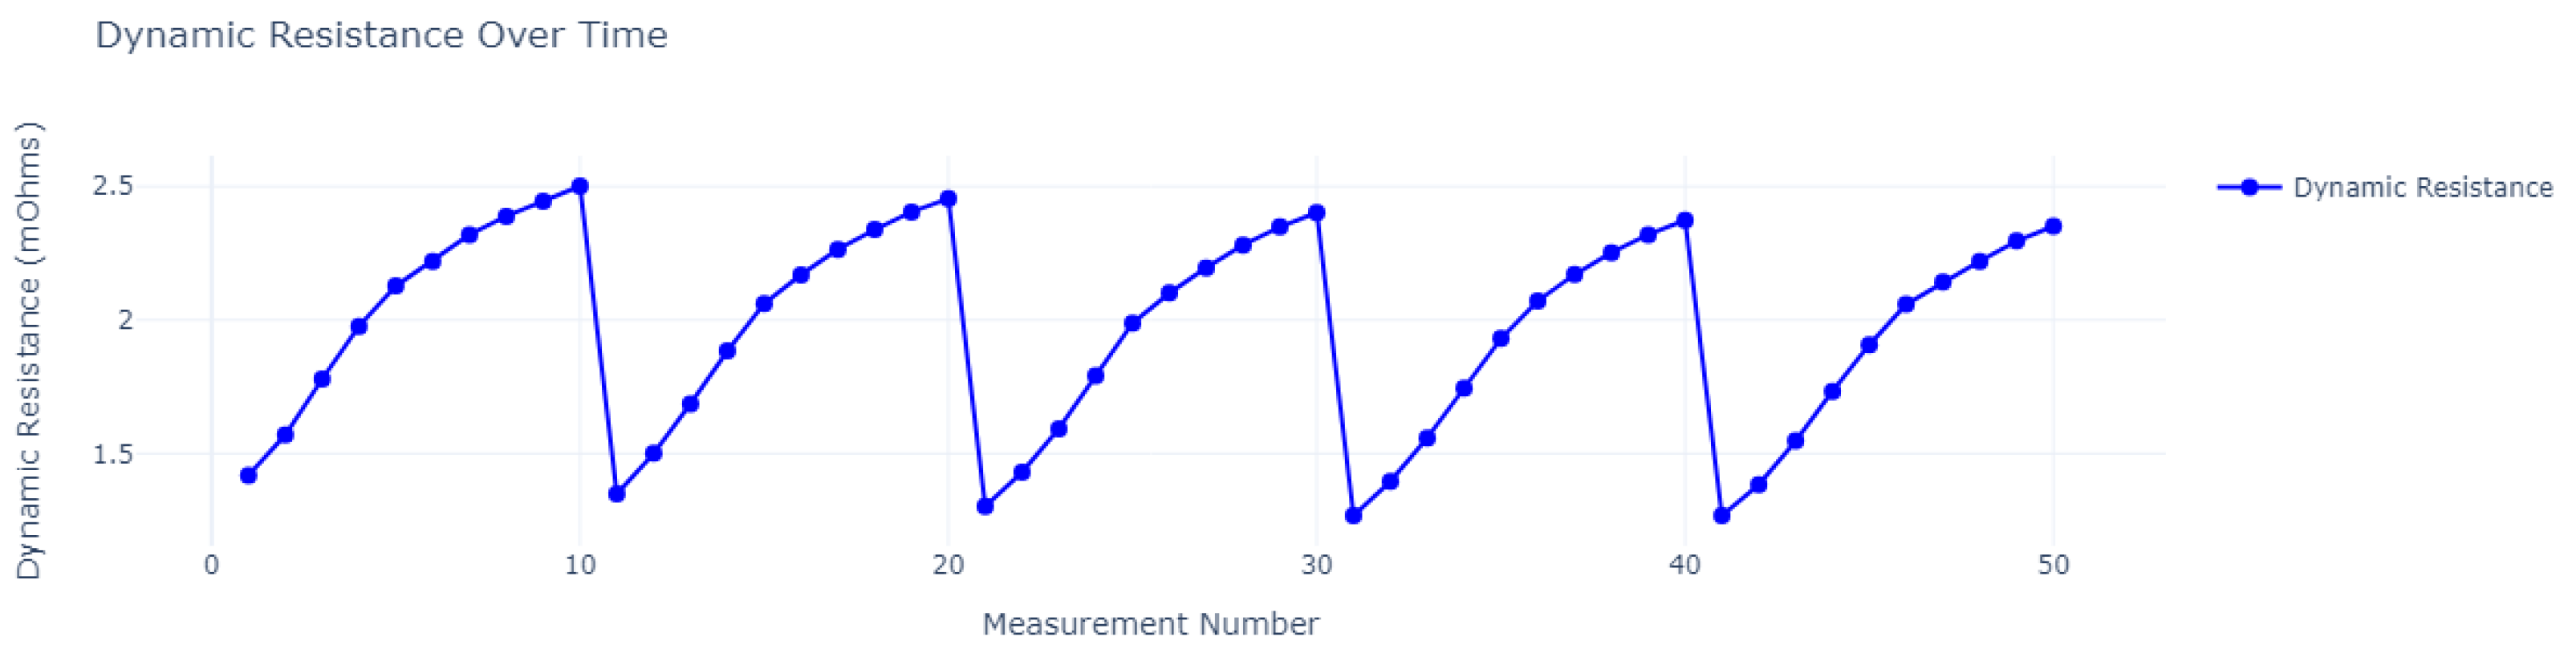
3. Single-Cell Test Results

Two intervals between full charges were tested, 5 cycles and 10 cycles, which are within the expected range for a BESS [10] with a 40% SOC throughput. The same 1.05 charge factor was used in every test, as this leads to different quantities of additional charge being added, as defined in Equation (7). The current rates tested were 43 A and 86 A, which corresponded to C/7 and C/3.5 as a ratio of the capacity determined during the initial capacity test. BESS usage can include currents as high as 4C and as low as C/200, as reported in the literature [55], so the current levels used here were not outside of what could be expected. In this experiment, the upper cutoff voltage was 2.35 V, and if the charge acceptance fell such that the constant current would have exceeded this, the current was reduced such that the 2.35 V limit was not exceeded. The higher-current test could cause higher voltages to be reached due to Ohm’s law; however, discharging at higher rates leads to sulphate crystals that are closer to the surface of the plate, with possibly likely larger crystals of lead sulphate because the crystal growth rate is greater than the nucleation rate [25]. This would likely lead to an increase in charge time as the discharge rate increases; this was seen in the demonstration in this paper.
The time taken to charge from 80% SOC until the correct amount of charge has been replaced, as defined by Equation (7), was measured. In certain regimes, this charge time can be variable [49]. In this test, the charge time was quite consistent. A long and constantly increasing full-charge time signals that the regime or full-charge procedure is potentially unsuitable for this battery long-term, as is a continually increasing internal resistance that does not reset.
The charge times were quite consistent on a cycle-by-cycle basis, as shown in Table 1, contrary to other cells tested under a similar regime [49]. The higher charge rate had shorter full-charge times in both cases; the full charge was conducted at a constant voltage 2.35 V. Lam et al. explain that higher charge rates lead to sulphate crystals that are closer to the surface of the plate [25], which leads to greater pore blockage but potentially easier dissolution of the crystals, which explains the shorter charge rates. As the cell ages, more pathways for oxygen to flow open up, and as these cells were new when delivered, some of the decrease in charge time could be ascribed to the increased gas pathway within the cell [52].
The upper voltage reached at 80% SOC was also logged. To reduce damage due to excessive voltages, this was capped at 2.35 V during the cell test; however, the resistance could still be approximated and compared by looking at the current absorption during the constant voltage step as the cell hit 80% SOC. Initially, the charge rate was at a low rate of 43 A, and the results for this are shown in Figure 2 and Figure 3. The 2.35 V limit was only the limiting factor during one cycle, and this was during cycle 20, where the current was reduced slightly in order to not exceed the 2.35 V limit.
As shown in Figure 4, after five cycles when charged at the higher rate, the cell reached the 2.35 V voltage limit before the cell reached the 80% target. This is most likely a result of progressive sulphation primarily of the negative plate, leading to worse charge acceptance [30]. This is due to the lower surface area of the negative plate [56]. This trend of worse charge acceptance continued cycle by cycle, as shown by higher and higher voltages, and then, the cell was unable to charge at the defined charge rate before hitting 2.35 V. The increasing resistance trend is thus demonstrated by the decreasing current absorption at the 2.35 V limit.
As expected, the upper cutoff voltage was reached earlier in the cycling; the higher current of 86 A was too high after six cycles, with only approximately 75 A able to be absorbed at 80% SOC when the 2.35 V voltage limit was reached.
The increase in resistance that is experienced during the cycling can be quantified as shown in Equation (8). Applying this equation to the cells tested results in a graph that also shows the drop in resistance that occurs as a result of the full-charge procedure, with the resistance to charge halving from 4 m Ω to 2 m Ω , as shown in Figure 5. This resistance is dependent on the current due to the non-linear resistance in batteries; however, for the majority of cycles, the current did not change. The internal resistance does not increase as quickly as the voltage increases further; this is because new current paths open as electrolysis of the electrolyte occurs. It is for this reason that even when the current is the same, the rate-of-resistance increase cycle by cycle is lower. A greater proportion of the current is being used in side reactions, which are deleterious.
When the current is reduced due to the voltage limit being hit (such as in Figure 6), the resistance also does not increase to the same level that it would if there was no voltage limit. This resistance effect is due to the non-linear resistance that occurs in batteries. When comparing the results with other cells, care must be taken if the current was reduced, which ensures that the resistance is taken in context with the current and voltage data. These data have not been plotted on one graph in this paper for reasons of clarity.

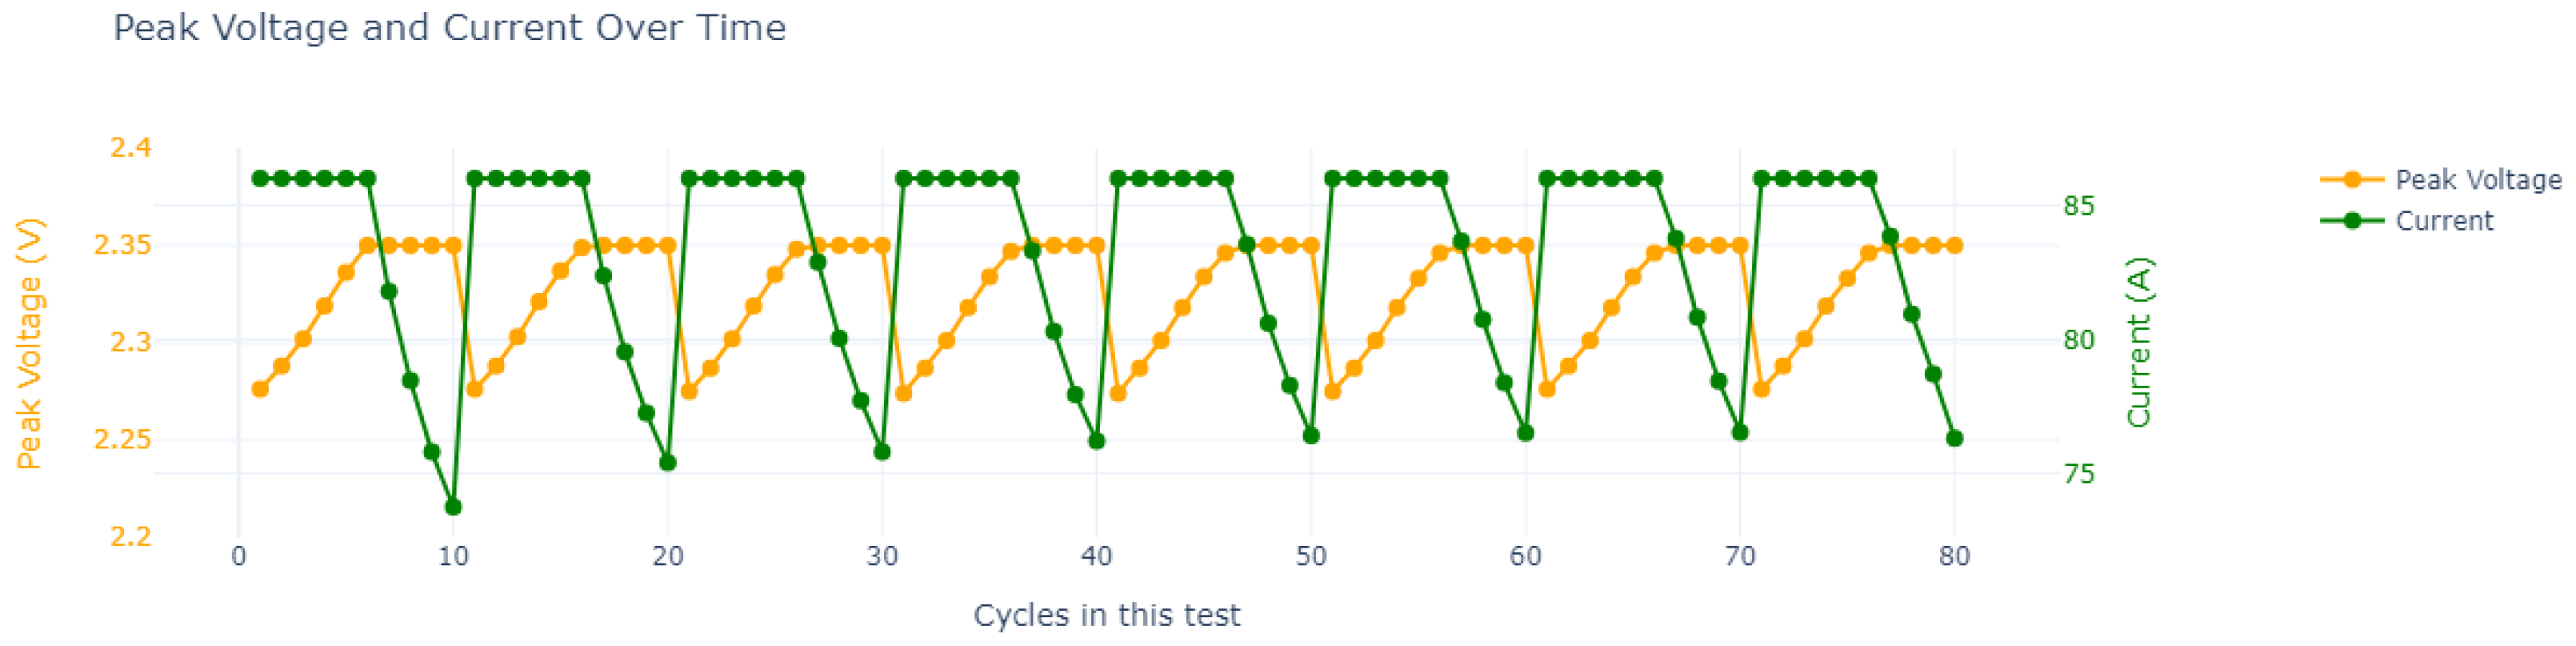
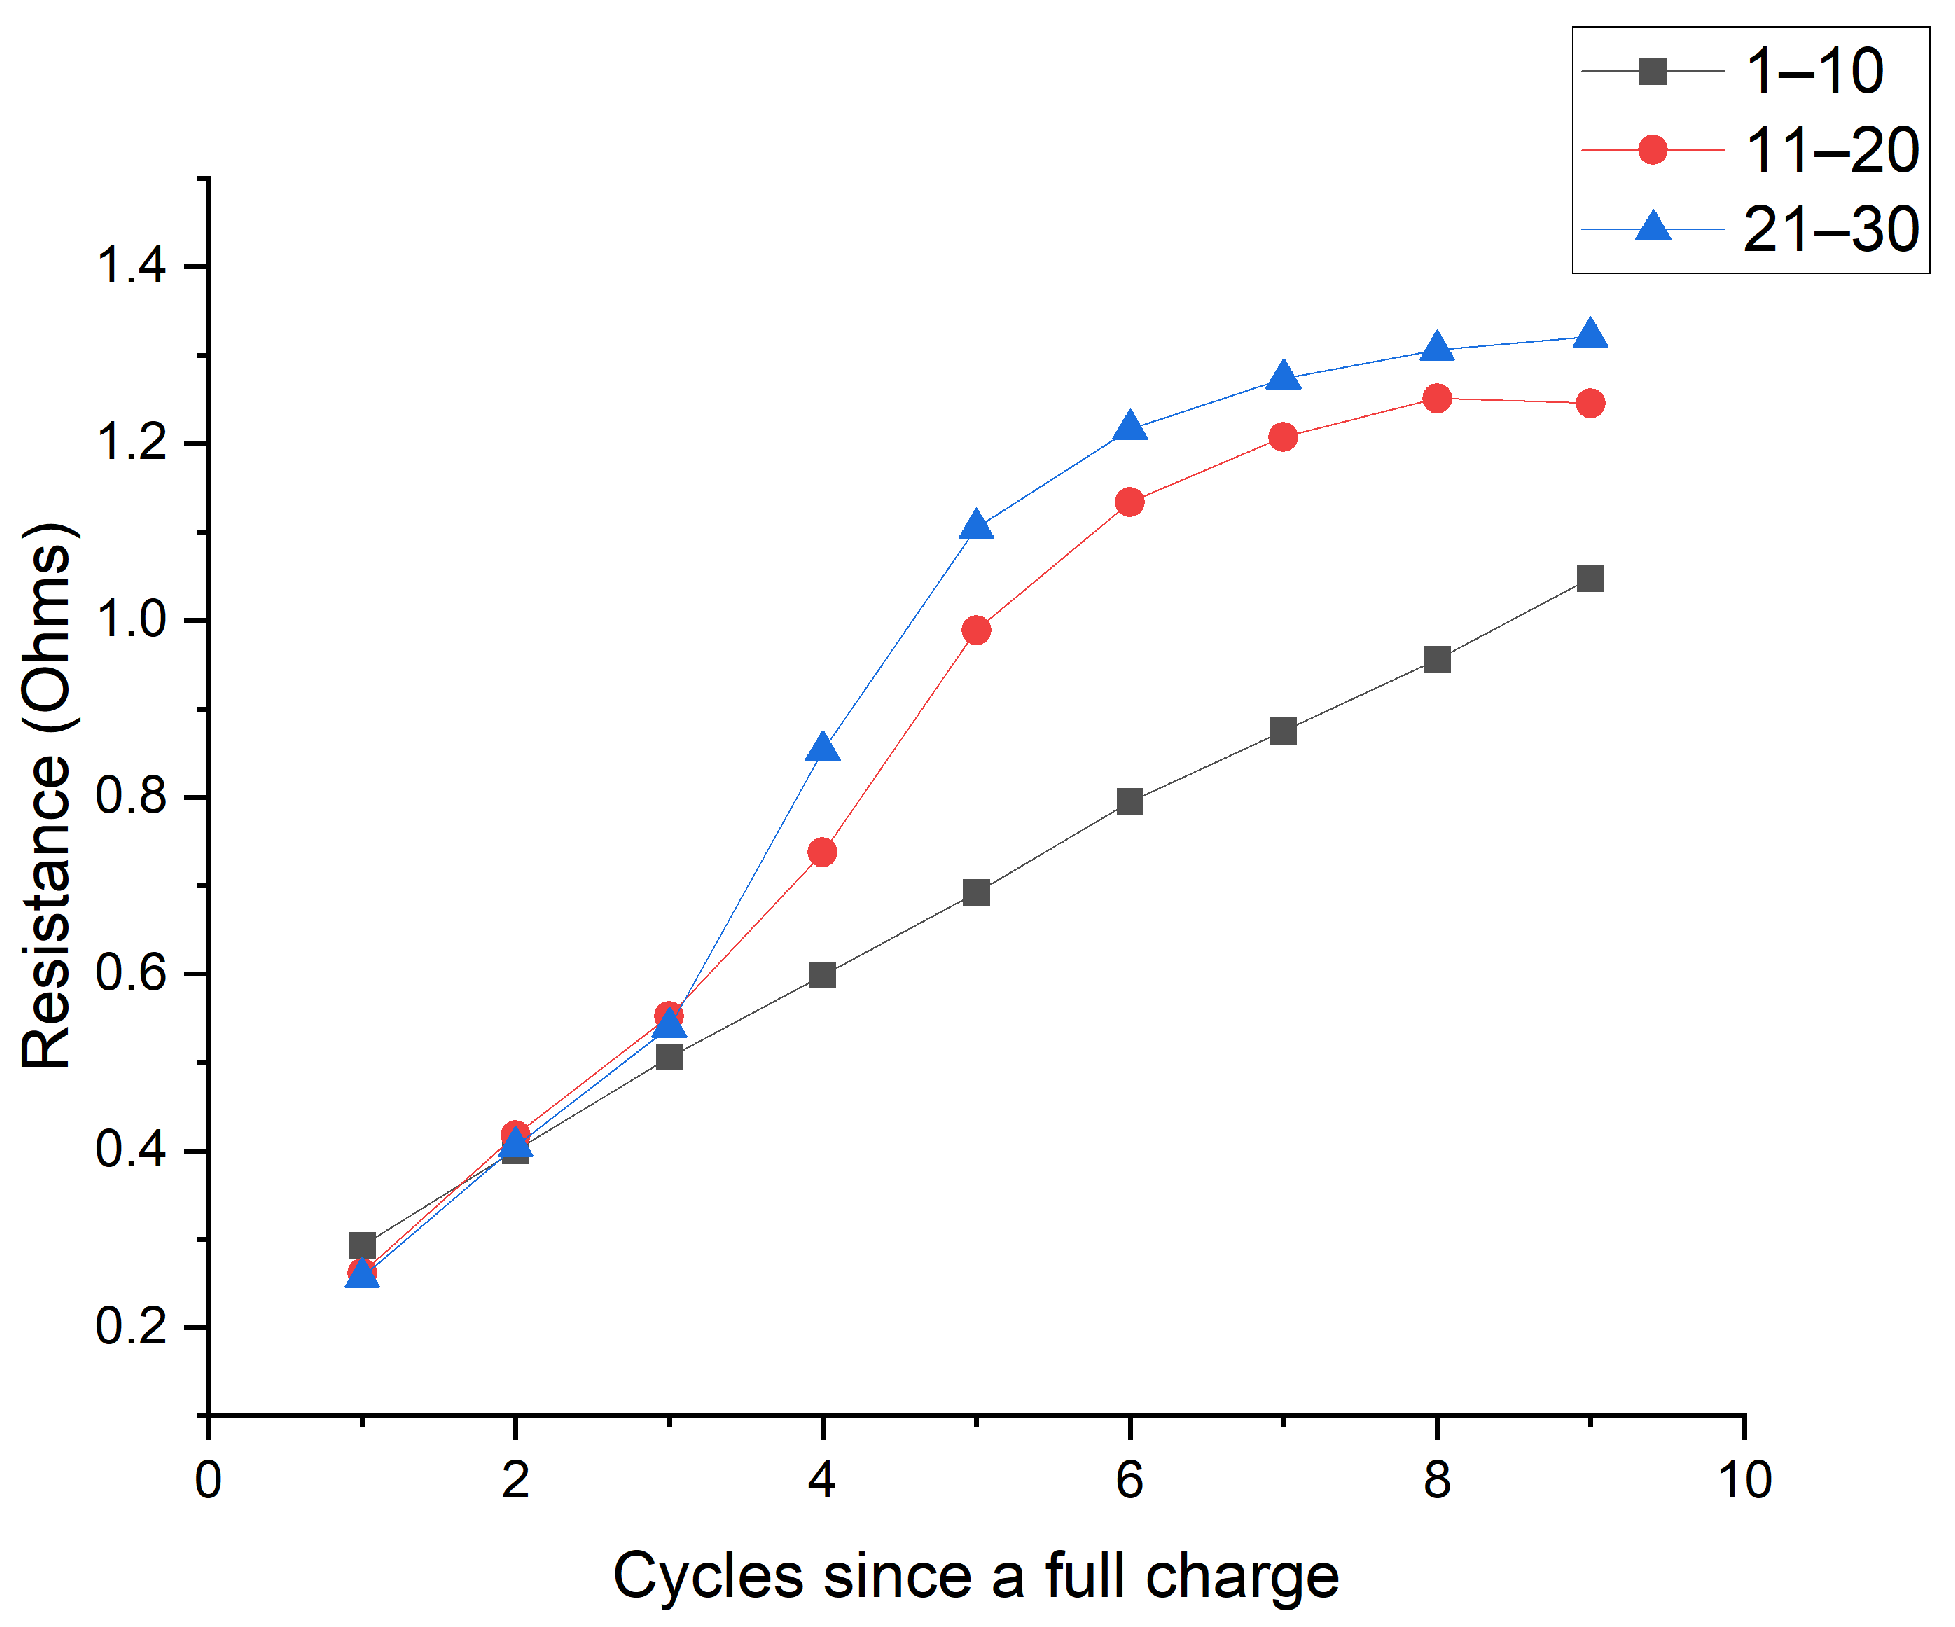
4. Results for 12 V Battery

Due to the coulomb-control cycling regime, the upper state of charge was always 80%; despite this, as shown in Figure 7, there is a clear trend towards greater voltages each cycle even though the actual state of charge was identical. This is indicative of progressive sulphation primarily of the negative plate, which was seen in the other literature [27,48]. This progressive sulphation causes a decrease in the charge acceptance of the battery. This was also seen in the results shown above for the cells tested and highlights the benefit of absolute voltage limits even when the cyclic regime is not initially expected to exceed the rated levels for the battery.
To quantify this resistance to charging, the voltage drop method as described earlier was used, the peak voltage was recorded, and then the voltage reached after 1 min was also recorded. This gave the voltage drop of the battery at a specific current, in this case 1.5 A. Using Ohm’s law, the resistance to charging can be calculated. For this experiment, the 12 V data extraction was performed manually, and Python 3, with pandas and plotly packages installed, was used to extract and process the data for the cell test. If testing multiple different batteries of the same capacity, an automated program could be written to provide data far quicker. The data obtained in this experiment were then plotted on a graph, with the cycles since a full charge shown on the x-axis and the resistance to charge on the y-axis. The resistance to charging is representative of the extent of sulphation of the negative plate.
In Figure 7, the peak voltage increases with each cycle. This appears to be linear in the first 10 cycles but is less linear during the following 20 cycles. This is shown more clearly in Figure 8, as the line does not remain straight in the 10–20 and 20–30 sections plotted. The full recharge resets the resistance back to baseline, as shown in Figure 7 and Figure 8. This change in linearity is likely due to the gas production and side reactions beginning to take a greater and greater proportion of the current. Of note is that following the full charge, in all cases, the resistance returns to baseline, showing that the charge-factor-controlled full charge is adequate in correcting the accumulated sulphation caused by the PSOC operation. This is a crucial step in partial-state-of-charge operation. If the baseline resistance does not reset to the same amount, the battery will progressively sulphate and fail [57] due to hard sulphate buildup [26]. This highlights the restorative effect of a full charge on the charge acceptance of a lead–acid battery. In the work of Franke and Kowal [48], the full-charge procedure followed typical manufacturer recommendations and was a timed constant voltage step and not charge-factor-controlled. In that experiment, the cell did not return to baseline resistance. This can be explained by the need for longer full-charge times under PSOC cycling causing the cell to not achieve a full state of charge; however, it is often recommended to use a timed constant-voltage step to charge lead–acid batteries, but in this work and the authors’ previous work, a timed constant-voltage period was shown to be inadequate [49].
The battery used in this experiment has a datasheet-suggested charge time of 4 h at 14.7 V to fully charge the battery; however, when the 1.05 charge-factor charge limit is used to terminate a full charge, the actual time required at 14.7 V is around 20 h, as shown in Table 2 which is 5 times greater than the datasheet-recommended time. This does highlight that datasheet recommendations are not generally applicable in a PSOC-operated battery pack, purely because the recommendations are not for PSOC and instead are for one cycle, where the charge acceptance has not degraded to the level reached under PSOC.
As higher voltages are reached within a lead–acid cell, more of the charge current is consumed by overcharge reactions such as the oxygen cycle and grid corrosion. This explains the slight levelling off of the increase in internal resistance seen in the results. When this happens, the current used in dissolution of sulphate crystals is a lower percentage of the total current, and the current used in gassing and corrosion increases. The greater the voltage reached, the faster the rate of gas production and grid corrosion and the lower the percentage of the current that is used in charging of the active mass. If the test continues without a full charge, the chargeability of the negative plate will reduce further and the upper voltage reached will increase, causing greater deleterious effects. At some point, the degradation in charge acceptance will no longer be reversible, and permanent degradation will have occurred.
For this battery, the maximum charge voltage was listed as 14.7 V; for the battery not to exceed this upper voltage level during the cycling procedure tested of 10 cycles between full charges, various factors could be changed, such as the following: the upper state of charge limit could be reduced, the charge throughput could be reduced, or the charging current could be reduced. In operation, once around five cycles have been conducted, for this battery, the upper state-of-charge limit should be reduced or the charge rate should be reduced. This is, of course, excluding the possibility of redesigning the battery to be able to charge faster under the partial-state-of-charge cyclic regime tested. These data can be fed into the cyclic control algorithm and allow better planning of charge limits, charge rates, and charge times.

5. Conclusions

In this paper, a method has been presented for characterising and assessing PSOC performance of lead–acid cells and batteries. As mentioned earlier, the correct operation of a lead–acid cell or battery can significantly increase the lifespan. This method has almost universal applicability for the testing of lead–acid batteries for suitability in PSOC applications but especially so in a self-consumption scenario when availability of the cell to accept charge and discharge is essential to maintain correct operation of the battery pack. This test method allows greater comparability between cells and batteries as well as providing valuable data that can be fed into a cyclic control algorithm for controlling state-of-charge limits in a BESS. Voltage drop measurement can be used to verify that the full charge has been completed successfully because the charge acceptance has been restored; this almost eliminates the issue of hard sulphate crystals building up and becoming operationally limiting and also lifespan-limiting.
One difficulty of using lead–acid batteries in a BESS in PSOC use is knowing when to fully charge the battery pack; using this technique, the interval can be predicted because operating the same cell under the same regime will largely lead to the same results and resistance increase. The resistance testing can be built into the BESS controller, allowing a high-speed test of the internal resistance of the battery pack.
In all tests using the coulomb-controlled cycling regime, the internal resistance increases as the charge acceptance decreases. The test is far more representative than short-duration charge acceptance tests used for starting, lighting, and ignition. When tested on a 12 V nominal battery, it appeared that around five cycles was the limit for this battery before the 14.7 V (2.45 V per cell) voltage limit was exceeded. However, the cells that were tested had far greater resilience to charge acceptance degradation, needing six cycles before the 2.35 V limit was exceeded even at far higher charge rates. If the limit were increased to 2.45 V, a greater number of cycles before voltage limitations impeded the charging rate would be possible.
Recharge time was significant in the case of the individual cells; however, these cells were not optimised for fast recharge time. Faster recharges could very likely be achieved if the constant voltage charge was increased to 2.45 V; however, this was not specified in the datasheet so was not performed. Faster recharge could also be achieved with different alloys or different construction of the cells, but this could reduce the cyclic lifespan of the cell.
Testing the battery or cell under a closer-to-representative cyclic regime closer to that experienced in BESS use allows greater prediction of charge acceptance degradation to be performed. While in this paper, different construction cells were not compared, using the same protocol on cells from different manufacturers would allow new insights to be gained and new comparisons to be made.
The coulomb-counting control technique for charge limiting throughput has been shown. When combined with charge-factor-controlled full charges, the internal resistance of the battery can be reset to baseline. Lower voltage levels at 40% SOC are not as significantly affected by PSOC duty, although it is possible that at far lower states of charge, an increase in discharge resistance would become visible.

Author Contributions

Conceptualisation, M.P.; methodology, M.P.; formal analysis, M.P.; investigation, M.P.; resources, M.P.; writing—original draft preparation, M.P.; writing—review and editing, M.P. and R.M.; supervision, R.M. All authors have read and agreed to the published version of the manuscript.

Funding

This research received no external funding.

Data Availability Statement

Data can be provided upon request.

Acknowledgments

The authors would like to thank Leoch for providing the 12 V battery for this test as well as for their cooperation and openness with the purchasing of the cells tested in this study.

Conflicts of Interest

The authors declare no conflicts of interest.

Abbreviations

The following abbreviations are used in this manuscript:
AhAmpere hours
AGMAbsorbed glass mat
BESSBattery energy storage system
PSOCPartial state of charge
SOCState of charge
UPSUninterruptible power supply
VRLAValve-regulated lead–acid

References

  1. Worku, M.Y. Recent Advances in Energy Storage Systems for Renewable Source Grid Integration: A Comprehensive Review. Sustainability 2022, 14, 5985. [Google Scholar] [CrossRef]
  2. Ulbig, A.; Borsche, T.S.; Andersson, G. Impact of low rotational inertia on power system stability and operation. Ifac Secr. 2014, 47, 7290–7297. [Google Scholar] [CrossRef]
  3. Quoilin, S.; Kavvadias, K.; Mercier, A.; Pappone, I.; Zucker, A. Quantifying self-consumption linked to solar home battery systems: Statistical analysis and economic assessment. Appl. Energy 2016, 182, 58–67. [Google Scholar] [CrossRef]
  4. Sharma, V.; Haque, M.H.; Aziz, S.M. Energy cost minimization for net zero energy homes through optimal sizing of battery storage system. Renew. Energy 2019, 141, 278–286. [Google Scholar] [CrossRef]
  5. Rappaport, R.D.; Miles, J. Cloud energy storage for grid scale applications in the UK. Energy Policy 2017, 109, 609–622. [Google Scholar] [CrossRef]
  6. Chalmers, S.M.; Hitt, M.M.; Underhill, J.T.; Anderson, P.M.; Vogt, P.L.; Ingersoll, R. The effect of photovoltaic power generation on utility operation. IEEE Trans. Power Appar. Syst. 1985, PAS-104, 524–530. [Google Scholar] [CrossRef]
  7. Jewell, W.T.; Unruh, T.D. Limits on cloud-induced fluctuation i photovoltaic generation. IEEE Trans. Energy Convers. 1990, 5, 8–14. [Google Scholar] [CrossRef] [PubMed]
  8. Faaborg, A. IEA PVPS International Energy Agency Implementing Agreement on Photovoltaic Power Systems TASK V Grid Interconnection of Building Integrated and Other Dispersed Photovoltaic Power Systems Impacts of Power Penetration from Photovoltaic Power Systems in Distribution Networks 2002. IEA PVPS. Available online: https://hme.ca/gridconnect/IEA_PVPS_Task_5-10_Impacts_of_PV_Power_Penetration.pdf (accessed on 14 January 2023).
  9. Tomazic, G.; Skyllas-Kazacos, M. Redox Flow Batteries; Elsevier Inc.: Amsterdam, The Netherlands, 2015; pp. 309–336. [Google Scholar] [CrossRef]
  10. McMahon, R.; Logan, T.; Miles, J.; McMahon, N.; Ridge, A. Operational study of domestic battery energy storage system. J. Eng. 2019, 2019, 3479–3483. [Google Scholar] [CrossRef]
  11. King, S.; Boxall, N.J. Lithium battery recycling in Australia: Defining the status and identifying opportunities for the development of a new industry. J. Clean. Prod. 2019, 215, 1279–1287. [Google Scholar] [CrossRef]
  12. Wang, W.; Wu, Y. An overview of recycling and treatment of spent LiFePO4 batteries in China. Resour. Conserv. Recycl. 2017, 127, 233–243. [Google Scholar] [CrossRef]
  13. Song, X.; Hu, T.; Liang, C.; Long, H.L.; Zhou, L.; Song, W.; You, L.; Wu, Z.S.; Liu, J.W. Direct regeneration of cathode materials from spent lithium iron phosphate batteries using a solid phase sintering method. Rsc Adv. 2017, 7, 4783–4790. [Google Scholar] [CrossRef]
  14. Zhang, L.; Duan, Q.; Liu, Y.; Xu, J.; Sun, J.; Xiao, H.; Wang, Q. Experimental investigation of water spray on suppressing lithium-ion battery fires. Fire Saf. J. 2020, 120, 103117. [Google Scholar] [CrossRef]
  15. Insurance Risks of Li-ion | Fire Protection Association—Thefpa.co.uk. Available online: https://www.thefpa.co.uk/news/insurance-risks-of-li-ion (accessed on 6 December 2024).
  16. AIG. Lithium-ion Battery Energy Storage Systems AIG Energy Industry Group. 2018. Available online: https://www.aig.co.uk/content/dam/aig/emea/united-kingdom/documents/Insights/battery-storage-systems-energy.pdf (accessed on 25 March 2023).
  17. May, G.J.; Davidson, A.; Monahov, B. Lead batteries for utility energy storage: A review. J. Energy Storage 2018, 15, 145–157. [Google Scholar] [CrossRef]
  18. Association, I.L. Lead Recycling Sustainability in Action. 2015. Available online: https://hammondglobal.com/wp-content/uploads/2022/06/ILA9927-FS_Recycling_V08.pdf (accessed on 25 March 2023).
  19. International, B.C. NATIONAL RECYCLING RATE STUDY Vault Consulting for Battery Council International. 2023. Available online: https://batterycouncil.org/resource/national-recycling-rate-study/ (accessed on 25 March 2023).
  20. Battery Council International Comparative Life Cycle Assessment of Lead and LFP Batteries for Automotive Applications 2 of 92 Client: Battery Council International and International Lead Association Title: Comparative Life Cycle Assessment of Batteries for Automotive Applications. 2023. Available online: https://batterycouncil.org/wp-content/uploads/2023/09/BCI_Comparative_LCA_Automotive-Batteries_Lead_and_LFP_5.9.23.pdf (accessed on 25 March 2023).
  21. Schaeck, S.; Stoermer, A.O.; Hockgeiger, E. Micro-hybrid electric vehicle application of valve-regulated lead-acid batteries in absorbent glass mat technology: Testing a partial-state-of-charge operation strategy. J. Power Sources 2009, 190, 173–183. [Google Scholar] [CrossRef]
  22. Kaushik, R.; Mawston, I. Coulombic efficiency of lead/acid batteries, particularly in remote-area power-supply (RAPS) systems. J. Power Sources 1991, 35, 377–383. [Google Scholar] [CrossRef]
  23. Stevens, J.; Corey, G. A study of lead-acid battery efficiency near top-of-charge and the impact on PV system design. In Proceedings of the Conference Record of the Twenty Fifth IEEE Photovoltaic Specialists Conference—1996, Washington, DC, USA, 13–17 May 1996; IEEE: New York, NY, USA, 1996; pp. 1485–1488. [Google Scholar] [CrossRef]
  24. Nakarnura, K.; Shiomi, M.; Takahashi, K.; Tsubota, M. PWg Failure modes of valve-regulated lead/acid batteries. J. Power Sources Geneva 1996, 59, 153–157. [Google Scholar]
  25. Lam, L.; Haigh, N.; Phyland, C.; Urban, A. Failure mode of valve-regulated lead-acid batteries under high-rate partial-state-of-charge operation. J. Power Sources Geneva 2004, 133, 126–134. [Google Scholar] [CrossRef]
  26. Büngeler, J.; Cattaneo, E.; Riegel, B.; Sauer, D.U. Advantages in energy efficiency of flooded lead-acid batteries when using partial state of charge operation. J. Power Sources Geneva 2018, 375, 53–58. [Google Scholar] [CrossRef]
  27. Catherino, H.A.; Feres, F.F.; Trinidad, F. Sulfation in lead–acid batteries. J. Power Sources 2004, 129, 113–120. [Google Scholar] [CrossRef]
  28. Wong, Y.; Hurley, W.; Wölfle, W. Charge regimes for valve-regulated lead-acid batteries: Performance overview inclusive of temperature compensation. J. Power Sources 2008, 183, 783–791. [Google Scholar] [CrossRef]
  29. Ebner, E.; Wark, M.; Börger, A. Passive Mischelemente zur Elektrolytkonvektion in Blei-Säure- Nassbatterien. Chemie-Ingenieur-Technik 2011, 83, 2051–2058. [Google Scholar] [CrossRef]
  30. Sauer, D.U.; Karden, E.; Fricke, B.; Blanke, H.; Thele, M.; Bohlen, O.; Schiffer, J.; Gerschler, J.B.; Kaiser, R. Charging performance of automotive batteries—An underestimated factor influencing lifetime and reliable battery operation. J. Power Sources 2007, 168, 22–30. [Google Scholar] [CrossRef]
  31. Yamaguchi, Y.; Shiota, M.; Nakayama, Y.; Hirai, N.; Hara, S. In situ analysis of electrochemical reactions at a lead surface in sulfuric acid solution. J. Power Sources 2000, 85, 22–28. [Google Scholar]
  32. Lach, J.; Wróbel, K.; Wróbel, J.; Podsadni, P.; Czerwiński, A. Applications of carbon in lead-acid batteries: A review. J. Solid State Electrochem. 2019, 23, 693–705. [Google Scholar] [CrossRef]
  33. Smith, M.J.; Gladwin, D.T.; Stone, D.A. Experimental analysis of the influence of high-frequency ripple currents on dynamic charge acceptance in lead-acid batteries. In Proceedings of the IECON 2017—43rd Annual Conference of the IEEE Industrial Electronics Society, Beijing, China, 29 October–1 November 2017; IEEE: New York, NY, USA, 2017; pp. 7140–7145. [Google Scholar] [CrossRef]
  34. Swogger, S.W.; Everill, P.; Dubey, D.P.; Sugumaran, N. Discrete carbon nanotubes increase lead acid battery charge acceptance and performance. J. Power Sources 2014, 261, 55–63. [Google Scholar] [CrossRef]
  35. Bozkaya, B.; Bauknecht, S.; Settelein, J.; Kowal, J.; Karden, E.; Giffin, G.A. Comparison of Dynamic Charge Acceptance Tests on Lead–Acid Cells for Carbon Additive Screening. Energy Technol. 2022, 10, 2101051. [Google Scholar] [CrossRef]
  36. Bauknecht, S.; Kowal, J.; Bozkaya, B.; Settelein, J.; Karden, E. The Influence of Cell Size on Dynamic Charge Acceptance Tests in Laboratory Lead-Acid Cells. Energy Technol. 2022, 10, 2101053. [Google Scholar] [CrossRef]
  37. Kumar, S.; Babu, N.; Sumanth, V.K.B.; Siva, P.K.; Balaji, G.; Jagadish, M. Influence of Carbon and Interaction of Carbon and Lignosulfonateon Dynamic Charge Acceptance of Flooded (Enhanced) Lead Acid Batteries. Int. J. Sci. Res. 2018, 7. [Google Scholar] [CrossRef]
  38. Smith, M.; Gladwin, D.; Stone, D. An analysis of the influence of high-frequency ripple currents on dynamic charge acceptance in lead-acid batteries. J. Energy Storage 2019, 22, 27–35. [Google Scholar] [CrossRef]
  39. BSI. Lead-Acid Starter Batteries - Batteries for Micro-Cycle Applications. BSI. 2015. Available online: https://knowledge.bsigroup.com/products/lead-acid-starter-batteries-batteries-for-micro-cycle-applications (accessed on 25 March 2023).
  40. (SBA) Battery Industry Association Standards. S0101 Lead-Acid Battery for Idling Stop Vehicles. SBA. 2014. Available online: https://www.baj.or.jp/publication/books02.html (accessed on 25 March 2023).
  41. Moseley, P.T.; Rand, D.A. Partial State-of-Charge Duty: A Challenge but Not a Show-Stopper for Lead-Acid Batteries! Electrochem. Soc. 2012, 41, 3–16. [Google Scholar] [CrossRef]
  42. Cooper, A.; Moseley, P. Progress in overcoming the failure modes peculiar to VRLA batteries. J. Power Sources 2003, 200–208. [Google Scholar] [CrossRef]
  43. Bouabidi, A.; Ayadi, S.; Kossentini, M.; Driss, Z.; Abid, M.S. Cycling Performances and Failure Modes for AGM and Standard Flooded Lead Acid Batteries under Partial State of Charge Mode. J. Energy Eng. 2016, 142, 04015027. [Google Scholar] [CrossRef]
  44. Misra, S.S.; Mraz, S.L.; Dillon, J.D.; Swanson, D.B. VRLA Battery with AGM-Gel Hybrid for Superior Performance; IEEE: New York City, NY, USA, 2003; pp. 378–382. [Google Scholar]
  45. Nelson, R. Overview Lead-Acid Batteries. Memb. J. Miner. Met. Mater. Soc. 2001, 53, 28–33. [Google Scholar]
  46. Doraswamy, S.; Dama, N.; Kurivella, S.M.; Mandava, J.; Veeredhi, V.R. EIS and Electrical Investigations on (1D) Multiwall Carbon Nanotubes as NAM Additive for Automotive Lead-Acid Battery. Curr. Appl. Sci. Technol. 2022, 1–7. [Google Scholar] [CrossRef]
  47. Vermesan, H.; Hirai, N.; Shiota, M.; Tanaka, T. Effect of barium sulfate and strontium sulfate on charging and discharging of the negative electrode in a lead-acid battery. J. Power Sources 2004, 133, 52–58. [Google Scholar] [CrossRef]
  48. Franke, M.; Kowal, J. Empirical sulfation model for valve-regulated lead-acid batteries under cycling operation. J. Power Sources 2018, 380, 76–82. [Google Scholar] [CrossRef]
  49. Parker, M.; McMahon, R. Investigations into the Charge Times of Lead–Acid Cells under Different Partial-State-of-Charge Regimes. Batteries 2024, 10, 201. [Google Scholar] [CrossRef]
  50. Křivík, P.; Bača, P.; Kazelle, J. Effect of ageing on the impedance of the lead-acid battery. J. Energy Storage 2021, 36, 102382. [Google Scholar] [CrossRef]
  51. Nelson, R.; Sexton, E.; Olson, J.; Keyser, M.; Pesaran, A. Search for an optimized cyclic charging algorithm for valve-regulated lead–acid batteries. J. Power Sources 2000, 88, 44–52. [Google Scholar] [CrossRef]
  52. Berndt, D.; Meissner, E.; Rusch, W. Aging effects in valve-regulated lead-acid batteries. In Proceedings of the Intelec 93: 15th International Telecommunications Energy Conference, Paris, France, 27–30 September 1993; Volume 2, pp. 139–145. [Google Scholar] [CrossRef]
  53. Misra, S.; Williamson, A. Impact of grid corrosion in valve regulated lead-acid battery on standby float service. In Proceedings of the INTELEC 95. 17th International Telecommunications Energy Conference, Hague, The Netherlands, 29 October–1 November 1995; IEEE: New York, NY, USA, 1995; pp. 360–363. [Google Scholar] [CrossRef]
  54. Linden, D.; Reddy, T. Handbook of Batteries; McGraw-Hill Education: New York, NY, USA, 2002. [Google Scholar]
  55. Cárdenas, B.; Swinfen-styles, L.; Rouse, J.; Garvey, S.D. Short-, medium-, and long-duration energy storage in a 100% Renewable Electricity Grid: A UK Case Study. Energies 2021, 14, 8524. [Google Scholar] [CrossRef]
  56. Moseley, P.T. High rate partial-state-of-charge operation of VRLA batteries. J. Power Sources 2004, 127, 27–32. [Google Scholar] [CrossRef]
  57. Pavlov, D.; Nikolov, P. Lead–Carbon Electrode with Inhibitor of Sulfation for Lead-Acid Batteries Operating in the HRPSoC Duty. J. Electrochem. Soc. 2012, 159, A1215–A1225. [Google Scholar] [CrossRef]
Figure 1. Example voltage data showing the increasing voltage as current is applied followed by an immediate drop in voltage as the current application ceases.
Batteries 11 00131 g001
Figure 2. Ten-cycle interval cell (Cell 1).
Batteries 11 00131 g002
Figure 3. Five-cycle interval cell (Cell 2).
Batteries 11 00131 g003
Figure 4. Higher rate charge and discharge test when fully charged every 10 cycles.
Batteries 11 00131 g004
Figure 5. Ten-cycle interval resistance to charge at 43A (Cell 1).
Batteries 11 00131 g005
Figure 6. Ten-cycle interval resistance to charge at 83A (Cell 1) showing lower rate of increase in resistance in comparison to the rate shown in Figure 5.
Batteries 11 00131 g006
Figure 7. Voltage graph showing the greater and greater voltages on a cycle-by-cycle basis.
Batteries 11 00131 g007
Figure 8. Resistance to charge at 80% SOC.
Batteries 11 00131 g008
Table 1. Charge times in seconds and hours; full charge is defined using the charge-factor method.
CycleCharge Time in Seconds (h)
Ten-Cycle IntervalFive-Cycle Interval
Cell 1 43ACell 1 86 ACell 1
High Rate
Extended
Cell 2 43ACell 2 86 A
---293,277 (81.5)127,431 (35.4)
10374,441 (104.0)270,278 (75.1)832,971 (231.4)199,376 (55.4)130,121 (36.1)
15---171,362 (47.6)128,323 (35.6)
20373,196 (103.7)271,742 (75.5)237,477 (66.0)156,167 (43.4)121,266 (33.7)
25---146,680 (40.7)117,669 (32.7)
30326,372 (90.7)245,628 (68.2)233,750 (64.9)137,751 (38.3)118,747 (33.0)
35---133,273 (37.0)113,492 (31.5)
40-237,571 (66.0)228,304 (63.4)127,250 (35.3)113,156 (31.4)
45---125,554 (34.9)113,468 (31.5)
50-231,245 (64.2)224,956 (62.5)120,038 (33.3)114,289 (31.7)
60--219,660 (61.0)--
70--219,506 (61.0)--
80--186,275 (51.7)--
Table 2. Charge times of 12 V lead in seconds and hours; full charge is defined using the charge-factor method.
Charge Following CycleCharge Time in Seconds (h)
1070,411 (19.6)
2072,001 (20.0)
3068,101 (18.9)
Disclaimer/Publisher’s Note: The statements, opinions and data contained in all publications are solely those of the individual author(s) and contributor(s) and not of MDPI and/or the editor(s). MDPI and/or the editor(s) disclaim responsibility for any injury to people or property resulting from any ideas, methods, instructions or products referred to in the content.

