Article

Analysis and Investigation of Diffusion-Induced Stress in Lithium-Ion Particle Through Elastic-Viscoplastic Model of Binder

1
Research Department, Jiangxi Mechanical Science Institute, Nanchang 330002, China
2
School of Automotive and Aviation, Jiangxi Technical College of Manufacturing, Nanchang 330095, China
3
School of Electrical Engineering, Nanchang Institute of Technology, Nanchang 330099, China
*
Author to whom correspondence should be addressed.
Batteries 2025, 11(4), 132; https://doi.org/10.3390/batteries11040132
Submission received: 6 March 2025 / Revised: 14 March 2025 / Accepted: 19 March 2025 / Published: 29 March 2025

Abstract

:
During the charging and discharging process of lithium-ion batteries, lithium-ions are embedded and removed from the active particles, leading to volume expansion and contraction of the active particles, and hence diffusion-induced stress (DIS) is generated. DIS leads to fatigue damage of the active particles during periodic cycling, causing battery aging and capacity degradation. This article establishes a two-dimensional particle-binder system model in which a linear elastic model is used for the active particle, and an elastic-viscoplastic model is used for the binder. The state of charge, stress, and strain of the particle-binder system under different charge rates are investigated. The simulation results show that the location of particle crack excitation is related to two factors: the concentration gradient of lithium-ion and the binder confinement effect. Under a lower charge rate, the crack excitation position of the particle located at the edge of the particle-binder interfacial (PBI) is mainly attributed to the binder confinement effect, while under a higher charge rate, the crack excitation position occurs at the center of the particle due to the dominance of concentration gradient effect. Furthermore, analysis reveals that the binder undergoes plastic deformation due to the traction force caused by particle expansion, which weakens the constraint on the particle and prevents PBI debonding. Finally, a binder with lower stiffness and higher yield strength behavior is recommended for rapid stress release of particles and could reduce plastic deformation of the binder.

1. Introduction

The intensification of environmental pollution and the shortage of traditional energy urgently require the development of efficient energy [1]. Lithium-ion batteries (LIBs) are widely used in portable electronic products, electric vehicles, and energy storage due to their high energy density, environmental friendliness, and low cost. However, LIBs still face numerous challenges, such as safety performance, energy density, and capacity degradation after multiple charging and discharging cycles [2,3,4]. As is well known, the fracture within the active particles is one of the main reasons for the degradation of LIBs. The change in the volume of active particles during the process of lithium-ion intercalation and deintercalation can lead to deformation and stress. This process is called diffusion-induced stress (DIS), which is one of the main reasons for the fracture of active particles [5,6,7,8,9,10].
Verbrugge et al. [11] analyzed the DIS of spherical particles in the form of analytical solutions, and the results showed that the smaller particles are less prone to cracking. Zhu et al. [12] studied the crack propagation behavior of circular particles under DIS using an extended finite element method and verified by experiments. Korsunsky et al. [13] studied the DIS inside circular particles using a sequential coupling method. Woodford et al. [14] derived the fracture mechanics failure criterion for a single electrode particle and systematically demonstrated its applicability using the constant current charging of LixMn2O4. Klinsmann et al. [15,16] established a coupling model of lithium-ion diffusion, stress, and crack using the phase field method. The developed method is applied to investigate the crack growth in particles under galvanostatic charging-discharging conditions.
Poly-vinylidene fluoride (PVDF) is widely used as a binder in LIBs [17,18]. Many studies have focused on evaluating the stress effects of binders. These efforts aim to understand their impact on stress concentration and crack formation in active particles [19,20]. Lee et al. [21] studied the stress failure mechanism of active particles wrapped by PVDF, and numerical simulation results showed that the debonding at the interface is closely associated with the total quantity of lithium ions embedding in the particles, while the internal fracture of the particles is more probably induced by the gradient of lithium concentration. Iqbal et al. [22] compared the effect of different bonding patterns of PVDF on the active particle stress distribution; the results showed that the more interfaces between PVDF and active particles, the more likely to induce interfacial debonding and yield failure of PVDF. Wu et al. [23] developed a binder and direct particle contact model to calculate the stress between adhesive and active particles. The numerical simulation demonstrated that the adhesive is most likely to debond at the edge of the PBI interface. Bradley et al. [24] studied the effect of adhesive position on active particles using numerical simulation methods; they concluded that the influence of adhesive location on particle stress and electrical properties cannot be ignored. Huang et al. [25] constructed a model with irregular particle shapes based on the realistic microstructure. The simulated results showed that the microstructure of electrode particles significantly affects the distribution of stress. In the literature cited above, the PVDF was treated as a linear elastic for investigating the effects of the adhesives on diffusion-induced stress [26]; it is not appropriate to treat the PVDF as a linear elastic model [27]. Thus, a few researchers pay attention to the plastic properties of PVDF. Rahani et al. assessed the mechanical damage of graphite porous electrodes during electrochemical cycling by assuming PVDF as an elastic-plastic material. The results showed that the values of PVDF with different yield strengths affect the average stress of the electrode.Rahani, E.K. et al. [28] simulated the diffusion-induced stress of particles under transverse flow charging and discharging conditions under the assumption of linear viscoelastic material model behavior of PVDF. The conclusion showed that low viscosity and low stiffness adhesives could reduce the diffusion-induced stress inside the particles, but the stress state of PBI was not investigated. Recently, researchers have shown that PVDF has elastic-viscoplastic characteristics [27,29,30], and the mechanical properties of PVDF play an important role in the decline of electrodes [31].
A PVDF elastic-viscoplastic model based on the Ree-Eyring theory was established to investigate the effect of adhesive on particle stress, especially PBI failure behavior. The Ree-Eyring model is widely used in the stress-strain-related performance of polymers [32]. For the analysis, a particle-binder model was constructed and performed under different charging rates. The present work shows that the charge rate has a significant impact on the internal stress of particles; more importantly, the mechanical properties of PVDF play a key role in interface delamination.

2. Finite Element Modeling

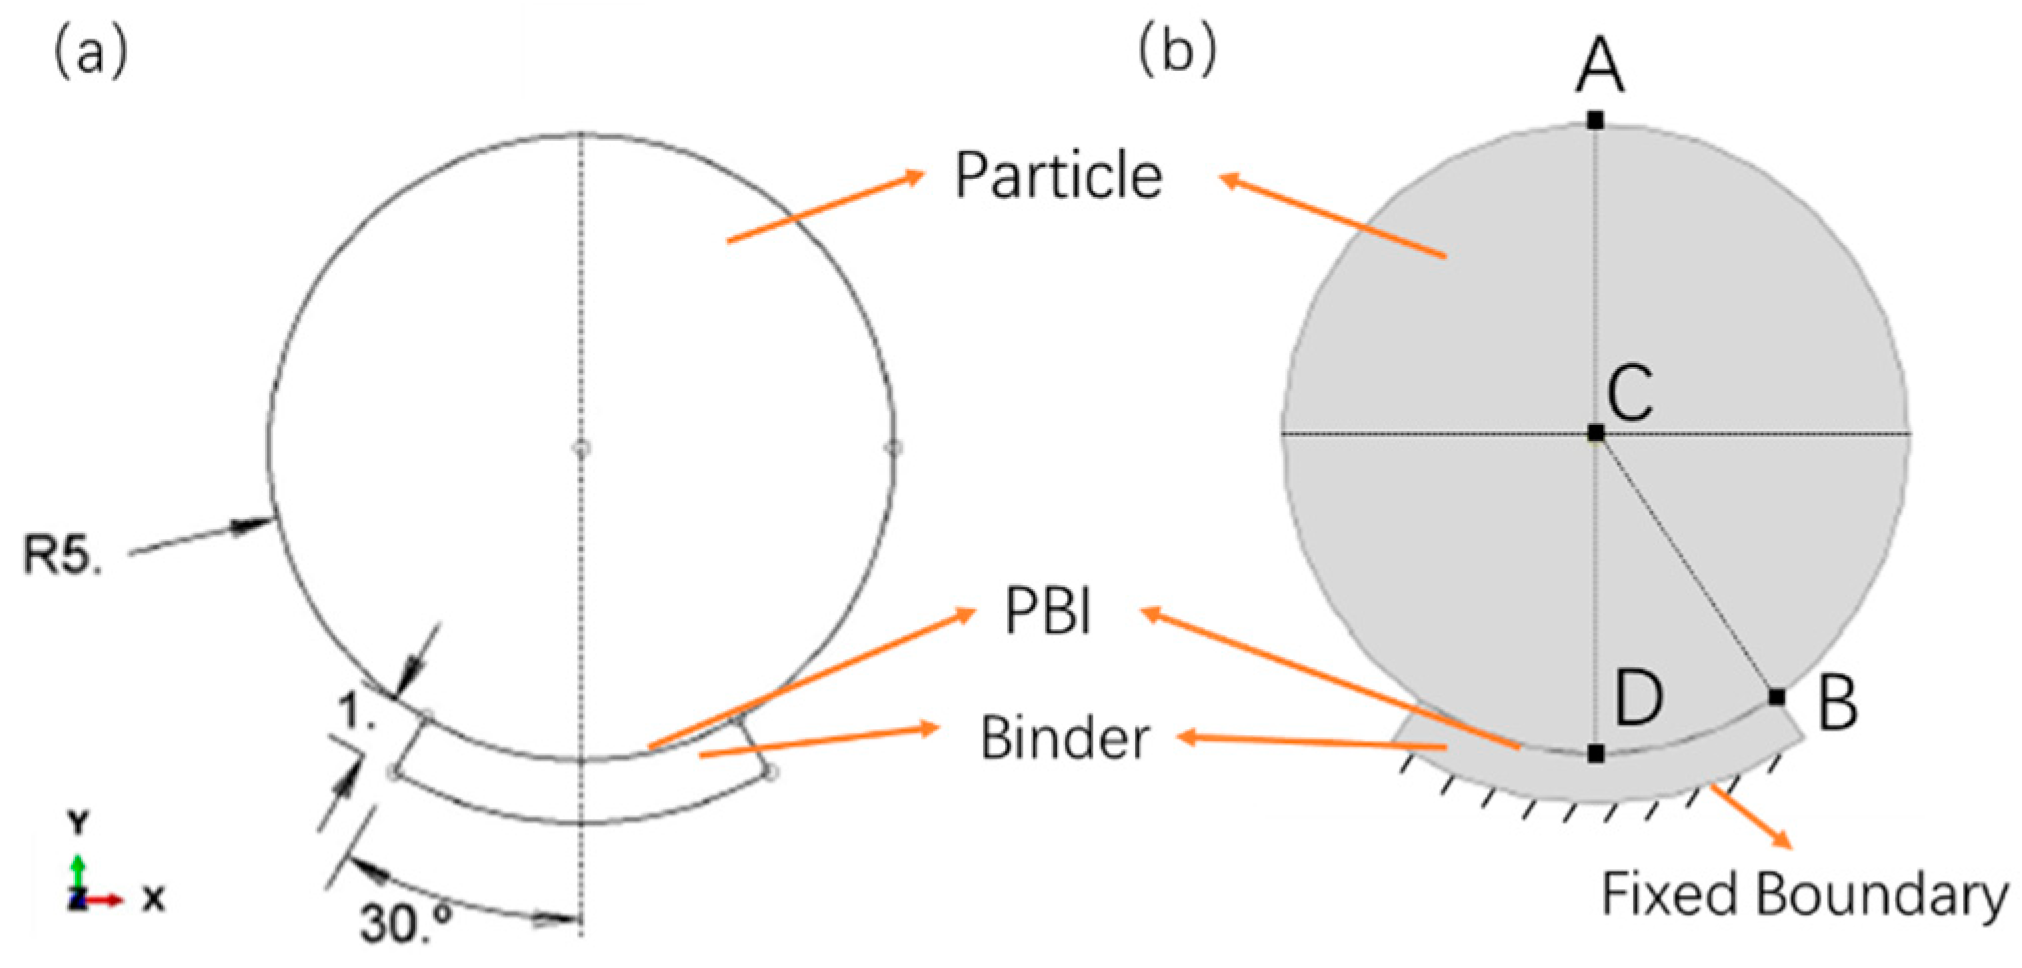
2.1. Geometric Model Diagram

A model of the particle-binder system diagram is shown in Figure 1, where the radius of the active particle is 5 μm, and the binder thickness is 1 μm with a coverage angle of 60 °C. The lower surface of the binder is fully constrained.

2.2. Electrochemical-Mechanical Model

The stress-strain relationship inside a particle can be determined by the following Formula (1) [33]:
ε i j = 1 E 1 + υ σ i j υ σ k k δ i j + c Ω 3 δ i j  
where ε i j is the strain component, E is Young’s modulus, υ is the Poisson’s ratio, σ i j is the stress, Ω is the partial molar volume of lithium-ion, c is the solubility of lithium-ion, and δ i j is the Kronecker symbol. The first term on the right side of the formula is the conventional stress term, while the second term is the coupled concentrate stress caused by the change in lithium-ion concentration. This equation can be analogized to the thermal stress-strain equation [34].
The gradient of the chemical potential drives the diffusion of lithium-ion, which is calculated according to Fick’s diffusion law and the lithium-ion mass conservation equation [35]. The equation can be written as follows:
J = D c c Ω R T σ h + c Ω 3 δ i j
In the formula, J is the diffusion flow, D is the lithium-ion diffusion coefficient, R is the gas constant, and σ h   is the hydrostatic stress gradient, defined as follows:
σ h = σ 11 + σ 22 + σ 33 3
The diffusion boundary condition of lithium-ion on the particle surface is according to the Neu-mann boundary condition [12], as shown in Equation (4).
J = i n F a = C r a t e a ρ F a × d v d s
where i n is the current density applied to the surface of the particle, F a is the Faraday constant, C r a t e is the discharge rate, and a and ρ are the specific capacity and density of graphite, respectively.
The state of charge (SOC) of particles can be expressed by the following equation:
S O C t = c t c m a x × 100 %
where cmax is the maximum allowable lithium-ion solubility in activated graphite particles, the maximum lithium-ion solubility in this study is 26,580 mol/m3.

2.3. Particle-Binder Interface (PBI) Model

For the PBI model, the quadratic nominal stress criterion is used to predict the failure behavior of the interface [36], which is given by the following equation:
Y = σ n σ n n o m 2 + σ s σ s n o m 2
where Y is the delamination failure index, the value of 1 indicates the beginning of bonding failure, σ n and σ s are the normal force and shear stress, respectively. σ n n o m and σ s n o m are the nominal normal force and shear stress, respectively. The Macaulay bracket symbol used in Equation (7) represents no traction damage for purely compressive stress.
x = x , i f   x > 0 0 , i f   x 0
The B–K (Benzeggagh and Kenane) criterion [37] is used to simulate crack failure propagation. The B–K criterion is denoted as follows:
G c = G n c + ( G s c G n c ) G s G n + G s γ
where Gc is the total critical strain energy release rate, G n c and   G s c   represent the critical fracture energy in the normal and shear directions, respectively. G n   and G s represent the normal energy release rate and shear energy release rate, respectively. The value of γ is assumed to be 1, which represents the index of the mixed damage model.

2.4. PVDF Binder Model

The stress of PVDF is related to strain rate, ambient temperature, and stress triaxiality. The Ree-Eyring flow theory model was used to describe the relationship between yield stress, strain rate, and temperature of PVDF [29], which is defined as follows:
σ = k B T V arcsinh ε ˙ ε 0 ˙ exp H R T
where V is the activation volume, k B is the Boltzmann constant, T is the absolute temperature, ε ˙   and ε 0 ˙ are the strain rate and reference strain rate, respectively. ΔH is the activation enthalpy. In this model, the yield strength of the material is redefined by the function of plastic strain rate and temperature. As shown in Figure 2, the yield stress of PVDF increases with the increase in strain rate. However, the increase in temperature will cause the material to soften, resulting in a decrease in yield stress.

2.5. Numerical Simulation

A two-dimensional simulation in this study was conducted using ABAQUS6.14 software. A thermal stress module was used to solve diffusion-induced stress. A total of 1200 elements are used for mesh the particle-binder geometry with a global size of about 0.3 μm. The CPE8HT elements were adopted for the active particle. The components of the PBI and PVDF binder are meshed with COH2D4 adhesive elements and CPE8 shell elements, respectively. Due to the gradient of hydrostatic stress σ h cannot be directly extracted from ABAQUS, we adopted a method that was employed for calculating hydrogen diffusion simulation in Refs [38], as shown in Equation (10). The value of σ h   is equal to the product of the gradient matrix of the shape function and the hydrostatic stress matrix. Because there are nine integration points in the CPE8HT element, corresponding to nine shape functions Ni and nine hydrostatic stresses σ h , i .
σ h x σ h y = N 1 x N 9 x N 1 y N 9 y σ h , 1 σ h , 9 e l e
The lithium-ion concentration field and stress field for the galvanostatic operation can be calculated in the ABAQUS by operating a set of USDFLD-UMATHT subroutines. Firstly, calculate the hydrostatic stress gradient in the USDFLD subroutine, and then transfer the hydrostatic stress gradient to the UMATHT subroutine as a state variable. Finally, the UMATHT subroutine calculates the diffusion flux, concentration, and stress. For the PVDF elastic-viscoplastic mechanical model, the UHARD subroutine is used to reset the yield stress by the values of plastic strain rate and temperature according to the function of Equation (9). The Parameters used in the model in this study are shown in Table 1.

3. Results and Discussion

In order to analyze the potential fracture failure behavior, the graphite particle is a brittle material, so the first (maximum) principal stress theory is applied to the stress failure behavior of active particlea; however, PVDF has elastic-viscoplastic characteristics; therefore, the von-Mises stress is used to analyze the plastic deformation behavior of PVDF [22].

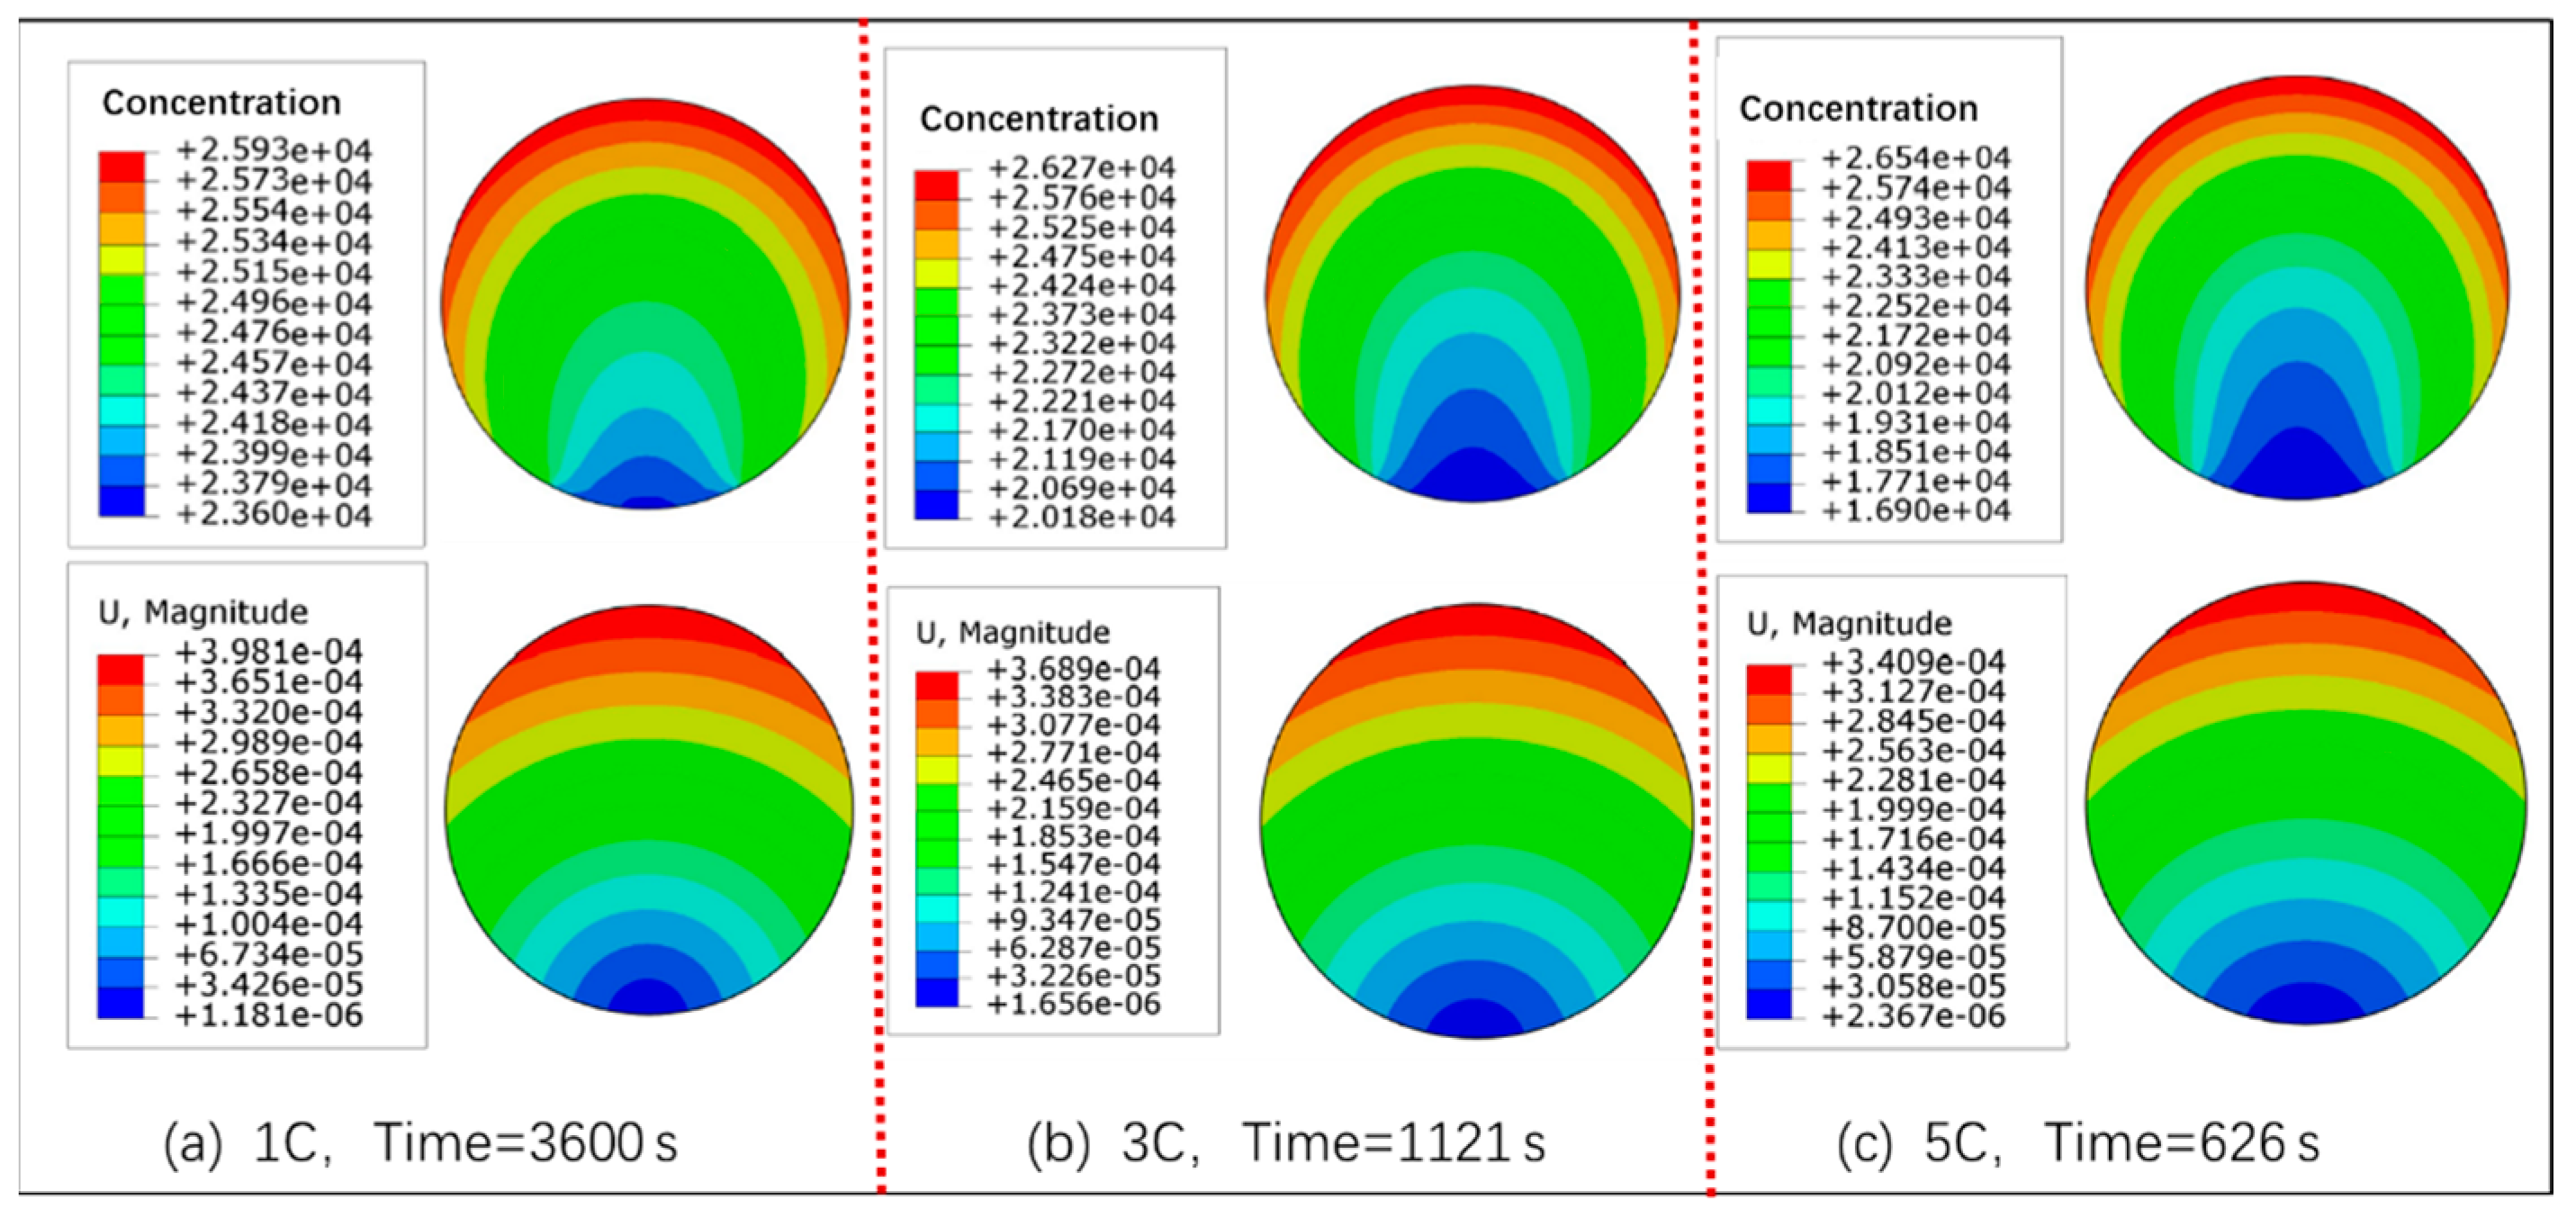
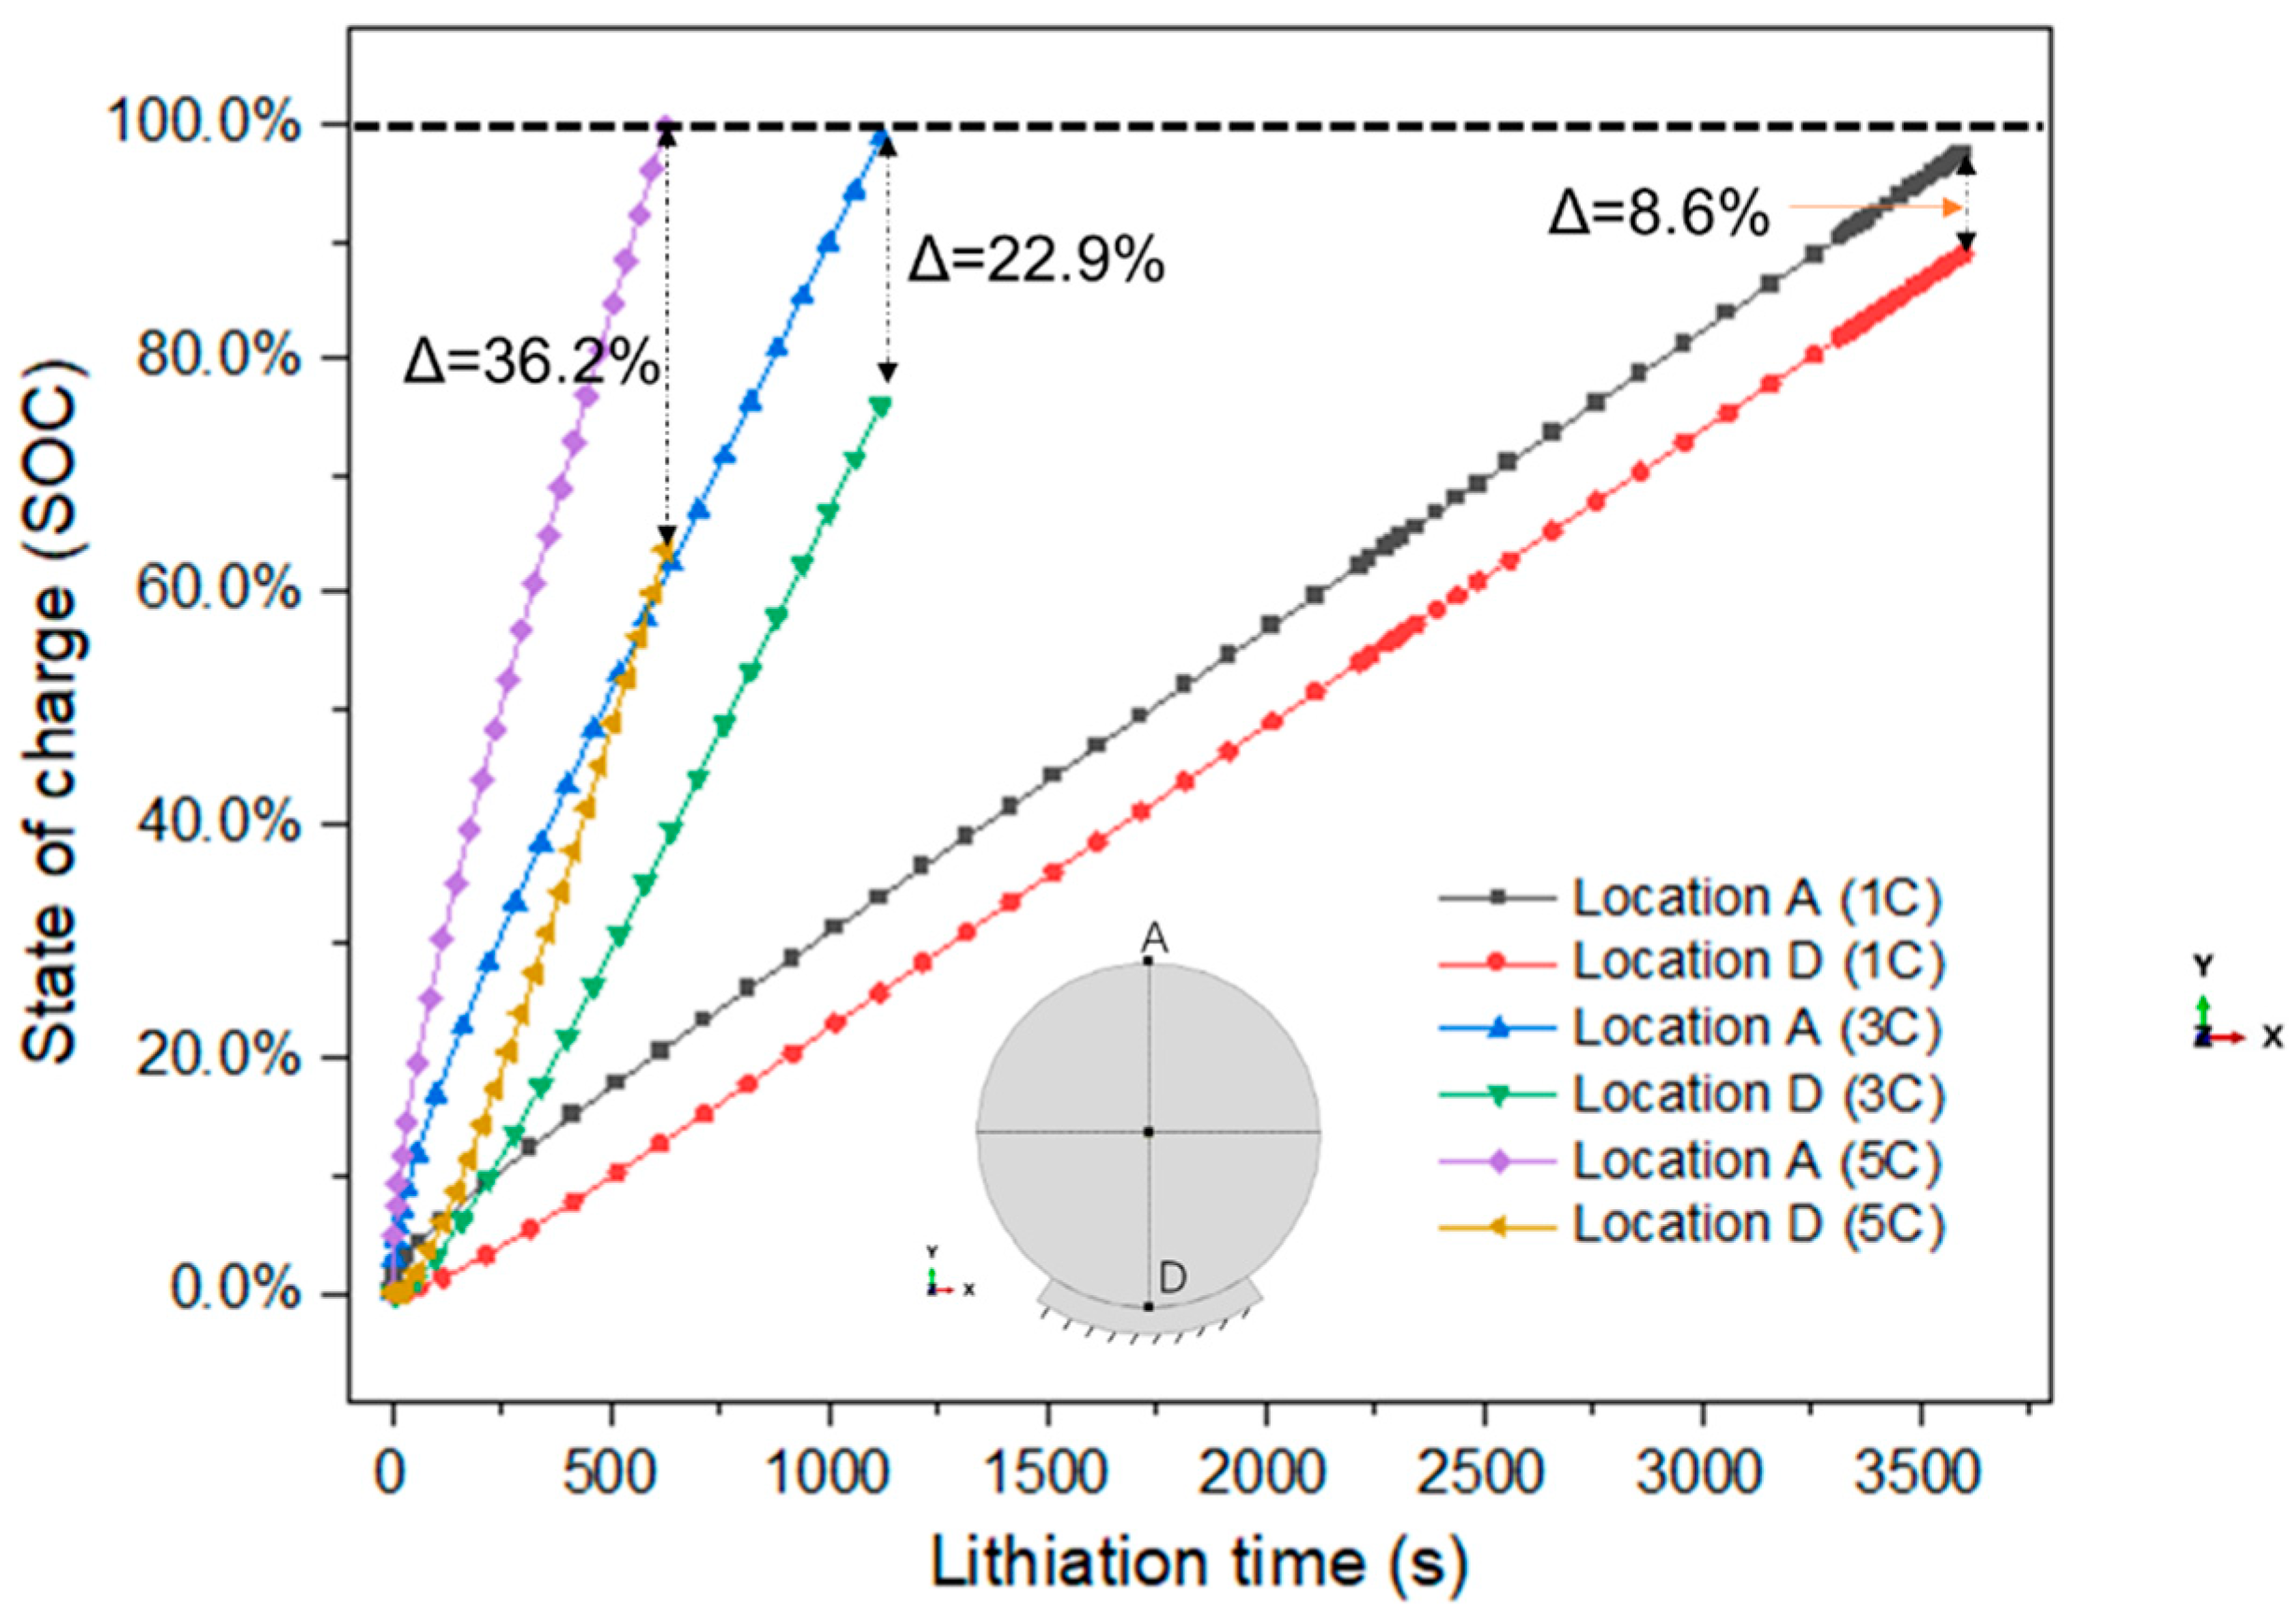
3.1. Concentration, Volume, and Stress of Active Particle

In this section, the main focus is on exploring the variations in lithium ions concentration, active particle volume, and stress over charging time. In the simulation process, the binder PVDF is considered a non-chemically active material, so no lithium-ion flow is applied to the nonactive surface of PBI. The lithium-ion concentration and the corresponding displacement cloud map are shown in Figure 3. At the end of 1 C, 3 C, and 5 C charge, the lithium-ion solubility inside the active particles shows an axisymmetric distribution. This is because, in an ideal situation, a spherical symmetric geometric model, boundary and load conditions, as well as homogeneous material properties, will result in an axisymmetric distribution of stress and concentration fields. In addition, the concentration gradient between the top surface and bottom surface becomes larger as the C-rate increases, owing to the rapid insertion of lithium-ion from the active surface. It is obvious that the maximum concentration of lithium-ion appears at the top surface of the active part (A point), while the lowest concentration is located at the bottom of the particle (D point) due to no lithium-ion flow applied at the binder boundary. From the corresponding displacement profile, it can be found that the displacement of active particles is larger in the area where the lithium-ion concentration is higher due to the fact that the internal expansion rate of particles is positively correlated with lithium-ion concentration.
Table 2 shows the changes in unit volume of particles under different charge rates. Under 1 C, 3 C, and 5 C rates, the unit volume expansion of the particle is 8.1%, 7.5%, and 7.0%, respectively. It is can concluded that the volume expansion ratio decreases as the C-rate increases. This is because the lower the charge rate, the more time is needed for the particle surface to reach saturation concentration or SOC, and the surface of lithium-ion has enough time to diffuse to the center region of the particle. As a result, the lithium-ion concentration in the center region is more uniform at a lower C-rate. On the other hand, the total quantity of lithium-ion embedded in the particle is also higher at lower rates, which leads to a larger volume expansion of the active particle.
The SOC at locations A and D are drawn as a function of time to analyze the behavior of SOC, as shown in Figure 4. The SOC at point A increases rapidly, while the SOC at point D increases slowly at the beginning of charging. As the charging time continues, the SOC of points A and D almost linearly increases dependence on the time, which is due to the constant flow of lithium-ion load on the surface of the particle. At the end of 1 C, 3 C, and 5 C charge, the SOC difference between point A and point D is 8.6%, 22.9%, and 36.2%, respectively. This indicates that as the charge rate increases, the internal concentration gradient of the active particles increases. This result is consistent with concentration cloud map analysis results.
Figure 5 shows the distribution of maximum principal stress. It can be seen that the maximum principal stress in the central region is positive, corresponding to the tensile stress. However, near the PBI region, due to the effect of binder constraints on particles, the maximum principal stress is negative, indicating the region close to PBI endured large compression. In addition, at the end of 1 C and 3 C charge, the maximum tensile stress appears at the edge of the particle binder interface (point B), while at the end of 5 C charge, the maximum tensile stress appears at the center of the particle. This phenomenon is the result of competition factors between the lithium-ion concentration gradient and the binder confinement effect. A maximum principal stress map as a function of time and charge rates was plotted to confirm this conclusion, as shown in Figure 6. The maximum principal stress of active particles can be divided into two phases for 1 C and 3 C charge rates. In the first phase, due to the concentration gradient dominating the generation and distribution of stress, the maximum stress occurs in the central area inside the active particles; that is, the stress value at point C is greater than point B. In the second phase, the maximum tensile stress is at the edge of the active particles, which is attributed to the confinement effect of the binder becomes more prominent compared to the effect of concentration gradient as the continuous expansion of particles. This result is consistent with the previous study literature [42]. However, during 5 C charging, there is only one process for the maximum principal stress. The maximum principal stress value at the center of the particle (point C) is always greater than at the edge of PBI (point B), owing to the concentration gradient factor dominating the whole process of the 5 C charge state. During 1 C and 3 C charging processes, the maximum principal stress at the edge of particle PBI both exceeded 30 MPa, with maximum values of 42.9 MPa (1 C) and 36.6 MPa (3 C), respectively. According to the previous study, the 30 MPa was the ultimate tensile strength of graphite [36]. This indicates that the particle cracks are more likely to be excited at the edge of PBI under 1 C and 3 C charge rates. During 5 C charging processes, the maximum stress value at the central is reached at 35.6 MPa, while the maximum stress at the edge of PBI is below 30 MPa. The results indicate that under a 5 C charge rate, the crack initiation will be located at the central area of the active particle. The damage initiated at the center of the particle due to the DIS was also observed in the previous work [12].
Figure 7 shows the failure position where the internal maximum principal stress of the particle is greater than 30 MPa under the 5 C charge rate. It can be seen that at 86 s, the crack excitation position is occupied at a small area of the center. As the charging progresses, the crack propagates along the central region. At 206 s, the excitation position occupied most of the central area, and then the area gradually decreased until 476 s. The simulation results indicate that electrode particles will undergo internal fracture under high charge rates, leading to capacity degradation. The results are consistent with the previous literature [44].

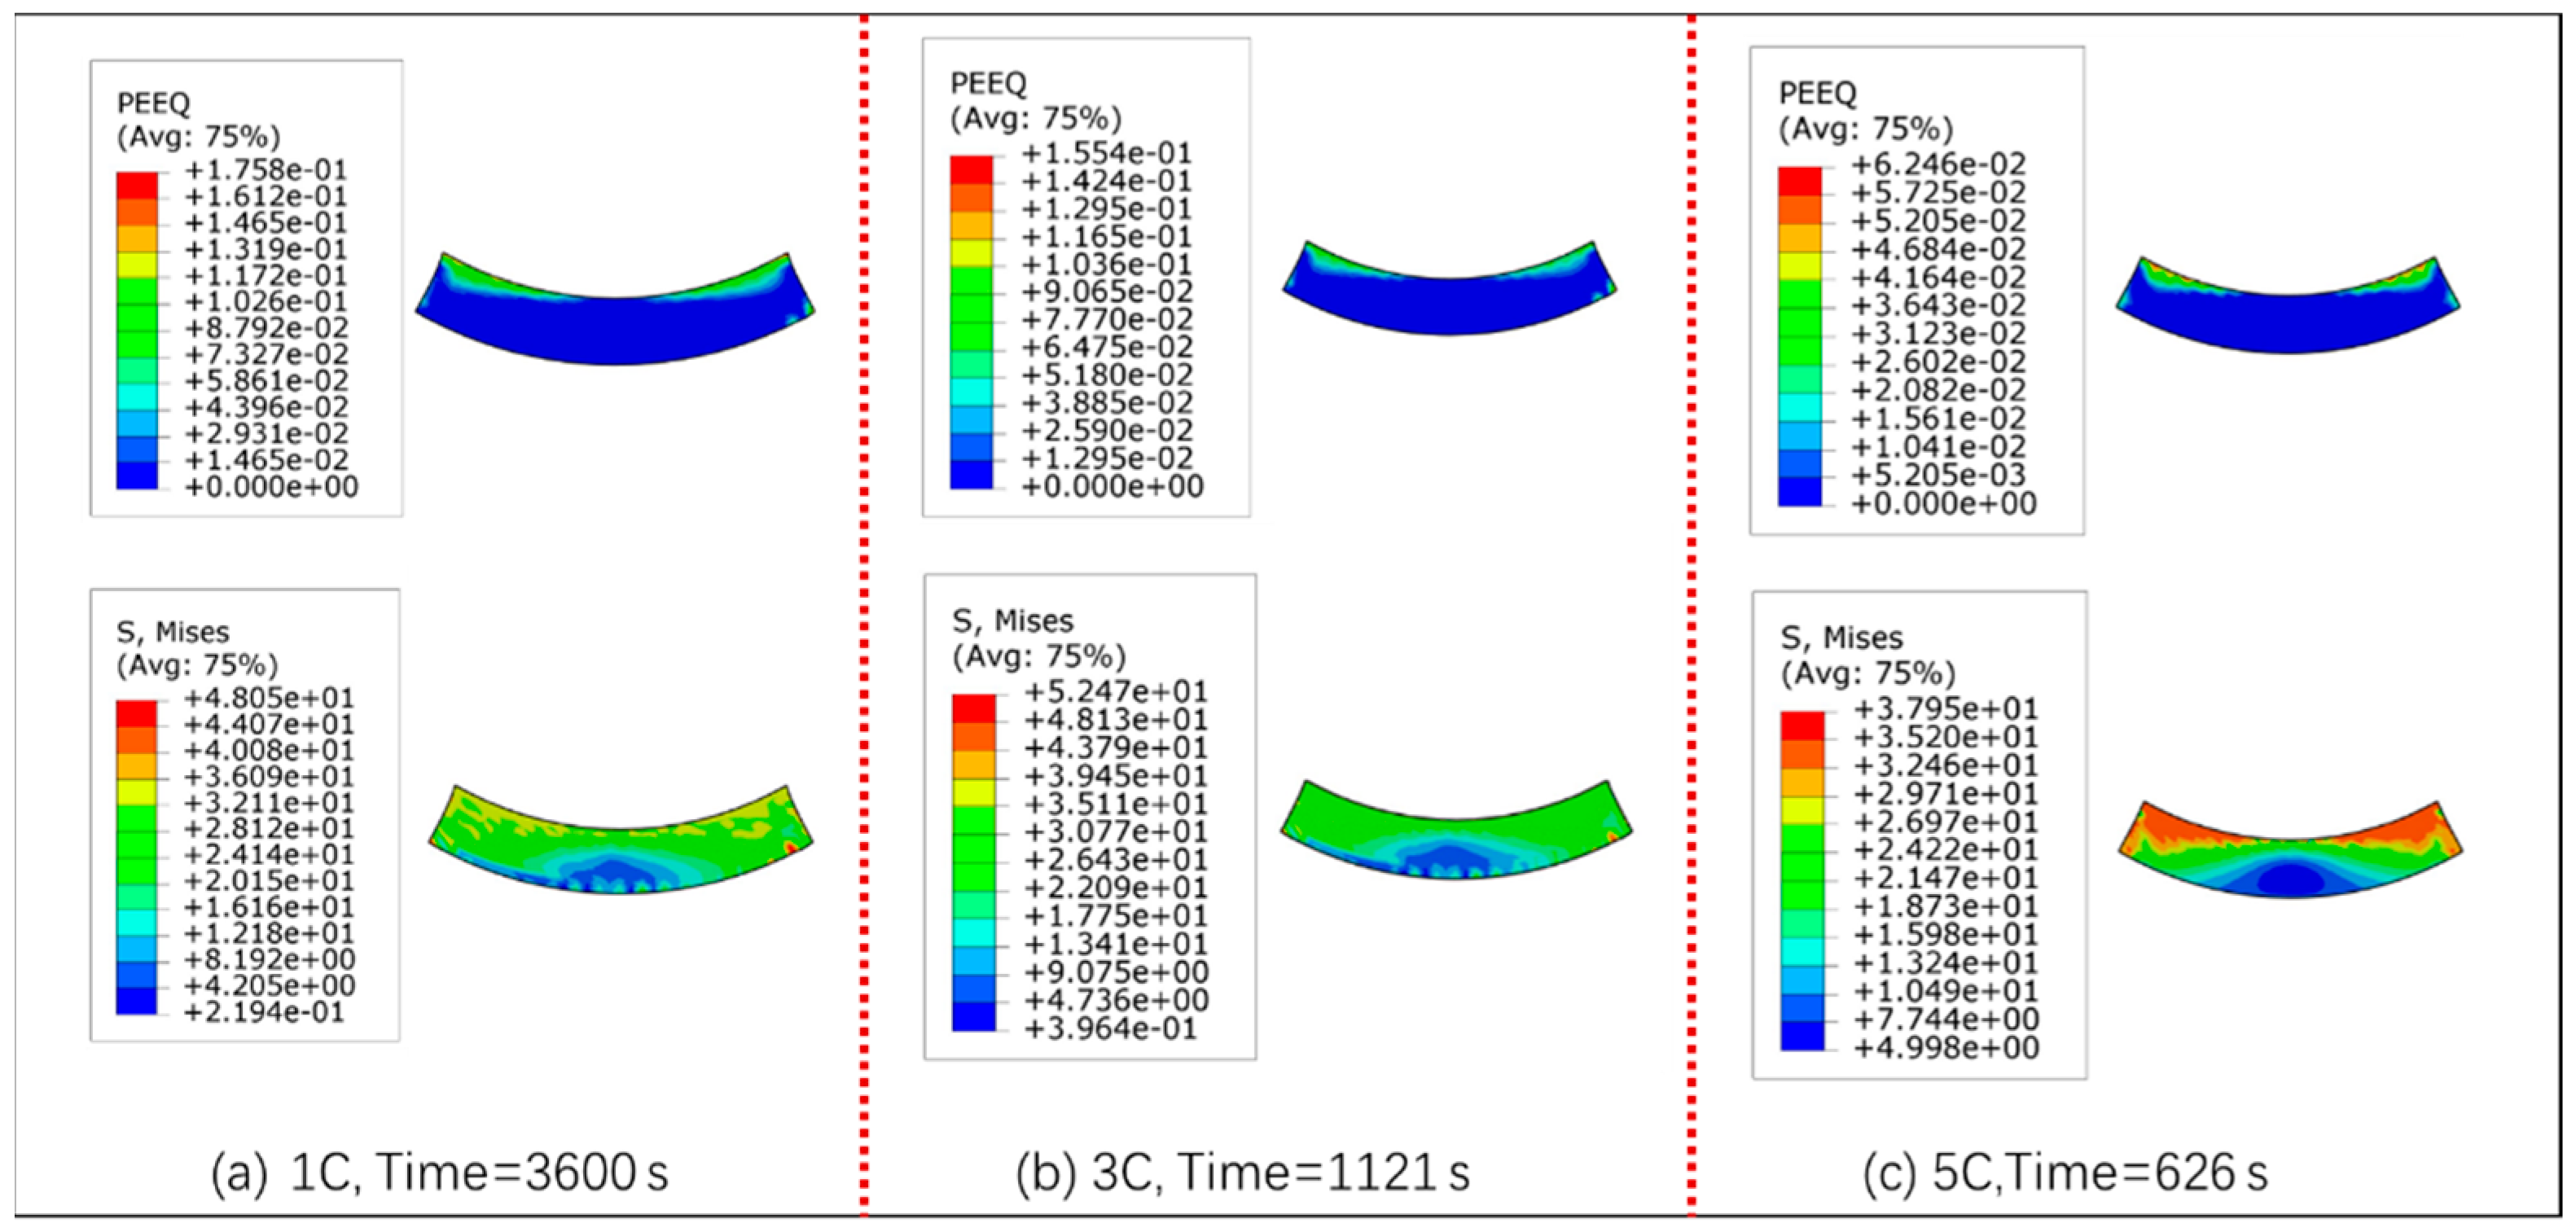
3.2. Stress and Strain Analysis of Binder

The main content of this section is the analysis of the deformation and stress of the binder material. Figure 8 shows the equivalent plastic strain (PEEQ) and corresponding von-Mises stress cloud map of the PVDF binder. From the equivalent plastic cloud map, it can be seen that as the magnification increases, the equivalent plastic deformation decreases. At 1 C, 3 C, and 5 C magnification, the equivalent plastic strains are 0.175, 0.155, and 0.062, respectively. The main reason is that the increase in charge rate leads to a decrease in the volume expansion ratio of active particles, resulting in less plastic strain of PVDF. On the other hand, the strain rate of PVDF increases as increasing charge rate due to the rapid expansion of particles. Meanwhile, the yield stress of PVDF increases with the increasing strain rate, as depicted in Figure 2, making it more difficult for PVDF to undergo plastic deformation.
From the corresponding von-Mises stress cloud map, it can be seen that the largest von-Mises stress value of PVDF is 48.05 MPa, 52.47 MPa, and 37.95 MPa at the end of 1 C, 3 C, and 5 C charge, respectively. Generally, for a certain strain rate, the larger the von-Mises stress, the greater the equivalent plastic strain. However, the maximum equivalent plastic strain under 3 C (0.1554) is less than 1 C (0.1758), while the maximum von-Mises stress under 3 C is greater than 1 C. This may be due to the higher strain rate of PVDF under 3 C compared to 1 C, resulting in higher yield strength and less plastic deformation of PVDF under 3 C.

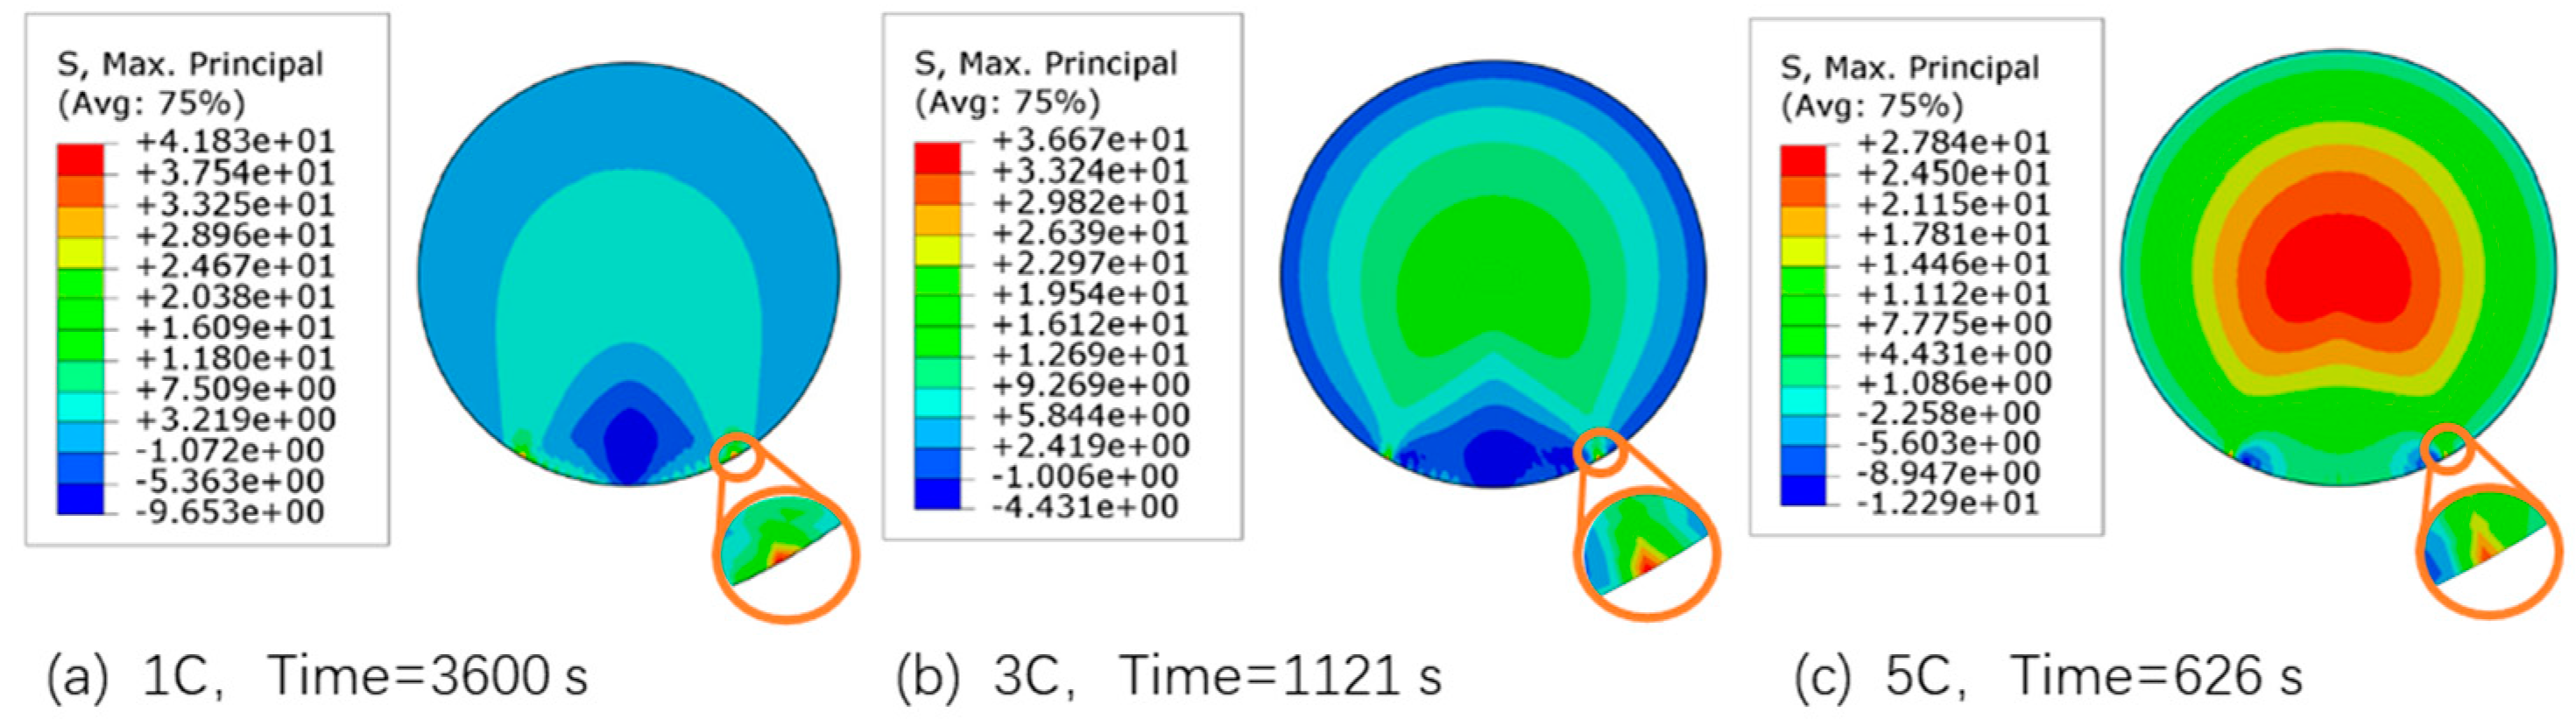
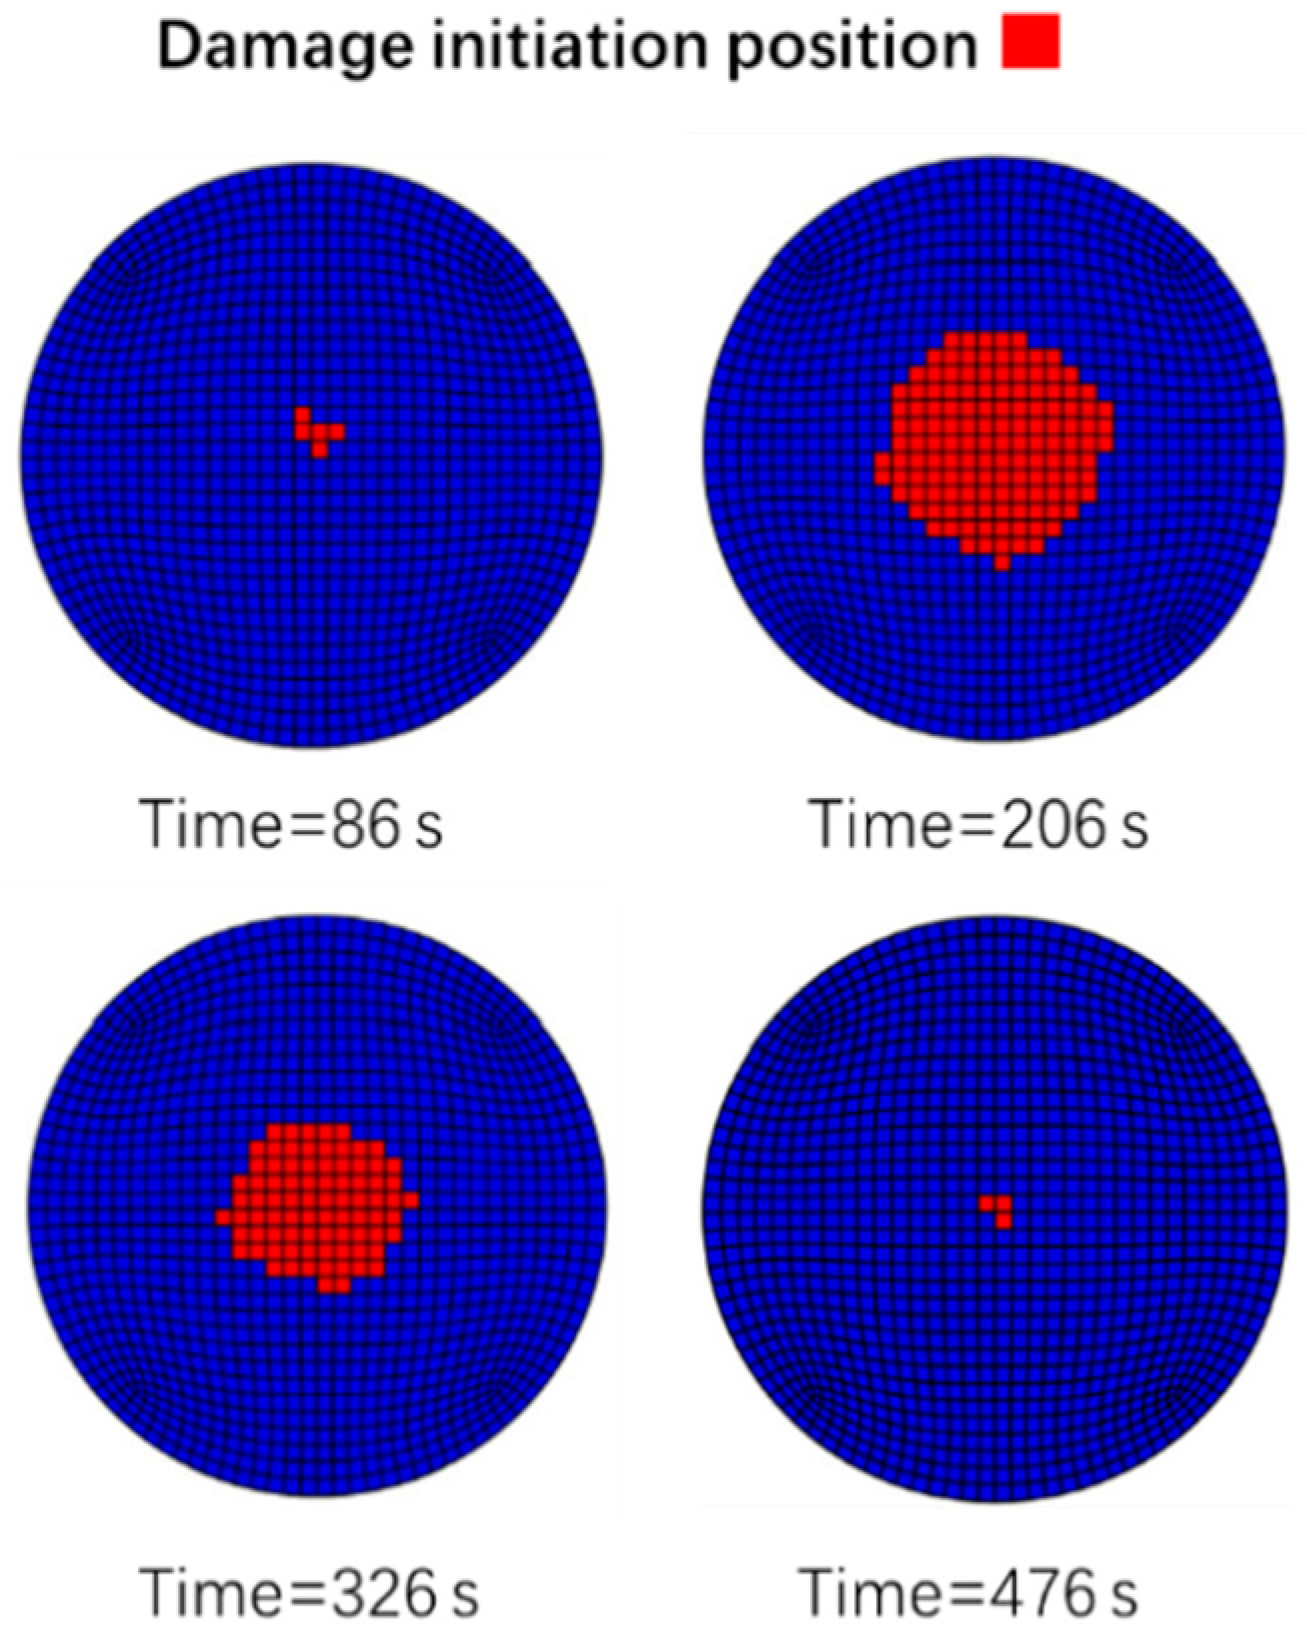
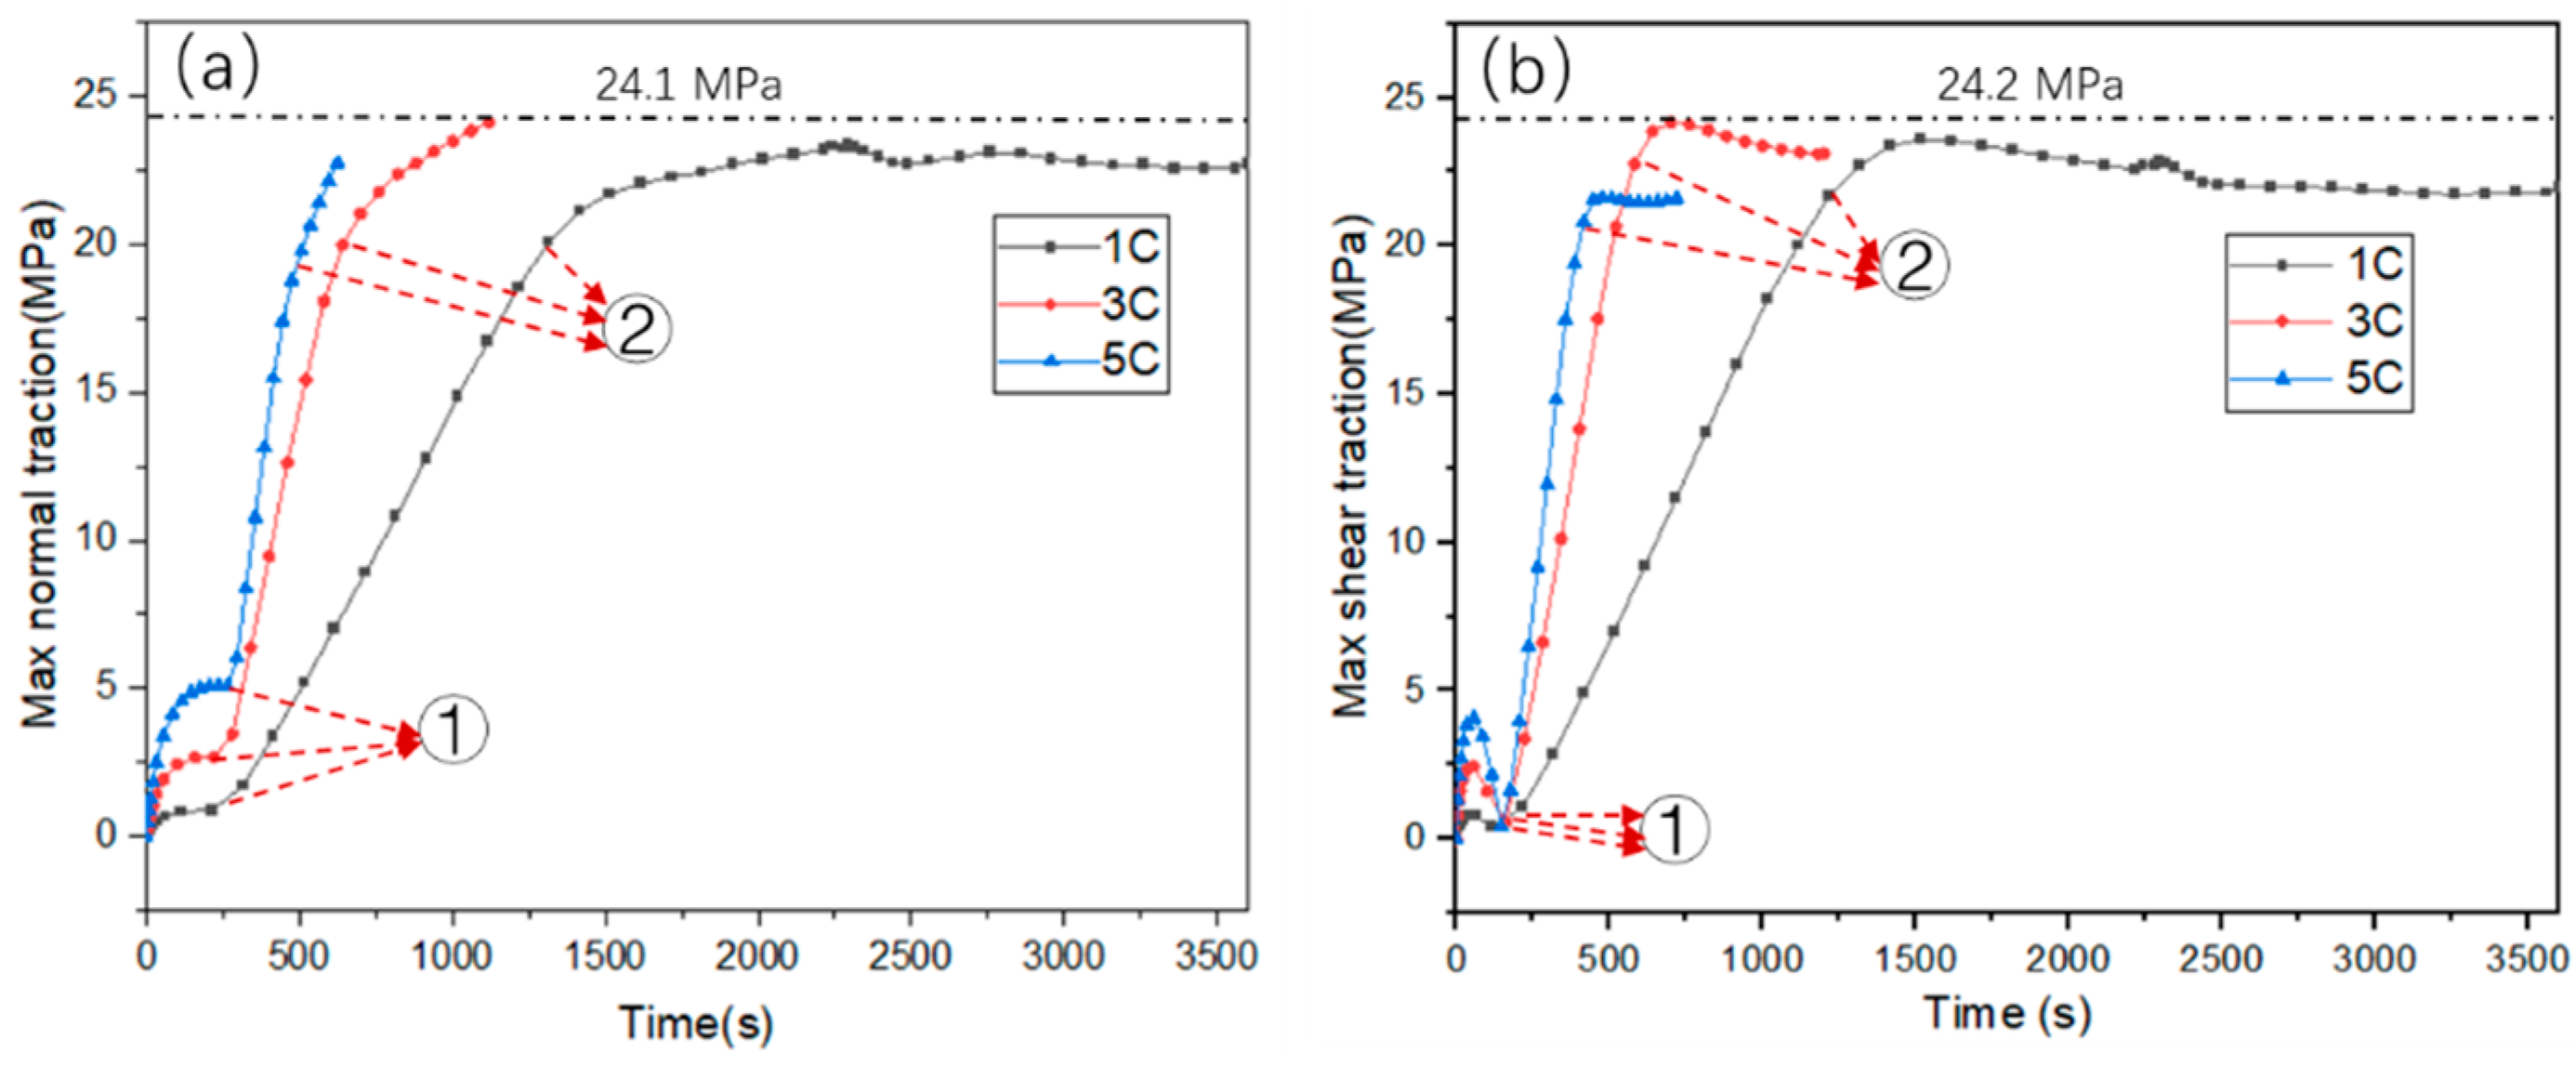
3.3. PBI Interface Stress Analysis

This section investigates the interfacial bonding properties. Figure 9 shows the normal stress vector diagram of the PBI. At the end of charge rates of 1 C, 3 C, and 5 C, the maximum normal tensile stress location was at the edge of the PBI. Figure 10a,b show the normal stress and shear stress of PBI along the path of D→B with the start point of D and the end point of B, respectively. It can be seen that on the D→B path, except for the area adjacent to point B, the normal stress is at a relatively low level. The normal stress increases sharply when near the point of B, as shown in Figure 10a. As for Figure 10b, it is clearly seen that the shear force is almost zero at the start of path D point, but the largest shear stress values are located at the end of path B point. The above analysis indicates that there is stress concentration at point B, which is most likely to cause delamination failure at point B.
Figure 11a shows the maximum normal tensile stress as a function of time at different charge rates. It can be seen that the maximum normal stress curve can be divided into two stages. The index ① represents the process of the maximum normal traction force shifting from the center of the interface to the edge, while the index ② stage represents the slope transition from a linear upward to a gentle rise. Figure 11b shows the maximum shear traction force as a function of time at different charge rates. The shear stress is taken as an absolute value because the failure mode of shear traction is independent of the shear direction. The index ① represents the process of the maximum tangential stress shifting inward to outward, while index ② represents the turning point of the upward slope. From both of the pictures, it can be seen that the slope of the curve significantly decreases after the index ②. The stage after the index ② mainly involves the plastic deformation of PVDF, which reduces the constraint effect on the active particle during the charging process. The PVDF mechanical model was changed to a linear elastic model to confirm this. The finite element simulation calculation results can be found in Supporting Information. There is only a linear rise stage and no index ② stage where the slope decreases, as shown in Figure S1. Furthermore, as displayed in Figure 11a,b, at the end of charge, the maximum normal traction and maximum tangential traction at the PBI are 24.1 MPa and 24.2 MPa, respectively, both of which do not exceed the nominal normal traction of 300 MPa and nominal shear traction 50 MPa. Therefore, there will be no debonding at the particle and binder interface. By contrast, in Supplementary Materials, after changing the elastic-viscoplastic model of PVDF to a linear elastic model, the constraint effect of PVDF on the particle becomes stronger as compared to the elastic-viscoplastic model. As shown in Figure S2, at the end of the charge, the shear traction stress at the interface exceeds 50 MPa, leading to interface damage.

4. Conclusions

The finite element simulation was used to analyze the failure behavior of the particle-binder system under different charge rates (1 C, 3 C, 5 C). The following conclusions are drawn:
(1)
As the charge rate increases, the concentration gradient of lithium-ion in particles increases, but the volume expansion ratio decreases. At the 1 C, 3 C, and 5 C charge rates, the volume expansion ratios of the particle are 8.1%, 7.5%, and 7.0%, respectively.
(2)
Under 1 C and 3 C charge rates, the maximum principal stress occurs at the edge of the particle and binder interface; thus, the particle is most likely to crack from the edge of the PBI. While under a higher rate of 5 C, the maximum principal stress occurs inside the particle; this may cause particle fracture from the center area.
(3)
When the binder material PVDF adopts an elastic-viscoplastic model, the maximum normal stress and shear stress are at the edge of PBI. Moreover, simulation analysis results show that there is no delamination damage at the particle and binder interface due to the plastic deformation behavior of the PVDF, which reduced the stress concentration at the PBI.
(4)
The plastic deformation of PVDF decreases with the increase of charge rate. However, the plastic deformation of PVDF may lead to the fatigue failure of the binder under repeated charging and discharging processes.

Supplementary Materials

The following supporting information can be downloaded at: https://www.mdpi.com/article/10.3390/batteries11040132/s1.

Author Contributions

Methodology, J.C.; Validation, Y.Z. All authors have read and agreed to the published version of the manuscript.

Funding

Research on Battery Thermal Management and Anti-collision Based on Composite Phase Change Materials (GJJ2201505); Research on CP3 Three-dimensional adjustment based on the measurement of total station without Leveling and its Service Life Precision Repair Method (52068052).

Data Availability Statement

The original contributions presented in this study are included in the article and Supplementary Materials. Further inquiries can be directed to the corresponding author.

Conflicts of Interest

The authors declare that they have no known competing financial interests or personal relationships that could have appeared to influence the work reported in this paper.

References

  1. Shi, C.; Wang, T.; Liao, X.; Qie, B.; Yang, P.; Chen, M.; Wang, X.; Srinivasan, A.; Cheng, Q.; Ye, Q.; et al. Accordion-like stretchable Li-ion batteries with high energy density. Energy Storage Mater. 2019, 17, 136–142. [Google Scholar]
  2. Liu, J.; Zhou, L.; Zhang, Y.; Wang, J.; Wang, Z. Aging behavior and mechanisms of lithium-ion battery under multi-aging path. J. Clean. Prod. 2023, 423, 138678. [Google Scholar] [CrossRef]
  3. Lisbona, D.; Snee, T. A review of hazards associated with primary lithium and lithium-ion batteries. Process Saf. Environ. Prot. 2011, 89, 434–442. [Google Scholar] [CrossRef]
  4. Liu, J.; Yadav, S.; Salman, M.; Chavan, S.; Kim, S.C. Review of thermal coupled battery models and parameter identification for lithium-ion battery heat generation in EV battery thermal management system. Int. J. Heat Mass Transf. 2024, 218, 124748. [Google Scholar] [CrossRef]
  5. Harris, S.J.; Deshpande, R.D.; Qi, R.; Dutta, R.; Cheng, R.T. Mesopores inside electrode particles can change the Li-ion transport mechanism and diffusion-induced stress. J. Mater. Res. 2010, 25, 1433–1440. [Google Scholar] [CrossRef]
  6. Cheng, Y.T.; Verbrugge, M.W. Evolution of stress within a spherical insertion electrode particle under potentiostatic and galvanostatic operation. J. Power Sources 2009, 190, 453–460. [Google Scholar] [CrossRef]
  7. Mukhopadhyay, A.; Sheldon, B.W. Deformation and stress in electrode materials for Li-ion batteries. Prog. Mater. Sci. 2014, 63, 58–116. [Google Scholar] [CrossRef]
  8. Wolfenstine, J. Critical grain size for microcracking during lithium insertion. J. Power Sources 1999, 79, 111–113. [Google Scholar] [CrossRef]
  9. Aifantis, K.E.; Deinpsey, J.P. Stable crack growth in nanostructured Li-batteries. J. Power Sources 2005, 143, 203–211. [Google Scholar] [CrossRef]
  10. Clerici, D. Diffusion-induced stress amplification in phase-transition materials for electrodes of lithium-ion batteries. Int. J. Mech. Sci. 2024, 281, 109541. [Google Scholar] [CrossRef]
  11. Verbrugge, M.W.; Cheng, Y.T. Stress and Strain-Energy Distributions within Diffusion-Controlled Insertion-Electrode Particles Subjected to Periodic Potential Excitations. J. Electrochem. Soc. 2009, 156, A927–A937. [Google Scholar] [CrossRef]
  12. Zhu, X.; Chen, Y.; Chen, H.; Luan, W. The diffusion induced stress and cracking behaviour of primary particle for Li-ion battery electrode. Int. J. Mech. Sci. 2020, 178, 105608. [Google Scholar]
  13. Korsunsky, A.M.; Sui, T.; Song, B. Explicit formulae for the internal stress in spherical particles of active material within lithium ion battery cathodes during charging and discharging. Mater. Des. 2015, 69, 247–252. [Google Scholar]
  14. Woodford, W.H.; Chiang, Y.M.; Carter, W.C. “Electrochemical Shock” of Intercalation Electrodes: A Fracture Mechanics Analysis. J. Electrochem. Soc. 2010, 157, A1052–A1059. [Google Scholar]
  15. Klinsmann, M.; Rosato, D.; Kamlah, M.; McMeeking, R.M. Modeling crack growth during Li insertion in storage particles using a fracture phase field approach. J. Mech. Phys. Solids 2016, 92, 313–344. [Google Scholar] [CrossRef]
  16. Klinsmann, M.; Rosato, D.; Kamlah, M.; Mcmeeking, R.M. Modeling crack growth during Li extraction and insertion within the second half cycle. J. Power Sources 2016, 331, 32–42. [Google Scholar]
  17. Jiang, S.; Zhou, J.; Yang, H.; Tan, S.; Wu, Y.; Wang, C. Ionic liquid fabricated PVDF binder for cathode toward stable and high-rate lithium-ion batteries. J. Power Sources 2025, 633, 236439. [Google Scholar]
  18. Chen, S.; Guo, J.; Zang, H.; Liu, C.; Yu, N.; Geng, B. Oxygen vacancy-enriched TiO2 nanosheets filled PVDF electrolyte for semi-solid-state batteries: Synergistic effects of conformational transition and defect sites. J. Alloys Compd. 2025, 1020, 179357. [Google Scholar]
  19. Wang, H.; Nadimpalli, S.P.V.; Shenoy, V.B. Inelastic shape changes of silicon particles and stress evolution at binder/particle interface in a composite electrode during lithiation/delithiation cycling. Extrem. Mech. Lett. 2016, 9, 430–438. [Google Scholar]
  20. Xu, R.; Yang, Y.; Yin, F.; Liu, P.; Cloetens, P.; Liu, Y.; Lin, F.; Zhao, K. Heterogeneous damage in Li-ion batteries: Experimental analysis and theoretical modeling. J. Mech. Phys. Solids 2019, 129, 160–183. [Google Scholar]
  21. Lee, S.; Yang, J.; Lu, W. Debonding at the interface between active particles and PVDF binder in Li-ion batteries. Extrem. Mech. Lett. 2016, 6, 37–44. [Google Scholar]
  22. Iqbal, N.; Ali, Y.; Lee, S. Mechanical degradation analysis of a single electrode particle with multiple binder connections: A comparative study. Int. J. Mech. Sci. 2020, 188, 105943. [Google Scholar]
  23. Wu, Y.; Guo, Z.-S. Modeling Li-ion concentration distribution and stress of porous electrode particles considering binder and direct particle contact. J. Energy Storage 2021, 44, 103315. [Google Scholar]
  24. Trembacki, B.L.; Noble, D.R.; Brunini, V.E.; Ferraro, M.E.; Roberts, S.A. Mesoscale Effective Property Simulations Incorporating Conductive Binder. J. Electrochem. Soc. 2017, 164, E3613. [Google Scholar]
  25. Huang, P.; Gao, L.T.; Guo, Z.-S. Elastoplastic model for chemo-mechanical behavior of porous electrodes using image-based microstructure. Int. J. Solids Struct. 2022, 254, 111903. [Google Scholar] [CrossRef]
  26. Wu, W.; Xiao, X.; Wang, M.; Huang, X. A Microstructural Resolved Model for the Stress Analysis of Lithium-Ion Batteries. J. Electrochem. Soc. 2014, 161, A803. [Google Scholar] [CrossRef]
  27. Santimetaneedol, A.; Tripuraneni, R.; Chester, S.A.; Nadimpalli, S.P.V. Time-dependent deformation behavior of polyvinylidene fluoride binder: Implications on the mechanics of composite electrodes. J. Power Sources 2016, 332, 118–128. [Google Scholar]
  28. Rahani, E.K.; Shenoy, V.B. Role of Plastic Deformation of Binder on Stress Evolution during Charging and Discharging in Lithium-Ion Battery Negative Electrodes. J. Electrochem. Soc. 2013, 160, A1153. [Google Scholar]
  29. Hund, J.; Granum, H.M.; Olufsen, S.N.; Holmström, P.H.; Johnsen, J.; Clausen, A.H. Impact of stress triaxiality, strain rate, and temperature on the mechanical response and morphology of PVDF. Polym. Test. 2022, 114, 107717. [Google Scholar] [CrossRef]
  30. André-Castagnet, S.; Tencé-Girault, S. Relationships Between Mechanical Tensile Behavior and Micro-mechanisms in Poly(Vinylidene Fluoride) at High Temperatures: Influence of the Molecular Weight Distribution. J. Macromol. Sci. Part B 2002, 41, 957–976. [Google Scholar]
  31. Sethuraman, V.A.; Nguyen, A.; Chon, M.J.; Nadimpalli, S.P.V.; Wang, H.; Abraham, D.P.; Bower, A.F.; Shenoy, V.B.; Guduru, P.R. Stress Evolution in Composite Silicon Electrodes during Lithiation/Delithiation. J. Electrochem. Soc. 2013, 160, A739–A746. [Google Scholar] [CrossRef]
  32. Chaurasiya, S.P.; Ghosh, R. A new mathematical model of compressive stress-strain behaviour of low viscosity and high viscosity bone cement with different strain rates. Med. Eng. Phys. 2023, 117, 104001. [Google Scholar]
  33. Zhang, X.; Shyy, W.; Sastry, A.M. Numerical Simulation of Intercalation-Induced Stress in Li-Ion Battery Electrode Particles. J. Electrochem. Soc. 2007, 154, A910–A916. [Google Scholar] [CrossRef]
  34. Iqbal, N.; Ali, Y.; Haq, I.U.; Lee, S. Progressive interface debonding in composite electrodes of Li-ion batteries via mixed-mode cohesive zone model: Effects of binder characteristics. Compos. Struct. 2020, 259, 113173. [Google Scholar] [CrossRef]
  35. Chen, Y.; Chen, H.; Luan, W. Shakedown, ratcheting and fatigue analysis of cathode coating in lithium-ion battery under steady charging-discharging process. J. Mech. Phys. Solids 2021, 150, 104366. [Google Scholar]
  36. Kapidžić, Z.; Ansell, H.; Schön, J.; Simonsson, K. Quasi-static bearing failure of CFRP composite in biaxially loaded bolted joints. Compos. Struct. 2015, 125, 60–71. [Google Scholar] [CrossRef]
  37. Benzeggagh, M.L.; Kenane, M. Measurement of Mixed-Mode Delamination Fracture Toughness of Unidirectional Glass/Epoxy Composites with Mixed-Mode Bending Apparatus. Compos. Sci. Technol. 1996, 56, 439–449. [Google Scholar]
  38. Díaz, A.; Alegre, J.M.; Cuesta, I.I. Coupled hydrogen diffusion simulation using a heat transfer analogy. Int. J. Mech. Sci. 2016, 115, 360–369. [Google Scholar]
  39. Iqbal, N.; Lee, S. Mechanical Failure Analysis of Graphite Anode Particles with PVDF Binders in Li-Ion Batteries. J. Electrochem. Soc. 2018, 165, A1961–A1970. [Google Scholar]
  40. Christensen, J.; Newman, J. Stress generation and fracture in lithium insertion materials. J. Solid State Electrochem. 2006, 10, 293–319. [Google Scholar] [CrossRef]
  41. Iqbal, N.; Ali, Y.; Lee, S. Analysis of mechanical failure at the interface between graphite particles and polyvinylidene fluoride binder in lithium-ion batteries. J. Power Sources 2020, 457, 228019. [Google Scholar] [CrossRef]
  42. Iqbal, N.; Lee, S. Stress-regulated pulse charging protocols via coupled electrochemical-mechanical model for the mechanical stability of electrode materials in lithium-ion batteries. J. Power Sources 2022, 536, 231376. [Google Scholar] [CrossRef]
  43. Lee, S.; Park, J.; Yang, J.; Lu, W. Molecular Dynamics Simulations of the Traction-Separation Response at the Interface between PVDF Binder and Graphite in the Electrode of Li-Ion Batteries. J. Electrochem. Soc. 2014, 161, A1218–A1223. [Google Scholar] [CrossRef]
  44. Zhao, K.; Pharr, M.; Vlassak, J.J.; Suo, Z. Fracture of electrodes in lithium-ion batteries caused by fast charging. J. Appl. Phys. 2010, 108, 473. [Google Scholar] [CrossRef]
Figure 1. (a) Geometric schematic diagram of particle-binder systems (b) The location ‘A’ is situated at the top of the active particle, the location ‘C’ at the center of the active particle, ‘D’ and ‘B’ at the center and edge of the particle–binder interface, respectively.
Batteries 11 00132 g001
Figure 2. The Relationship between PVDF Yield Strength and strain rate at different temperature.
Batteries 11 00132 g002
Figure 3. The lithium-ion concentration and the corresponding displacement cloud map (a) 1 C at the time of 3600 s, (b) 3 C at the time of 1148 s, (c) 5 C at the time of 626 s.
Batteries 11 00132 g003
Figure 4. Analysis of the SOC at the locations of A (local maximum) and D (local minimum) under 1 C, 3 C, and 5 C conditions.
Batteries 11 00132 g004
Figure 5. The maximum principal stress disftribution maps at different charge rates (a) 1 C (b) 3 C (c) 5 C.
Batteries 11 00132 g005
Figure 6. The maximum principal stress at particle center and PBI edge as a function of time under 1 C, 3 C, and 5 C.
Batteries 11 00132 g006
Figure 7. The crack excitation location of active particles changes under a 5 C charge rate.
Batteries 11 00132 g007
Figure 8. The PEEQ and the corresponding von-Mises cloud map of binder (a) 1 C at the time of 3600 s, (b) 3 C at the time of 1148 s, (c) 5 C at the time of 626 s.
Batteries 11 00132 g008
Figure 9. Normal traction stress vector diagram along the particle binder interface at the end of charge under different rates (a) 1 C (b) 3 C (c) 5 C.
Batteries 11 00132 g009
Figure 10. Distribution of traction forces along the D→B path (particle-binder interface) at the end of charge under different rates (a) normal traction at 1 C, 3 C, and 5 C charge rates (b) shear traction at 1 C, 3 C, and 5 C charge rates.
Batteries 11 00132 g010
Figure 11. The investigation of the interfacial traction force at the particle-binder interface during charging at 1 C, 3 C, and 5 C (a) the maximum normal interfacial traction, (b) maximum shear interfacial traction.
Batteries 11 00132 g011
Table 1. Parameters of the material.
ParameterUnitsValuesReferences
Faraday’s constant (F)C/mol96,487
Absolute temperature (T)K300
Specific Capacity (a)mAhg−1372[39]
Partial molar volume of lithium(Ω)m3/mol3.645 × 10−6[39]
Diffusion coefficient of lithium (D)m2s−11 × 10−15[12]
Gas constant (R)J/(mol × K)8.314
Charge rate (Crate)h−11, 3, 5
Young’s modulus of graphite (E)GPa15[40,41]
Poisson’s ratio of graphite (υ) 0.3[40,41]
Maximum lithium concentration (cmax)mol/m326,580[39]
Nominal normal traction ( σ n n o m )MPa300 [42,43]
Nominal shear traction ( σ s n o m )MPa50 [42,43]
Boltzmann’s constant (kB)J/K1.38 × 10−23
Activation volume (V)nm32.69[29]
Activation enthalpy (ΔH)kJ/mol248.4[29]
Reference strain rate ( ε 0 ˙ )s−19.56 × 1029[29]
Table 2. Unit volume change rate of active particles under different charge rates.
Charge RateUnit Volume Value (mm3)Expansivities
1 C8.49 × 10−58.10%
3 C8.44 × 10−57.50%
5 C8.40 × 10−57.0%
Disclaimer/Publisher’s Note: The statements, opinions and data contained in all publications are solely those of the individual author(s) and contributor(s) and not of MDPI and/or the editor(s). MDPI and/or the editor(s) disclaim responsibility for any injury to people or property resulting from any ideas, methods, instructions or products referred to in the content.

