Article

Do Silicon-Based Li-Ion Batteries Require a Time-Consuming Solid Electrolyte Interphase Formation Process?

by
Sheng S. Zhang
Battery Science Branch, Energy Sciences Division, DEVCOM Army Research Laboratory, Adelphi, MD 20783, USA
Batteries 2025, 11(4), 122; https://doi.org/10.3390/batteries11040122
Submission received: 4 March 2025 / Revised: 20 March 2025 / Accepted: 21 March 2025 / Published: 24 March 2025

Abstract

:
The solid electrolyte interphase (SEI) is a crucial component for ensuring the safe and long-term cycling of graphite-based Li-ion batteries. Traditionally, SEI formation requires a low current rate (0.05C–0.1C) and a moderate temperature (25–45 °C), and the same process has been widely applied in the manufacturing of silicon-based Li-ion batteries. However, silicon stores Li+ ions through different mechanisms than graphite, raising the question of whether such a time-consuming SEI formation process is necessary. In this work, carbon-coated SiOx is selected as a representative silicon material, and both Li/SiOx half-cells and SiOx/LiNi0.8Co0.1Mn0.1O2 (NCM811) full cells are assembled and cycled at varying current rates for the first 10 cycles, followed by identical cycling conditions for the subsequent cycles. The results show that the initial current rate has a minimal impact on the long-term cycling stability of both SiOx-based Li metal half-cells and Li-ion cells. Notably, Li-ion cells formed at higher current rates exhibit lower overall impedance than those formed at lower current rates, consequently demonstrating better rate capability. These findings suggest that the time-consuming SEI formation process may not be necessary for the manufacturing of silicon-based Li-ion batteries, potentially simplifying production and reducing processing time.

1. Introduction

SEI formation is a critical process in the manufacture of graphite-based Li-ion batteries. During this process, a protective SEI layer forms on the surface of graphite particles, ensuring the safe and long-term cycling of the batteries. As suggested by its name, the SEI is an interphase that is highly conductive to Li+ ions while being substantially electron-insulating. In batteries, the SEI functions to prevent solvated Li+ ions from accessing the graphite surface, thereby avoiding solvent cointercalation into the graphite and the subsequent electrochemical reduction, which has been identified as the primary source for graphite structure exfoliation [1,2]. The SEI predominantly forms during the initial several cycles, especially the first charge, and it is primarily composed of the electrochemical reduction products of electrolyte components, mostly solvents. To form a high-quality SEI, it is essential that the reduction products of the electrolyte components are substantially insoluble and that the deposition kinetics are sufficiently slow to constitute a dense, stable, and highly ion-conductive structure. The latter is influenced largely by the current rate and temperature, with research showing that a slow current rate (0.05C–0.1C) [3] and a low-to-moderate temperature (25–45 °C) [4,5] favor the formation of a high-quality SEI. As such, SEI formation is a very time-consuming process, which significantly increases the manufacturing cost of Li-ion batteries. Additionally, the potential range was found to critically affect SEI properties. Generally, an SEI formed at higher potentials (>0.5 V vs. Li/Li+) exhibits high ionic conductivity but inferior structural stability, whereas an SEI formed at lower potentials (<0.5 V vs. Li/Li+) offers better structural stability with slightly lower ionic conductivity [6]. An SEI formed during the intercalation of Li+ ions into graphite, namely at low potentials, has a particularly stable structure [7], indicating that the reduction kinetics of the solvents along with the dissociation of the solvated Li+ ions is most favorable for forming a stable SEI. Based on these findings, various charging protocols have been explored to improve SEI stability and reduce formation time, such as multiple-step current [6,8] or voltage [9,10] charge formation, raising formation temperature [11,12,13], narrowing formation potential range [14,15], and pulse formation [16,17].
To date, the SEI formation process for graphite-based Li-ion batteries has matured significantly, and the same process has been widely applied to the manufacture of silicon-based Li-ion batteries [18,19,20,21,22]. However, silicon stores Li+ ions through a mechanism entirely different from graphite. In graphite, the primary function of the SEI is to prevent solvent cointercalation into graphite together with Li+ ions and the resulting reduction between the graphene planes of the graphite structure. This solvent cointercalation does not occur with silicon anodes, raising the question of whether the time-consuming SEI formation process is necessary for the manufacture of silicon-based Li-ion batteries. To address this question, in this work, we study the effect of the formation current rate on the cycling performance, particularly the cycling stability, of silicon by using SiOx as the anode material and NCM811 as the cathode material. Surprisingly, we observed from both the Li/SiOx half-cells and SiOx/NCM811 full cells that the formation current rate has a minimal effect on the cycling performance of Si anode materials. Moreover, it was found that the cells formed at higher current rates exhibit lower overall impedance compared to those formed at lower current rates. These findings suggest that the time-consuming SEI formation process may not be necessary for Si-based Li-ion batteries, potentially reducing the manufacturing cost of these batteries significantly.

2. Materials and Methods

Carbon-coated SiOx powder, with a D50 of 5.0 ± 1.0 µm and a D90 of 10.0 ± 1.0 µm, was purchased from MSE Supplies LLC (Tucson, AZ, USA) and coated onto a copper foil in a composition of 60% SiOx, 20% Super-P carbon, and 20% poly(acrylic acid) binder by weight. The resulting SiOx electrode had SiOx loading of 1.51 ± 0.1 mg cm−2 and was punched into 1.27 cm2 discs (1/2 inch diameter). A single-side-coated LiNi0.8Co0.1Mn0.1O2 (NCM811) cathode, with an NCM811 loading of 10.8 mg cm−2, was also purchased from MSE Supplies LLC (Tucson, AZ, USA) and punched into 0.97 cm2 discs (7/16-inch diameter). Both the SiOx and NCM811 electrode discs were dried at 110 °C under vacuum overnight and then transferred to an argon-filled glove box. In the glove box, an electrolyte consisting of 1.0 m (molality) LiPF6 dissolved in a 1:2:7 (wt.) mixture of fluorinated ethylene carbonate, ethylene carbonate, and ethylmethyl carbonate was prepared. Using the electrodes described above and a piece of Celgard 2350 membrane as the separator, CR2032 Li/SiOx and SiOx/NCM811 coin cells were assembled and filled with a fixed amount (40 µL) of electrolyte. The negative-to-positive (N/P) capacity ratio in SiOx/NCM811 cells was controlled at 1.05 ± 0.01, based on specific capacities of 1500 mAh g−1 for SiOx and 200 mAh g−1 for NCM811. The cells were tested on a Maccor Series 4000 cycler (Maccor, Tulsa, OK, USA) using two expressions for C rates: * C and * C/** h. The * C represents constant-current charging or discharging with a voltage cutoff, while * C/** h indicates constant-current charging or discharging followed by a voltage hold until the total charge/discharge time reaches ** h. The detailed testing conditions are provided in the discussion or figure captions. The AC impedance of the SiOx/NCM811 coin cells before and after SEI formation was measured at 20 °C with a 10 mV perturbation in a frequency range from 100,000 Hz to 0.01 Hz, using SI 1260 Impedance/Gain-Phase Analyzer in combination with a Solartron SI 1287 Electrochemical Interface (AMETEK, Inc., Berwyn, PA, USA).

3. Results and Discussion

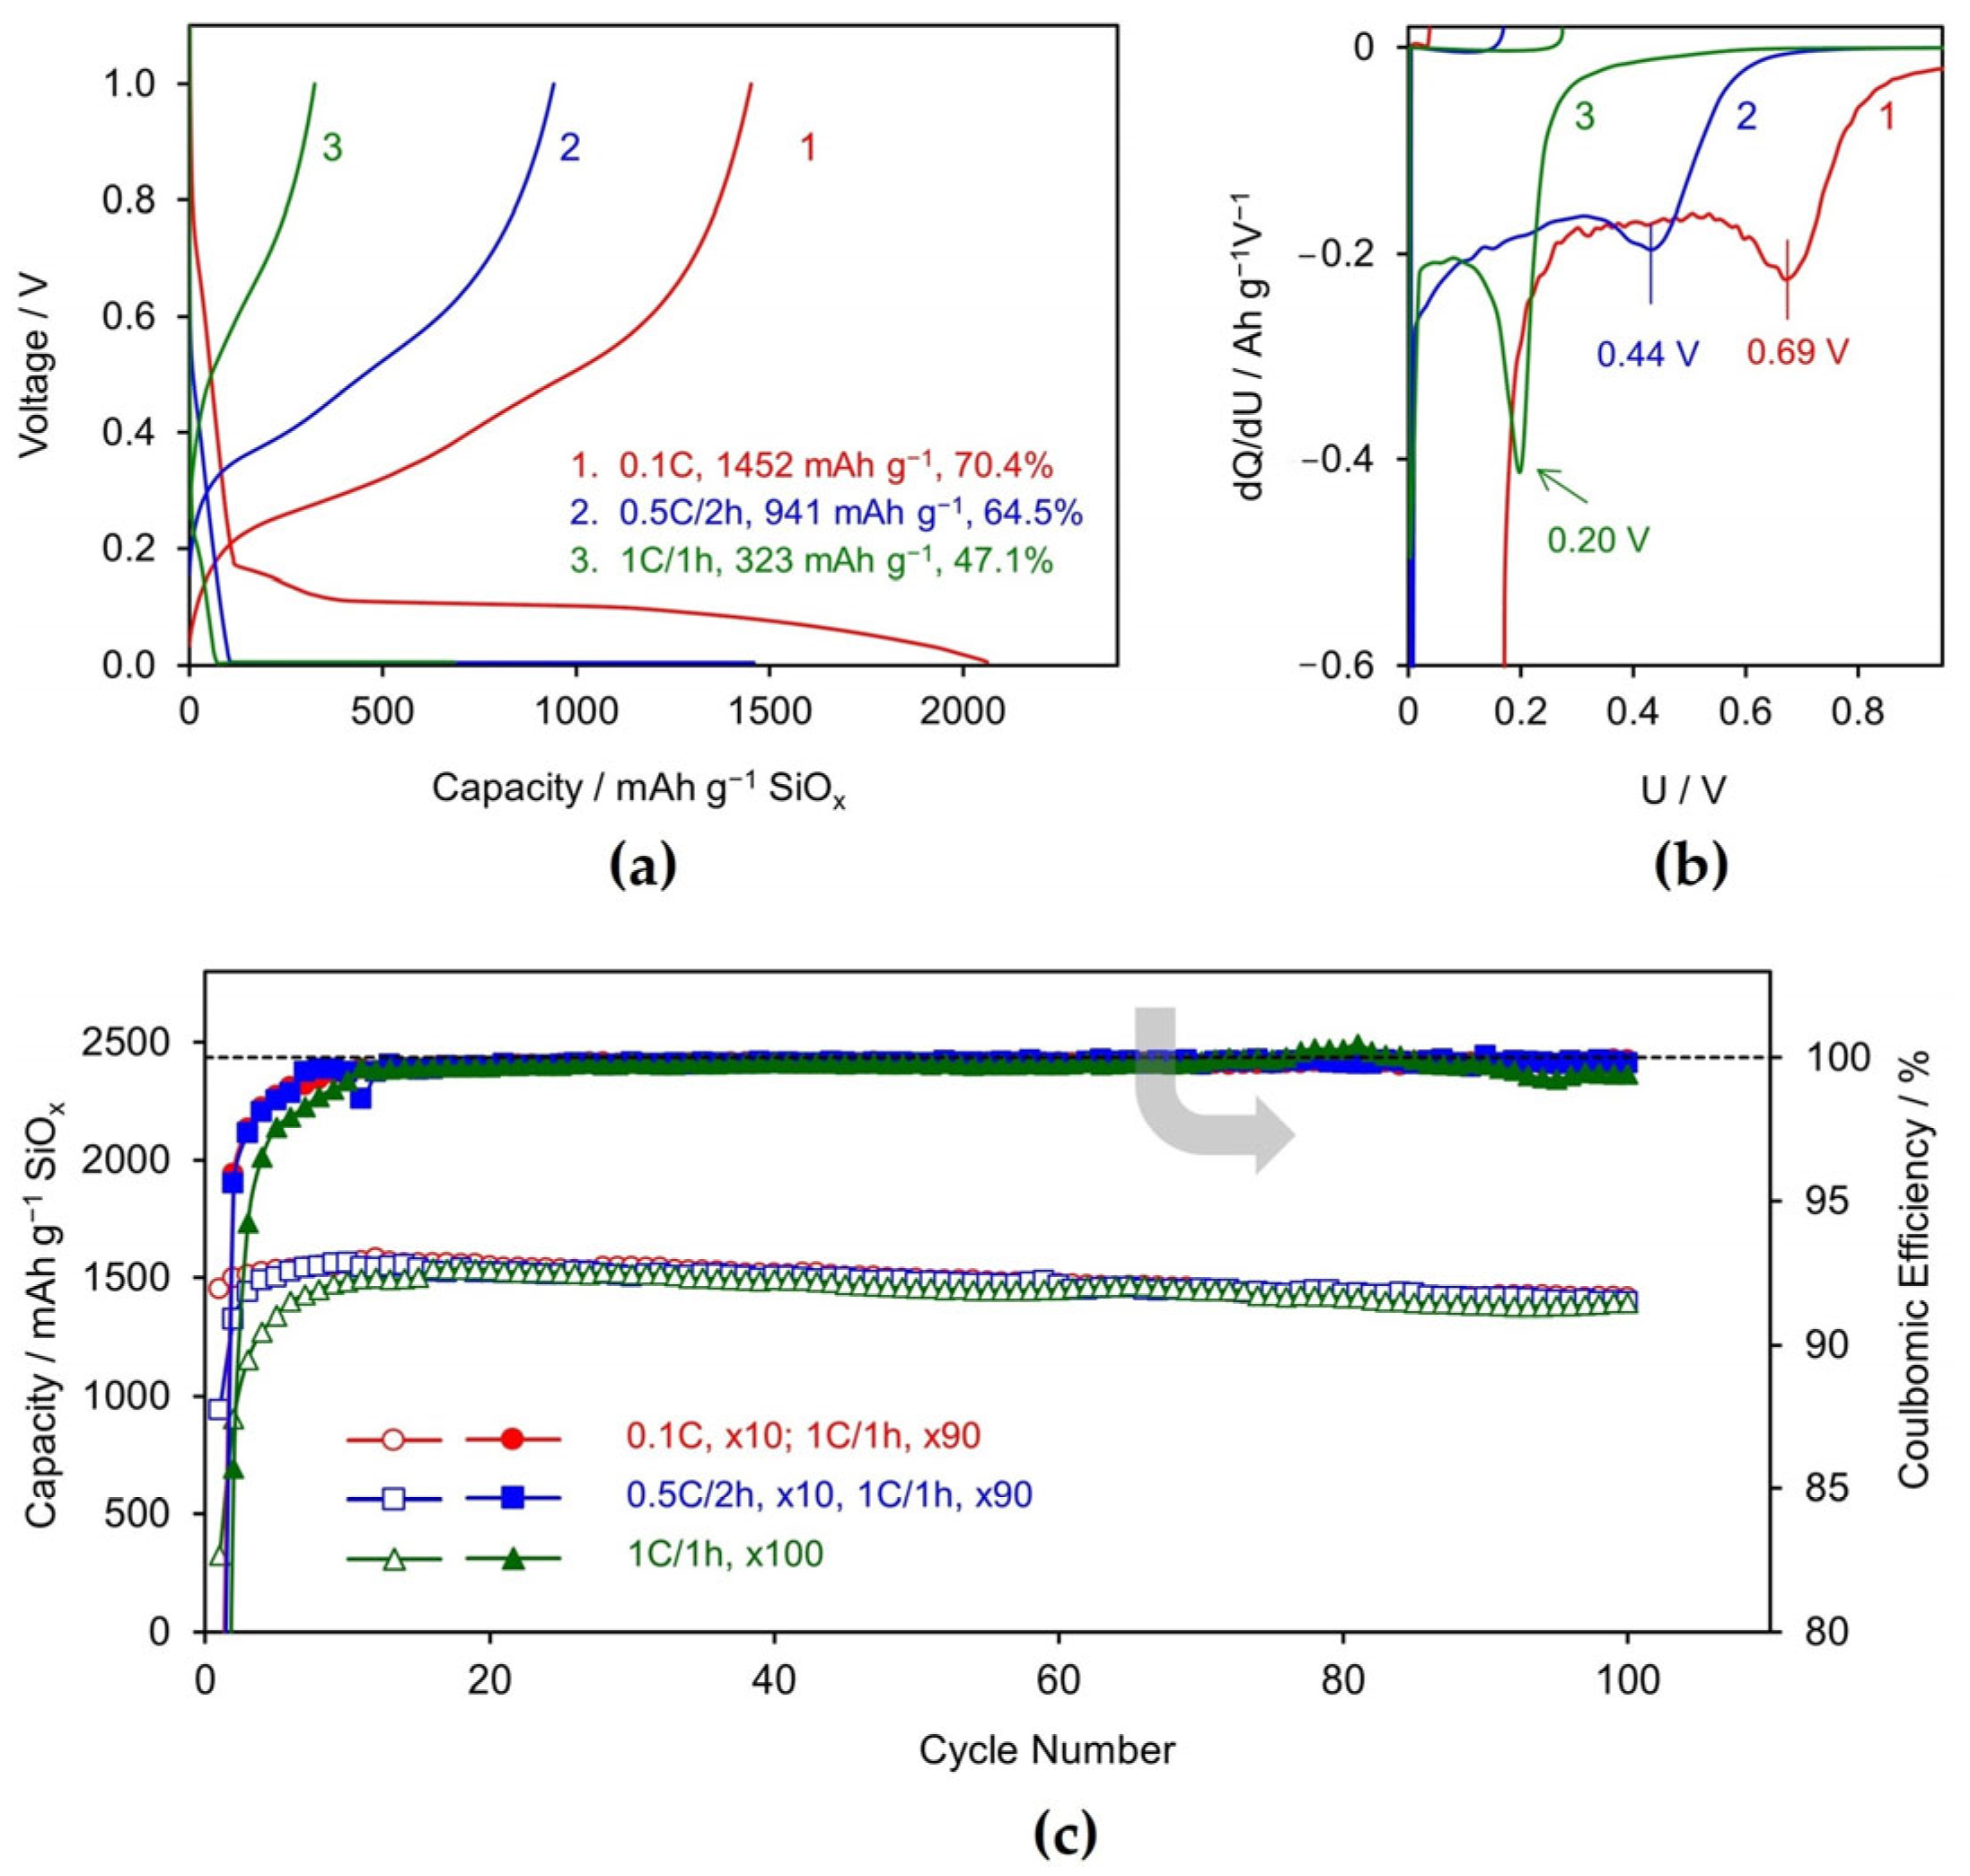
3.1. Li/SiOx Half-Cell

The effect of the formation current rate on cycling performance was first evaluated in Li/SiOx cells. The voltage profiles and differential capacity versus voltage plots for various current rates during the first cycle are shown in Figure 1a and Figure 1b, respectively. At a slow current rate (0.1C), the Li/SiOx cell exhibits a specific capacity of 1452 mAh g−1 with a coulombic efficiency (CE) of 70.4%. The low CE can be attributed to two factors: (1) the irreversible reduction of SiOx to Si accompanied by the formation of Li2SiO3 and the similar compounds, as representatively described by Equation (1), and (2) the irreversible reduction of electrolyte solvents, both contributing to the formation of the SEI on the surface of SiOx particles.
3SiOx + 2xLi+ + 2xe → (3 − x)Si + xLi2SiO3
In Equation (1), the resulting Si instantly forms Li–Si alloy through the electrochemical reduction of Li+ ions. As the current rate increases, both the specific capacity and CE decrease. For instance, when the lithiation process is conducted at 1C for 1 h (1C/1 h), the specific capacity drops to 323 mAh g−1 and the CE decreases to 47.1%, as noted in the inset of Figure 1a. This decline is attributed to electric polarization resulting from the increased current rate. As observed in Figure 1a, the cell’s voltage rapidly drops to the lithiation cutoff voltage (0.005 V), with most capacities achieved by the constant-voltage (CV) discharge step at 0.005 V. This effect is more clearly seen in the differential capacity plot (Figure 1b), where the differential capacity peak of the first reduction shifts from 0.69 V at 0.1C to 0.20 V at 1C due to significant polarization, leading to a substantial capacity reduction. It is worth noting that the large polarization at high current rates arises not only from the SiOx electrode but also from the Li counter electrode [23]. The observed decrease in CE with increasing lithiation current rate can be attributed to both the reductions of SiOx and the electrolyte solvents occurring at higher potentials than Li–Si alloying. Their contribution to the low CE becomes more pronounced at higher currents.
After 10 formation cycles at varying current rates, the cells were cycled using an identical current rate: constant current–constant voltage (CC–CV) lithiation at 1C for 1 h, followed by constant current (CC) delithiation at 1C. The cycling performances of the cells are compared in Figure 1c. The results indicate that the current rate during formation cycles has a minor effect on the capacity retention of Li/SiOx cells, although it significantly affects the specific capacity and CE during the initial several formation cycles. These findings reveal that the current rate in formation cycles has minimal impact on the cycling stability of Li/SiOx cells, differing significantly from observations in Li/graphite cells. This difference can be attributed to the distinct Li storage mechanisms between graphite and silicon. In graphite, Li+ ions intercalate between the graphene layers, during which graphite is reduced, becoming negatively charged to accommodate the positively charged Li+ ions. In contrast, in silicon, Li+ ions are first reduced to Li atoms on the surface of the silicon particles; the resulting Li atoms then react with silicon to form a Li–Si alloy. As the process continues, the Li–Si alloy layer gradually moves inward toward the core of the silicon particles. Therefore, the solvent cointercalation related reduction does not occur with the Si electrodes. In addition to the observations mentioned above, Figure 1c reveals that during the initial cycles, both the cells’ specific capacity and CE gradually increase until they reach a plateau. This behavior can be attributed to the slow conversion kinetics of SiOx to Si, preventing the full capacity of SiOx from being accessed within a single cycle.

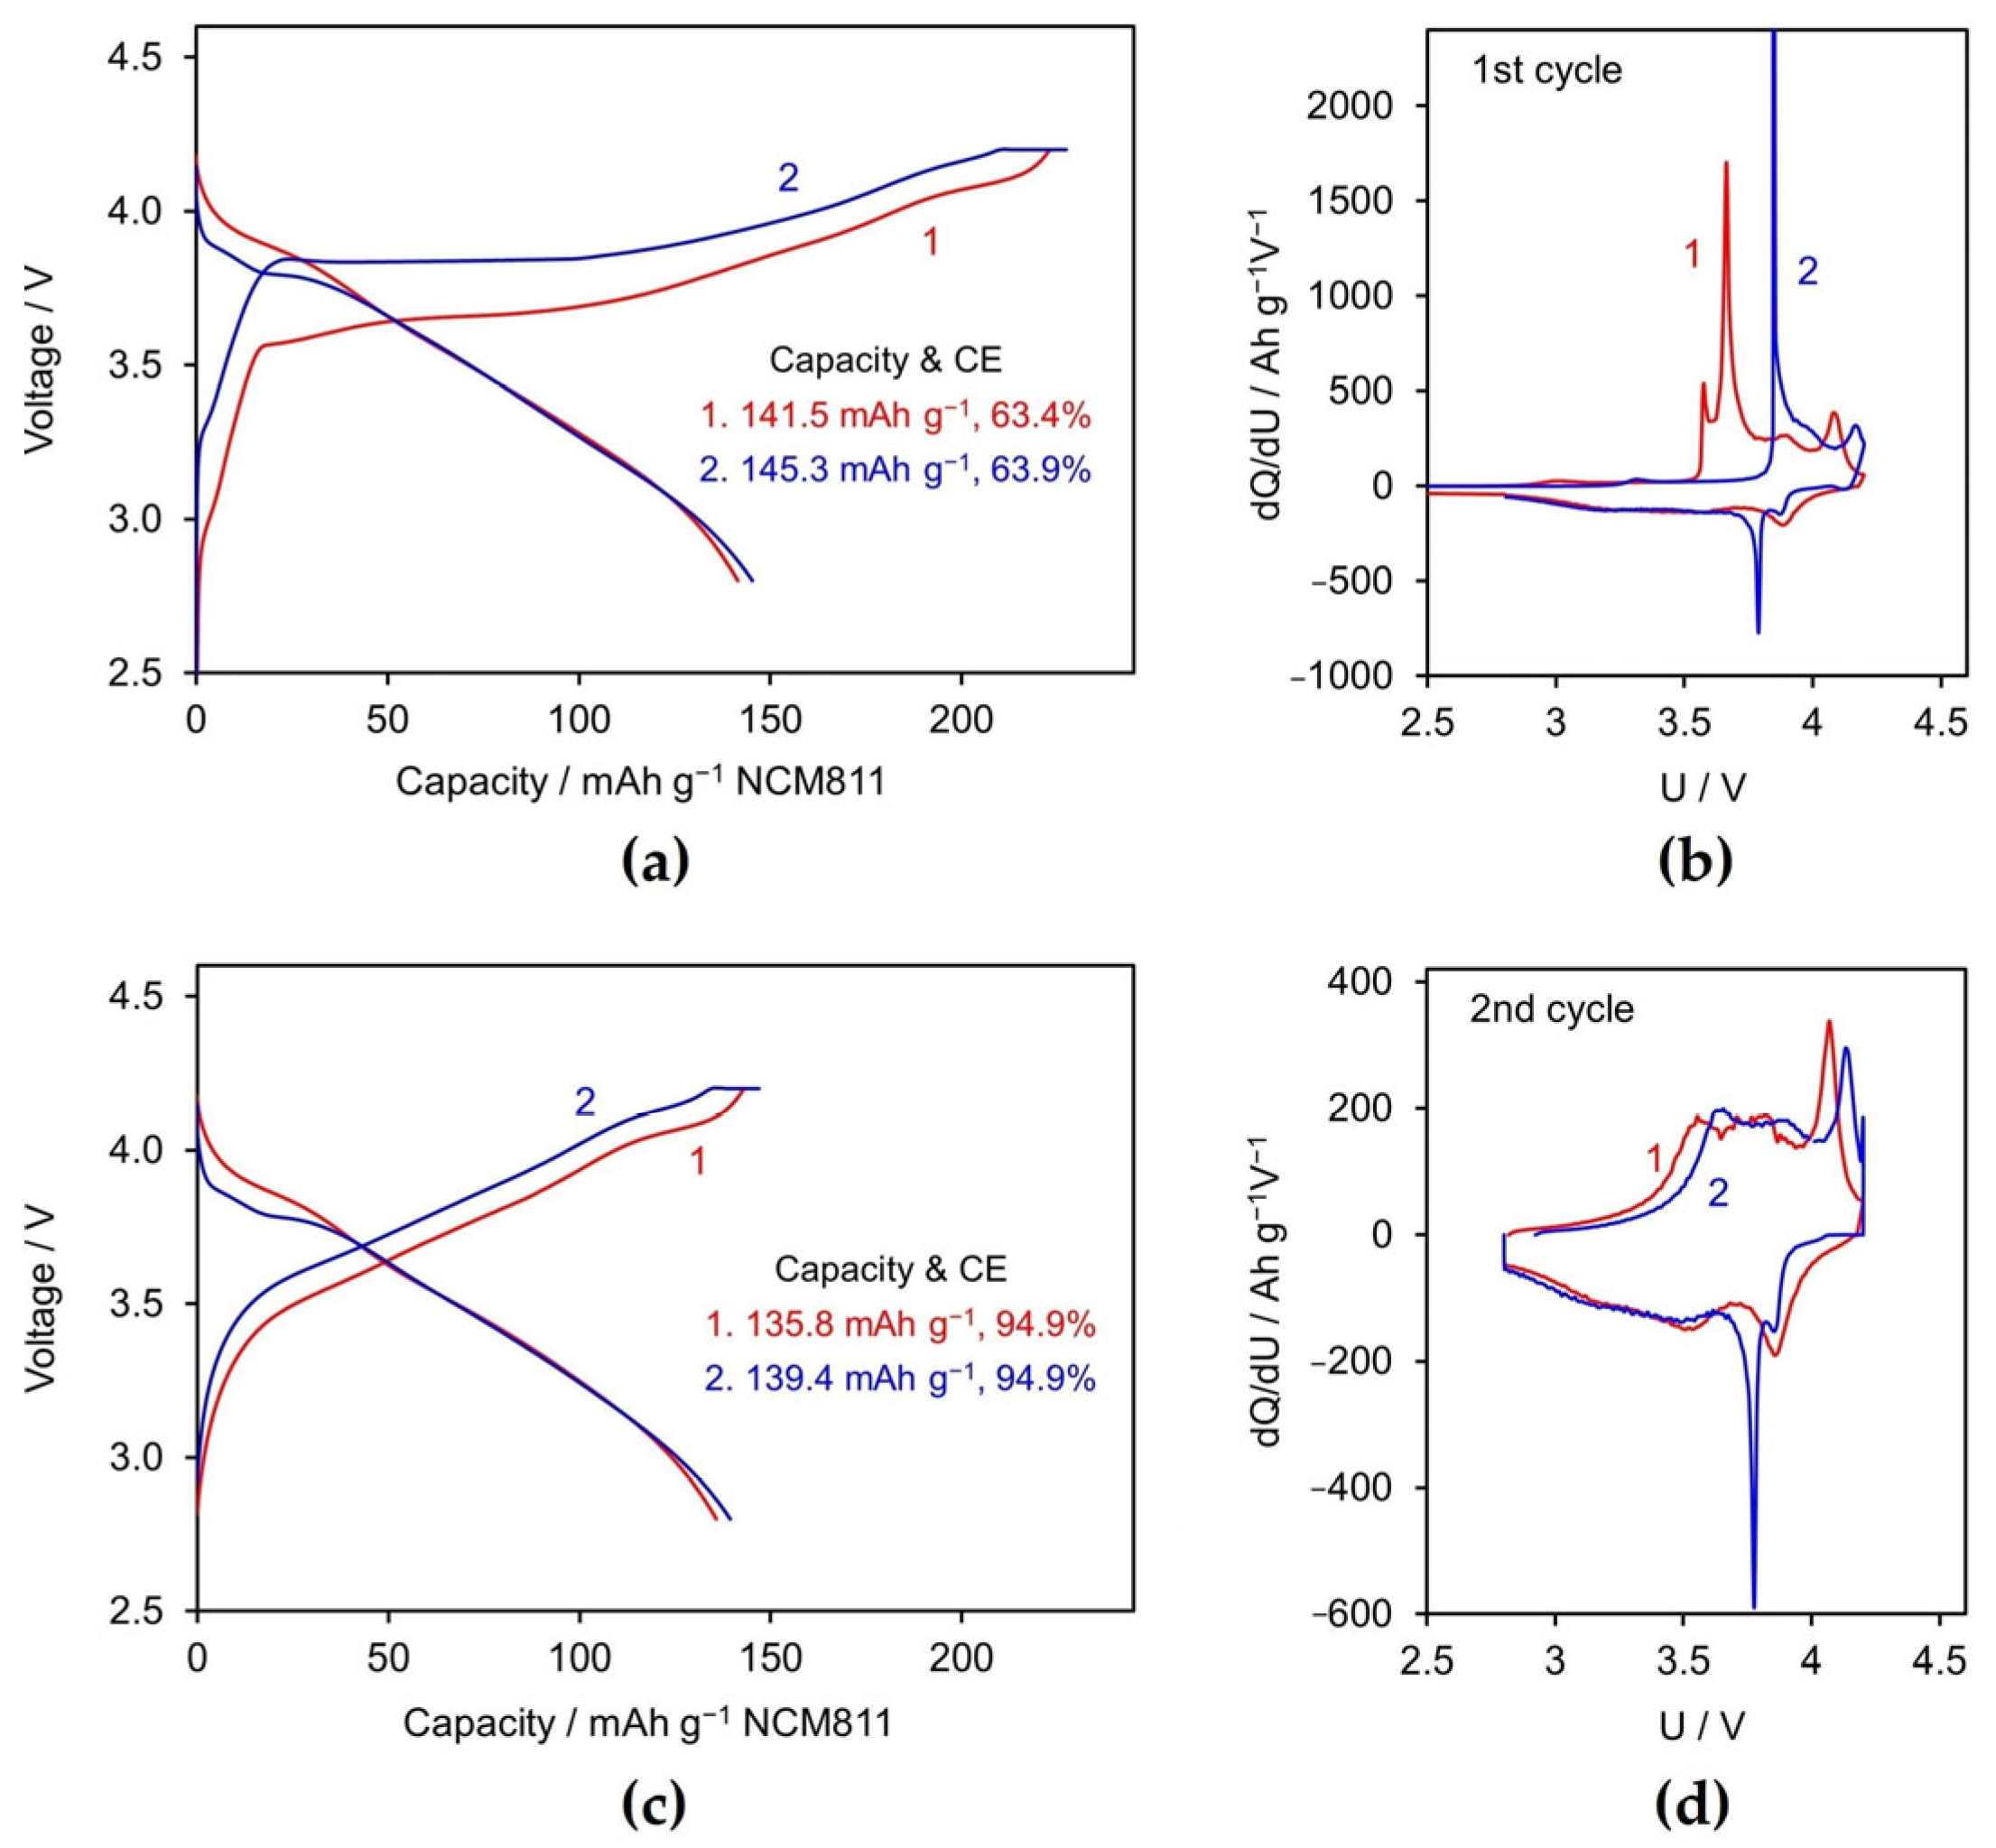
3.2. SiOx/NCM811 Full Cells

3.2.1. Formation Cycle

The effect of the formation current rate on cycling performance was further investigated in SiOx/NCM811 cells. Figure 2 compares the voltage profiles and differential capacity versus voltage plots of the first two cycles for SiOx/NCM811 cells formed by charging and discharging at 0.1C and charging at 1C for 1 h while discharging at 1C, respectively. Unlike the results observed from Li/SiOx half-cells, both cells exhibit nearly identical specific capacities and CE. The specific capacity slightly decreases from the first to the second cycle, while the CE increases significantly, as noted in the insets of Figure 2a,c. The primary difference between the two formation protocols is that the cell charged at 1C/1 h experiences higher polarization due to the high current applied. During discharge, however, this increased polarization is only evident in the high-voltage region, as shown in Figure 2a,c. Since the irreversible conversion of SiOx to Si in the first cycle consumes a large number of Li+ ions from the NCM811 cathode, both the specific capacity and CE of NCM811 of the SiOx/NCM811 cells in the first cycle are significantly lower than the normal values generally obtained in Li/NCM811 cells. As shown in the inset of Figure 2a, the SiOx/NCM811 cells exhibit a first-cycle specific capacity of only 141.5–145.3 mAh g−1 and a CE of 63.4–63.9%. Although the CE increases to 94.9% in the second cycle, its value is far below the threshold required for high-performance Li-ion batteries. The low initial CE and its gradual increase over subsequent cycles can be attributed to the slow and incomplete conversion of SiOx to Si during the early cycling stages. This slow conversion along with the initial low CE presents a significant challenge for the practical application of SiOx as an anode material in Li-ion batteries. Additionally, it should be noted that the 1C/1 h formation used in this work is only an example, demonstrating that a slow SEI formation process is not necessarily required. The practical formation rate may vary depending on cell design, for instance, an energy-focused vs. a power-focused design. As a rule of thumb, the formation rate can be the same as those used in normal cycling.
The impedances of two SiOx/NCM811 cells subjected to different formation protocols were measured before and after the formation process, and the results are compared in Figure 3. Before the formation process (i.e., the freshly assembled cells), the two cells had similar overall impedance. After two formation cycles, the cells ended at the discharged state, i.e., at 0% state of charge (SOC). At the discharged state, the cell formed using the 1C/1 h charge and 1C discharge protocol displayed significantly lower overall impedance than the cell formed using the 0.1C cycling protocol. Subsequently, the cells were charged to 100% SOC by charging at 0.5C to 4.2 V, followed by a voltage hold at 4.2 V for a total charge time of 2 h. At 100% SOC, the similar impedance difference between the two cells persisted. This discrepancy can be attributed to the fact that the cell formed under the 1C/1 h charge protocol had much lower SEI resistance (RSEI) than the cell formed under the 0.1C protocol, as indicated by the smaller semicircle in the high-frequency region of the Nyquist plot in Figure 3. Furthermore, a similar trend extended the charge-transfer resistance (Rct), represented by the second semicircle in the low-frequency region. The cell formed under the 1C/1 h protocol demonstrated substantially lower Rct, contributing to its overall lower impedance compared to the 0.1C formed cell. The above results suggest that the SEI formed under high current rates is more porous, facilitating greater electrolyte penetration and enhancing ionic conductivity.

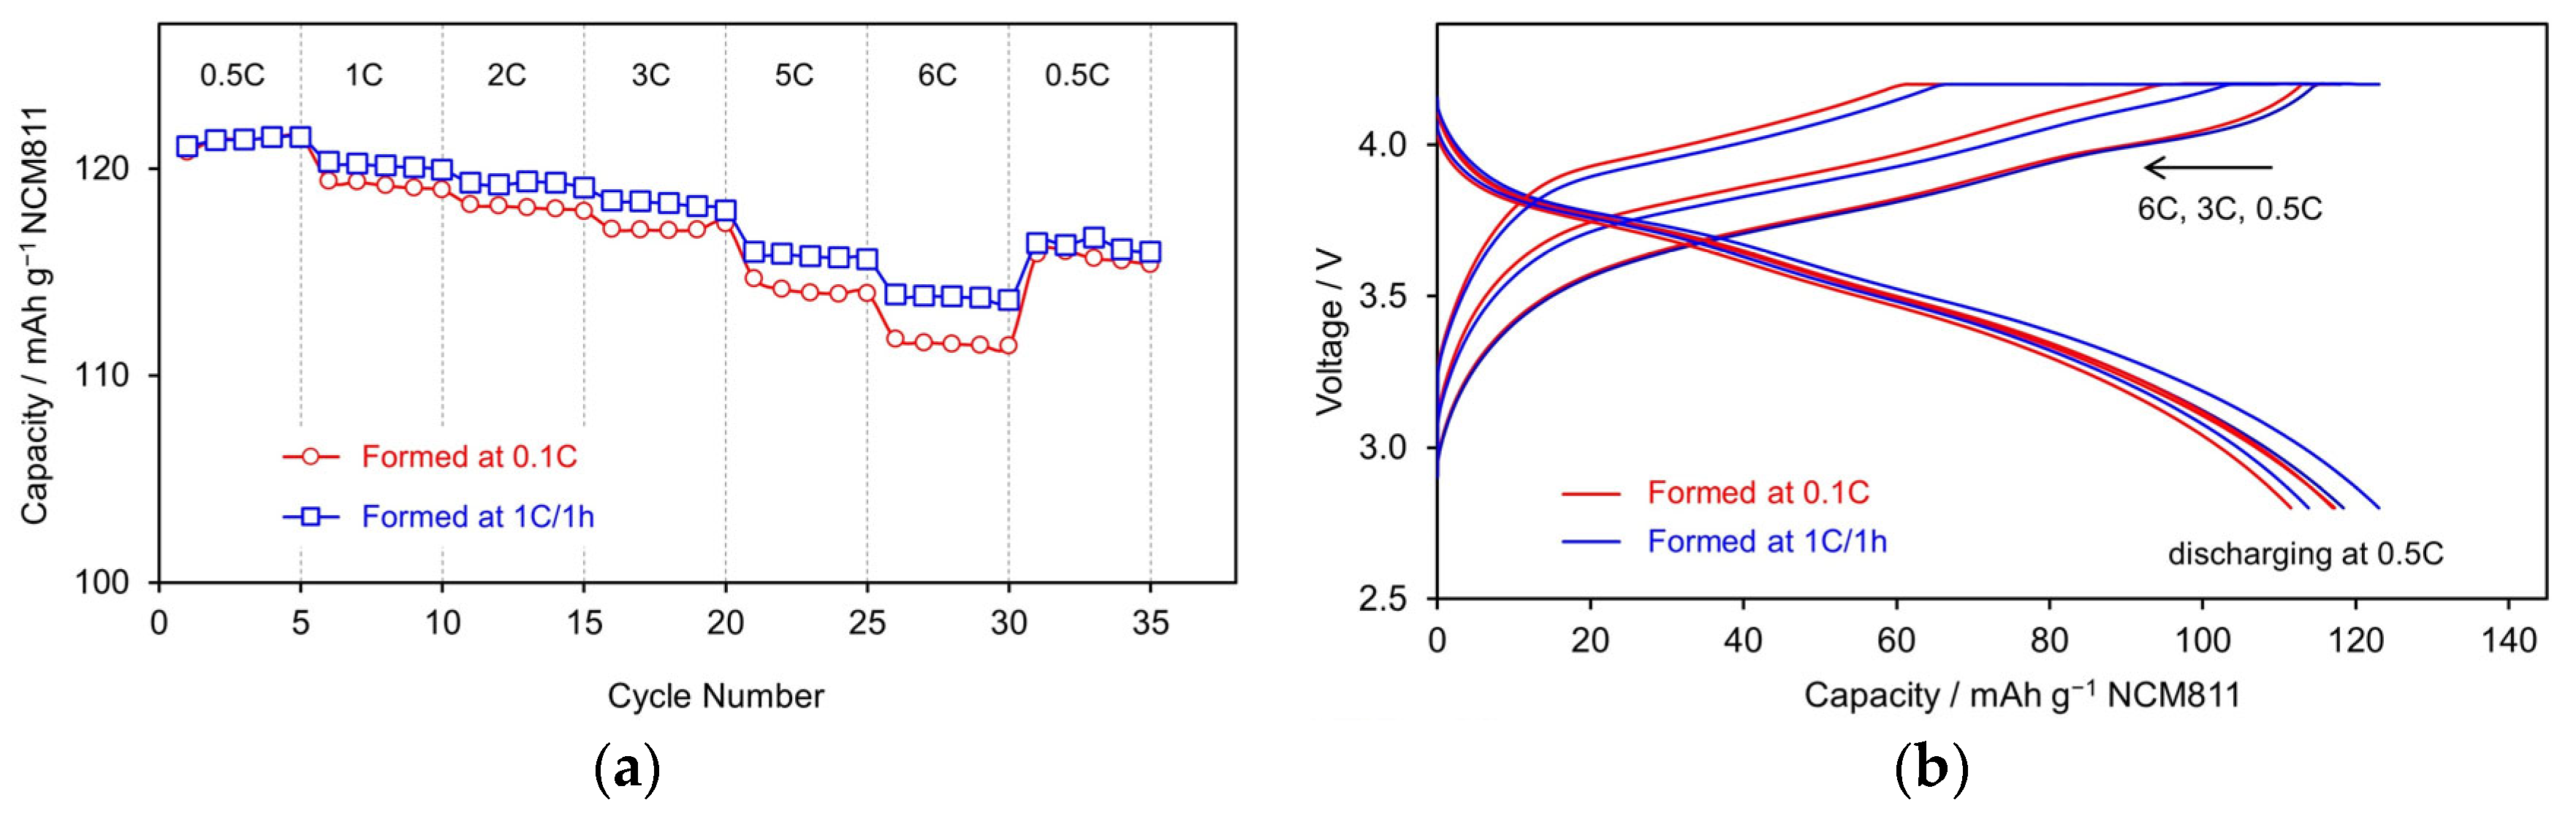
3.2.2. Rate Capability

After completing the impedance analysis, the cells underwent rate capability testing. Figure 4 compares the discharge rate capability of two cells. Both cells were charged at 0.5C to 4.2 V, followed by a voltage hold at 4.2 V for a total charge time of 2 h, and they were subsequently discharged at various current rates. As shown in Figure 4a, at low discharge rates (<3C), both cells formed using 0.1C and 1C/1 h formation protocols, respectively, exhibited similar specific capacities. However, at high discharge rates (5C and 6C), the cell formed using the 1C/1 h protocol displayed superior capacity. This trend aligns with the impedance results and is attributed to the lower overall impedance of the cell formed at the higher current rate. Figure 4b presents the voltage profiles of the two cells at representative discharge rates, illustrating that differences in both specific capacity and polarization become more pronounced as the discharge current increases.
Next, the charge rate capability of the cells was evaluated using a CC–CV charging protocol. The cells were charged at a specific rate to 4.2 V and then held at 4.2 V for a total time corresponding to the specific rate, followed by discharge at 0.5C to 2.8 V. The specific capacities of the cells are compared in Figure 5a, while their voltage profiles at representative charging current rates are shown in Figure 5b. Similar to the discharge rate capability results, the difference in specific capacity between the two cells becomes more pronounced as the charge current rate increases. The cell formed using the higher current rate (1C/1 h protocol) consistently outperforms the one formed at the lower current rate (0.1C). As illustrated in Figure 5b, the differences in charge capacity between the two cells at 3C and 6C primarily exist during the CC charging stage. Specifically, the cell formed using the 1C/1 h protocol exhibits a larger CC charge capacity compared to the cell formed at 0.1C, which correlates with its lower overall impedance.
Comparing Figure 4a and Figure 5a shows that, with an increase in the current rate, the charge rate capability significantly outperforms the discharge rate capability, with the former exhibiting much higher capacities than the latter. This discrepancy arises from differences in the testing protocols. For the charge rate capability, a CC–CV charging step was applied, whereas the discharge rate capability testing utilized only a CC discharging step. The results are expected to align if a CV discharging step, i.e., a voltage hold at 2.8 V for a certain duration, is incorporated into the latter.

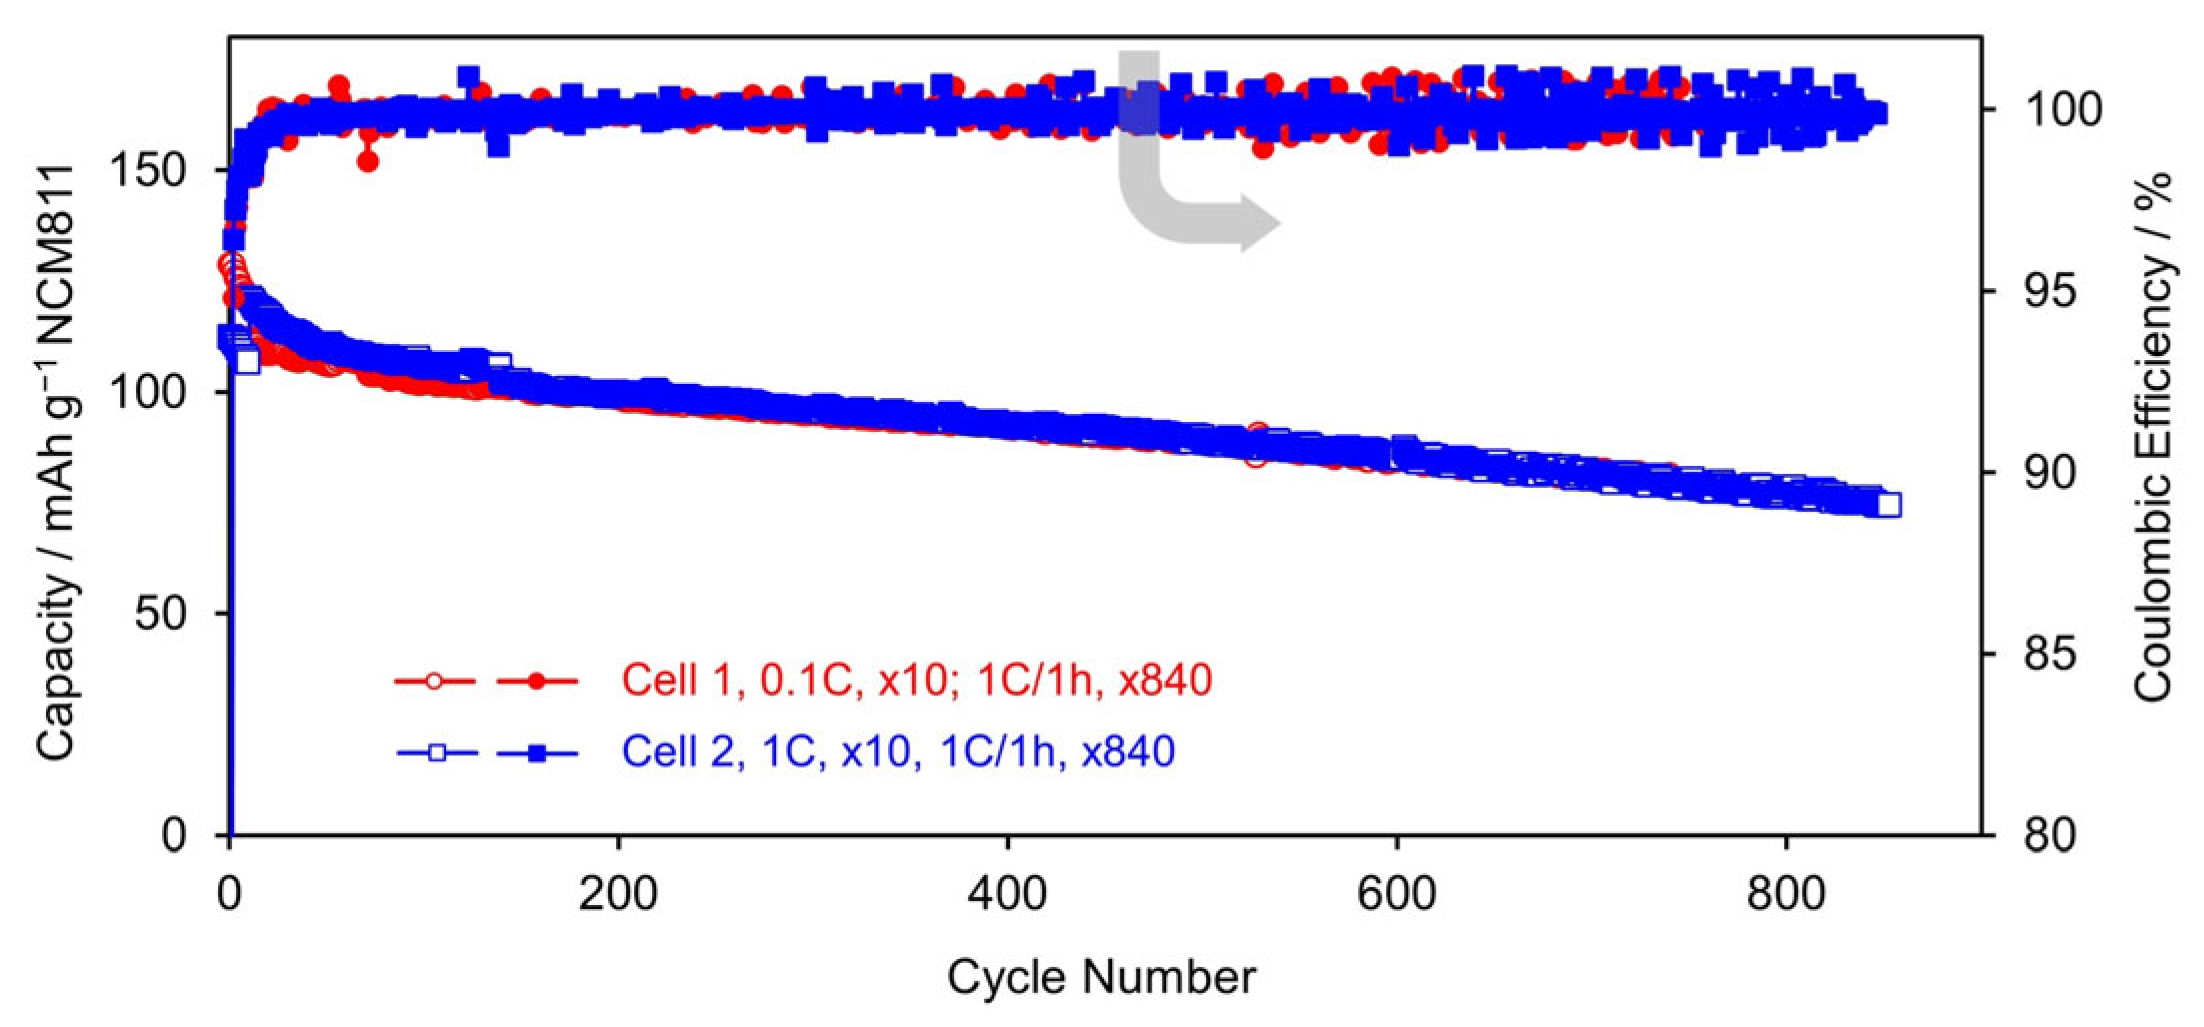
3.2.3. Cycling Stability

Another set of cells was tested for long-term cycling stability, as shown in Figure 6. In this experiment, Cell 1 underwent formation by cycling at 0.1C for 10 cycles, followed by a 1C/1 h charge and a 1C discharge. Cell 2 was formed at 1C for 10 cycles without a voltage hold at 4.2 V, followed by the same 1C/1 h charge and 1C discharge. As observed in Figure 6, during the initial 10 formation cycles, Cell 2 exhibited lower capacities than Cell 1 due to the absence of the CV charging step at 4.2 V, which limited full-capacity access. However, in the subsequent cycles, both cells demonstrated nearly identical specific capacities and capacity retention. This observation indicates that the formation current rate has minimal impact on the cycling performance, in terms of specific capacity and capacity retention, of the SiOx-based Li-ion cells. Therefore, the traditionally time-consuming formation process may not be necessary for manufacturing Si-based Li-ion batteries. Furthermore, the Li-ion cells formed at higher current rates exhibit lower overall impedance compared to those formed using the more time-intensive, low-current rate process.

4. Conclusions

In summary, we studied the effect of formation current rates on the cycling performance of Si-based Li-ion batteries, using carbon-coated SiOx as a representative silicon material. It is uncovered that, in both Li/SiOx and SiOx/NCM811 cells, the formation current rate has minimal impact on cycling performance, specifically regarding both the specific capacity and capacity retention of the Si electrodes. This behavior contrasts with that observed in traditional graphite-based Li-ion batteries and can be attributed to the different Li+ storage mechanisms between silicon and graphite. Silicon stores Li+ ions through Li–Si alloying, eliminating issues such as solvent cointercalation and associated reductions, which occurs with graphite. Moreover, SiOx/NCM811 cells formed at higher current rates exhibit lower overall impedance compared to those formed at lower current rates, enhancing their rate capabilities. The results of this work suggest that the traditionally time-consuming SEI formation process may not be necessary for the production of Si-based Li-ion batteries. This advantage, rooted in the fundamental differences between the Li+ storage mechanisms of silicon and graphite, could significantly reduce the manufacturing costs of these batteries.

Funding

DEVCOM Army Research Laboratory.

Data Availability Statement

The data presented in this study are available on request from the corresponding author.

Acknowledgments

The author acknowledges the support of the DEVCOM Army Research Laboratory.

Conflicts of Interest

The author declares no conflicts of interest.

References

  1. Wood, D.L.; Li, J.; An, S.J. Formation Challenges of Lithium-Ion Battery Manufacturing. Joule 2019, 3, 2884–2888. [Google Scholar] [CrossRef]
  2. Schomburg, F.; Heidrich, B.; Wennemar, S.; Drees, R.; Roth, T.; Kurrat, M.; Heimes, H.; Jossen, A.; Winter, M.; Cheong, J.Y.; et al. Lithium-ion battery cell formation: Status and future directions towards a knowledge-based process design. Energy Environ. Sci. 2024, 17, 2686–2733. [Google Scholar] [CrossRef]
  3. Oh, S.M.; Song, J.; Lee, S.; Jang, I.-C. Effect of current rate on the formation of the solid electrolyte interphase layer at the graphite anode in lithium-ion batteries. Electrochim. Acta 2021, 397, 139269. [Google Scholar] [CrossRef]
  4. Zhang, S.S.; Xu, K.; Jow, T.R. Optimization of the forming conditions of the solid-state interface in the Li-ion batteries. J. Power Sources 2004, 130, 281–285. [Google Scholar] [CrossRef]
  5. He, Y.; Wang, J.; Wang, L.; He, X. Thermodynamic Understanding of Formation and Evolution of Solid Electrolyte Interface in Li-Ion Batteries. Batter. Supercaps 2024, 7, e202400059. [Google Scholar] [CrossRef]
  6. Antonopoulos, B.K.; Stock, C.; Maglia, F.; Hoster, H.E. Solid electrolyte interphase: Can faster formation at lower potentials yield better performance? Electrochim. Acta 2018, 269, 331–339. [Google Scholar] [CrossRef]
  7. Zhang, S.S.; Xu, K.; Jow, T.R. EIS study on the formation of solid electrolyte interface in Li-ion battery. Electrochim. Acta 2006, 51, 1636–1640. [Google Scholar] [CrossRef]
  8. Chiang, P.-C.J.; Wu, M.-S.; Lin, J.-C. A Novel Dual-Current Formation Process for Advanced Lithium-Ion Batteries. Electrochem. Solid-State Lett. 2005, 8, A423. [Google Scholar] [CrossRef]
  9. Pathan, T.S.; Rashid, M.; Walker, M.; Widanage, W.D.; Kendrick, E. Active formation of Li-ion batteries and its effect on cycle life. J. Phys. Energy 2019, 1, 044003. [Google Scholar] [CrossRef]
  10. Li, Y.; Guo, J.; Pedersen, K.; Gurevich, L.; Stroe, D.-I. Investigation of multi-step fast charging protocol and aging mechanism for commercial NMC/graphite lithium-ion batteries. J. Energy Chem. 2023, 80, 237–246. [Google Scholar] [CrossRef]
  11. Ellis, L.D.; Allen, J.P.; Hill, I.G.; Dahn, J.R. High-Precision Coulometry Studies of the Impact of Temperature and Time on SEI Formation in Li-Ion Cells. J. Electrochem. Soc. 2018, 165, A1529. [Google Scholar] [CrossRef]
  12. Moretti, A.; Sharova, V.; Carvalho, D.V.; Boulineau, A.; Porcher, W.; de Meatza, I.; Passerini, S. A Comparison of Formation Methods for Graphite//LiFePO4 Cells. Batter. Supercaps 2019, 2, 240–247. [Google Scholar] [CrossRef]
  13. Yan, C.; Yao, Y.-X.; Cai, W.-L.; Xu, L.; Kaskel, S.; Park, H.S.; Huang, J.-Q. The influence of formation temperature on the solid electrolyte interphase of graphite in lithium ion batteries. J. Energy Chem. 2020, 49, 335–338. [Google Scholar] [CrossRef]
  14. Lee, H.-H.; Wang, Y.-Y.; Wan, C.-C.; Yang, M.-H.; Wu, H.-C.; Shieh, D.-T. A fast formation process for lithium batteries. J. Power Sources 2004, 134, 118–123. [Google Scholar] [CrossRef]
  15. An, S.J.; Li, J.; Du, Z.; Daniel, C.; Wood, D.L. Fast formation cycling for lithium ion batteries. J. Power Sources 2017, 342, 846–852. [Google Scholar] [CrossRef]
  16. Wang, F.-M.; Wang, H.-Y.; Yu, M.-H.; Hsiao, Y.-J.; Tsai, Y. Differential pulse effects of solid electrolyte interface formation for improving performance on high-power lithium ion battery. J. Power Sources 2011, 196, 10395–10400. [Google Scholar] [CrossRef]
  17. Wang, F.-M.; Wang, J.-C.; Rick, J. Forward and reverse differential-pulse effects applied in the formation of a solid electrolyte interface to enhance the performance of lithium batteries. Electrochim. Acta 2014, 147, 582–588. [Google Scholar] [CrossRef]
  18. Arreaga-Salas, D.E.; Sra, A.K.; Roodenko, K.; Chabal, Y.J.; Hinkle, C.L. Progression of Solid Electrolyte Interphase Formation on Hydrogenated Amorphous Silicon Anodes for Lithium-Ion Batteries. J. Phys. Chem. C 2012, 116, 9072–9077. [Google Scholar] [CrossRef]
  19. Horowitz, Y.; Ben-Barak, I.; Schneier, D.; Goor-Dar, M.; Kasnatscheew, J.; Meister, P.; Grünebaum, M.; Wiemhöfer, H.-D.; Winter, M.; Golodnitsky, D.; et al. Study of the Formation of a Solid Electrolyte Interphase (SEI) on a Silicon Nanowire Anode in Liquid Disiloxane Electrolyte with Nitrile End Groups for Lithium-Ion Batteries. Batter. Supercaps 2019, 2, 213–222. [Google Scholar] [CrossRef]
  20. Kim, J.; Chae, O.B.; Lucht, B.L. Perspective—Structure and Stability of the Solid Electrolyte Interphase on Silicon Anodes of Lithium-ion Batteries. J. Electrochem. Soc. 2021, 168, 030521. [Google Scholar] [CrossRef]
  21. Yang, G.; Frisco, S.; Tao, R.; Philip, N.; Bennett, T.H.; Stetson, C.; Zhang, J.-G.; Han, S.-D.; Teeter, G.; Harvey, S.P.; et al. Robust Solid/Electrolyte Interphase (SEI) Formation on Si Anodes Using Glyme-Based Electrolytes. ACS Energy Lett. 2021, 6, 1684–1693. [Google Scholar] [CrossRef]
  22. Chen, B.; Xu, D.; Chai, S.; Chang, Z.; Pan, A. Enhanced Silicon Anodes with Robust SEI Formation Enabled by Functional Conductive Binder. Adv. Funct. Mater. 2024, 34, 2401794. [Google Scholar] [CrossRef]
  23. Zhang, S.S. Is Li/Graphite Half-Cell Suitable for Evaluating Lithiation Rate Capability of Graphite Electrode? J. Electrochem. Soc. 2020, 167, 100510. [Google Scholar] [CrossRef]
Figure 1. Performance comparison of Li/SiOx half-cells formed at varying formation currents. (a) Voltage profile of the first cycle, (b) differential capacity vs. voltage plot for the first cycle, and (c) cycling performance, where from the 11th cycle, all cells were cycled under identical conditions with lithiation at 1C for 1 h and delithiation at 1C, cycling between 0.005 V and 1.0 V. The grey arrow indicates that these lines correspond to the right vertical axis.
Batteries 11 00122 g001
Figure 2. Voltage profile and differential capacity vs. voltage plot of SiOx/NCM811 cells formed at varying currents, where Cell 1 was formed at 0.1C and Cell 2 at 1C for 1 h. (a,b) First cycle and (c,d) second cycle.
Batteries 11 00122 g002
Figure 3. Nyquist plot of SiOx/NCM811 cells at various SOCs after two formation cycles at different formation conditions.
Batteries 11 00122 g003
Figure 4. Discharge capability of SiOx/NCM811 cells formed at different current rates. The cells were charged using a CC–CV protocol at 0.5C to 4.2 V, followed by a voltage hold at 4.2 V for a total charge time of 2 h, and then discharged at various rates. (a) Specific capacity and (b) voltage profile.
Batteries 11 00122 g004
Figure 5. Charge capability of SiOx/NCM811 cells formed at different current rates. The cells were CC-charged at a specific current rate to 4.2 V, followed by a voltage hold at 4.2 V until the designated time was reached, and then galvanostatically discharged at 0.5C to 2.8 V. (a) Specific capacity and (b) voltage profile.
Batteries 11 00122 g005
Figure 6. Cycling stability of SiOx/NCM811 cells cycled at 1C between 2.8 V and 4.2 V, of which Cell 1 was formed at 0.1C for 10 cycles and Cell 2 was formed at 1C without a CV charging step for 10 cycles. The grey arrow indicates that these lines correspond to the right vertical axis.
Batteries 11 00122 g006
Disclaimer/Publisher’s Note: The statements, opinions and data contained in all publications are solely those of the individual author(s) and contributor(s) and not of MDPI and/or the editor(s). MDPI and/or the editor(s) disclaim responsibility for any injury to people or property resulting from any ideas, methods, instructions or products referred to in the content.

