Abstract
Doping lithium cobalt oxide (LiCoO2) cathode materials is an effective strategy for mitigating the detrimental phase transitions that occur at high voltages. A deep understanding of the relationships between cycle capacity and the design elements of doped LiCoO2 is critical for overcoming the existing research limitations. The key lies in constructing a robust and interpretable mapping model between data and performance. In this study, we analyze the correlations between the features and cycle capacity of 158 different element-doped LiCoO2 systems by using five advanced machine learning algorithms. First, we conducted a feature election to reduce model overfitting through a combined approach of mechanistic analysis and Pearson correlation analysis. Second, the experimental results revealed that RF and XGBoost are the two best-performing models for data fitting. Specifically, the RF and XGBoost models have the highest fitting performance for IC and EC prediction, with R2 values of 0.8882 and 0.8318, respectively. Experiments focusing on ion electronegativity design verified the effectiveness of the optimal combined model. We demonstrate the benefits of machine learning models in uncovering the core elements of complex doped LiCoO2 formulation design. Furthermore, these combined models can be employed to search for materials with superior electrochemical performance and processing conditions. In the future, we aim to develop more accurate and efficient machine learning algorithms to explore the microscopic mechanisms affecting doped layered oxide cathode material design, thereby establishing new paradigms for the research of high-performance cathode materials for lithium batteries.
1. Introduction
Lithium cobalt oxide (LCO) with a layered structure is one of the most widely used cathode materials in commercial lithium-ion batteries [1,2,3]. It boasts a high energy density with a theoretical specific capacity reaching up to 274 mAh g−1 [4]. However, the commercial LCO cathode suffers from Co dissolution [5], O release [6], and irreversible and detrimental phase transitions [7,8] at high charging cutoff voltages, which result in severe capacity degradation and safety issues. The doping of foreign elements is an effective approach to improve the cycling performance of LCO at high voltages [9]. For example, our previous study demonstrates that the co-doping schemes of Ba and Ga or Ru and Al enable LCO to perform better at voltages beyond 4.50 V vs. Li+/Li via modifying the lattice and electronic structures [10]. Moreover, Zhang et al. reported that LCO with ternary doping of Ti, Mg, and Al stably cycled at 4.60 V vs. Li+/Li with a reversible capacity of 174 mAh g−1 [11]. Unfortunately, the experimental exploration of doping recipes through a trial-and-error approach is time-consuming and costly. Another approach based on first-principle calculation is subject to high computing cost and low accuracy because the structure–performance relationships of materials are complex and difficult to solute. The lack of research and development (R&D) approaches with high efficiency limits the development of advanced LCO technologies for lithium-ion batteries with high energy densities and safety.
Recently, machine learning (ML) has been widely applied in the field of materials science [12,13,14,15] because of its powerful ability to solve complex problems with high dimensions. ML methods have demonstrated their effectiveness in the understanding of structure–performance relationships, optimizing the composition design and preparation, as well as saving both time and costs [16,17,18]. For example, Gerbrand Ceder et al. applied data mining techniques in existing computational data to predict the crystal structure of new alloys [19]. Compared to traditional prediction methods, their models were three times faster for initial crystal structure prediction. The selection or development of suitable algorithms is the key to the success of ML-based materials R&D [20]. Jalem et al. [21] combined Artificial Neural Networks (ANN) and Partial Least Squares (PLS) algorithms with the Density Functional Theory (DFT) to predict the energy barriers of Li+ diffusion in an olivine-type LiMXO4 and identified 15 promising solid electrolytes for lithium batteries. Kwang-Leong Choy et al. [22] compared the accuracy of six machine-learning regression algorithms in the study of correlations between doped elemental features and the resultant discharge capacity for NCM, which is another representative layer-structured cathode material for lithium batteries. Although this work verified the potential of ML methods in accurately capturing the structure–performance relationships in doped oxide cathode materials with layered structures, the scalability and transferability of ML-based models have yet to be validated experimentally.
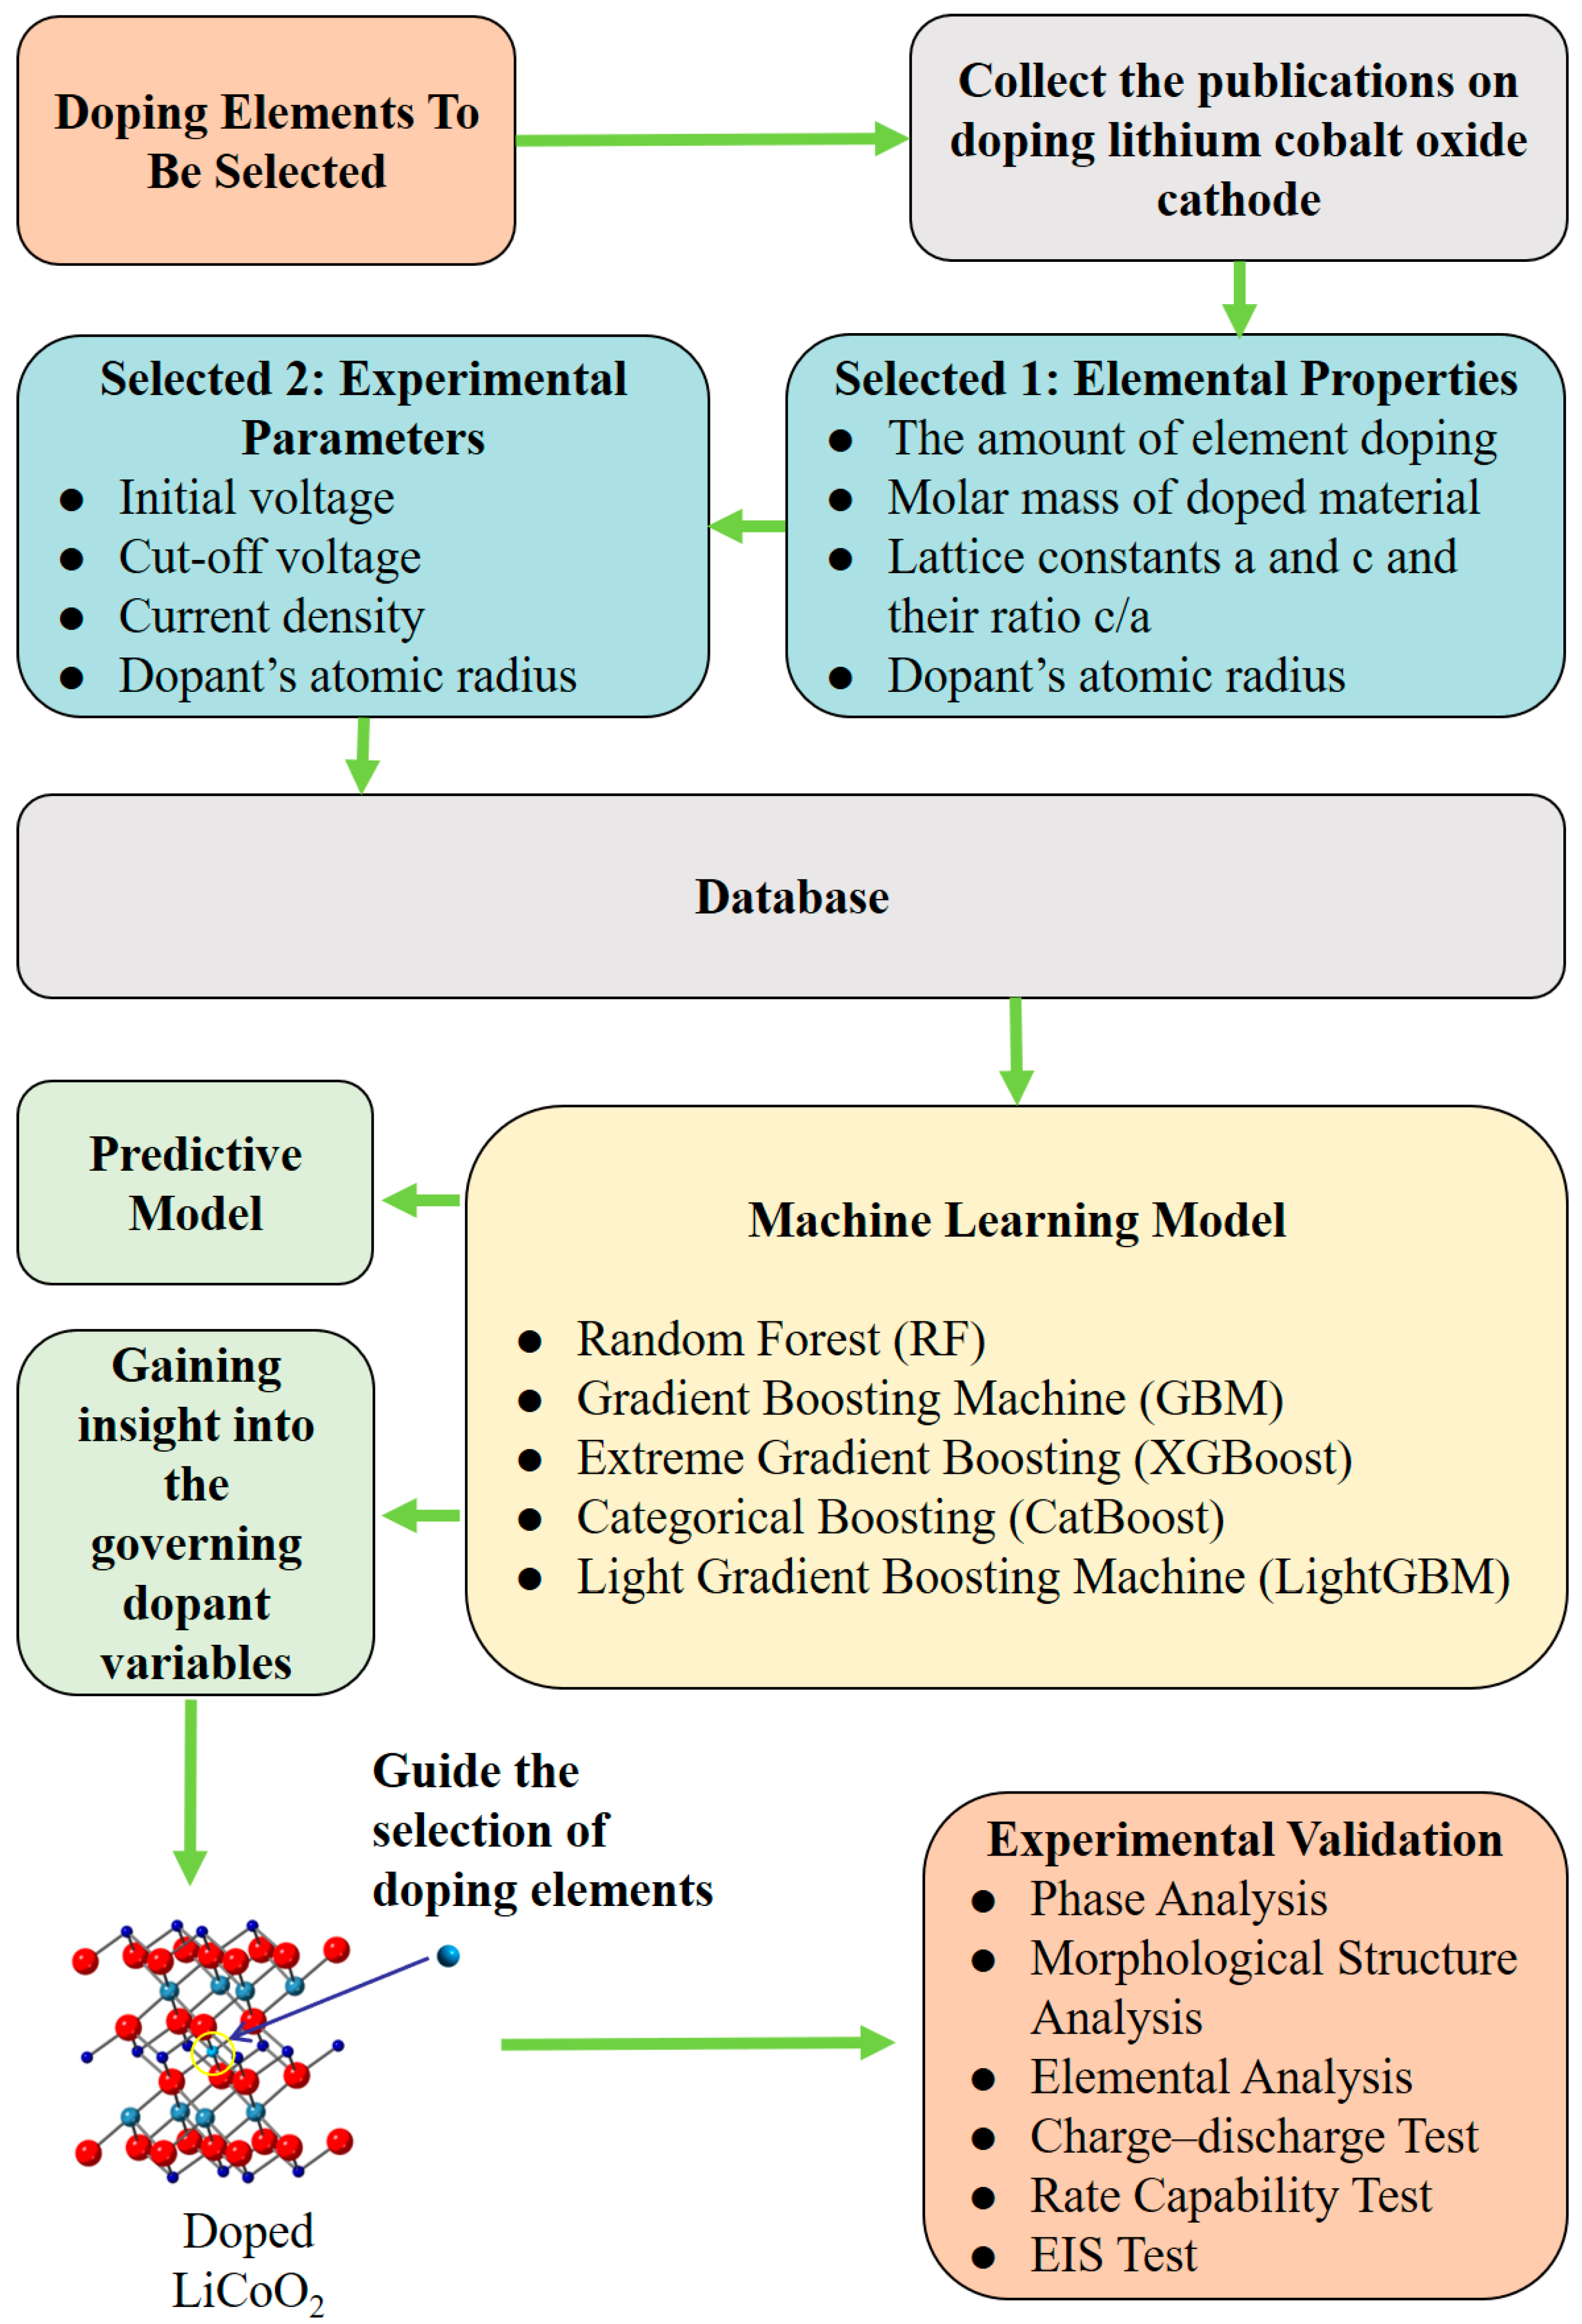
Herein, we explored ML approaches for modeling the correlations of the features of doped elements with the discharge capacities of LCO at the 1st and 25th cycles and experimentally validated the presented ML-based models. The flow chart of this work is shown in Figure 1. The dataset was collected from the previously published literature according to the selection rules described in the Section 2, containing 112 distinctive doped LCO systems with 23 different doped elements. First, the collinearity between various features and discharge capacities was assessed using the Pearson coefficient to guide the necessary dimensionality reduction on the features since the collected dataset is small. A total of nine features (e.g., electrochemical testing conditions, elemental characters of dopants, and componential and structural parameters of doped LCO) out of sixteen covariate variables were involved in the design of ML-based modeling (Table 1), while the response variables include the 1st discharge capacity (1DC) and 25th discharge capacity (25DC) of the doped LCO. Second, five different non-linear ML algorithms were employed for the modeling. A hyper-parameter search before training and data augmentation methods during training were conducted for each model to achieve optimal performance. The best root mean square errors (RMSE) for the prediction of 1DC and 25DC were 7.98 mAh/g and 13.49 mAh/g, respectively, representing the best-reported values so far. Third, the feature contributions of the ML-based prediction models were analyzed to mine the intrinsic logical relationships between the covariate variables and response variables from an algorithmic perspective. Two key features (ionic radius and ion electronegativity) that dominate the prediction accuracy were identified. Finally, and importantly, the validity of the presented ML-based models was experimentally demonstrated by the synthesis and characterization of La– or Bi–doped LCO.
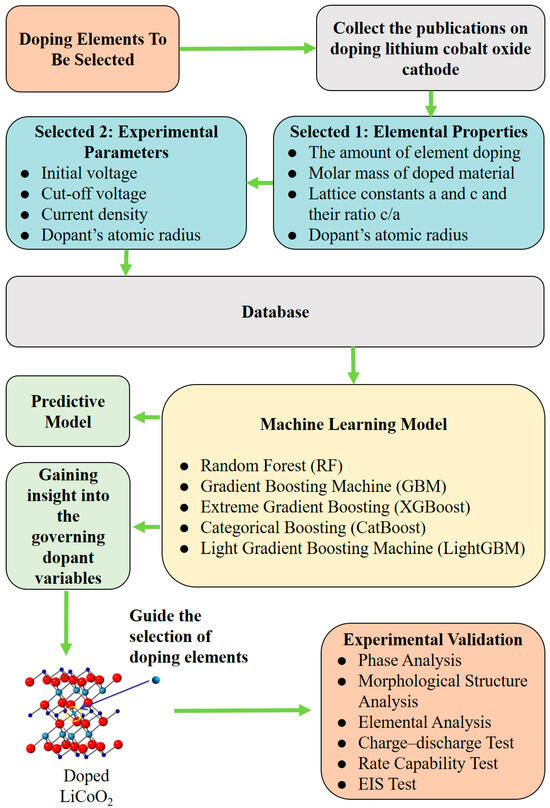
Figure 1.
The flow chart of this research.

Table 1.
Participants in nine covariate variables and two response variables of modeling design based on ML.
2. Methods
2.1. Data Collection and Features Selection
As mentioned above, this study opted for a literature-based approach to collect reliable experimental data, thereby constructing a dataset to support the training and validation of ML-based models. We only considered the literature reporting LCO single-doped with cations due to the few reported LCO systems with multiple doping and rare candidates of anionic doping. To ensure that the collected data follows high consistency, the electrochemical tests of LCO should meet the following criteria: (1) at least 30 cycles of charge–discharge cycling tests must be conducted; (2) the charging and discharging rate should be constant; (3) cycling tests are carried out at 25 ± 5 °C; (4) the anode and electrolyte of the tested cells are similar. The dataset is collected from 13 papers published in prestigious journals (Table S1), consisting of 112 distinctive doped LCO systems with 23 dopants (including Pb, Mg, Zr, Al, B, Ba, Bi, Ca, Cr, Cu, Eu, Fe, Ga, In, Mn, Ni, Ru, Sb, Sn, Sr, Ti, Y, and Zn).
Initially, the dataset involved 18 features, including sixteen covariate variables and two response variables (Table S2). For ML-based modeling, the “curse of dimensionality” arises when the features are abundant while training samples are sparse. To address this issue, we computed Pearson correlation coefficients between each covariate variable and response variable, assessing their linear correlation (Figure 2 and Figure S1, Table S3). Nine covariate variables, including the amount of element doping (M), molar mass of doped material (Mr), lattice constants a and c (LC_a, LC_c), initial voltage (V_min), cut-off voltage (V_max), current density (CD), dopant’s ionic radius (IR_dopant), dopant’s ionic electronegativity (EN_ionic_dopant), and two response variables (1DC and 25DC) were selected based on their strong correlations and logical reasoning, satisfying the empirical requirement in ML-based modeling that the volume of training data should be at least ten times the number of model parameters. After dimensionality reduction, the prediction accuracy of 1DC and 25DC was improved significantly (Table 1 and Table S4).
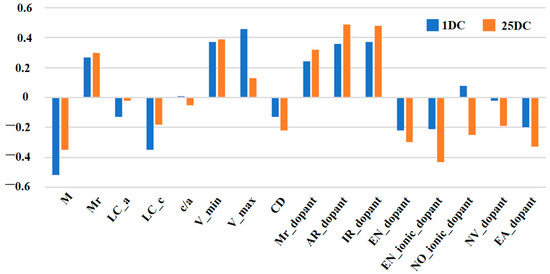
Figure 2.
Results histogram of Pearson coefficient correlations for every pair of variables in the data set.
2.2. ML-Based Modeling
The ML-based models were built and optimized using scikit-learn, CatBoost, and XGBoost libraries in Python 3.9.5 programming (https://www.python.org/) [23,24,25,26,27]. The training and test ratio of the dataset is 8:2. Specifically, the training set is selected by conditional sampling, covering all the doped elements collected, along with the experimental data corresponding to the minimum and maximum doping amounts for a specific doped element. Five ensemble-based machine learning algorithms, i.e., Random Forest (RF), Gradient Boosting Machine (GBM), XGBoost, CatBoost, and LightGBM, were employed to predict the discharge capacities at the 1st and 25th cycles, utilizing the selected nine features.
To thoroughly assess the prediction performance of ML-based models, we use mean squared error (MSE), root mean squared error (RMSE), mean absolute error (MAE), and goodness-of-fit (R2) as evaluation metrics on the test set. These are defined as follows:
where is the number of samples, is the observable variable, is the predicted value, and is the mean of the observable variables.
2.3. Analysis of Feature Importance and Design of Validation Experiment
The importance of the statistical ranking of each feature in the ML-based models was generated by SHAP Python package [28]. SHAP (Shapley Additive exPlanations) plots not only allow for the observation of the correlations between each feature and the capacity but reflect the importance level of different features. By analyzing the SHAP plots for the presented models exhibiting superior performance, key features with high importance are identified.
After ionic radius and ion electronegativity were classified as the top two key features, the validation experiment was designed by applying a variable-controlled method. La and Bi, which possess similar large ionic radiuses and notably different ion electronegativities, were chosen as the dopants in LCO since it is generally believed that the ionic radius of doped elements would affect the discharge capacity of LCO, but the effects of their ion electronegativity were rarely discussed in the previous literature. LCO with the doping of Bi (Bi–LCO) or La (La–LCO) were synthesized and characterized, to verify the effectiveness of the ML-based models.
2.4. Synthesis and Characterizations
Pristine LCO (PLCO) was prepared via a solid-state reaction of Li2CO3 and Co3O4 with a molar ratio of n(Li):n(Co) = 1.05:1.00. Then, 5 mol% excess Li was introduced to compensate for the Li loss. Analogously, Li2CO3, Co3O4, and Bi2O3 or La2O3 were selected as the dopant sources for the preparation of Bi–doped LCO (Bi–LCO) and La–doped LCO (La–LCO) with a molar ratio of n(Li):n(Co):n(Bi or La) = 1.050:0.999:0.001. The powders of the starting materials were mixed with absolute ethanol and zirconia balls in a mill tank. After ball milling for 5 h, the resultant solid powders were washed with absolute ethanol and then placed in an oven to dry overnight at 80 °C. The dried powders were calcined at 750 °C (ramp rate is 5 °C/min) in air for 8 h in a muffle furnace and further ground in an agate mortar for 0.5 h after cooling to room temperature. Next, the powders were further sintered at 1000 °C in air for 12 h. Finally, the sintered powders were ground evenly before material characterization and an electrochemical test [9]. The crystal structures, morphologies, chemical compositions, and surface chemistry were investigated using X-ray diffraction (XRD), scanning electron microscopy (SEM), energy-dispersive X-ray spectroscopy (EDS), and X-ray photoelectron spectroscopy (XPS), respectively.
To test the electrochemical performance of as-prepared LCO samples, CR2032 coin cells were assembled in a positive electrode/separator and liquid electrolyte/Li foil configuration. First, 80 wt% of the as-prepared LCO powders were mixed well with 10 wt% Super P and 10 wt% PVDF in NMP solvent. Second, the mixture was cast on an aluminum current collector using a drawknife and rolled using a roll squeezer. The mass loading of the LCO is 1.41~2.83 mg∙cm−2. Third, the rolled electrodes were punched into disks with a diameter of 12 mm. Finally, the positive electrodes were dried in a vacuum at 110 °C for 10 h and then stored in an argon-filled glove box (content of H2O, O2 < 1 ppm) at room temperature before use. The thickness of the casted cathode layer on Al foil is about 0.2 μm, which is determined by a screw micrometer. The tests of cyclabilities, rate capabilities, cyclic voltammetry (CV) profiles, and electrochemical impedance spectra were carried out using a LANHE battery test system (CT2001A), CHI660E electrochemical workstation, and Princeton Versa STAT 3F. All the electrochemical tests were conducted at room temperature (~25 °C).
The powders of Li2CO3 (≥99.99 wt.%), Co3O4 (≥99.99 wt.%), Bi2O3 (≥99.99 wt.%), and La2O3 (≥99.99 wt.%) were purchased from Aladdin. Ethanol (99.7%) was purchased from KeLong. Super P, polyvinylidene fluoride (PVDF), and N-methyl-2-pyrrollidone (NMP) were purchased from KeJing. The Al foil (KeJing, Hefei, China), thickness of 0.18 mm), Li foil (MingRuiXiang, Shenzhen, China, diameter of 15 mm, thickness of 0.6 mm), liquid electrolyte (LB-111, 1M LiPF6 in the mixed solvent of EC and DMC (v:v = 1:1) with high voltage additives), and separator (Celgard 2325, KeJing, Hefei, China) used in the test cells were purchased from DoDoChem and KeJing [9]. All the chemicals and materials were used as received.
3. Results and Discussion
3.1. Performance of ML-Based Models
Five different ML algorithms were applied for model training and testing. We used data augmentation methods to optimize ML-based models iteratively. Table 2 shows the performance of five models in predicting 1DC and 25DC in terms of RMSE and R2. For 1DC prediction, the LightGBM model performed the worst while the RF model performed the best. RF can handle high-dimensional feature spaces effectively by randomly selecting subsets of features for each tree, thus reducing the risk of overfitting. Meanwhile, RF is less prone to overfitting noisy or unbalanced datasets. It builds multiple decision trees and aggregates their predictions, reducing the impact of outliers and noise in the data, ultimately showing better results than LightGBM. Most of the models have R2 values larger than 0.7, which surpasses the benchmark value of R2 > 0.6 for a model to be considered predictive [23]. In the previous Pearson correlation analysis, the correlations between the features of the doped element and 1DC are relatively weak (Figure 2). In turn, the desired values of R2 and RMSE indicate that the selected nine features have deep correlations with discharge capacity, which is difficult to expose via traditional analyzing methods, such as a Pearson correlation analysis. The models’ performance slightly declined for the 25DC prediction. For example, all RMSEs were higher than 10 mAh/g. It should be attributed to the complex chemical changes of LCO that occurred during the charge–discharge cycles, which weakened the relationships between the selected nine features and the discharge capacity. However, the RMSEs of 25DC prediction are still less than 10% of the measure discharge capacity involved in the dataset, which suggests the usefulness of the presented models. Among the applied five ML algorithms, XGBoost had the best performance on 25DC prediction. The combination of the RF-based model for 1DC prediction and the XGBoost-based model for 25DC prediction could provide the best performance.
Table 2.
Comparison of the 5 ML-based models for the prediction of 1DC and 25DC. The evaluation metrics are R2 and RMSE.
It is worth noting that the performance of the presented ML-based models for discharge capacity prediction reaches a cutting-edge level in this field, benefiting from our optimization of applied ML algorithms via data augmentation methods. Based on extensive ML algorithms, we have gained a comprehensive understanding of the manufacturing and formation processes of materials. To optimize algorithms for capacity prediction based on data types, it is crucial to begin with feature selection using correlation matrices and SHAP values. Appropriate algorithm selection, hyperparameter tuning via grid search, and implementing cross-validation are key steps to prevent overfitting.
3.2. Analysis of Feature Importance
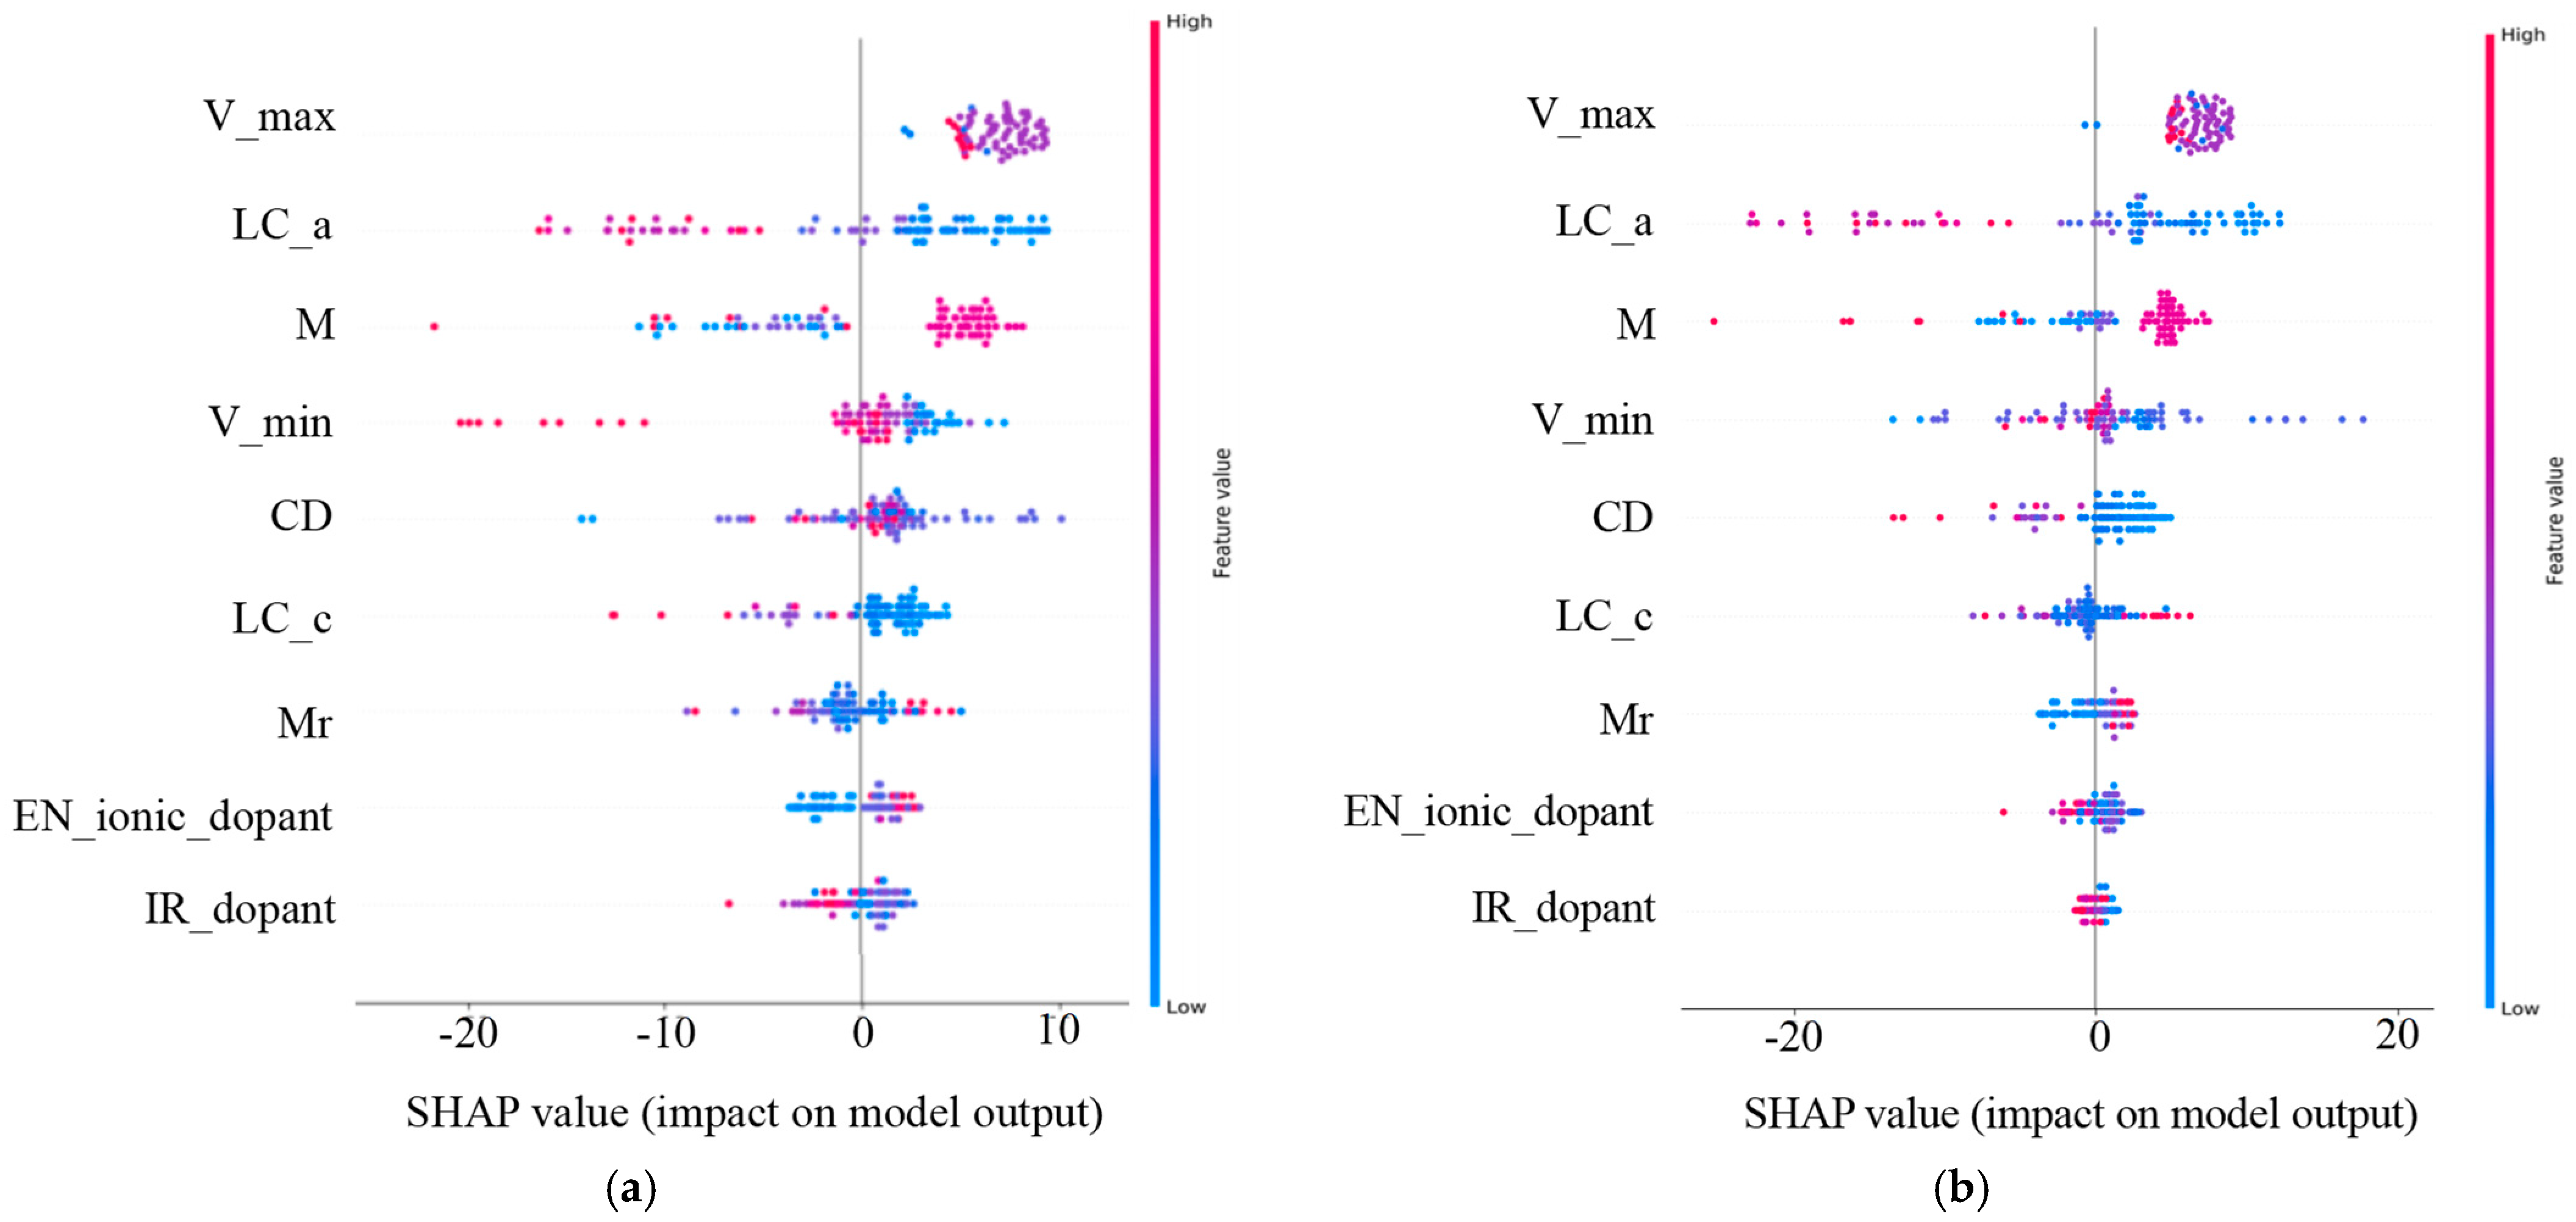
The contributions of each feature for the prediction performance of the ML-based models are various and can be classified by SHAP values [29]. The significance of SHAP values lies in their representation of the contribution each feature makes to the model’s prediction accuracy. It not only reflects the role each data point plays in the model’s decision-making but also indicates the varying importance of the features. Figure 3a,b shows the SHAP plots for the RF–1DC and XGBoost–25DC models. Each dot represents a data point, with greater absolute values denoting a greater impact. The y-axis ranks the features, with those having a greater overall influence appearing higher, thus playing a more critical role in the model’s decision-making.
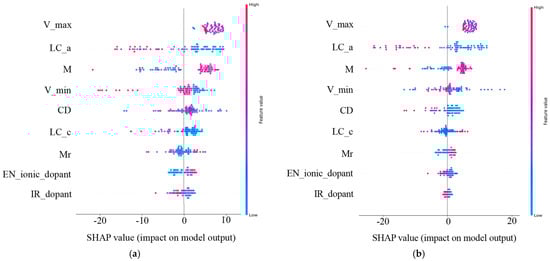
Figure 3.
The feature importance plots of the selected nine features of the doped elements. We used the best-performing RF model for 1DC (a) and the best-performing XGBoost model for 25DC (b) predictions on the test set. The order of the y-axis labels indicates the importance of varied features. The x-axis shows the SHAP values, reflecting their contributions to the prediction model.
Upon observing the SHAP plots for the RF–1DC and XGBoost–25DC models (Figure 3a), we found that the order of impact of the nine selected features predicted by the above two optimal models on battery capacities is basically similar to the results derived from the Pearson correlation analysis. While the Pearson correlation provides a quick summary of linear relationships between features and the target variable, SHAP values offer a more detailed and nuanced understanding of how each feature contributes to model predictions, accommodating both linear and non-linear relationships. In addition, charging cut-off voltage (V_max), dopant concentration (Mr), ionic radius of the doped elements (IR_dopant), and electronegativity of the doped elements (EN_ionic_dopant) are ranked at the forefront, indicating that these features contribute more to the accurate prediction of discharge capacity comparing with other features. Among these top-ranked predicting features, V_max and Mr are the two covariate variables’ own strong positive correlations with cycling performance. By contrast, these top-ranked features positively influence prediction performance, as SHAP value analysis and correlation analysis corroborate each other, validating the use of correlation matrices for key parameter selection.
Among them, the charging cut-off voltage is a setting parameter of cycling tests, and it is apparent that the higher charging cut-off voltage would lead to a high discharge capacity, especially at the early stage of cycling tests. Dopant concentration, a controlled parameter of LCO synthesis, seems negatively correlated with the discharge capacities; it is consistent with the common understanding that the higher dopant concentration would result in the lower structure stability of LCO because of the Jahn–Teller effect [30] or the formation of the secondary phase. After excluding the parameters that are not the intrinsic features of doped elements, the SHAP plots reveal that the doped elements with a large ionic radius and low ionic electronegativity are conducive to high-capacity retention at high voltages. It has been widely reported that the doped elements with large ionic radii could enhance the discharge capacity of LCO due to the so-called Pillar effect [31,32,33]. Our previous study demonstrated that the doped element with low electronegativity could lead to an enhanced Li+ diffusivity in the LCO lattice, which may benefit the capacity retention of cycled LCO10. This is consistent with the previous literature [34].
3.3. Experimentally Validation
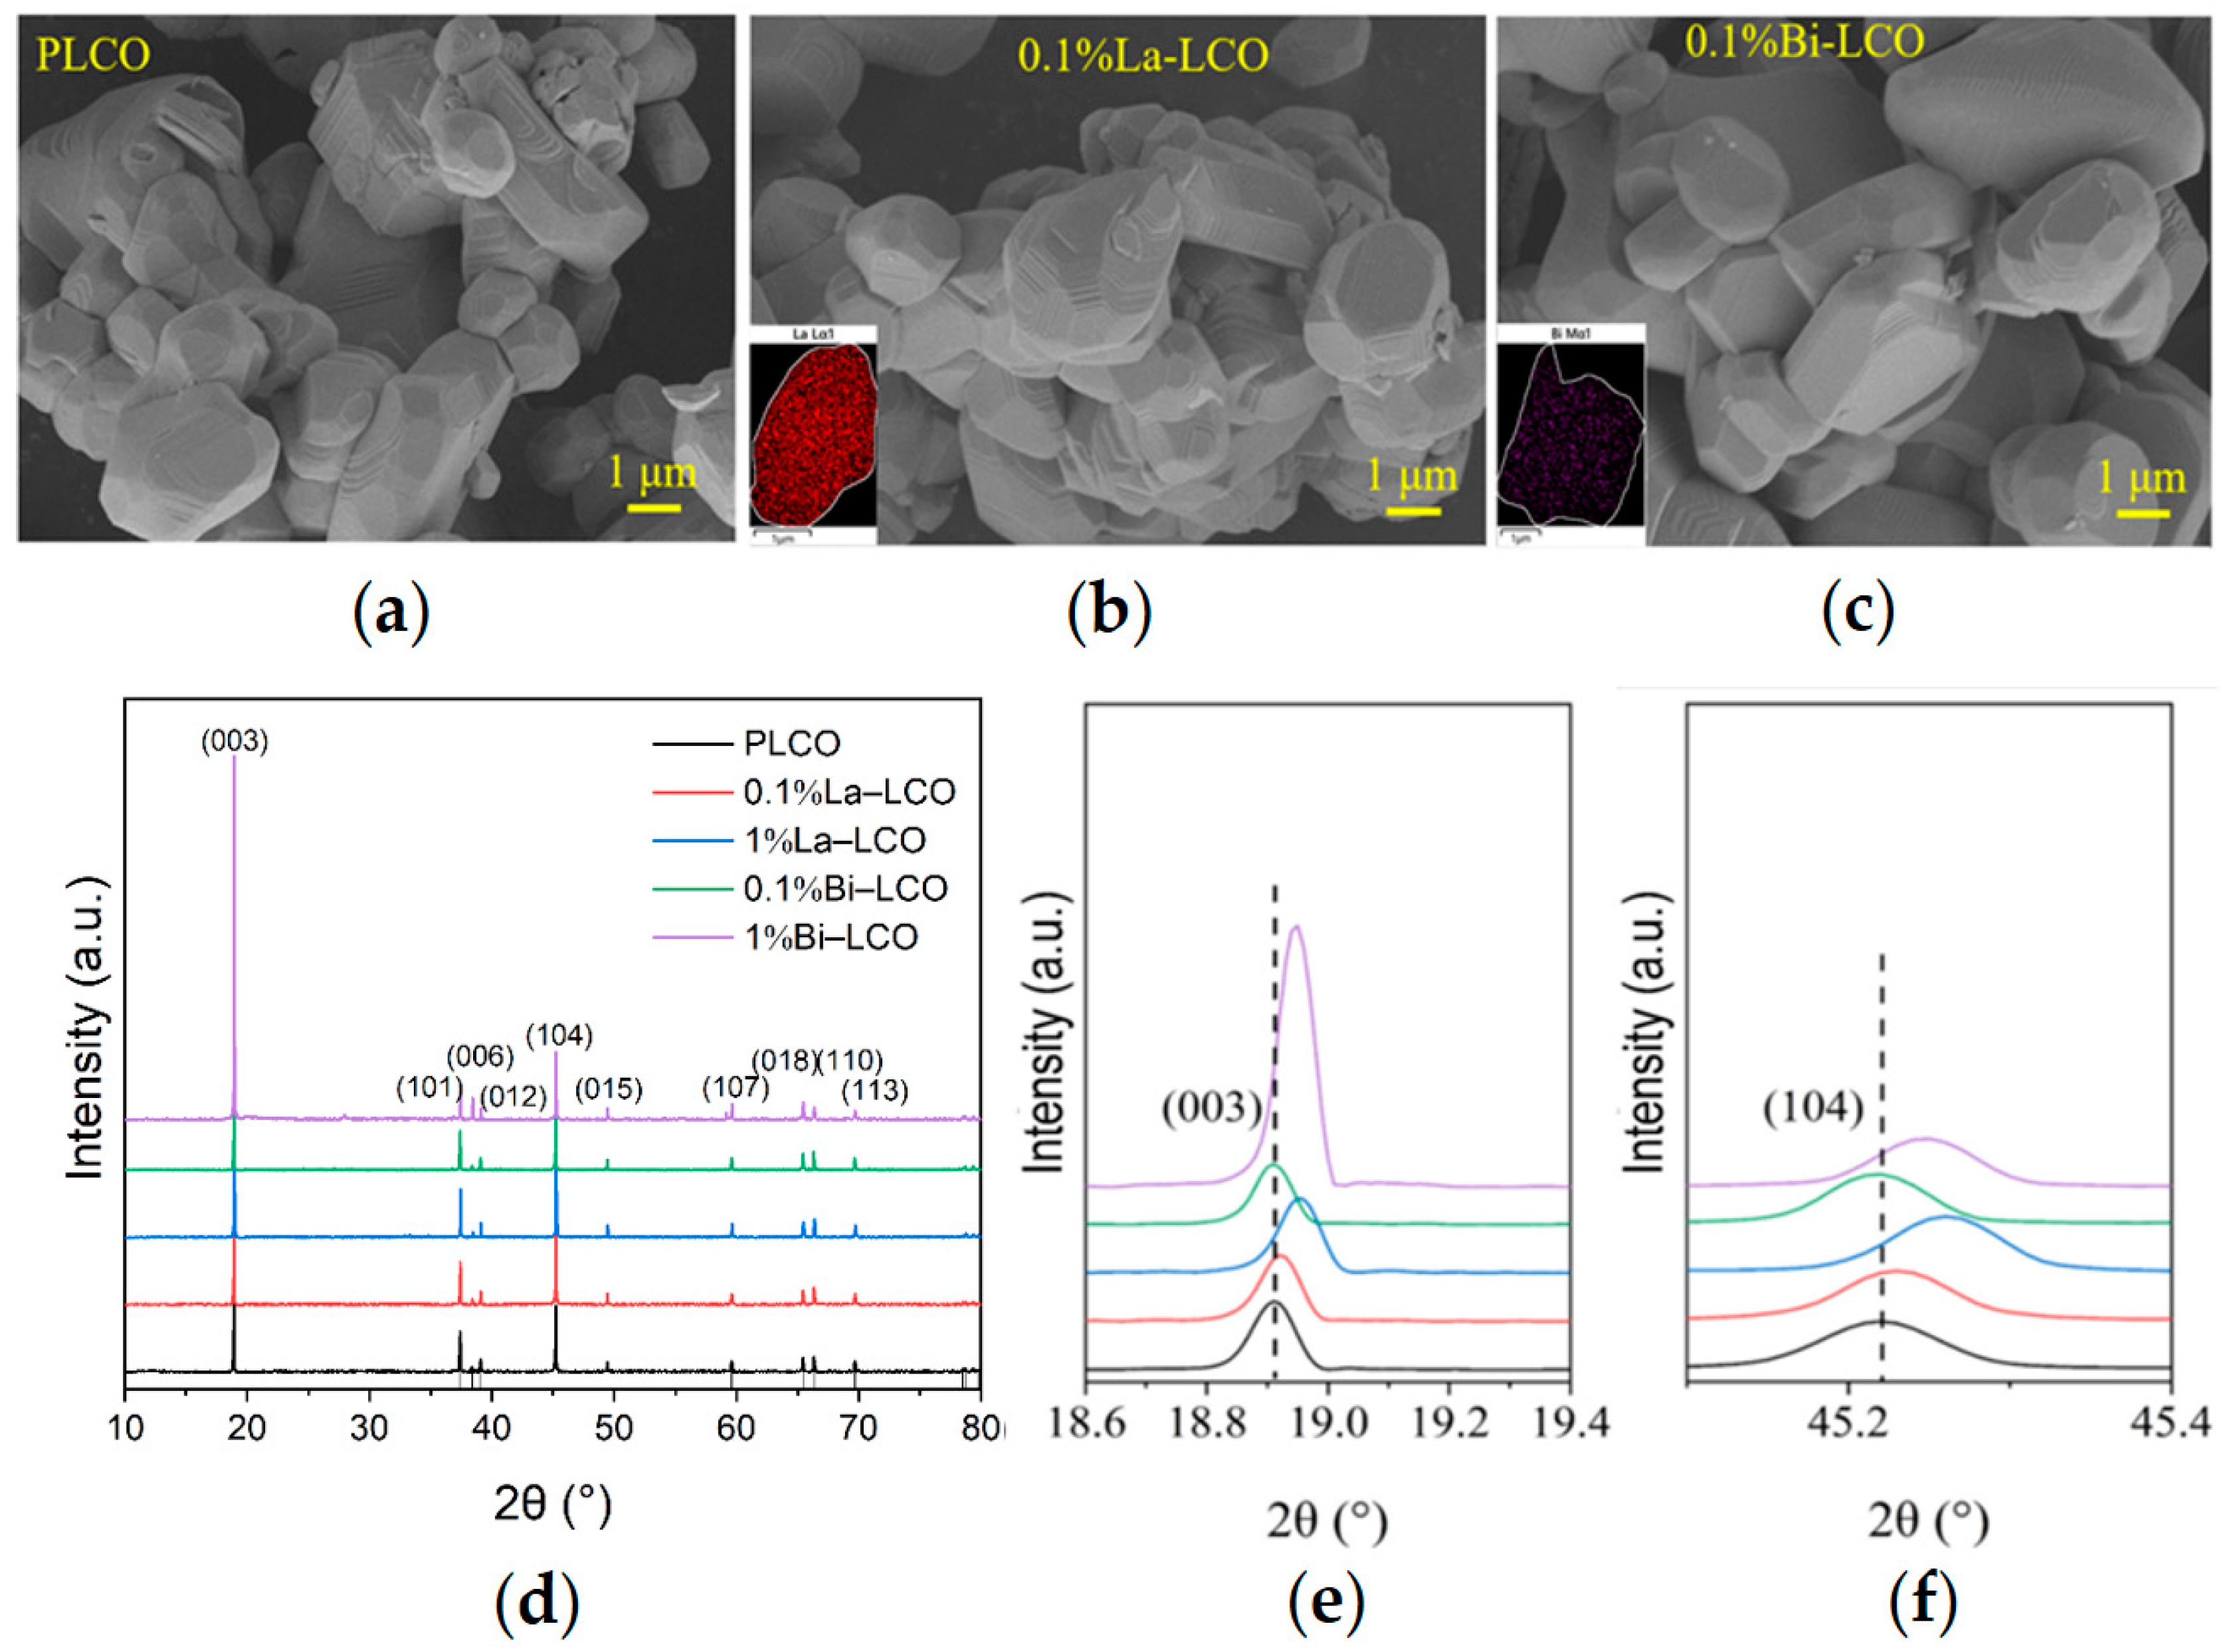
To validate the scientific cognition derived from the presented ML-based models, LCO doped by Bi or La was synthesized and characterized according to the elemental features recommended by the model. Both Bi and La possess an ionic radius much larger than Co. However, the electronegativity of Bi is much higher than La (Table 3). The doping concentration of Bi and La is set to 0.1%. PLCO, La–LCO, and Bi–LCO were all composed of micrometer particles with smooth surfaces (Figure 4a–c). The layered structure observed in the SEM images indicates that the synthesized powders had a typical ɑ-NaFeO2 structure for LCO. The EDS mapping of cross-sections fabricated by FIB shows the uniform distributions of the doped elements in the resultant powders at the particle level (insets in Figure 4b,c).
Table 3.
Comparison of valence states, ionic electronegativity, and ionic radii of Co, La, and Bi.
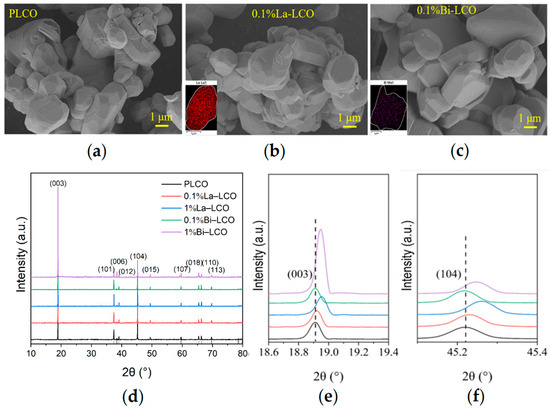
Figure 4.
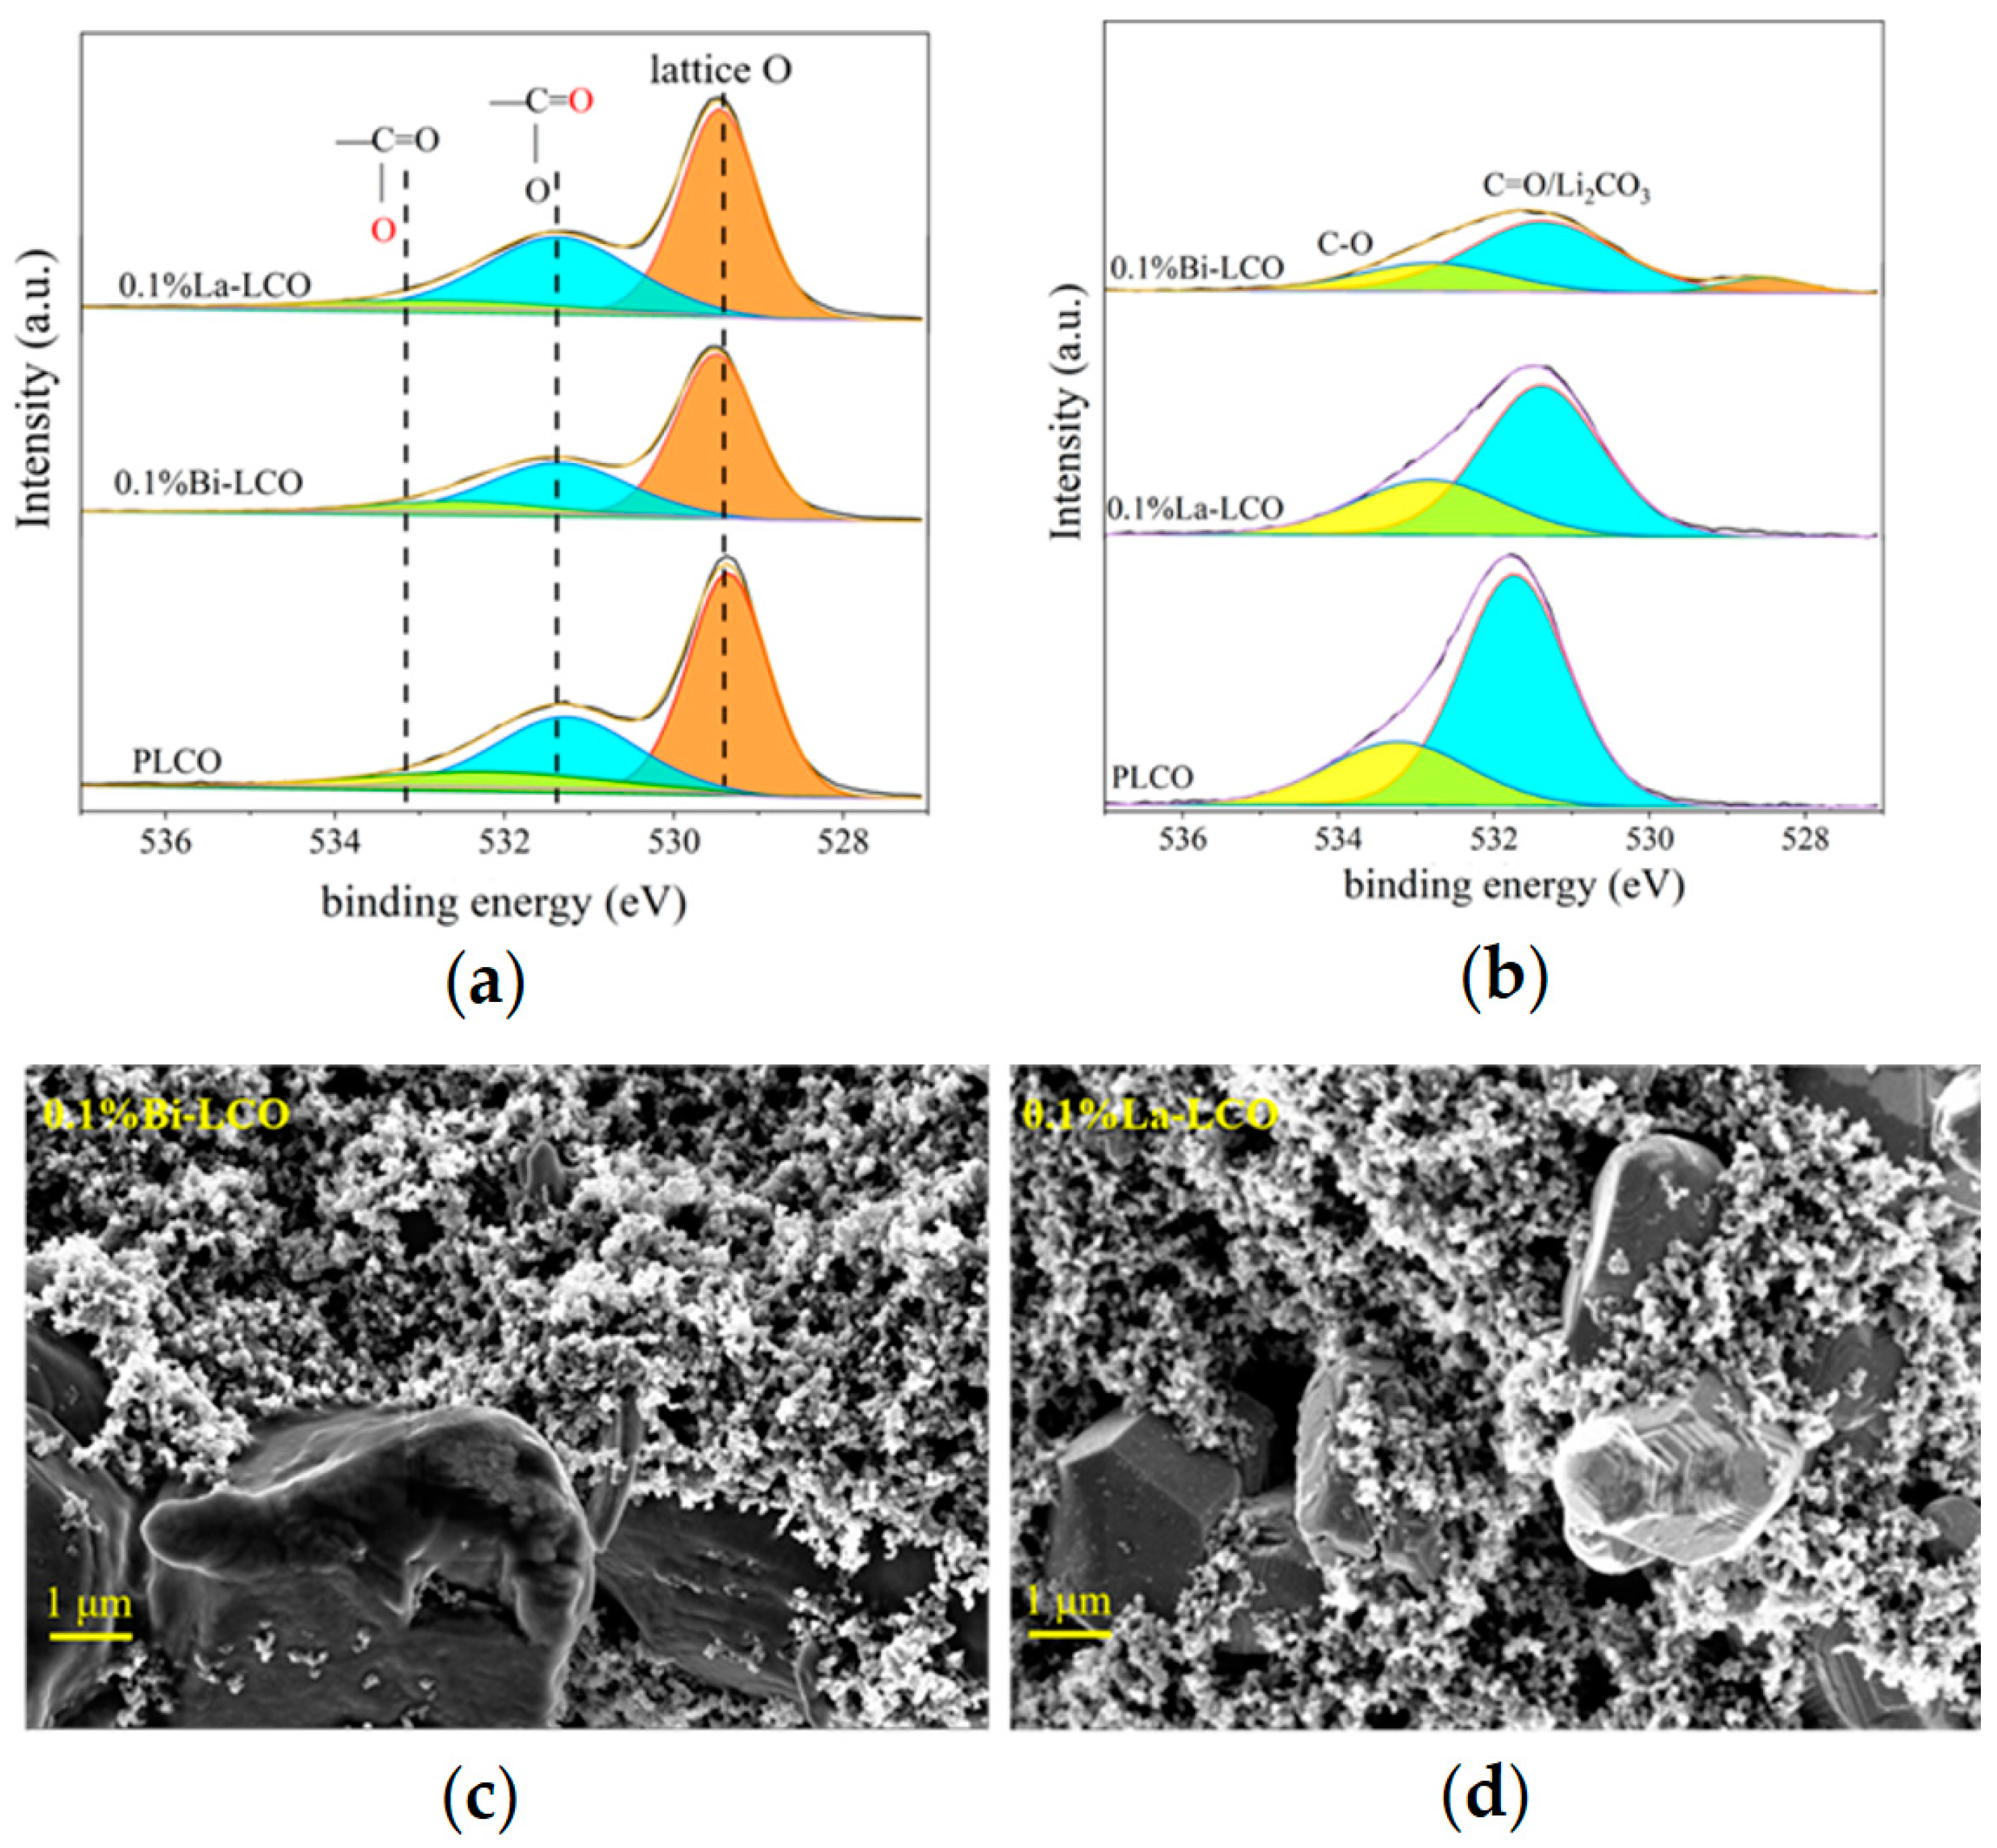
(a–c) SEM images of (a) PLCO, (b) La–LCO, and (c) Bi–LCO. Insets in (b,c) are the EDS mappings of cross-section fabricated by FIB. (d) XRD patterns of PLCO, La–LCO, and Bi–LCO. (e) Enlarged view of (003) peaks derived from PLCO, La–LCO, and Bi–LCO. (f) Enlarged view of (104) peaks in the XRD patterns of cycled PLCO, La–LCO, and Bi–LCO.
The XRD data suggest that introducing small amounts of Bi or La into LCO does not change the crystal structure of LCO significantly (Figure 4d). All as-prepared LCO samples perform a c/a value greater than 4.965, and clearly separated (006)/(012) and (108)/(110) peak pairs, indicating a highly ordered layered structure with a space for Li+ accommodation and transportation. However, when the doping element concentration increases to 1%, the doping of Bi or La leads to a decrease in the interplanar spacing of the 003 peak (Figure 4e). Simultaneously, a small peak (at θ ≈ 28°) is observed in the XRD pattern of 1% Bi–LCO. These phenomena suggest that high-concentration doping instead reduces the unit cell volume of LCO and may also result in element segregation and structural phase separation. The visibly increased intensity of the (003) peak in the XRD pattern derived from 1% Bi–LCO should be attributed to the doped Bi with a relatively low melting point, which introduces a mobile phase and enhances mass diffusion during solid-state reactions [35]. Due to the phase structure segregation and reduced unit cell volume observed at a 1% doping concentration, subsequent performance evaluations primarily focused on LCO doped with 0.1%. To study the effect of doping elements with different ion electronegativity on the lattice oxygen in LCO, XPS was used to test the oxygen-containing groups on the surfaces of prepared PLCO, 0.1% La–LCO, and 0.1% Bi–LCO, of which the results are shown in Figure 5a. The surface oxygen O 1s spectrum of PLCO consists of three parts, including lattice oxygen in the O3 layered structure, the double bond between O and C atoms, and the single bond between O atoms and C atoms. It can be clearly seen from Figure 5a that the binding energies of the lattice oxygen corresponding to 0.1% La–LCO and 0.1% Bi–LCO have both been enhanced but no significant change appeared in the binding energy of the other two parts.

Figure 5.
(a) XPS spectra of PLCO, Bi–LCO, and La–LCO before cycling. (b) XPS spectra of PLCO, Bi–LCO, and La–LCO after cycling. (c) The morphologies of the cycled 0.1% Bi–LCO. (d) The morphologies of the cycled 0.1% La–LCO.
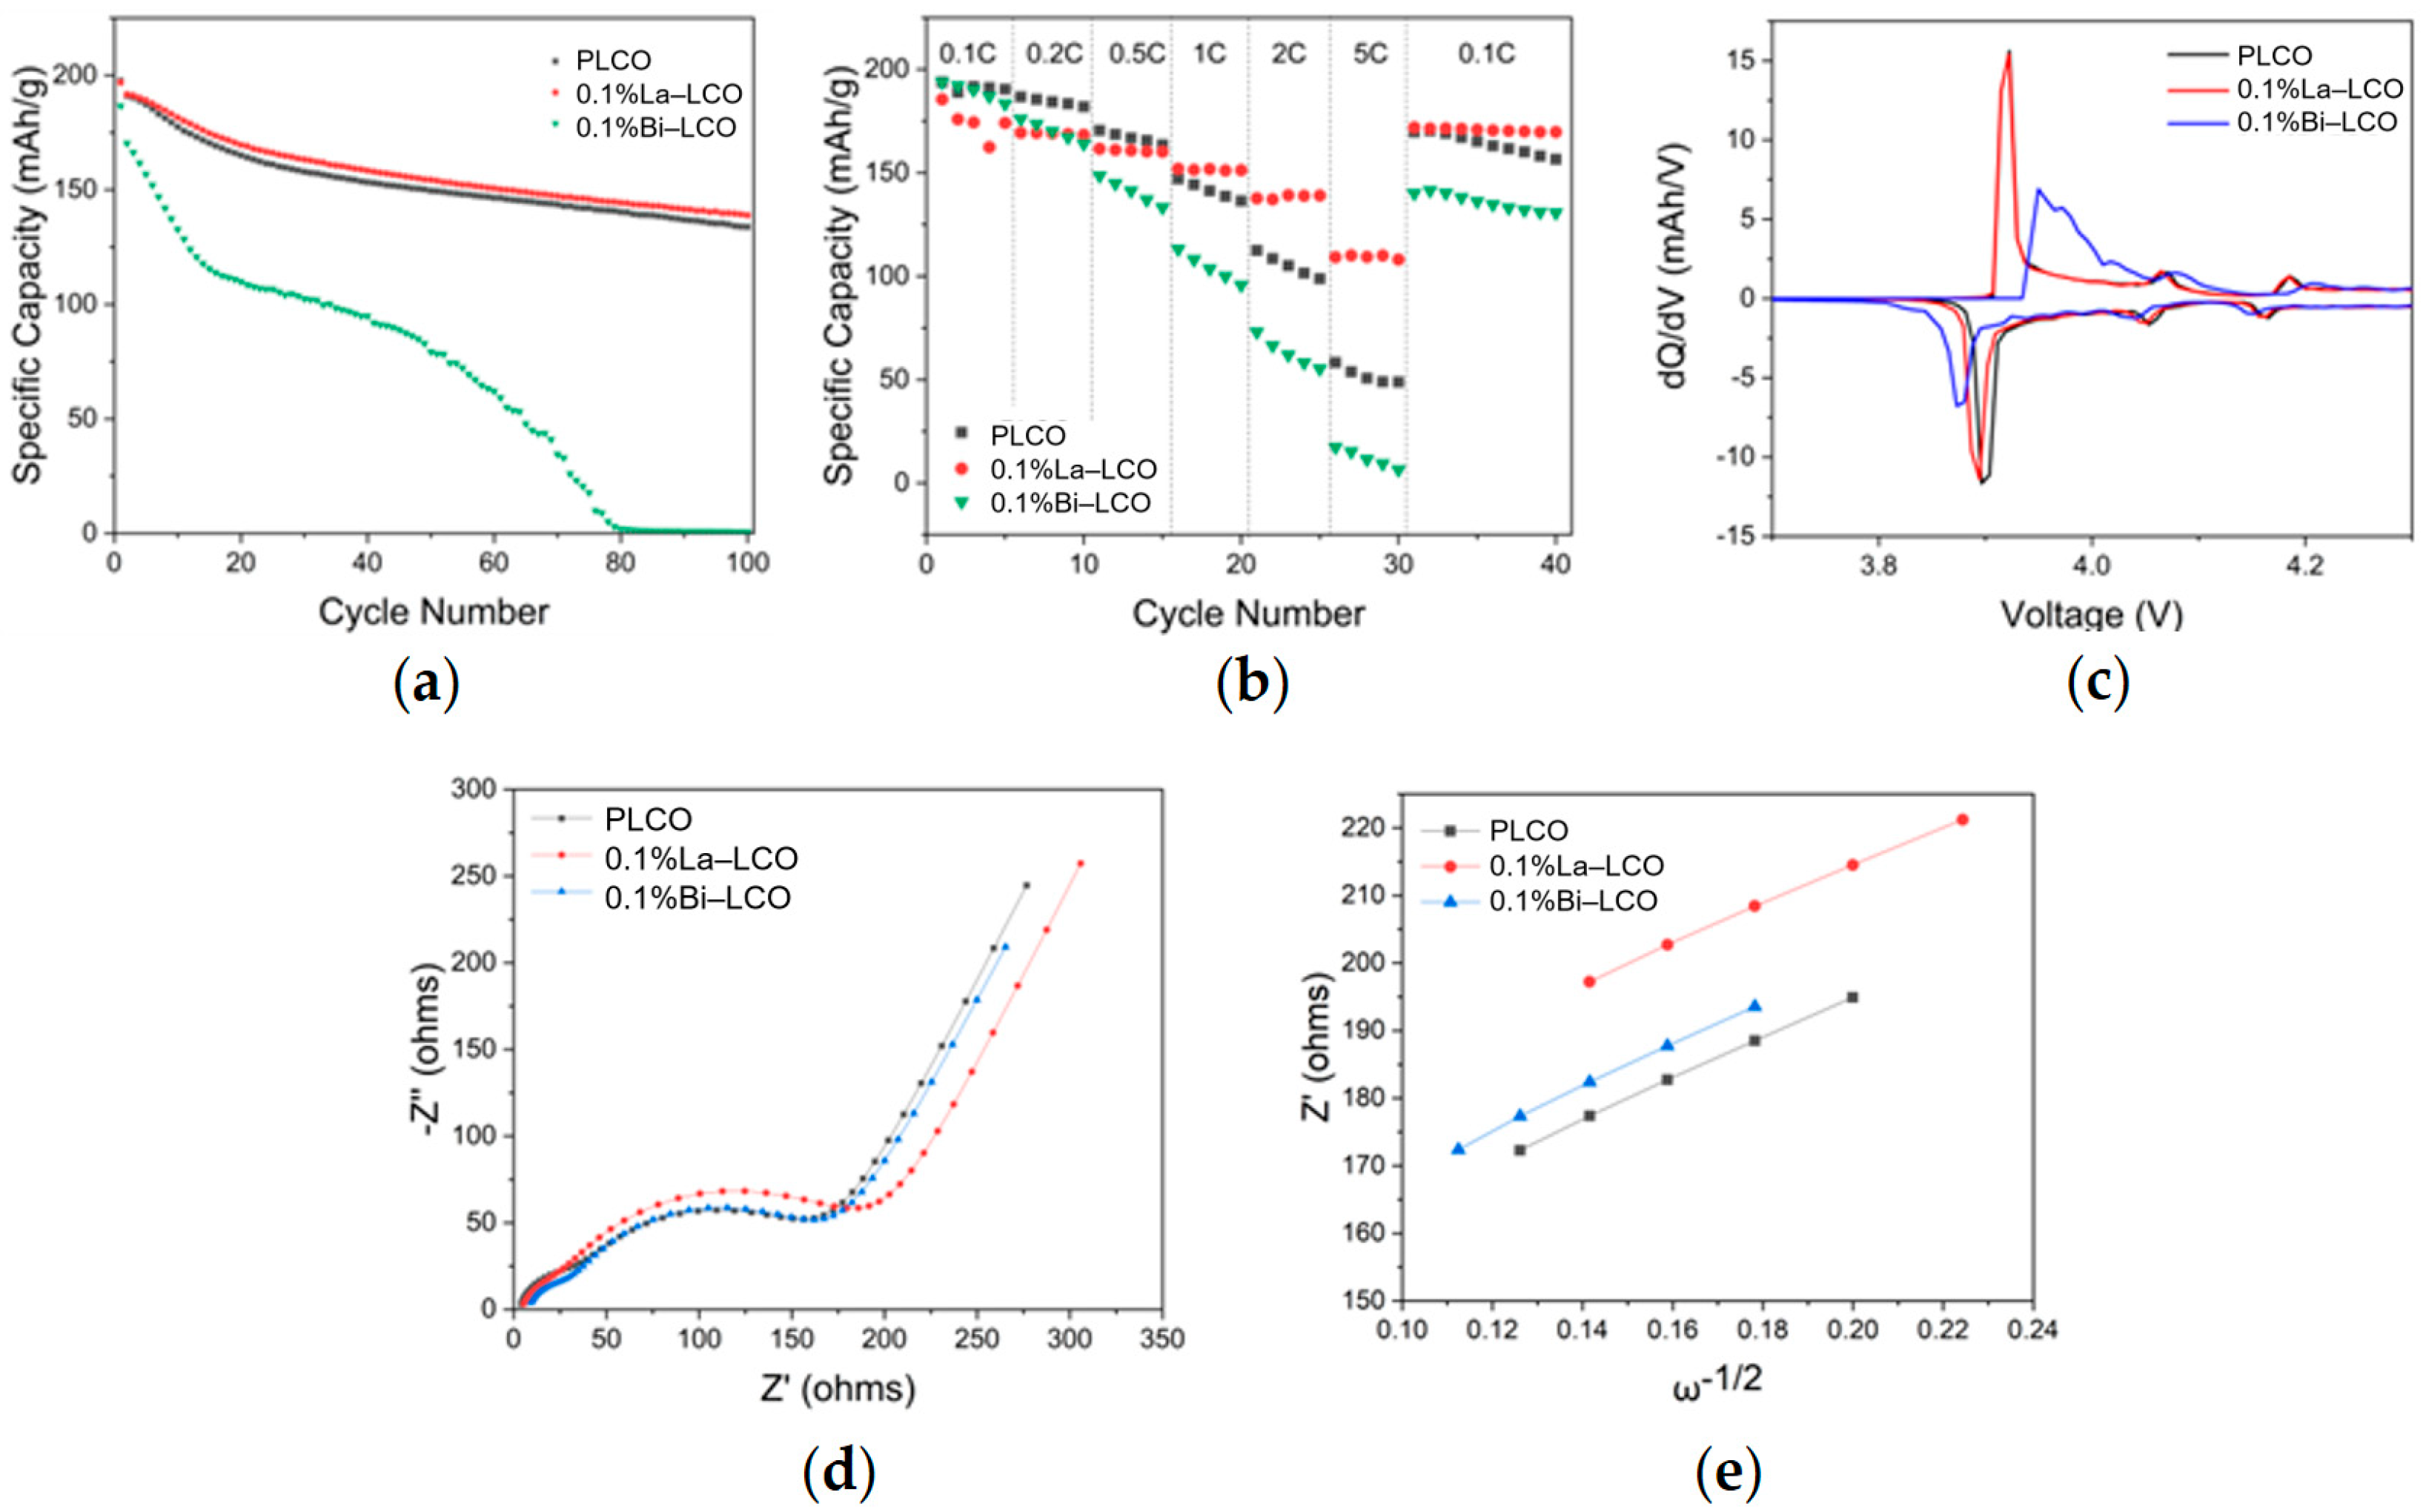
The difference in the structural stability of Bi–LCO and La–LCO results in varied cycling performance (Figure 6a,b and Figure S2). La–LCO performed superior cyclability, although its initial discharge capacity (196.8 mAh/g) was slightly lower than that of PLCO (197.6 mAh/g). After 100 cycles, the capacity retention of La–LCO (70.58%) exceeded that of PLCO (67.71%). Additionally, the discharging voltage plateau of La–LCO was much more stable than that of PLCO during cycling (highlighted in Figure S2). Meanwhile, the capacity retention of Bi–LCO rapidly declined and dropped to almost 0 after 100 cycles. What is more, the charging curves of La–LCO and PLCO stably display a clear fluctuation at 4.2 V, suggesting a reversible phase transition at this point. However, such fluctuation in the charging curve was only observed during the initial cycle for Bi–LCO, indicating that the electrochemical reversibility of LCO is impaired by the doped Bi.
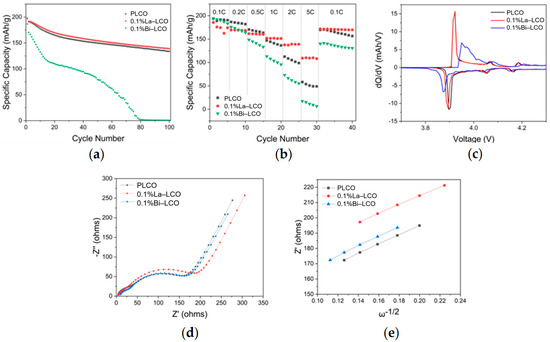
Figure 6.
(a) Cycling performance of PLCO, 0.1%La–LCO, and 0.1%Bi–LCO. (b) Rate performance of PLCO, 0.1%La–LCO, and 0.1%Bi–LCO. (c) The dQ–dV curves of PLCO, 0.1%La–LCO, and 0.1%Bi–LCO at the first cycle. (d) Nyquist plots of the electrochemical impedance spectra measured at room temperature, and the equivalent circuit applied for data fit. (e) Z′ plotted against w−1/2 at the low-frequency region.
To further investigate the different effects of doped Bi and La on the attenuation of the voltage platform of LCO, the derivative of capacity with respect to the voltage (dQ–dV) curves of PLCO, 0.1La–LCO, and 0.1Bi–LCO are measured at room temperature and plotted in Figure 6c. All three samples experienced the first-order phase transition with a coexistence region corresponding to the redox peaks near 3.9 V vs. Li+/Li, and the order–disorder transition corresponding to the redox peaks near 4.1 and 4.2 V vs. Li+/Li [9]. Table S4 summarizes the voltage difference ( = − , where is the oxidation potential, is the reduction potential) of the three samples at the first phase transition. Compared with the PLCO and 0.1%La–LCO, 0.1%Bi–LCO demonstrates a much larger between the reduction and oxidation peaks, indicating that the interfacial polarization is alleviated. In other words, the doping of Bi worsens the reversibility of LCO during charge and discharge.
The increased interfacial polarization is typically correlated with the limited kinetics of Li+ transport in the LCO lattice [10]. The measured discharge capacities of the three samples at the rates greater than or equal to 1C decrease in the order of 0.1%La–LCO > PLCO > 0.1%Bi–LCO (Figure 6b), also suggesting that 0.1%La–LCO possesses superior Li+ transport kinetics than Bi–LCO. Based on the measured EIS spectra (Figure 6d), the Warburg factor (σ) is obtained by linearly fitting the low-frequency impedance and phase angle (Figure 6e). The Li+ diffusivity (DLi+) is calculated by the following equations:
where Rs is ohmic resistance, and RCEI and Rct are resistances for CEI and charge transfer, respectively. σ is the Warburg factor and ω is the angular frequency. R is the gas constant, T is the absolute temperature, A is the interface area between the cathode and the electrolyte, n0 is the number of electrons per oxide molecule, F is the Faraday constant, and C is the Li+ concentration [36]. The determined Li+ diffusivities for PLCO, 0.1%La–LCO, and 0.1%Bi–LCO were 1.07 × 10⁻¹⁶ cm2/s, 2.09 × 10⁻¹⁶ cm2/s, and 2.28 × 10⁻¹⁶ cm2/s, respectively. Unexpectedly, the Li+ diffusivity of Bi–LCO is slightly higher than that of La–LCO. Meanwhile, the resistance of charge transfer (Rct) of Bi–LCO is considerably higher than that of La–LCO (Figure 6d and Table S3). Thus, it is reasonable to deduce that the difference in the electrochemical performance of Bi–LCO and La–LCO is derived from their surface chemistry influenced by the varied ionic electronegativities (Table 3) of doped elements.
The XPS spectra of PLCO, 0.1%La–LCO, and 0.1%Bi–LCO before and after cycling were collected to compare the oxygen-containing groups on their particulate surface. According to O, 1s spectra were fitted as shown in Figure 5a, the peak near 529.4 eV (shaded area) was ascribed to the lattice O of LCO, and the peaks around 531–534 eV were associated with C=O and C–O [11]. The surface oxygen-containing species of the three samples were almost the same before cycling. However, the lattice O still can be detected for Bi–LCO after cycling, while the O, 1s spectra of La–LCO did not show the peak corresponding to lattice O (Figure 5b). The exposure of lattice O implies that the CEI formed on the surface of Bi–LCO is not dense and continuous [10,37,38,39]. In other words, the doping of Bi with a higher ionic electronegativity than La and Co may lead to an undesired interfacial reaction during the formation stage. Such a deduction is also supported by the morphologies of the cycled samples (Figure 5c and Figure 6d), in which the surface of Bi–LCO is relatively coarse and fluffy.
The above results experimentally validated the presented ML-based models for the discharge capacity prediction of LCO by verifying the scientific cognition generated by the models. In addition, the analysis of the properties of Bi–LCO and La–LCO demonstrates that their different electrochemical performance is not due to the mechanism being easy to bring to light, such as the limited Li+ transport, but is due to the complex interfacial reaction. Notably, the mechanism of the complex interfacial reaction of LCO remains a challenge for researchers. Nevertheless, the presented ML-based models seem capable of catching the related key factors, at least to an extent. Therefore, it is reasonable to expect these models to have the potential to expedite the R&D process for the advanced doping recipes of LCO.
4. Conclusions
In conclusion, five machine learning algorithms were used for model training and analysis on 158 doped materials in this study. These models, using nine screened features, predicted the initial discharge capacity and the discharge capacity of the 25th cycle, pointing out several research directions worth further verification. The verification experiments took the ion electronegativity of the doping elements as a variable, controlled other variables, and comprehensively analyzed the composition structure, element distribution, and morphological features of the material before and after the experiments. Additionally, the electrical performance of the material battery was tested, verifying the analytical results of the machine learning algorithms. First, through mechanism analysis combined with Pearson correlation analysis, necessary feature screening was carried out, reducing the possibility of model overfitting. Second, the RF model and XGBoost model together constituted the optimal prediction model. The RF model had the highest goodness of fit for the IC prediction results (R2 = 0.8882), while the XGBoost model had the highest goodness of fit for the EC prediction results (R2 = 0.8318). A model analysis showed that the ion electronegativity of the doping element has a significant impact on both IC and EC. Comparative experiments set with low-ion-electronegative La and high-ion-electronegative Bi doping elements confirmed the effectiveness of machine learning models.
Compared to existing works, we employed ensemble-based machine learning algorithms for model training. We achieved high-precision predictions for IC and EC (R2 > 0.9). The feature selection process adheres to traditional material formula design principles, taking into account the issue of data volume and feature matching in machine learning applications. The design of the comparative experiments was entirely based on the analysis results of the optimal combination machine learning model, and a comprehensive characterization test analysis was also conducted. To our knowledge, this is the first study in this domain that verifies the analytical results of machine learning models.
The novelty of our research lies in the combination of certain prior knowledge of machine learning algorithms to realize high-precision prediction models for IC and EC within a certain feature range. We gained a more novel understanding of different doped lithium cobalt oxide formula designs through model analysis. Targeted manual experiments were carried out based on these insights, confirming the effectiveness of machine learning in quickly understanding the doped lithium cobalt oxide system and its further optimization design. In the future, we plan to promote machine learning-based algorithms to discover more valuable doping recipes for layered oxide cathode materials, broadening our knowledge of existing cathode materials and seeking additional improvements.
Supplementary Materials
The following supporting information can be downloaded at: https://www.mdpi.com/article/10.3390/batteries11030100/s1, Table S1: 13 papers published in prestigious journals, consisting of 112 distinctive doped LCO systems with 23 dopants (including Pb, Mg, Zr, Al, B, Ba, Bi, Ca, Cr, Cu, Eu, Fe, Ga, In, Mn, Ni, Ru, Sb, Sn, Sr, Ti, Y, and Zn); Table S2: Proposed ML Model Architecture of This Study, Including the Names and Abbreviations of the 16 Covariate Variables and 2 Response Variables; Table S3: 18 dataset features, including 16 covariate variables and 2 response variables; Table S4: Voltage difference of the three samples at the first phase transition; Figure S1: Results matrix of Pearson coefficient correlations for every pair of variables in the data set. The estimated correlation values are distributed within the range of −1 to +1, with a number reaching either end value implying a more perfect negative correlation and positive correlation, respectively; Figure S2. (a–c) Charge–discharge curves of Bi–LCO (a), La–LCO (b), and P–LCO (c) from 3.00 to 4.50 V vs. Li+/Li for the 1st, 20th, 40th, 60th, 80th, and 100th cycles (0.1C for the initial 3 cycles and 0.2C for the following cycles); Figure S3. Nyquist plots of the electrochemical impedance spectra measured at room temperature. References [8,40,41,42,43,44,45,46,47,48,49,50,51] are cited in the supplementary materials.
Author Contributions
Software, Y.Y., M.F. and Y.W.; Validation, M.F. and C.P.; Formal analysis, X.C. and Y.W.; Writing—original draft, M.F.; Writing—review & editing, F.Z., X.Z. and Y.X.; Supervision, F.Z. and X.Z. All authors have read and agreed to the published version of the manuscript.
Funding
This research received no external funding.
Data Availability Statement
The original contributions presented in this study are included in the article/Supplementary Material. Further inquiries can be directed to the corresponding authors.
Conflicts of Interest
The authors declare no conflicts of interest.
References
- Dunn, B.; Kamath, H.; Tarascon, J.-M. Electrical Energy Storage for the Grid: A Battery of Choices. Science 2011, 334, 928–935. [Google Scholar] [CrossRef] [PubMed]
- Wang, K.; Wan, J.; Xiang, Y.; Zhu, J.; Leng, Q.; Wang, M.; Xu, L.; Yang, Y. Recent advances and historical developments of high voltage lithium cobalt oxide materials for rechargeable Li-ion batteries. J. Power Sources 2020, 460, 228062. [Google Scholar] [CrossRef]
- Wu, Q.; Zhang, B.; Lu, Y. Progress and perspective of high-voltage lithium cobalt oxide in lithium-ion batteries. J. Energy Chem. 2022, 74, 283–308. [Google Scholar] [CrossRef]
- Amatucci, G.G.; Tarascon, J.M.; Klein, L.C. Cobalt dissolution in LiCoO2-based non-aqueous rechargeable batteries. Solid State Ion. 1996, 83, 167–173. [Google Scholar] [CrossRef]
- Sharifi-Asl, S.; Lu, J.; Amine, K.; Shahbazian-Yassar, R. Oxygen Release Degradation in Li-Ion Battery Cathode Materials: Mechanisms and Mitigating Approaches. Adv. Energy Mater. 2019, 9, 1900551. [Google Scholar] [CrossRef]
- Wang, Z.; Chen, L.; Huang, X. Structural Design and Modification of Cathode Materials for Lithium Ion Batteries. Prog. Chem. 2011, 23, 284. [Google Scholar]
- Jena, A.; Lee, P.-H.; Pang, W.K.; Hsiao, K.-C.; Peterson, V.K.; Darwish, T.; Yepuri, N.; Wu, S.-H.; Chang, H.; Liu, R.-S. Monitoring the phase evolution in LiCoO2 electrodes during battery cycles using in-situ neutron diffraction technique. J. Chin. Chem. Soc. 2020, 67, 344–352. [Google Scholar] [CrossRef]
- Wang, L.; Chen, B.; Ma, J.; Cui, G.; Chen, L. Reviving lithium cobalt oxide-based lithium secondary batteries-toward a higher energy density. Chem. Soc. Rev. 2018, 47, 6505–6602. [Google Scholar] [CrossRef]
- Mou, S.; Huang, K.; Guan, M.; Ma, X.; Chen, J.s.; Xiang, Y.; Zhang, X. Reduced energy barrier for Li+ diffusion in LiCoO2 via dual doping of Ba and Ga. J. Power Sources 2021, 505, 230067. [Google Scholar] [CrossRef]
- Zhang, J.-N.; Li, Q.; Ouyang, C.; Yu, X.; Ge, M.; Huang, X.; Hu, E.; Ma, C.; Li, S.; Xiao, R.; et al. Trace doping of multiple elements enables stable battery cycling of LiCoO2 at 4.6 V. Nat. Energy 2019, 4, 594–603. [Google Scholar] [CrossRef]
- Cheng, Z.; Ma, X.; Mou, S.; Zhang, Y.; Wu, F.; Xiang, Y.; Zhang, X. The Synergetic Effects of Ru and Al Co-Doping for Improved Cyclability of LiCoO2 at High Voltages. Adv. Sustain. Syst. 2023, 2300325. [Google Scholar] [CrossRef]
- Chakraborty, A.; Dixit, M.; Aurbach, D.; Major, D.T. Predicting accurate cathode properties of layered oxide materials using the SCAN meta-GGA density functional. Npj Comput. Mater. 2018, 4, 60. [Google Scholar] [CrossRef]
- Hart, G.L.W.; Mueller, T.; Toher, C.; Curtarolo, S. Machine learning for alloys. Nat. Rev. Mater. 2021, 6, 730–755. [Google Scholar] [CrossRef]
- Kohn, W.; Sham, L.J. Self-Consistent Equations Including Exchange and Correlation Effects. Phys. Rev. 1965, 140, A1133–A1138. [Google Scholar] [CrossRef]
- Ramprasad, R.; Batra, R.; Pilania, G.; Mannodi-Kanakkithodi, A.; Kim, C. Machine learning in materials informatics: Recent applications and prospects. Npj Comput. Mater. 2017, 3, 54. [Google Scholar] [CrossRef]
- Liu, Y.; Guo, B.; Zou, X.; Li, Y.; Shi, S. Machine learning assisted materials design and discovery for rechargeable batteries. Energy Storage Mater. 2020, 31, 434–450. [Google Scholar] [CrossRef]
- Liu, Y.; Zhao, T.; Ju, W.; Shi, S. Materials discovery and design using machine learning. J. Mater. 2017, 3, 159–177. [Google Scholar] [CrossRef]
- Mao, J.; Miao, J.; Lu, Y.; Tong, Z. Machine learning of materials design and state prediction for lithium ion batteries. Chin. J. Chem. Eng. 2021, 37, 1–11. [Google Scholar] [CrossRef]
- Hautier, G.; Fischer, C.C.; Jain, A.; Mueller, T.; Ceder, G. Finding Nature’s Missing Ternary Oxide Compounds Using Machine Learning and Density Functional Theory. Chem. Mater. 2010, 22, 3762–3767. [Google Scholar] [CrossRef]
- Tao, K.; Wang, Z.; Han, Y.; Li, J. Rapid discovery of inorganic-organic solid composite electrolytes by unsupervised learning. Chem. Eng. J. 2023, 454, 140151. [Google Scholar] [CrossRef]
- Jalem, R.; Nakayama, M.; Kasuga, T. An efficient rule-based screening approach for discovering fast lithium ion conductors using density functional theory and artificial neural networks. J. Mater. Chem. A 2014, 2, 720–734. [Google Scholar] [CrossRef]
- Wang, G.; Fearn, T.; Wang, T.; Choy, K.L. Machine-Learning Approach for Predicting the Discharging Capacities of Doped Lithium Nickel-Cobalt-Manganese Cathode Materials in Li-Ion Batteries. ACS Cent. Sci. 2021, 7, 1551–1560. [Google Scholar] [CrossRef] [PubMed]
- Balachandran, P.V.; Theiler, J.; Rondinelli, J.M.; Lookman, T. Materials Prediction via Classification Learning. Sci. Rep. 2015, 5, 13285. [Google Scholar] [CrossRef]
- Chemali, E.; Kollmeyer, P.J.; Preindl, M.; Emadi, A. State-of-charge estimation of Li-ion batteries using deep neural networks: A machine learning approach. J. Power Sources 2018, 400, 242–255. [Google Scholar] [CrossRef]
- Guo, H.; Wang, Q.; Stuke, A.; Urban, A.; Artrith, N. Accelerated Atomistic Modeling of Solid-State Battery Materials With Machine Learning. Front. Energy Res. 2021, 9, 695902. [Google Scholar] [CrossRef]
- Sendek, A.D.; Cubuk, E.D.; Antoniuk, E.R.; Cheon, G.; Cui, Y.; Reed, E.J. Machine Learning-Assisted Discovery of Solid Li-Ion Conducting Materials. Chem. Mater. 2018, 31, 342–352. [Google Scholar] [CrossRef]
- Tao, Q.; Xu, P.; Li, M.; Lu, W. Machine learning for perovskite materials design and discovery. Npj Comput. Mater. 2021, 7, 23. [Google Scholar] [CrossRef]
- Min, K.; Choi, B.; Park, K.; Cho, E. Machine learning assisted optimization of electrochemical properties for Ni-rich cathode materials. Sci. Rep. 2018, 8, 15778. [Google Scholar] [CrossRef]
- Lundberg, S.M.; Lee, S.-I. A Unified Approach to Interpreting Model Predictions. In Proceedings of the Neural Information Processing Systems, New Orleans, LA, USA, 10–16 December 2017. [Google Scholar]
- Ou, X.; Luo, J.; Zhang, J.; Chen, C.-L.; Yu, J.; Hu, J.; Chang, C.K.; Moudrakovski, I.; Lau, V.W.h.; Zhao, R. Reversible Li Intercalation in Layered Cathodes Enabled by Dopant-Induced Medium-Range Orders. Chem. Mater. 2023, 35, 7273–7282. [Google Scholar] [CrossRef]
- Huang, Y.; Zhu, Y.; Fu, H.; Ou, M.; Hu, C.; Yu, S.; Hu, Z.; Chen, C.-T.; Jiang, G.; Gu, H.; et al. Mg-Pillared LiCoO2: Towards Stable Cycling at 4.6 V. Angew. Chem. Int. Ed. 2021, 60, 4682–4688. [Google Scholar] [CrossRef]
- Yang, Z.; Yang, W.; Tang, Z. Pillared layered Li1 − 2xCaxCoO2 cathode materials obtained by cationic exchange under hydrothermal conditions. J. Power Sources 2008, 184, 557–561. [Google Scholar] [CrossRef]
- Zhao, L.; Yan, P.; Liu, T.; Wang, X.; Wang, Z.; Wu, C.; Bao, W.; Zhu, H.; Zhang, Y.; Xie, J. Temperature-Driven Anisotropic Mg2+ Doping for a Pillared LiCoO2 Interlayer Surface in High-Voltage Applications. ACS Appl. Mater. Interfaces 2023, 15, 33132–33139. [Google Scholar] [CrossRef]
- Kim, C.H.; Rim, Y.S.; Kim, D.L.; Kim, H.J. Combined effect of the large ionic radius and low electronegativity of lanthanum additive on solution-processed zinc–tin–oxide thin-film transistors. Thin Solid Film. 2013, 536, 291–294. [Google Scholar] [CrossRef]
- Xiang, Y.; Zhang, X.; Zhang, S. Insight into the mechanism of Sb promoted Cu(In,Ga)Se2 formation. J. Solid State Chem. 2013, 204, 278–282. [Google Scholar] [CrossRef]
- Zhang, Z.; Meng, Y.; Xiao, D. Tri-sites co-doping: An efficient strategy towards the realization of 4.6 V-LiCoO2 with cyclic stability. Energy Storage Mater. 2023, 56, 443–456. [Google Scholar] [CrossRef]
- Dahéron, L.; Martinez, H.; Dedryvère, R.; Baraille, I.; Ménétrier, M.; Denage, C.; Delmas, C.; Gonbeau, D. Surface Properties of LiCoO2 Investigated by XPS Analyses and Theoretical Calculations. J. Phys. Chem. C 2009, 113, 5843–5852. [Google Scholar] [CrossRef]
- Lu, Y.C.; Mansour, A.N.; Yabuuchi, N.; Shao-horn, Y. Probing the Origin of Enhanced Stability of AlPO4 Nanoparticle Coated LiCoO2 during Cycling to High Voltages: Combined XRD and XPS Studies. Chem. Mater. 2009, 21, 4408–4424. [Google Scholar] [CrossRef]
- Qian, J.; Liu, L.; Yang, J.; Li, S.; Wang, X.; Zhuang, H.L.; Lu, Y. Electrochemical surface passivation of LiCoO2 particles at ultrahigh voltage and its applications in lithium-based batteries. Nat. Commun. 2018, 9, 4918. [Google Scholar] [CrossRef]
- Zhang, P.; Xie, C.; Han, G.; Zhu, Q.; Chen, L.; Jin, M.; Liu, Q.; Zhou, Y.; Sun, Q.; Xie, J. Stable cycling of LiCoO2 at 4.55 V enabled by combined Mg doping and surface coating of NASICON-type electrolyte. Mater. Today Nano 2021, 15, 100122. [Google Scholar] [CrossRef]
- Xu, L.; Wang, K.; Gu, F.; Li, T.; Wang, Z. Determining the intrinsic role of Mg doping in LiCoO2. Mater. Lett. 2020, 277, 128407. [Google Scholar] [CrossRef]
- Kim, S.; Yang, D.-h.; Sohn, J.-S.; Jung, Y.C. Resynthesis of LiCo1 − xMnxO2 as a cathode material for lithium secondary batteries. Met. Mater. Int. 2012, 18, 321–326. [Google Scholar] [CrossRef]
- Konar, R.; Maiti, S.; Shpigel, N.; Aurbach, D. Reviewing failure mechanisms and modification strategies in stabilizing high-voltage LiCoO2 cathodes beyond 4.55 V. Energy Storage Mater. 2023, 63, 103001. [Google Scholar] [CrossRef]
- Wang, Y.; Cheng, T.; Yu, Z.-E.; Lyu, Y.; Guo, B. Study on the effect of Ni and Mn doping on the structural evolution of LiCoO2 under 4.6 V high-voltage cycling. J. Alloys Compd. 2020, 842, 155827. [Google Scholar] [CrossRef]
- Alcántara, R.; Lavela, P.; Tirado, J.L.; Stoyanova, R.; Zhecheva, E. Structure and Electrochemical Properties of Boron-Doped LiCoO2. J. Solid State Chem. 1997, 134, 265–273. [Google Scholar] [CrossRef]
- Shim, J.-H.; Lee, J.; Han, S.Y.; Lee, S. Synergistic effects of coating and doping for lithium ion battery cathode materials: Synthesis and characterization of lithium titanate-coated LiCoO2 with Mg doping. Electrochim. Acta 2015, 186, 201–208. [Google Scholar] [CrossRef]
- Needham, S.A.; Wang, G.X.; Liu, H.K.; Drozd, V.A.; Liu, R.S. Synthesis and electrochemical performance of doped LiCoO2 materials. J. Power Sources 2007, 174, 828–831. [Google Scholar] [CrossRef]
- Jia, Z.; Yang, P.; Li, Y.; Gao, D.; Xia, J.; Yang, Y.-J.; Wang, X.; Yang, Y. Enhancing the Structural Stability of LiCoO2 at Elevated Voltage via High-Valence Sb Doping. ACS Appl. Energy Mater. 2024, 7, 4207–4215. [Google Scholar] [CrossRef]
- Sathiyamoorthi, R.; Chandrasekaran, R.; Gopalan, A.; Vasudevan, T. Synthesis and electrochemical performance of high voltage cycling LiCo0.8M0.2O2 (M = Mg, Ca, Ba) as cathode material. Mater. Res. Bull. 2008, 43, 1401–1411. [Google Scholar] [CrossRef]
- Koyama, Y.; Arai, H.; Tanaka, I.; Uchimoto, Y.; Ogumi, Z. First principles study of dopant solubility and defect chemistry in LiCoO2. J. Mater. Chem. A 2014, 2, 11235–11245. [Google Scholar] [CrossRef]
- Jin, Y.; Xu, S.; Li, Z.; Xu, K.; Ding, W.; Song, J.; Wang, H.; Zhao, J. The Influence of Ni Doping on the Structure and Electrochemical Properties of LiCoO2 Materials. J. Electrochem. Soc. 2018, 165, A2267. [Google Scholar] [CrossRef]

Disclaimer/Publisher’s Note: The statements, opinions and data contained in all publications are solely those of the individual author(s) and contributor(s) and not of MDPI and/or the editor(s). MDPI and/or the editor(s) disclaim responsibility for any injury to people or property resulting from any ideas, methods, instructions or products referred to in the content. |
© 2025 by the authors. Licensee MDPI, Basel, Switzerland. This article is an open access article distributed under the terms and conditions of the Creative Commons Attribution (CC BY) license (https://creativecommons.org/licenses/by/4.0/).