Article

Study on the Effect of Air Velocity and Duct Area on the Heat Dissipation of Lithium-Ion Batteries

1
College of Civil Aviation Safety Engineering, Civil Aviation Flight University of China, Guanghan 618307, China
2
Civil Aircraft Fire Science and Safety Engineering Key Laboratory of Sichuan Province, Civil Aviation Flight University of China, Guanghan 618307, China
3
Sichuan Key Technology Engineering Research Center for All-Electric Navigable Aircraft, Civil Aviation Flight University of China, Guanghan 618307, China
*
Author to whom correspondence should be addressed.
Batteries 2025, 11(2), 43; https://doi.org/10.3390/batteries11020043
Submission received: 2 October 2024 / Revised: 4 December 2024 / Accepted: 21 January 2025 / Published: 22 January 2025

Abstract

:
With the growing adoption of lithium-ion batteries, the risk of battery thermal runaway is increasing, so effective temperature regulation for battery systems is essential. The air cooling system for battery thermal management offers advantages such as a simple structure and low cost, making it a promising solution for electric aircraft, electric vehicles, and other applications. In this work, the influence of inlet air velocity, inlet size, and inlet/outlet area ratio on the maximum temperature and maximum temperature difference in the battery pack was simulatively studied. When the inlet air velocity was 4 m/s, inlet size was 73 mm × 25 mm, and inlet/outlet area ratio was 1.25, the heat dissipation effect of battery pack was excellent, and the maximum temperature was 324.8 K. This research offers a crucial foundation for designing and setting the operational parameters of air cooling thermal management systems in lithium-ion battery packs.

1. Introduction

During the operation of lithium-ion batteries, heat is produced through a variety of chemical reactions, and improper temperature conditions can significantly impact the safety, lifespan, and performance of the battery [1,2,3]. Effective heat dissipation measures are needed to ensure the normal working condition of battery pack [4,5,6]. As electric vehicles and other industries rapidly develop, the demand for research into battery heat dissipation technology is becoming increasingly urgent [7,8,9,10]. Battery thermal management refers to the methods employed to keep the battery temperature within an optimal range, while minimizing temperature variation during the charging and discharging processes [11,12]. Battery thermal management systems can be classified into active and passive types based on the involvement of external energy [13]. Among them, the active battery thermal management system relies on fans or pumps to drive the flow of fluids, and the working fluids typically consist of air and liquid, with the energy required to operate the fans and pumps supplied externally [14]. Passive battery thermal management systems operate without external energy input, relying on the properties of cooling mediums like natural cooling and phase change material cooling [15,16,17]. The air cooling system is an effective solution for lowering the maximum temperature of batteries and is commonly applied in the electric and hybrid vehicle sectors [18]. Additionally, air cooling technology offers benefits such as compact space requirements, low cost, ease of maintenance, and environmental friendliness. It effectively meets thermal management needs while enhancing battery safety and extending its service life. Air cooling can be categorized into two types: natural convection (passive) and forced convection (active). The heat dissipation efficiency of an active cooling system is greater than that of a passive cooling system. In air cooling thermal management systems, the rate of heat transfer is primarily influenced by the air flow rate [18,19,20]. Wang et al. developed a forced air cooling thermal management system using 30 cylindrical 18650-type batteries to create a 6-series, 5-parallel battery module, and assessed the heat dissipation of the module when the battery spacing was 2 mm. The results indicated that the efficiency of the forced air cooling was approximately 73.0% at a 1 C discharge rate, the temperature difference was kept under 5.0 °C, with the maximum temperature not exceeding 45.0 °C. It was also observed that forced air cooling significantly lowered the temperature of the battery pack at various discharge rates [21]. Chen et al. investigated the parallel air cooling system. A higher air flow rate resulted in an increased heat transfer coefficient, which contributed to a better reduction in maximum temperature and enhanced temperature uniformity. However, it increased the operation cost due to the consumption of more energy to drive the air in the channel [22]. Mustafa et al. analyzed the impact of inlet and outlet sizes, battery spacing, and inlet placement in battery packs. They observed that increasing the sizes of the inlet and outlet, as well as the battery spacing, led to a decrease in both the average and maximum temperatures of the battery pack [23]. In comparison to other thermal management techniques, air cooling is widely used in commercial applications, with low manufacturing costs and simple design structures. However, the existing research on how air cooling parameters affect the heat dissipation of battery packs lacks sufficient systematization. This study seeks to optimize the critical parameters of an air cooling thermal management system using novel numerical and analytical simulations.

2. Modeling and Simulation Methods

2.1. Establishment of Battery Air Cooling Model

The battery air cooling model consisting of 9 square cells was established and is shown in Figure 1. The air inlet was positioned at the lower left of the battery pack, while the air outlet was located at the upper right. The battery pack was examined to assess how air velocity, along with the inlet and outlet areas, influences cooling. The physical properties of the battery are outlined in Table 1. The external air domain measures 266 mm in length, 57.3 mm in width and 112.2 mm in height. The spacing between cells and the air domain boundary is 7.3 mm. The batteries were purchased from Guangzhou Hao Ming New Energy Technology Co., LTD. (Guangzhou, China).

2.2. Battery Heat Generation Model

The mechanism of heat generation in batteries is the research basis of battery thermal management technology. Battery performance may be affected by a variety of environmental factors, such as high and low temperatures, charge and discharge rates, and usage status, which all lead to heat generation inside the battery. Excessive heating can negatively affect the battery’s performance and lifespan, potentially leading to thermal runaway incidents. Therefore, it is necessary to consider how to reasonably control the battery temperature in battery design and manufacturing stage, which ensures a normal operation of battery. The heat transfer mechanisms in the battery include conduction, convection, and radiation. In the simulation study, due to the closed environment inside the battery, the temperature gap between the battery surface and the surrounding environment is minimaland thermal radiation is not the main method of heat dissipation, so the effect of thermal radiation is ignored in the simulation process. The battery’s internal structure is intricate, and its heat generation is characterized by a transient heat transfer process. For the sake of simplifying the mathematical model, the following assumptions are made about the physical properties of the battery [24,25].
  • The materials inside the battery are isotropic, and they have uniform physical properties, the same density, and the same physicochemical properties everywhere.
  • The chemical reactions inside the battery are idealized as simple electrochemical reactions, ignoring the complex multiphase reactions and electrochemical catalysis inside the battery.
  • The current density and internal heat generation in the battery are uniformly distributed during charging and discharging.
It is assumed that the battery’s specific heat capacity and thermal conductivity remain constant. The equation for the thermal conductivity of the battery is presented in Equation (1):
p c p T t = λ r 1 r r r T r + λ φ 1 r 2 2 T φ 2 + λ z 2 T z 2 + q .
The initial and boundary conditions are specified in Equation (2):
T x , y , z = T 0 λ Y n | Γ = h T T a m b | Γ ,
where q represents the battery’s heat generation rate, p represents the battery density, c p represents the specific heat capacity, T represents the battery temperature, Tamb represents the ambient temperature, t represents time, and λ represents the thermal conductivity of the battery in the three directions of the cylindrical coordinate system. The rate of heat generation in the battery is calculated using the classical model proposed by Bernardi et al. in 1985, as shown in Equation (3) [26]:
q = 1 v E U + T E T = 1 V I 2 R j + R p + I T E T ,
where V represents the battery volume, E is the open-circuit voltage, U is the operating voltage, and T is the battery temperature. The heat generation rate of the battery is determined by modeling the relationship between equivalent internal resistance, entropy heat coefficient, and state of charge using a polynomial function.

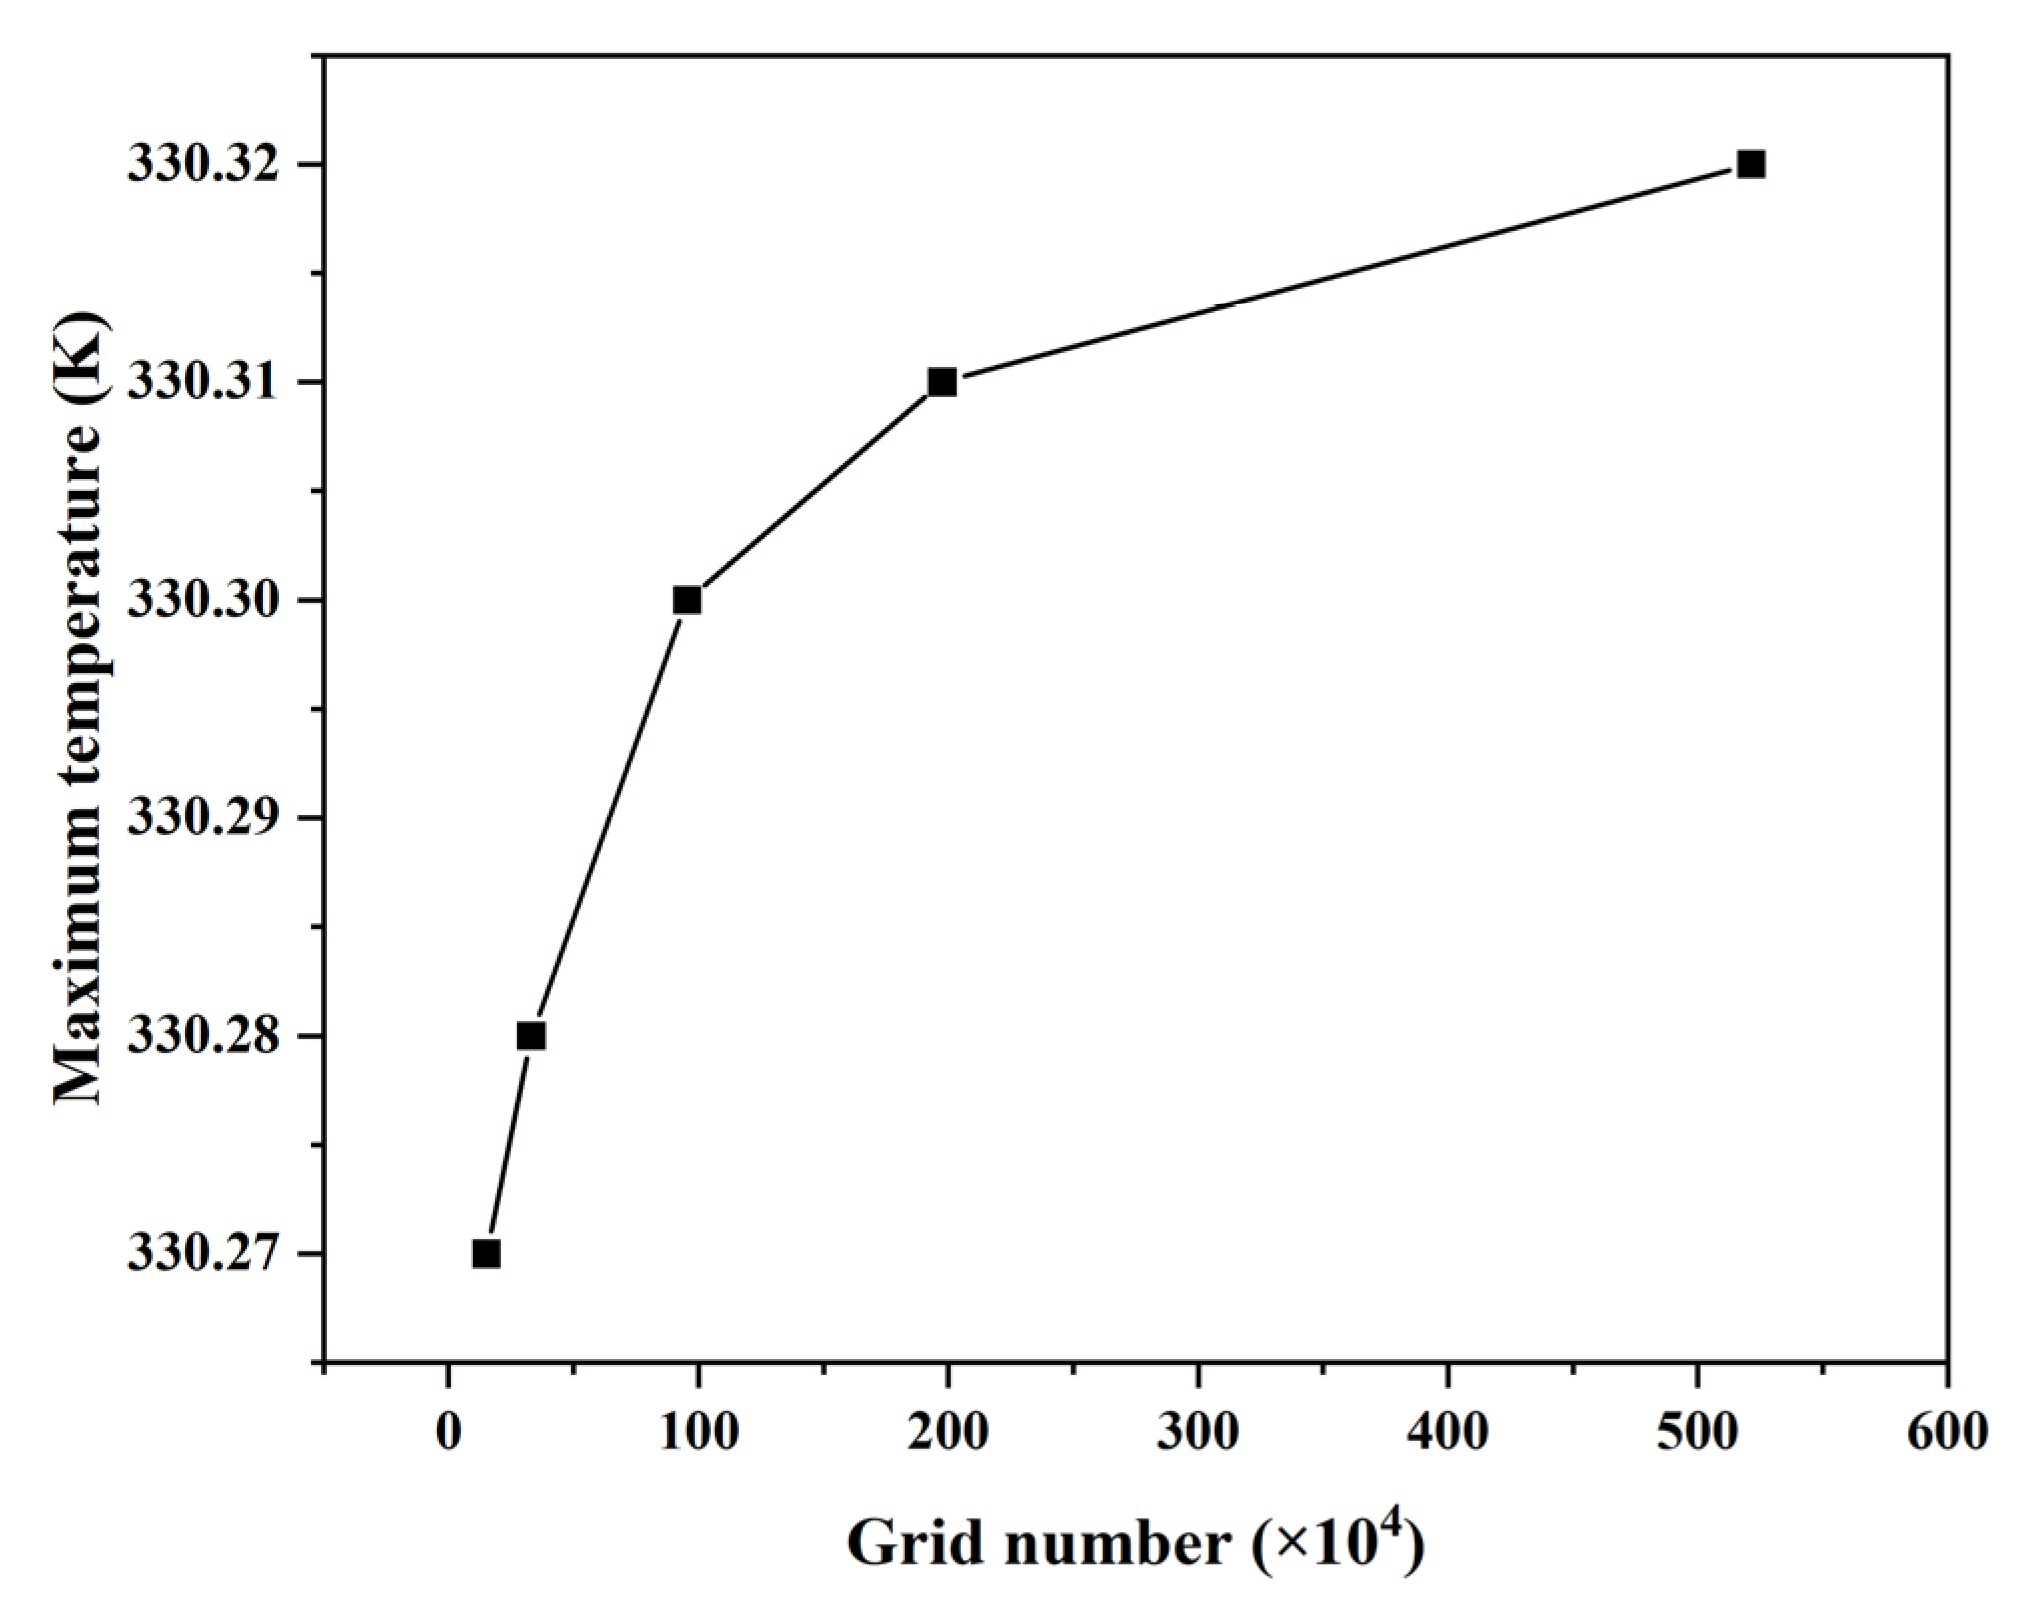
2.3. Simulation Method

A three-dimensional model of a square battery was created using the commercial CFD software ANSYS Fluent (FLUENT 2021R1), employing the finite volume method. The time-dependent flow problem was solved using the governing equations, including the continuity Equation (4) and the momentum conservation Equation (5), while the energy conservation Equation (6) addressed the thermal problem of the airflow [27].
· v = 0 ,
ρ d v d t = p + μ 2 v ,
ρ c T t + · ρ c v T = · K T ,
where k and c represent the physical properties of air: density, dynamic viscosity, thermal conductivity, and specific heat, respectively; and p, T, and v denote the static pressure, temperature, and velocity of the air. A standard k–ε turbulence model was chosen for the airflow field, and the semi-implicit method of consistency of pressure chain equations (SIMPLE) was used to solve the governing equations. Second-order headwinds were used for spatial discretization of pressure, momentum, energy, and turbulence terms. The heating rate of the battery was loaded with a fixed value calculated by the formula. Discharge multiplier of 2 C. The time step was 5 s and the maximum iteration step was 500 steps. The mass inflow boundary condition was applied at the inlet, while the pressure outlet boundary condition was set at the outlet. All walls were modeled with no-slip boundary conditions, and standard wall functions were used.
To ensure the accuracy of the calculations, grid independence validation tests were carried out. The validation results for the maximum temperature are presented in Figure 2. When the number of grids increased from 955,015 to 1,976,296, the maximum temperature change in the battery pack was less than 1%. To ensure simulation accuracy and shorten the calculation time, 955,015 grids were selected.

3. Results and Discussion

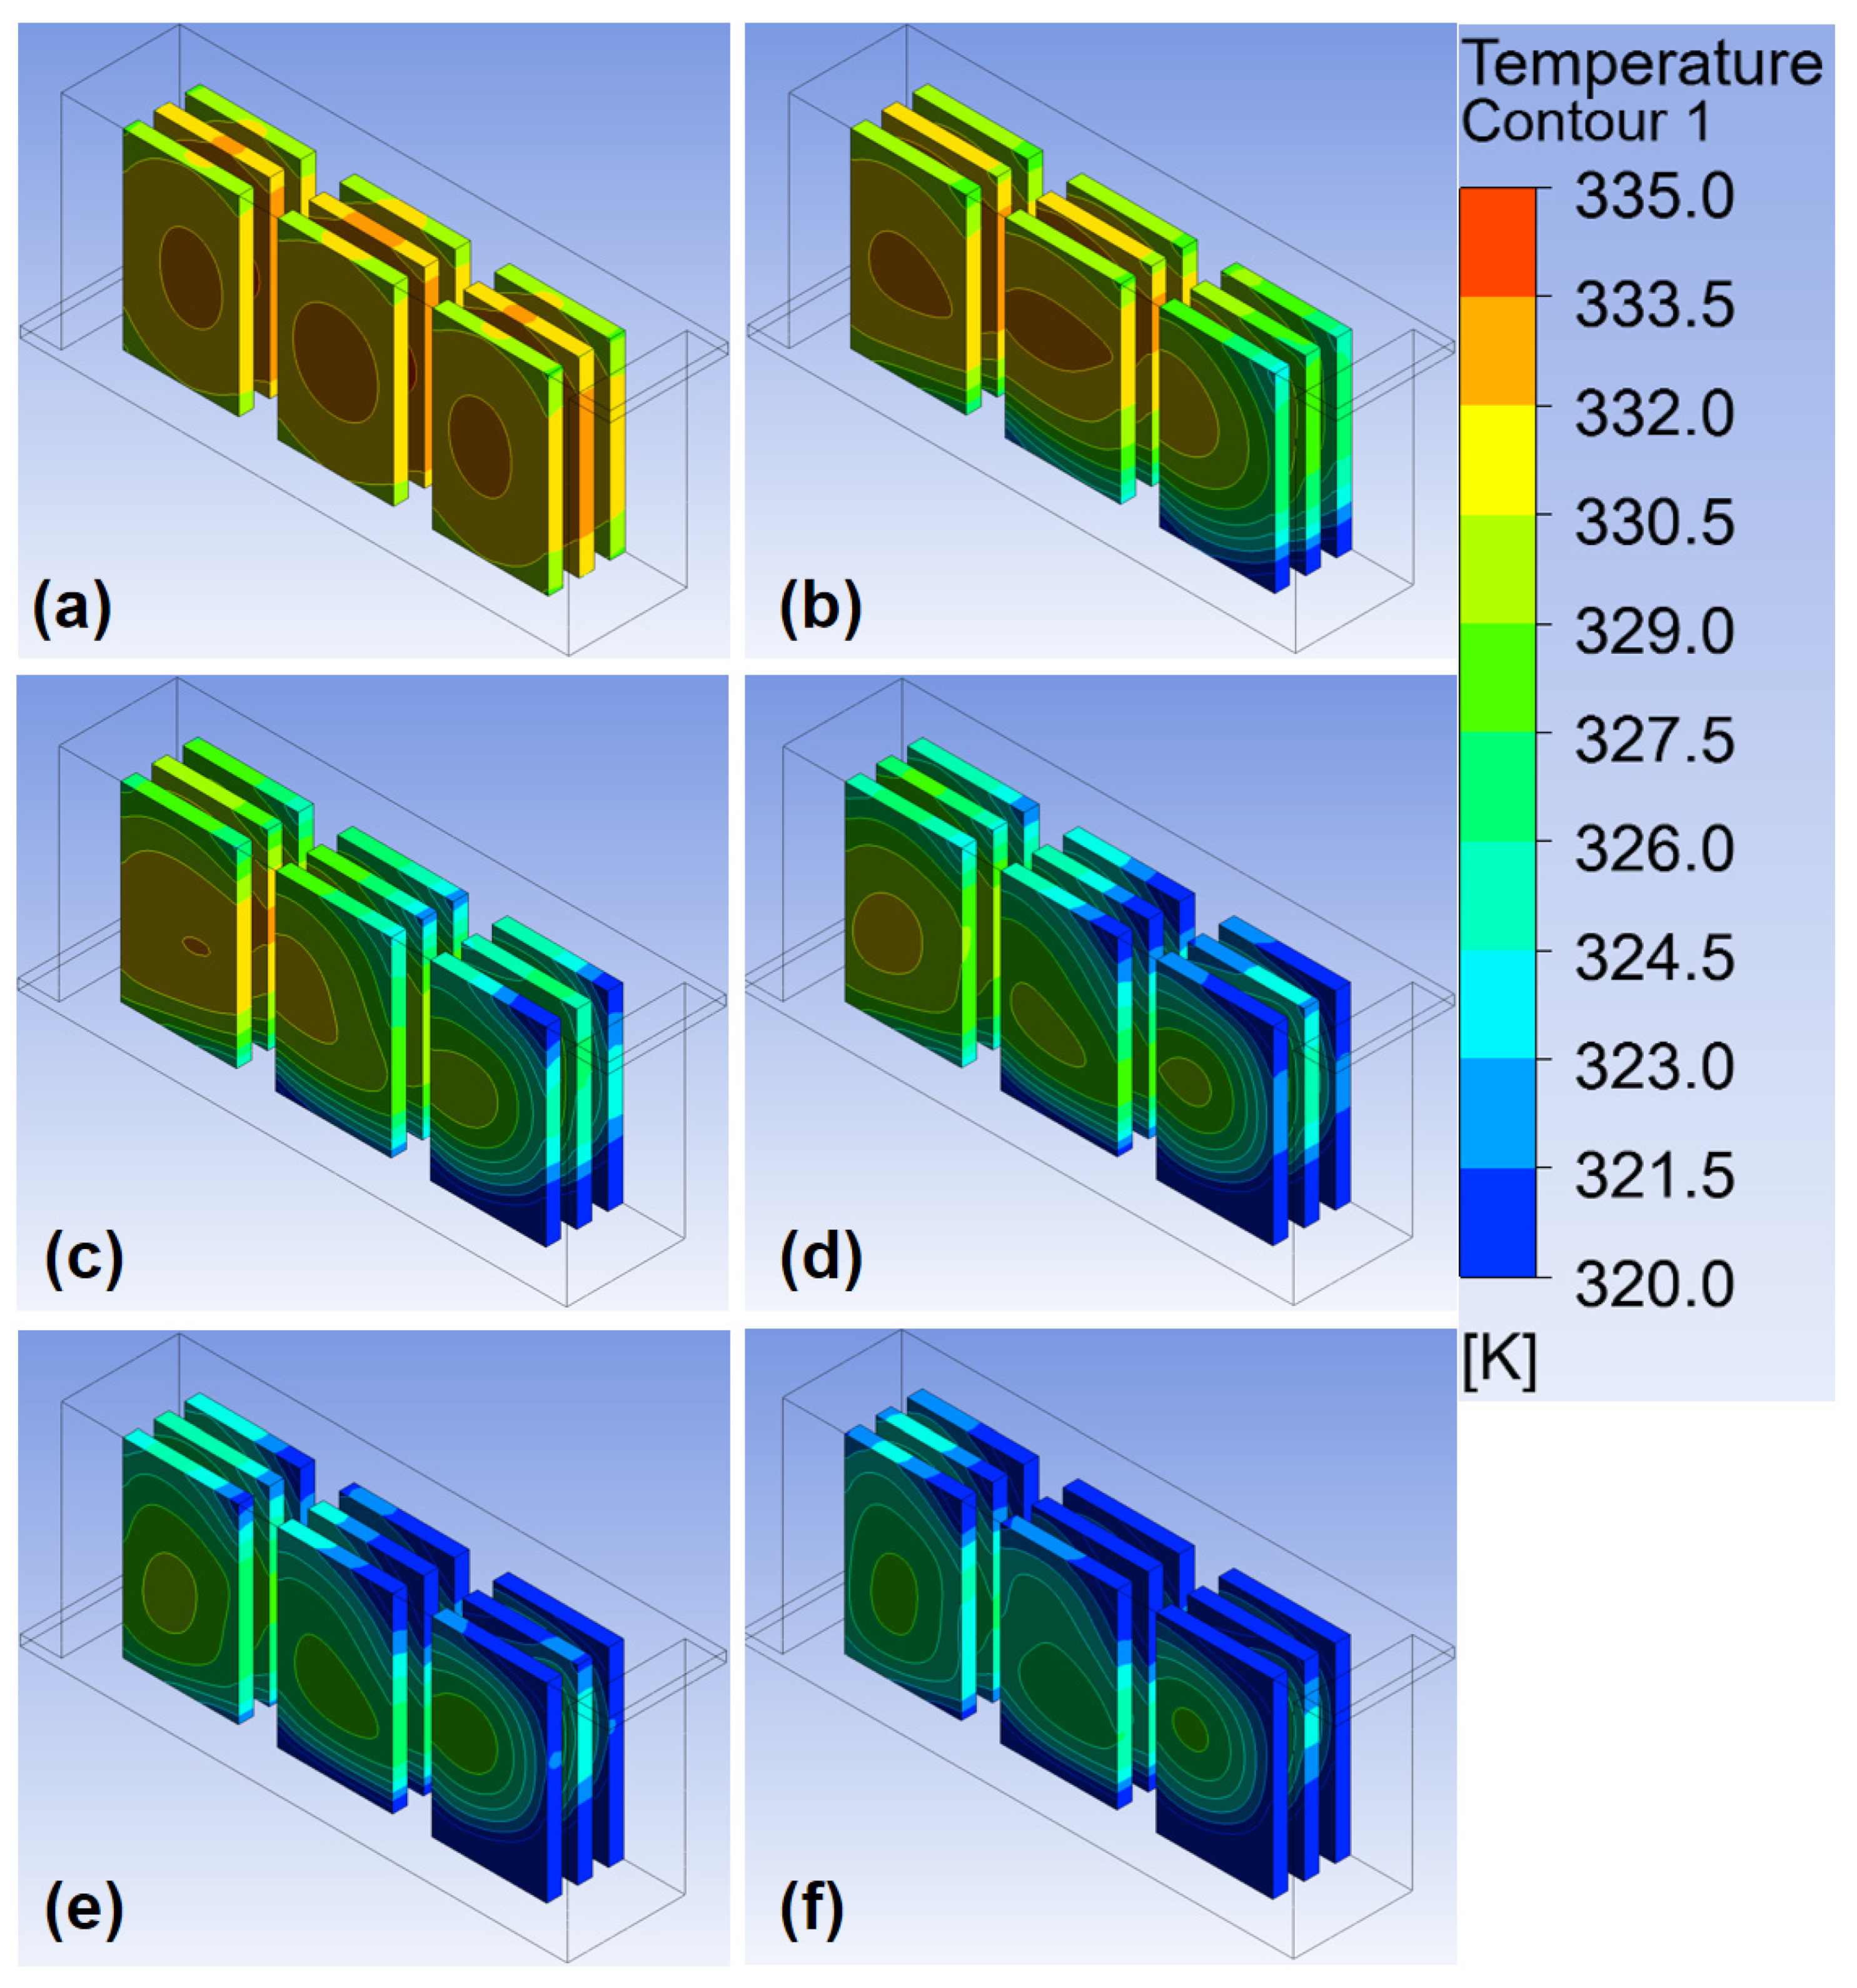
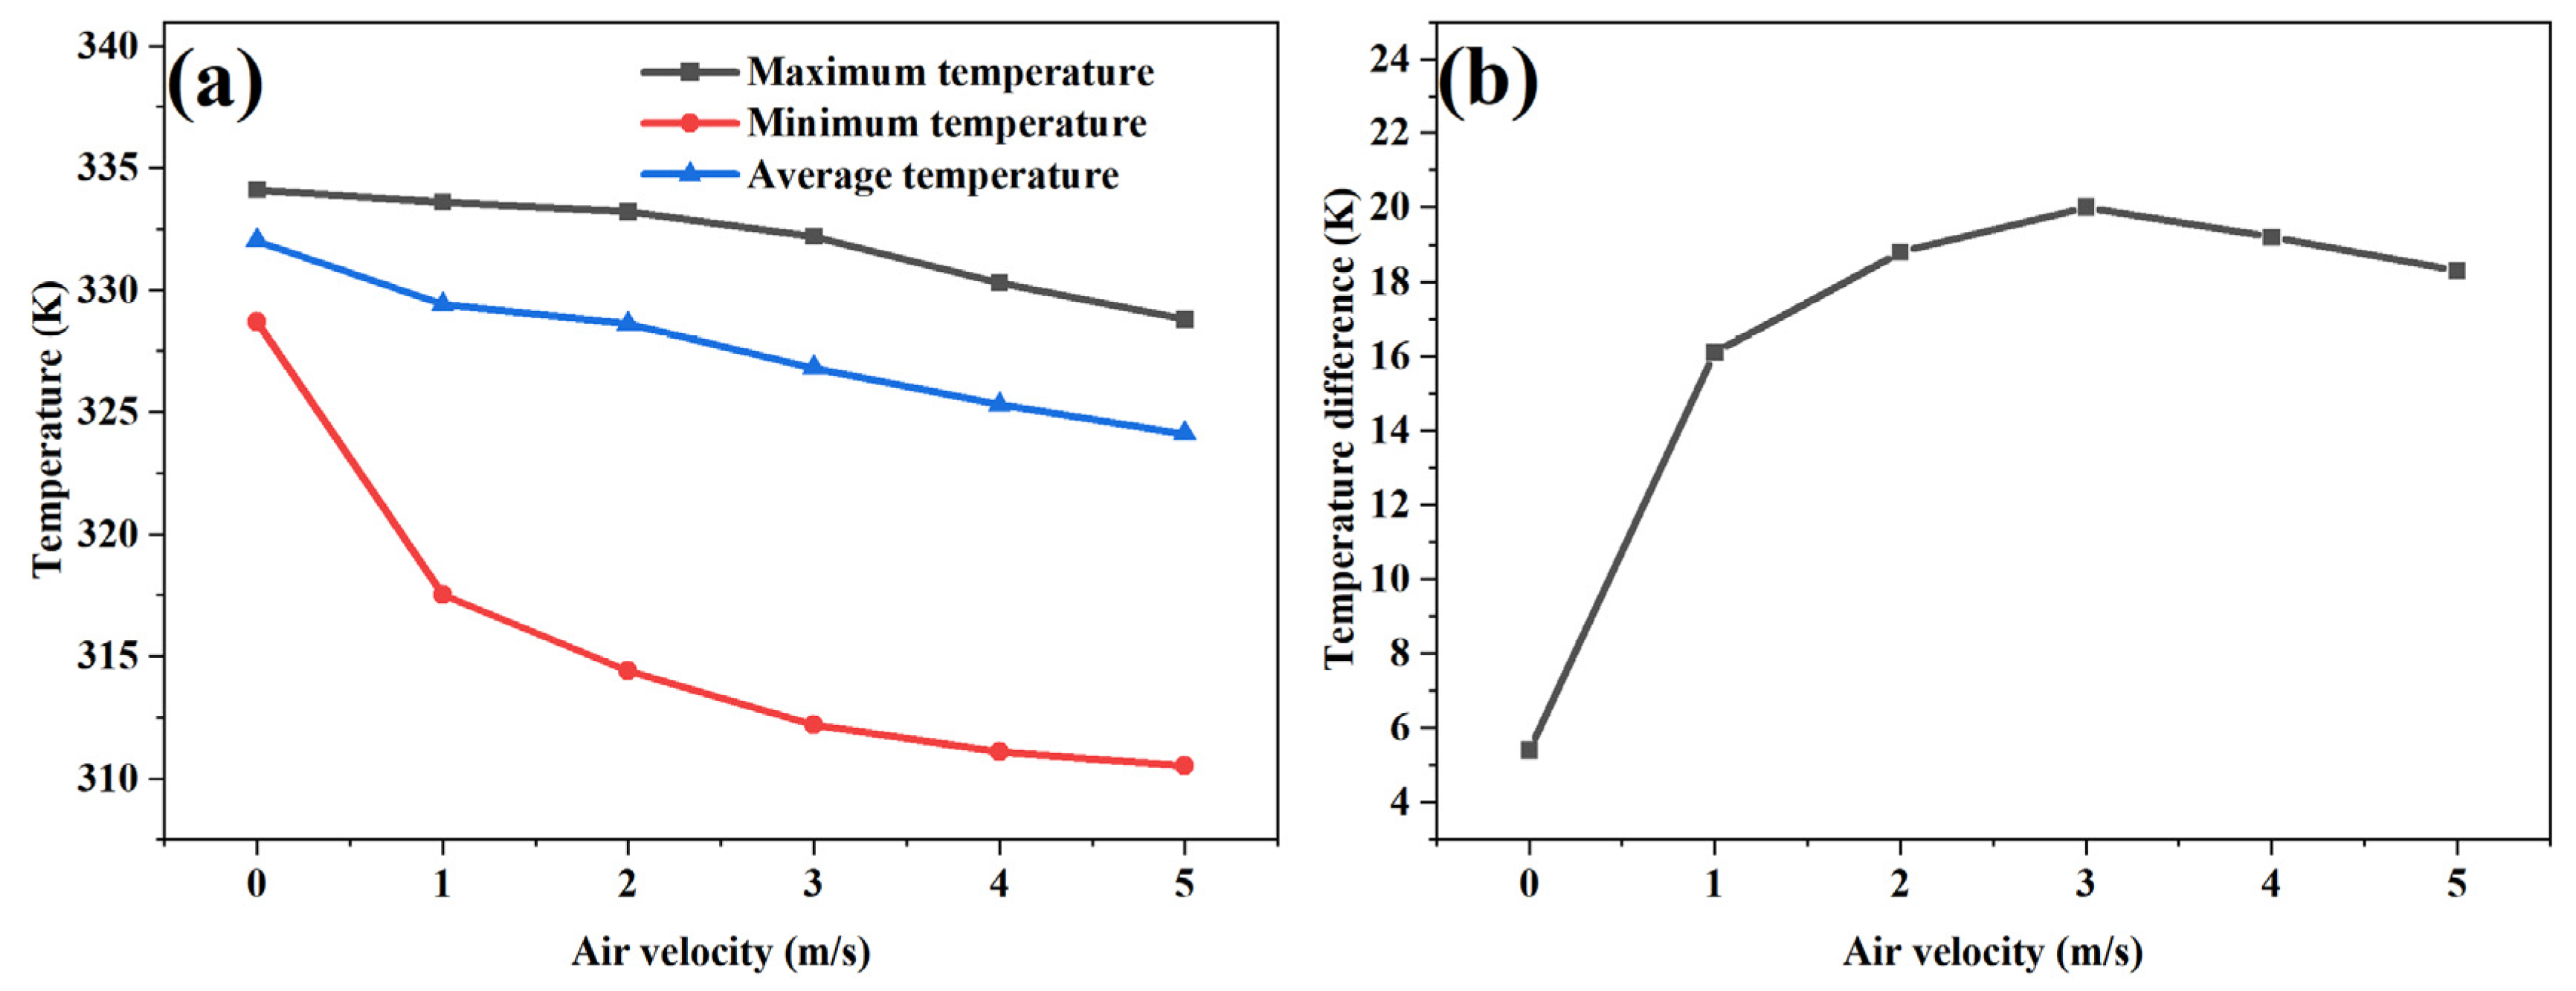
3.1. Effect of Inlet Air Velocity on Battery Temperature

The battery pack consisted of a 3 × 3 arrangement of cells, with the inlet and outlet positioned beneath the centers of opposite sides of the pack. The sizes of the inlet and outlet were 73 mm × 5 mm. In response to the choice of air inlet and outlet sizes at the start, the 73 mm width was determined primarily based on the width and spacing of the batteries so that the left and right widths were consistent with the spacing of the batteries, and the height of 5 mm was based on the balance between a compact system design and effective airflow distribution. This dimension ensures that the air velocity stays within a range that supports effective cooling while reducing the pressure drop and energy consumption of the cooling system. The inlet air velocities were set at 1, 2, 3, 4, and 5 m/s. Figure 3 shows the temperature distribution of the battery pack at the end of discharge for different air velocities. The highest battery temperature was near the air inlet. The temperature decreased toward the outlet, and the center of the battery showed the highest temperature. As the air velocity increased, the decrease orders in which the battery temperature were near upper terminal, near the bottom, and near the center. At an air velocity of 1 m/s, the airflow was laminar. At 2 m/s, the airflow transitioned, and at velocities of 3, 4, and 5 m/s, the airflow became turbulent. With an increase in air velocity, the airflow state was transformed from laminar to turbulent, which was conducive to investigating the relationship between air velocity and heat dissipation ability. When the air velocity was 1 m/s, the flow was laminar, characterized by smooth and orderly fluid motion with minimal mixing between adjacent layers. At this stage, heat transfer is primarily governed by conduction and convection near the surface of the battery, resulting in relatively lower heat dissipation efficiency. As the air velocity reached 2 m/s, the airflow transitioned into a transitional state. In this regime, some turbulence began to develop, enhancing the mixing of air layers and thus increasing the convective heat transfer coefficient. However, the flow was not fully turbulent, and the heat dissipation improvement remained moderate. When the air velocity reached 3 m/s and above (4 m/s and 5 m/s), the airflow became fully turbulent. Turbulent flow is characterized by chaotic and irregular fluid motion, which promotes the significant mixing of air and higher momentum transfer. This boosts the convective heat transfer rate, enhancing heat removal from the battery surface. The transition from laminar to turbulent flow is vital since turbulent flow greatly improves the heat dissipation capacity. This highlights the importance of selecting the right air velocity to balance effective heat dissipation with energy consumption. The observed flow regime transitions (from laminar to turbulent) also provide a framework for understanding the varying cooling efficiency under different air velocities.
The temperature variations in the battery at various inlet air velocities are depicted in Figure 4a. With the increase in airflow velocity, the maximum, minimum, and average temperatures of the battery pack gradually reduced. In the absence of air cooling, the maximum temperature of the battery pack was 334.1 °C, with a maximum temperature difference of 5.4 °C. There was a critical value between 3 m/s and 4 m/s. When air velocity was more than 2 m/s, its cooling ability was greater, which was caused by the airflow transitioning from laminar flow to turbulent flow. Figure 4b shows the maximum temperature difference in the battery pack at different air intake velocities. As the air velocity increased, the maximum temperature difference initially rose and then decreased. At an airflow velocity of 3 m/s, the maximum temperature difference inside the battery pack was approximately 20 K. Considering the need to minimize the battery pack size, and based on both the maximum temperature and temperature difference, an airflow rate of 4.0 m/s was chosen.

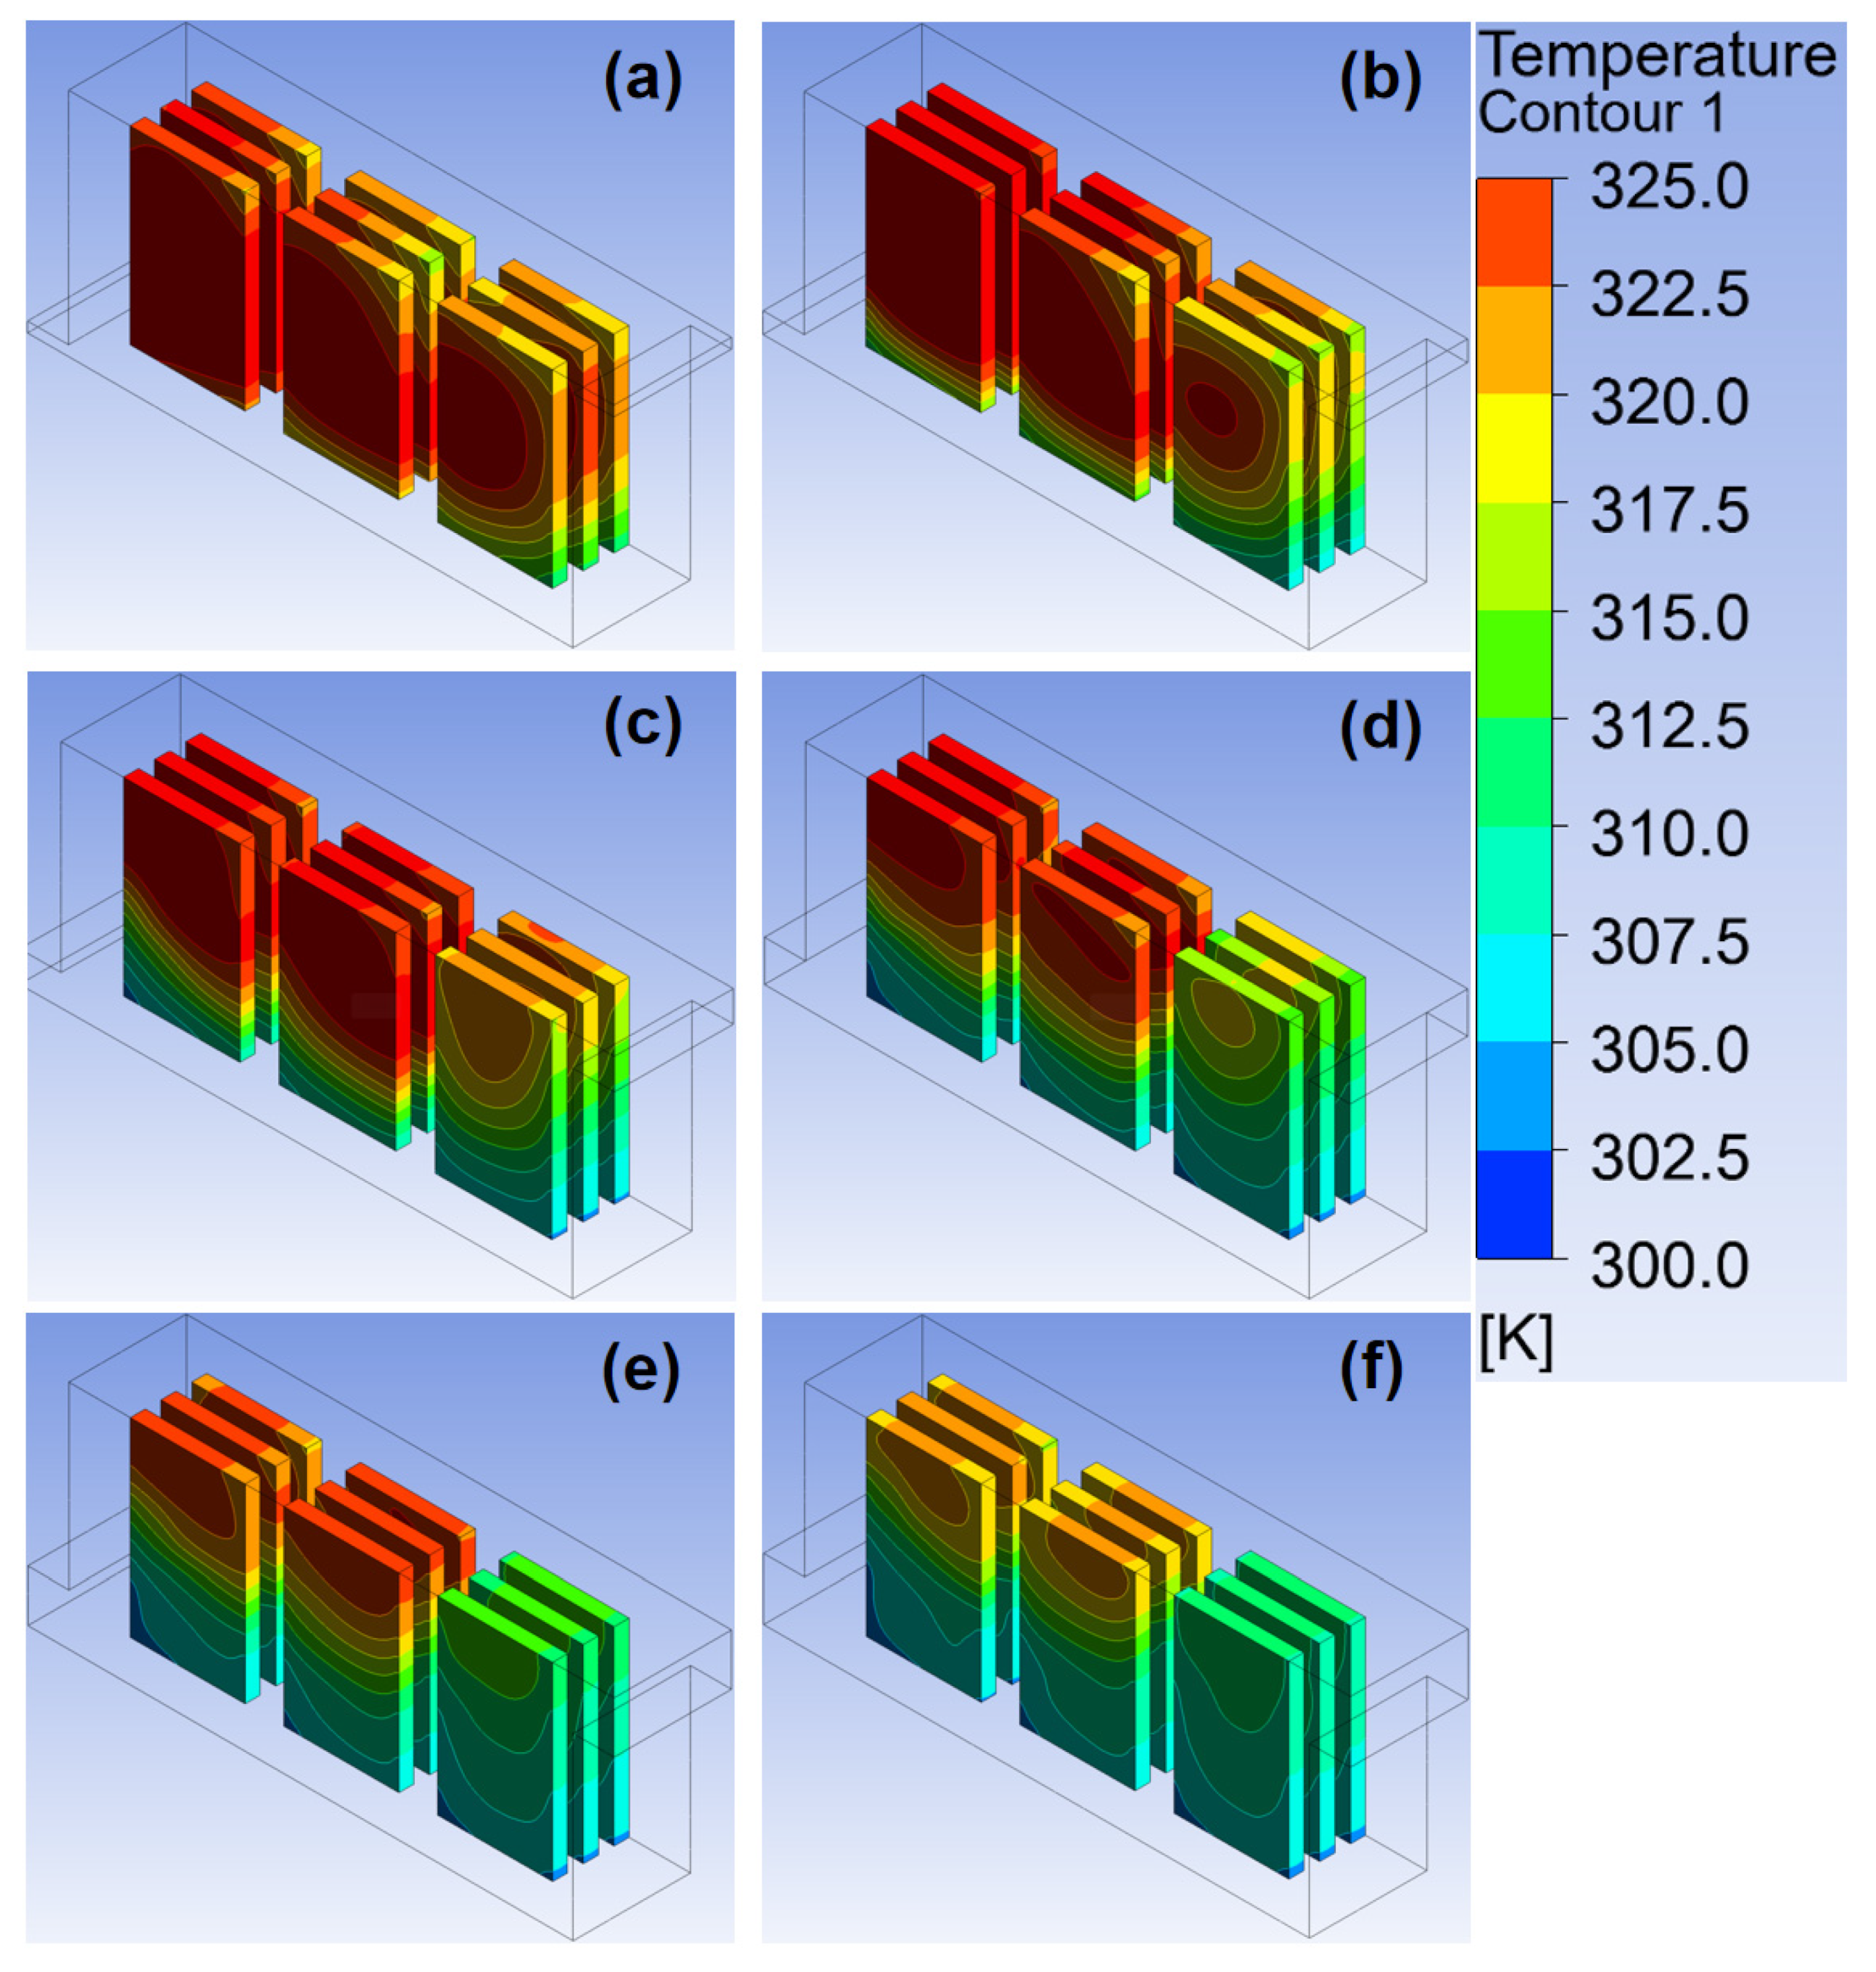
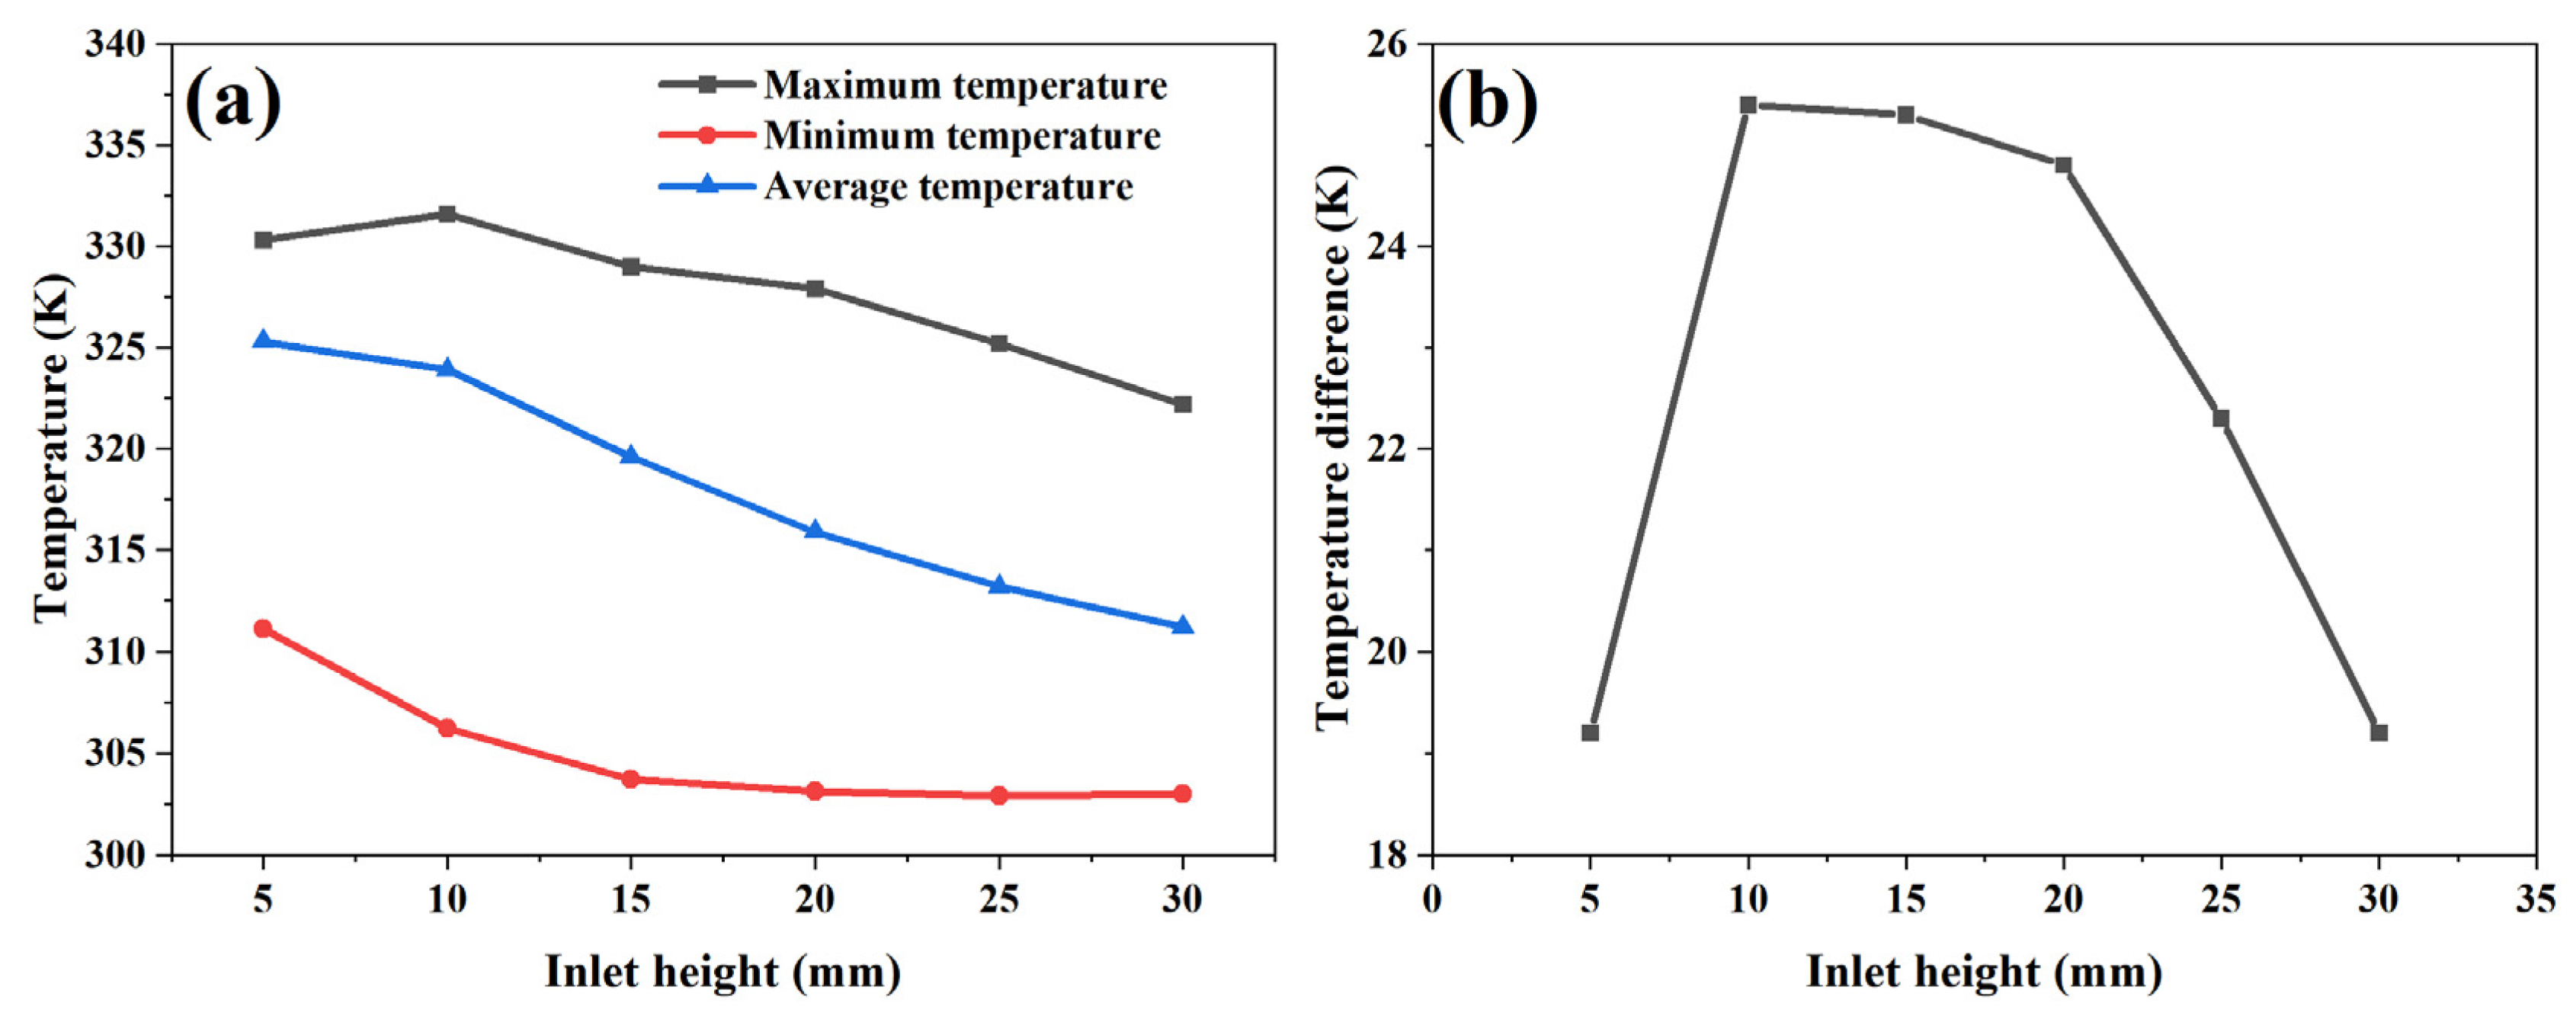
3.2. Effect of Inlet Size on the Temperature of Battery Pack

The heat dissipation of battery pack was investigated by varying the air inlet dimensions. The width of the air inlet was fixed (73 mm), and the heights were set to 5, 10, 15, 20, 25, and 30 mm. The air outlet had the same dimensions as the air inlet, meaning the area ratio between them was 1:1. The air velocity was set at 4 m/s. The widths of both the air inlet and outlet remained constant, while the height was increased from 5 mm to 30 mm in 5 mm increments.
Figure 5 illustrates the temperature distribution of the battery pack at the end of the discharge process, with an air velocity of 4 m/s. The overall temperature decreased as the inlet height increased. For the same battery, the temperature gradually decreased from the upper terminal to the bottom. The overall temperature of the battery pack stayed high when the inlet height was 5 mm or 10 mm. However, when the inlet height exceeded 15 mm, the lowest temperature inside the battery pack remained almost unchanged.
Figure 6 illustrates the temperature variation and the maximum temperature difference in the battery pack. As shown in Figure 6a, the maximum temperature increased and then decreased as the size of the air inlet increased. During this process, the minimum temperatures remained between 311 K and 303 K, and the average temperatures showed a decreasing trend. As depicted in Figure 6b, the maximum temperature difference decreased with larger inlet sizes, reaching its lowest value of 19.2 K when the inlet heights were 5 mm and 30 mm. Considering the maximum temperature, temperature difference, and the advantage of minimizing the overall size and weight, an air inlet and outlet size of 73 × 25 mm was selected. Figure 6b illustrates that the maximum temperature difference diminished as the inlet size increased. When the battery pack’s inlet heights were 5 mm and 30 mm, the maximum temperature difference reached its lowest value of 19.2 K. Taking into account the maximum temperature, temperature difference, and the benefit of minimizing the overall size and weight, a 73 × 25 mm air inlet and outlet size was chosen.

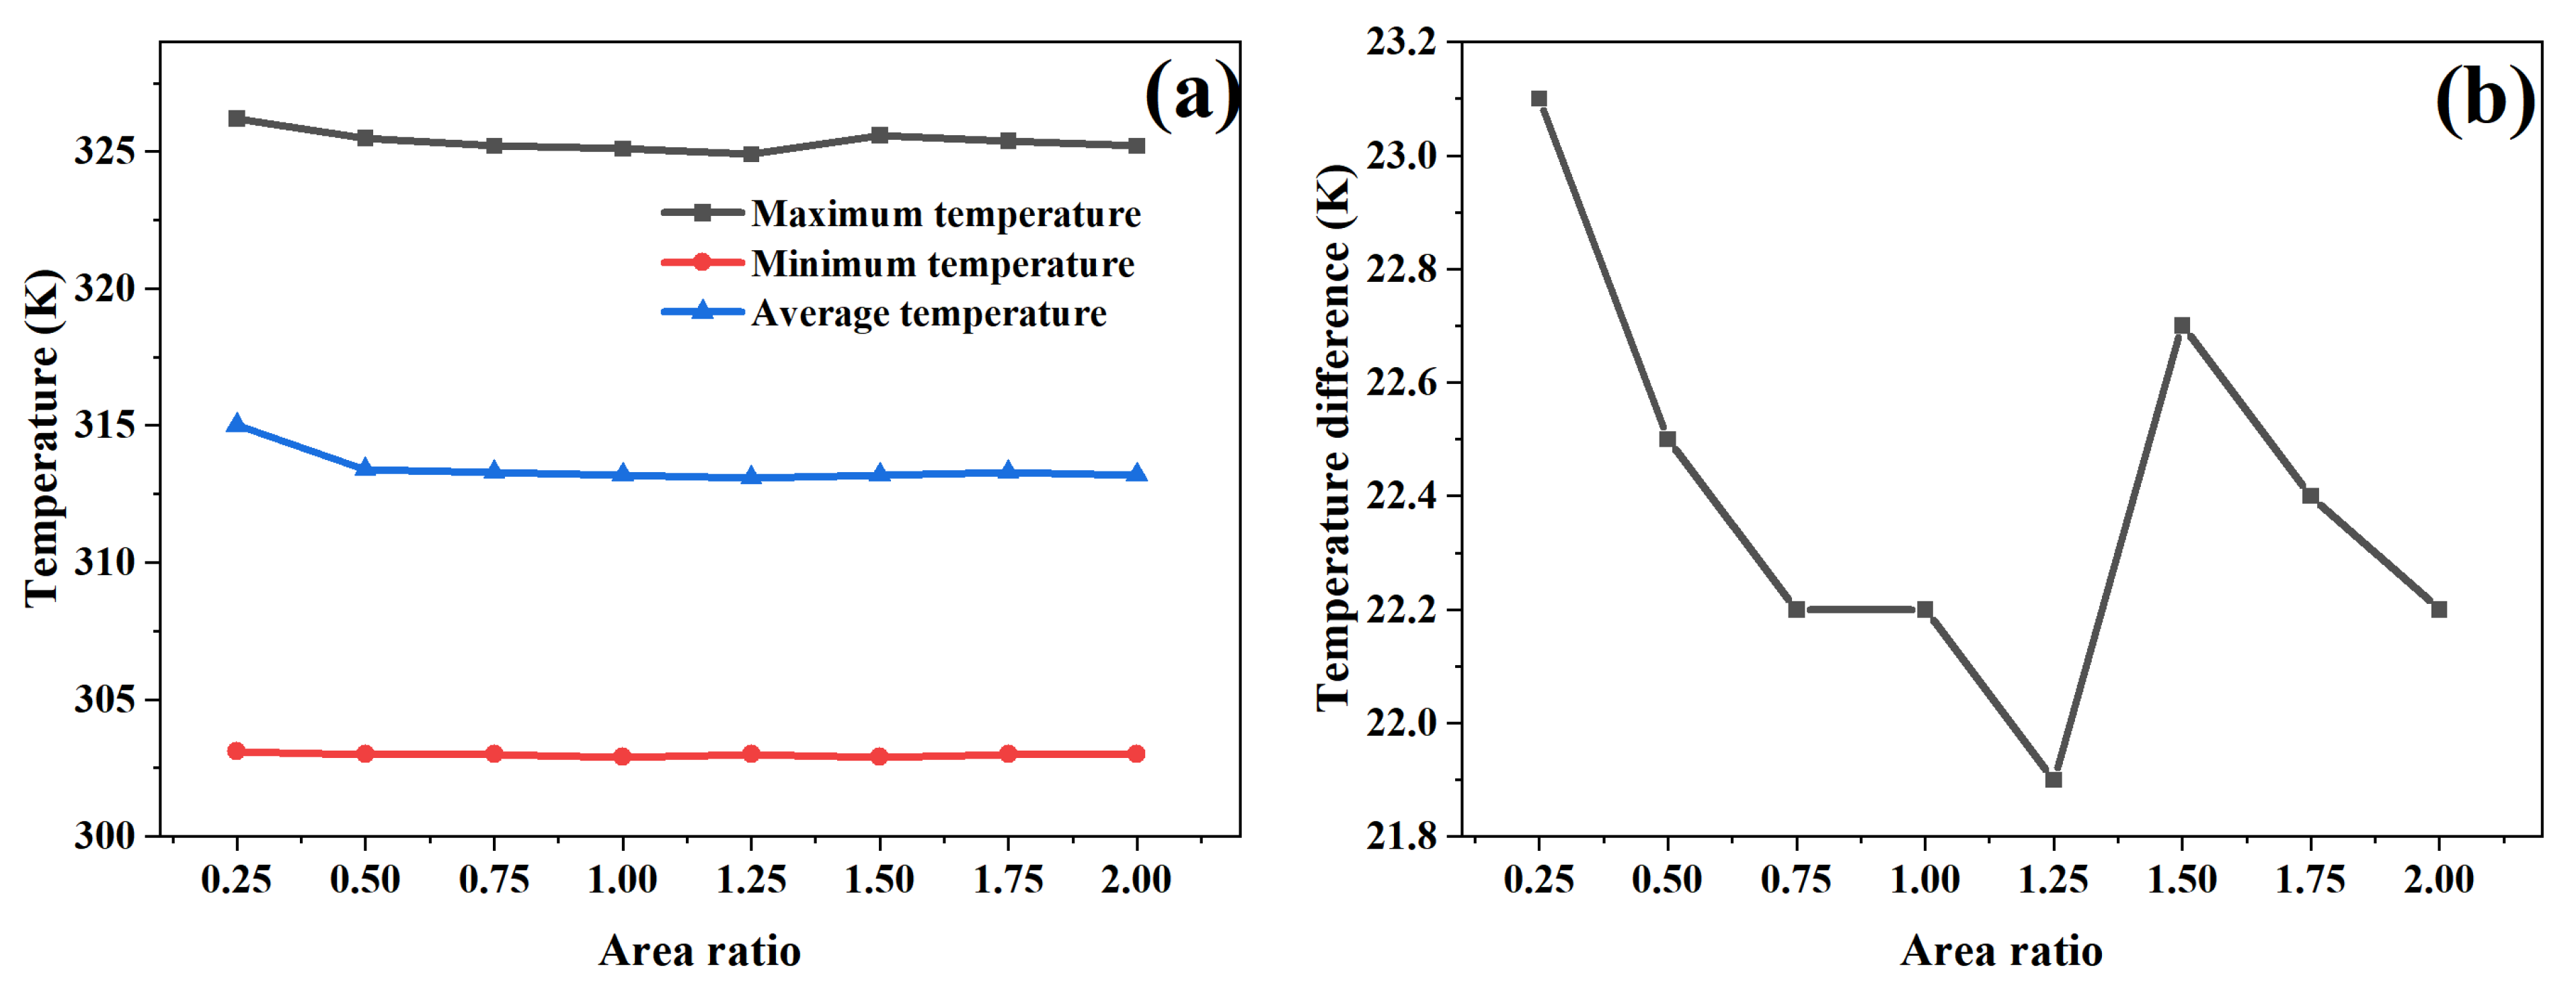
3.3. Effect of Inlet and Outlet Area Ratio on Heat Dissipation of Battery

The area ratio between the inlet and outlet was kept constant at 1, and this ratio was altered to examine how it influenced the heat dissipation of the battery pack. The dimensionless number φ was defined as the area ratio between the inlet and outlet of the battery pack, and can be calculated using Equation (7):
φ = S i n l e t S o u t l e t ,
where Sinlet was the inlet area, Soutlet was the outlet area.
The widths of the inlet and outlet were set to 73 mm, and the inlet height was set to 25 mm. The relationship between the inlet/outlet area ratio (φ) and outlet height is shown in Table 2.
Figure 7 illustrates the temperature distribution of the battery pack at the end of discharge for various inlet and outlet area ratios. The temperature distribution of the battery pack remained similar, with no significant impact on the overall temperature due to changes in the area ratio. The lowest temperature was observed at the bottom of the outlet, while the highest temperature was at the top of the inlet.
Figure 8 displays the temperature changes in the battery pack as the inlet/outlet area ratio increased from 0.25 to 2. As shown in Figure 8a, the maximum temperature of the battery pack first decreased and then increased with the rise in φ. The minimum temperature occurred when φ was 1.25, reaching 324.8 K. The average temperature of the battery pack dropped as φ increased from 0.25 to 0.5. The minimum temperature remained at approximately 303 K. Simulation results indicated that the optimal heat dissipation of the battery pack occurred when the air outlet size was 73 mm × 20 mm, and the inlet-to-outlet area ratio was 1.25. Figure 8b shows the maximum temperature difference in the battery pack at various inlet and outlet ratios. As the φ value increased, the maximum temperature difference decreased continuously to the minimum value of 21.9 K at φ = 1.25, then increased at φ = 1.5, and decreased again at higher φ values. Meanwhile, the maximum temperature within the battery pack was 324.9 K.

4. Conclusions

In this study, a battery pack consisting of nine lithium-ion cells was examined to analyze the effects of inlet air velocity, inlet size, and the inlet/outlet area ratio on heat dissipation. By constructing a battery pack model with a parallel air cooled system, the relationship between these factors and the heat dissipation performance of the battery pack was elucidated. The optimal heat dissipation was achieved at an inlet air velocity of 4 m/s, an inlet size of 73 mm × 25 mm, and an inlet/outlet area ratio of 1.25. Under these conditions, the maximum temperature and maximum temperature difference were 324.9 K and 21.9 K, respectively. Air cooling significantly reduces the maximum temperature of the battery pack compared to no air cooling, but it also increases the maximum temperature difference. Therefore, enhancing the temperature uniformity of the air-cooled system is essential.

Future Work and Design Adaptability

The cooling design proposed in this study was based on a battery pack consisting of multiple cells with uniform capacity. If the battery pack were redesigned to consist of fewer cells with much higher capacities, the same duct area could still be employed, but adjustments might be required to address the increased heat generation and altered airflow dynamics.
Higher-capacity cells generate more heat due to their higher energy throughput, which increases the demand for efficient heat dissipation. The current duct area could accommodate the increased thermal load by increasing the airflow velocity, but this might raise the system’s pressure drop and energy consumption. Modifications to airflow distribution, such as the introduction of baffles or flow guides, might also be necessary to ensure uniform cooling and prevent hotspots.
Furthermore, the reduced number of cells could result in less surface area available for heat dissipation, further emphasizing the need for enhanced thermal management. Techniques such as localized cooling enhancements (e.g., fins or phase change materials) or optimizing the inlet and outlet areas could be explored to maintain system efficiency.
These considerations highlight the scalability of the proposed design and its potential adaptability to battery packs with different configurations. Future studies could investigate these modifications in greater detail to extend the applicability of this design to a wider range of battery systems.

Author Contributions

Conceptualization, Z.P.; Methodology, L.Y.; Software, M.Z.; Formal analysis, Q.X.; Investigation, L.Y.; Resources, X.C.; Writing—original draft, L.Y.; Writing—review & editing, Z.P.; Supervision, M.Z. and Q.X.; Project administration, Q.S.; Funding acquisition, M.Z. All authors have read and agreed to the published version of the manuscript.

Funding

This work was financially supported by Civil Aviation Safety Capacity Building Project of China (NO: MHAQ2024035), Fundamental Research Funds for the Central Universities (NO: 24CAFUC01008, 24CAFUC10163, 202310624002S).

Data Availability Statement

The original contributions presented in the study are included in the article, further inquiries can be directed to the corresponding author.

Conflicts of Interest

The authors declare no conflict of interest.

References

  1. Wang, Y.; Feng, X.; Huang, W.; He, X.; Wang, L.; Ouyang, M. Challenges and opportunities to mitigate the catastrophic thermal runaway of high-energy batteries. Adv. Energy Mater. 2023, 13, 2203841. [Google Scholar] [CrossRef]
  2. Chen, X.; Zhang, X.; Wang, H.; Jia, J.; Xie, S.; Zhi, M.; Fu, J.; Sun, Q. Influence of ambient pressure and heating power on the thermal runaway features of the lithium-ion battery. J. Electrochem. Energy Convers. Storage 2021, 18, 021014. [Google Scholar] [CrossRef]
  3. Thakur, A.K.; Sathyamurthy, R.; Velraj, R.; Saidur, R.; Pandey, A.; Ma, Z.; Singh, P.; Hazra, S.K.; Sharshir, S.W.; Prabakaran, R.; et al. A state-of-the art review on advancing battery thermal management systems for fast-charging. Appl. Therm. Eng. 2023, 226, 120303. [Google Scholar] [CrossRef]
  4. Huang, Y.; Wei, C.; Fang, Y. Numerical investigation on optimal design of battery cooling plate for uneven heat generation conditions in electric vehicles. Appl. Therm. Eng. 2022, 211, 118476. [Google Scholar] [CrossRef]
  5. Yang, C.; Xi, H.; Wang, M. Structure optimization of air cooling battery thermal management system based on lithium-ion battery. J. Energy Storage 2023, 59, 106538. [Google Scholar] [CrossRef]
  6. Mo, C.; Xie, J.; Zhang, G.; Zou, Z.; Yang, X. All-climate battery thermal management system integrating units-assembled phase change material module with forced air convection. Energy 2024, 294, 130642. [Google Scholar] [CrossRef]
  7. Weragoda, D.M.; Tian, G.; Burkitbayev, A.; Lo, K.-H.; Zhang, T. A comprehensive review on heat pipe based battery thermal management systems. Appl. Therm. Eng. 2023, 224, 120070. [Google Scholar] [CrossRef]
  8. Zhao, Y.; Zhang, X.; Yang, B.; Cai, S. A review of battery thermal management systems using liquid cooling and PCM. J. Energy Storage 2024, 76, 109836. [Google Scholar] [CrossRef]
  9. Jiang, K.; Liao, G.; Jiaqiang, E.; Zhang, F.; Chen, J.; Leng, E. Thermal management technology of power lithium-ion batteries based on the phase transition of materials: A review. J. Energy Storage 2020, 32, 101816. [Google Scholar] [CrossRef]
  10. Mahmud, M.; Rahman, K.S.; Rokonuzzaman, M.; Habib, A.A.; Islam, M.R.; Motakabber, S.M.; Channumsin, S.; Chowdhury, S. Lithium-ion battery thermal management for electric vehicles using phase change material: A review. Results Eng. 2023, 20, 101424. [Google Scholar] [CrossRef]
  11. Zeng, W.; Ma, C.; Hu, S.; Li, S.; Zhang, Y. The performance investigation and optimization of reciprocating flow applied for liquid-cooling-based battery thermal management system. Energy Convers. Manag. 2023, 292, 117378. [Google Scholar] [CrossRef]
  12. Zhi, M.; Fan, R.; Yang, X.; Zheng, L.; Yue, S.; Liu, Q.; He, Y. Recent research progress on phase change materials for thermal management of lithium-ion batteries. J. Energy Storage 2022, 45, 103694. [Google Scholar] [CrossRef]
  13. Wang, Q.; Jiang, B.; Li, B.; Yan, Y. A critical review of thermal management models and solutions of lithium-ion batteries for the development of pure electric vehicles. Renew. Sustain. Energy Rev. 2016, 64, 106–128. [Google Scholar] [CrossRef]
  14. Kim, J.; Oh, J.; Lee, H. Review on battery thermal management system for electric vehicles. J. Appl. Therm. Eng. 2019, 149, 192–212. [Google Scholar] [CrossRef]
  15. Alihosseini, A.; Shafaee, M. Experimental study and numerical simulation of a Lithium-ion battery thermal management system using a heat pipe. J. Energy Storage 2021, 39, 102616. [Google Scholar] [CrossRef]
  16. Huang, R.; Li, Z.; Hong, W.; Wu, Q.; Yu, X. Experimental and numerical study of PCM thermophysical parameters on lithium-ion battery thermal management. Energy Rep. 2020, 6, 8–19. [Google Scholar] [CrossRef]
  17. Ding, Y.; Zheng, Y.; Li, S.; Dong, T.; Gao, Z.; Zhang, T.; Li, W.; Rao, S.; Xiao, Y.; Chen, Y.; et al. A review of battery thermal management methods for electric vehicles. J. Electrochem. Energy Convers. Storage 2023, 20, 021002. [Google Scholar] [CrossRef]
  18. Zhao, G.; Wang, X.; Negnevitsky, M.; Zhang, H. A review of air-cooling battery thermal management systems for electric and hybrid electric vehicles. J. Power Sources 2021, 501, 230001. [Google Scholar] [CrossRef]
  19. Behi, H.; Karimi, D.; Behi, M.; Ghanbarpour, M.; Jaguemont, J.; Sokkeh, M.A.; Gandoman, F.H.; Berecibar, M.; Van Mierlo, J. A new concept of thermal management system in Li-ion battery using air cooling and heat pipe for electric vehicles. Appl. Therm. Eng. 2020, 174, 115280. [Google Scholar] [CrossRef]
  20. Gao, Y.; Ji, W.; Chen, X. Numerical study on thermal management of air-cooling model for diamond, triangular and rectangular lithium-ion batteries of electric vehicles. Processes 2022, 10, 1104. [Google Scholar] [CrossRef]
  21. Wang, Y.-W.; Jiang, J.-M.; Chung, Y.-H.; Chen, W.-C.; Shu, C.-M. Forced-air cooling system for large-scale lithium-ion battery modules during charge and discharge processes. J. Therm. Anal. Calorim. 2019, 135, 2891–2901. [Google Scholar] [CrossRef]
  22. Chen, K.; Li, Z.; Chen, Y.; Long, S.; Hou, J.; Song, M.; Wang, S. Design of parallel air-cooled battery thermal management system through numerical study. Energies 2017, 10, 1677. [Google Scholar] [CrossRef]
  23. Mustafa, J. Effect of inlet and outlet size, battery distance, and air inlet and outlet position on the cooling of a lithium-ion battery pack and utilizing outlet air of cooling system to heat an air handling unit. J. Energy Storage 2022, 46, 103826. [Google Scholar] [CrossRef]
  24. Zhang, F.; Shi, Y.; He, Y.; Liu, P. Design and Optimization of an F-type Air-Cooling Structure for Lithium-Ion Battery of Electric Vehicle. Energy Technol. 2023, 11, 2300243. [Google Scholar] [CrossRef]
  25. Zhao, C.; Zhang, Y.; Du, X.; Zhao, J.; Hu, Y. Modeling and Analysis of the Drying Process of Lithium-Ion Battery Electrodes Based on Non-Steady-State Drying Kinetics. Processes 2023, 11, 3236. [Google Scholar] [CrossRef]
  26. Bernardi, D.; Pawlikowski, E.; Newman, J. A general energy balance for battery systems. J. Electrochem. Soc. 1985, 132, 5–12. [Google Scholar] [CrossRef]
  27. Li, W.; Xiao, M.; Peng, X.; Garg, A.; Gao, L. A surrogate thermal modeling and parametric optimization of battery pack with air cooling for Evs. Appl. Therm. Eng. 2019, 147, 90–100. [Google Scholar] [CrossRef]
Figure 1. Schematic diagram of air cooling thermal management system.
Batteries 11 00043 g001
Figure 2. Grid independence verification.
Batteries 11 00043 g002
Figure 3. Temperature distribution within the battery after discharge at different air velocities: (a) 0 m/s, (b) 1 m/s, (c) 2 m/s, (d) 3 m/s, (e) 4 m/s, and (f) 5 m/s.
Batteries 11 00043 g003
Figure 4. (a) Temperature change and (b) maximum temperature difference in battery pack at different air velocities.
Batteries 11 00043 g004
Figure 5. Temperature distribution within the battery after discharge at air velocity of 4 m/s for different inlet and outlet heights: (a) 5 mm, (b) 10 mm, (c) 15 mm, (d) 20 mm, (e) 25 mm, and (f) 30 mm.
Batteries 11 00043 g005
Figure 6. (a) Temperature change and (b) maximum temperature difference in battery pack at different inlet heights.
Batteries 11 00043 g006
Figure 7. Temperature distribution within the battery after discharge at different inlet and outlet area ratios: (a) 0.25, (b) 0.5, (c) 0.75, (d) 1.0, (e) 1.25, (f) 1.5, (g) 1.75, and (h) 2.0.
Batteries 11 00043 g007
Figure 8. (a) Temperature changes and (b) maximum temperature difference in battery pack at different inlet/outlet area ratios.
Batteries 11 00043 g008
Table 1. Specifications and characteristics of the commercial battery.
Specification [unit]Value
Thickness [mm]7.3
Width [mm]56.0
Length [mm]92.5
Densities [kg/m3]2776
Specific heat capacity [J/(kg·K)]1633
Radial thermal conductivity [W/(m·K)]0.94
Axial thermal conductivity [W/(m·K)]2.75
Tangential thermal conductivity [W/(m·K)]0.94
Nominal voltage [V]3.7
Nominal capacity [Ah]5
Internal resistance [mΩ]60
Table 2. The connection between the inlet/outlet area ratio and the outlet height.
φ0.250.50.7511.251.51.752
Inlet height (mm)2525252525252525
Outlet height (mm)1005033.3252016.714.312.5
Disclaimer/Publisher’s Note: The statements, opinions and data contained in all publications are solely those of the individual author(s) and contributor(s) and not of MDPI and/or the editor(s). MDPI and/or the editor(s) disclaim responsibility for any injury to people or property resulting from any ideas, methods, instructions or products referred to in the content.

