Article

The Impact of C-Rate, Float Charging and Temperature on Pouch Lithium-Ion Battery Swelling

1
Center for Advanced Life Cycle Engineering (CALCE), University of Maryland, College Park, MD 20742, USA
2
Global Institute of Future Technology, Shanghai Jiao Tong University, Shanghai 200240, China
3
Department of Electrical Engineering, Chungnam National University, Daejeon 34134, Republic of Korea
*
Author to whom correspondence should be addressed.
Batteries 2025, 11(11), 419; https://doi.org/10.3390/batteries11110419
Submission received: 11 October 2025 / Revised: 10 November 2025 / Accepted: 11 November 2025 / Published: 14 November 2025

Abstract

Swelling in pouch batteries poses reliability issues and safety hazards, resulting in product damage, fires, and explosions. This study examines swelling based on the impact of C-rate and temperature during charge–discharge tests, and upper voltage limit and temperature during constant voltage/float charging tests. Internal cell dynamics related to swelling are analyzed using equivalent circuit model parameters from electrochemical impedance spectroscopy tests, and correlations with thickness are established. Constant voltage charging experiments show that swelling follows an initial increase, a plateau, and then a rapid escalation. The onset of rapid swelling accelerated with temperature and voltage, thereby reducing the time to the knee point. A double-exponent swelling model is developed to predict the evolution of thickness under various stress conditions. The results demonstrate that monitoring swelling rate and magnitude can serve as an effective diagnostic for identifying abnormal cell behavior.

1. Introduction

Understanding lithium-ion battery degradation is complex due to the multifaceted processes contributing to capacity decrease and power fade. One concern that both battery manufacturers and product developers share is the potential for batteries to swell, as this can cause damage to the product and pose a safety issue [1]. As a result, the correlation between battery degradation and swelling has garnered interest as a means of anomaly detection and prognosis.
Lithium-ion batteries can swell by 15% to 45% by the end of their life, with gas generation being the primary contributor [2]. During manufacturing, gas is generated in the first few charge–discharge cycles as part of the formation process [3,4,5,6]. In this process, the electrolyte is reduced at the anode surface, forming the solid electrolyte interphase (SEI) layer that releases gases including C2H4, C3H6, CO, and CO2 [5]. Additionally, the reduction in contaminants and residual moisture in the cell can generate hydrogen (H2) [7,8]. In pouch cells, gases generated in formation are often removed before the cells are resealed. However, in many cases, a complete SEI layer formation is not completed before shipment.
Gas formation occurs throughout the battery’s life due to the formation of the electrolyte interphase layer, electrolyte decomposition, dissolution of transition metals from the cathode, particle fracturing, and side reactions at the current collectors, such as copper dissolution and aluminum corrosion. During storage [9,10], charging, and usage [2,11,12,13,14,15], gas generation depends on the operating and environmental conditions. Belharouak et al. [13] conducted a cycle and calendar life study on cells stored at 30 °C, 45 °C, and 60 °C for a period of five months. They found that gas generation increased with temperature, with the highest volume observed in cells tested at 60 °C. Hydrogen was the most abundant gas, but its relative proportion decreased as the temperature increased. The presence of CO, CO2, and hydrocarbon species indicated electrolyte decomposition as the primary source of gas generation.
Mao et al. [15] found that lithium nickel manganese cobalt oxide (NMC)-graphite batteries cycled between 3.0 and 4.4 V generated more CO2 than those cycled between 3.0 and 4.2 V, and exhibited lower coulombic efficiency, indicating side reactions. They attributed the higher volume of CO2 to oxidative reactions occurring at the cathode during high-voltage operation, as well as electrolyte reduction on the anode, which produced ethylene and other hydrocarbons. Additionally, over-discharge, overcharge, and high C-rate usage (all of which contribute to high temperature conditions) can further exacerbate swelling. Although the battery management system (BMS) regulates voltage, current, and temperature, inconsistencies in the cell, lack of cell balancing, and poor thermal management can lead to excessive swelling [16,17].
The extent of swelling in a lithium-ion battery often does not evolve linearly over time or during charge–discharge cycles. Mao et al. [15] found that the pouch cell volume can decrease after an initial significant expansion due to the crossover effect, which stabilizes the battery performance. Xiong et al. [18] found that the graphite anode can absorb CO2 generated through oxidation reactions at the cathode. Berkes et al. [14] observed that the rate of gas generation increases exponentially with the number of cycles, due to an increase in dominant gases (CO2 and CO), showing the onset of the knee point.
This study focuses on characterizing the swelling behavior of pouch cells, subjected to two distinct test conditions: constant voltage charge tests and charge–discharge cycling tests. Stress factors, including ambient temperature, upper voltage limit, and C-rate, are considered. While existing literature presents several swelling models, as discussed below, it is imperative to note that they often overlook irreversible swelling that occurs as the battery ages, a critical aspect that this study seeks to address.
Oh et al. [19] presented a thermal swelling model based on the thermodynamics of the cell’s components. The model was developed by considering the volumetric expansion of the electrode materials, electrolyte, and separator. Oh et al. [20] investigated the rate dependence of swelling in lithium-ion cells by examining the effect of different C-rates on swelling behavior. Oh et al. [21] presented a novel multi-physics model of Li-ion battery cells that considered the electrochemical, thermal, and mechanical interactions within the cell. The models were validated with experimental data, and the parameters were determined by fitting the model to the experimental results. Sauerteig et al. [22] presented an electrochemical-mechanical coupled model for swelling and ionic transport in lithium-ion batteries. The model considered both mechanical and electrochemical processes, including the effects of diffusion and migration of lithium ions. The model can predict the unstrained swelling for different C-rates, but only swelling due to intercalation is modeled, and the effect of gas generation is not considered. The coefficients derived in the above four models did not consider the effect of ageing. Though the models could predict swelling behavior for varying operating conditions, they lacked the ability to predict swelling behavior over the life of the battery.
While the relationship between capacity fade and thickness has been explored [23], the connection between swelling and various internal degradation mechanisms remains unexamined. Swelling can therefore be used as a diagnostic indicator of the state of the battery. Mohtat et al. [24] observed that the amplitude of reversible expansion during cycling decreases over time, indicating lithium loss, whereas the irreversible expansion increases linearly with capacity fade.
Lin et al. [25] and Juarez-Robles et al. [26] reported that electrode expansion is associated with loss of active material, electrical conductivity, and lithium inventory, which result from lithium plating, dendrite formation, SEI growth, and structural decomposition of electrode materials. Sauerteig et al. [27] linked swelling to active material loss caused by crystal structure changes, electrolyte oxidation, and electrode decomposition. Swelling also increases internal resistance because gas formation and thicker SEI layers reduce ion transport. Stravová et al. [28] observed that long-term cycling doubled series resistance and caused a 29% increase in cell thickness. Wu et al. [29] and Zhou et al. [30] used strain patterns to estimate capacity loss. Swelling is used to detect degradation events such as lithium plating [31], internal short circuits [32], and manufacturing inhomogeneities [33].
Using electrochemical impedance spectroscopy (EIS), Mohtat et al. [24] observed changes in Nyquist plots corresponding to variations in battery thickness. However, continuous monitoring of EIS, along with the assessment of swelling and decoupling the impact of internal processes, has not been reported. This study contributes to the field by characterizing the swelling behavior of pouch lithium-ion batteries under charge–discharge cycling tests and constant voltage/float charging tests, while considering ambient temperature, C-rate, and upper voltage limit.
As part of this study, the internal dynamics influencing swelling were analyzed by integrating EIS data with an equivalent circuit model (ECM) and correlating the derived parameters with battery thickness measurements under various test conditions. ECMs are widely used to interpret EIS spectra, allowing physically meaningful modeling of processes such as ohmic resistance, interfacial charge transfer, and lithium-ion diffusion. In the low-frequency range (10 mHz–10 Hz), the Warburg impedance captures the slow diffusion of lithium within the electrodes. The mid-frequency range (10 Hz–10 kHz) reflects charge transfer processes at the electrode/electrolyte interfaces, while the high-frequency range (10–100 kHz) represents fast interfacial transport processes [34]. A one-resistor-capacitor pair (1RC), commonly referred to as the Randles circuit, was used to fit the EIS data (Figure 1).
High-frequency inductance, arising from metallic elements and wiring, was subtracted to determine the high-frequency intercept, which represents the total ohmic resistance from electrolyte, electrodes, separator, current collectors, and contacts. The semi-circle observed in the mid-frequency range reflects combined resistive and capacitive effects at the interfaces. At the same time, the low-frequency tail corresponds to solid-state lithium-ion diffusion parameterized by Warburg impedance [35,36]. A 1RC Randles circuit is selected to model the EIS spectra and capture the dominant electrochemical processes governing cell behavior. This configuration provides a balance between physical interpretability and fitting accuracy, representing the combined effects of ohmic resistance, charge transfer, and double-layer capacitance. While the 1RC model effectively characterizes the mid- and high-frequency response of pouch cells, it does not fully decouple interfacial contributions such as SEI formation or multiple charge transfer pathways. Although more detailed models incorporating multiple RC elements or transmission-line representations could theoretically resolve additional interfacial phenomena (e.g., SEI formation or multiple charge-transfer pathways), such approaches were not adopted here to avoid over-parameterization.
This study is conducted on unconstrained pouch cells to isolate intrinsic swelling and aging behavior without the confounding effects of mechanical compression. Moderate stack pressure has been reported to improve Li-ion cell performance, whereas very low or very high pressures can be detrimental [37]. Pressures below approximately five psi (≈30 kPa) show no improvement in capacity compared to the unconstrained condition due to incomplete electrode contact, while excessive pressure can accelerate mechanical degradation [24,38]. Li et al. [37] summarize that Li-ion cells under constraints of roughly 20–200 kPa can reduce internal resistance and thus enhance the capacity of aged cells. Future work should extend these investigations to constrained cells in modules or packs, where mechanical compression is expected to modify swelling, impedance, and aging behaviors.
The following section of the paper presents the experimental setup. Section 3 discusses the results of the charge–discharge cycling tests, and Section 4 presents the results of the float charging tests. In both sections, correlations between ECM parameters and swelling are analyzed. Section 5 presents the results of the constant high-voltage charging tests and the development of the swelling model. The paper concludes by elucidating the swelling behavior of pouch lithium-ion batteries under various operating conditions and discussing the implications for safety and reliability, including the potential for early warnings based on swelling trends.

2. Materials and Methods

Lithium-ion pouch batteries with a nominal capacity of 3300 mAh and a voltage range of 2.7–4.2 V were used in this study. The manufacturer-specified dimensions are as follows: a maximum thickness of 5.20 mm, a maximum width of 64.50 mm, and a maximum length of 95.50 mm. The cathode is composed of NCA (Lithium Nickelate (LiNiO2), Lithium Cobalt Oxide (LiCoO2), and Aluminum Oxide (Al2O3)). The anode is graphite. The electrolyte consists of a lithium hexafluorophosphate (LiPF6) in a mixture of ethylene carbonate and ethyl methyl carbonate. The maximum charge and discharge current, according to the manufacturer’s specification, is 2.0C (6600 mA). The operating temperature range for charging is 0 °C to 45 °C, and for discharging is 20 °C to 60 °C. The average initial thickness measured across 20 batteries was 4.97 mm.
Periodic measurements were performed to characterize the cells throughout the swelling tests, including thickness, capacity, and EIS. When conducting period measurements, batteries were placed in a room temperature (RT) environment where the temperature was 25 ± 3 °C for 2 h. Figure 2 illustrates the test setup.
To characterize the swelling behavior of these cells, the thickness was measured at the center of the battery. Previous studies have employed digital image correlation [39,40], eddy current sensors [41], linear variable differential transformer (LVDT) sensors [20,21], fiber-optic sensors [42], and strain gauge load cells [43,44,45] to track thickness or deformation. In this study, a Vernier caliper was selected due to its simplicity, ease of calibration, and minimal susceptibility to temperature drift or sensor aging, ensuring consistent accuracy over repeated measurements. The caliper method offers a high resolution of 0.01 mm, enabling non-destructive, repeatable measurements of the cell’s free swelling without interference from mechanical fixtures or external compression. However, Vernier calipers have limitations as they capture only point measurements, which may not reflect local thickness variations across the cell, and are subject to operator handling variability.
The current and voltage were controlled and logged by the battery tester from Arbin Instruments, College Station, TX, USA, and the ambient temperature of the test was maintained using a thermal chamber. The capacity measurement involved charging with an initial charge current of 3300 mA (1.0C) and with a constant voltage of 4.2 V and a cut-off current of 165 mA (0.05C), followed by discharging the battery with a constant discharge current of 3300 mA (1.0C) and with a voltage cut-off at 2.7 V. Verastat 4 potentiostat from AMETEK Scientific Instruments, Oak Ridge, TN, USA, was used to perform EIS from 10 kHz to 0.1 Hz at 100% SOC voltage at 25 ± 3 °C. The data were analyzed using VersaStudio software.
Two testing protocols were employed: charge–discharge cycling and float charging. Each test condition used four independent cells. The charge–discharge tests were conducted within a voltage range of 3.0–4.2 V to investigate the effects of C-rate and ambient temperature. Thickness, capacity, and EIS measurements were taken every 20 cycles. The float charging tests simulated stationary applications, such as backup power systems, where cells remain at full charge for extended periods. In this protocol, the cells were charged in CC mode until reaching an upper voltage limit of 4.20 V or 4.23 V, then held in CV mode for a total of 528 h. The factors considered for the float charging test include the voltage at which the cell is maintained in constant voltage mode (upper voltage limit) and the ambient temperature during testing. During this time, swelling, capacity, and impedance were characterized every 48 h. Table 1 summarizes the test matrix, with one sample per test condition.
Another set of pouch cells was subjected to float charging tests under more severe voltage and temperature conditions to capture their complete swelling behavior within a shortened test duration. These cells were kept in constant-voltage mode, and the maximum thickness was recorded every seven days after the initial measurement. Capacity or EIS measurements were not performed. Table 2 details the upper voltage limit and ambient temperature conditions for the test.
The subsequent sections present the results of these experiments. In general, similar patterns of swelling were observed in charge–discharge cycle tests and float charging tests. Throughout the tests, the cells showed a sharp initial increase in thickness followed by a plateau. Capacity showed a decreasing trend, and impedance at a frequency of 1 kHz increased over time.

3. Results

3.1. Charge–Discharge Cycling Test Results

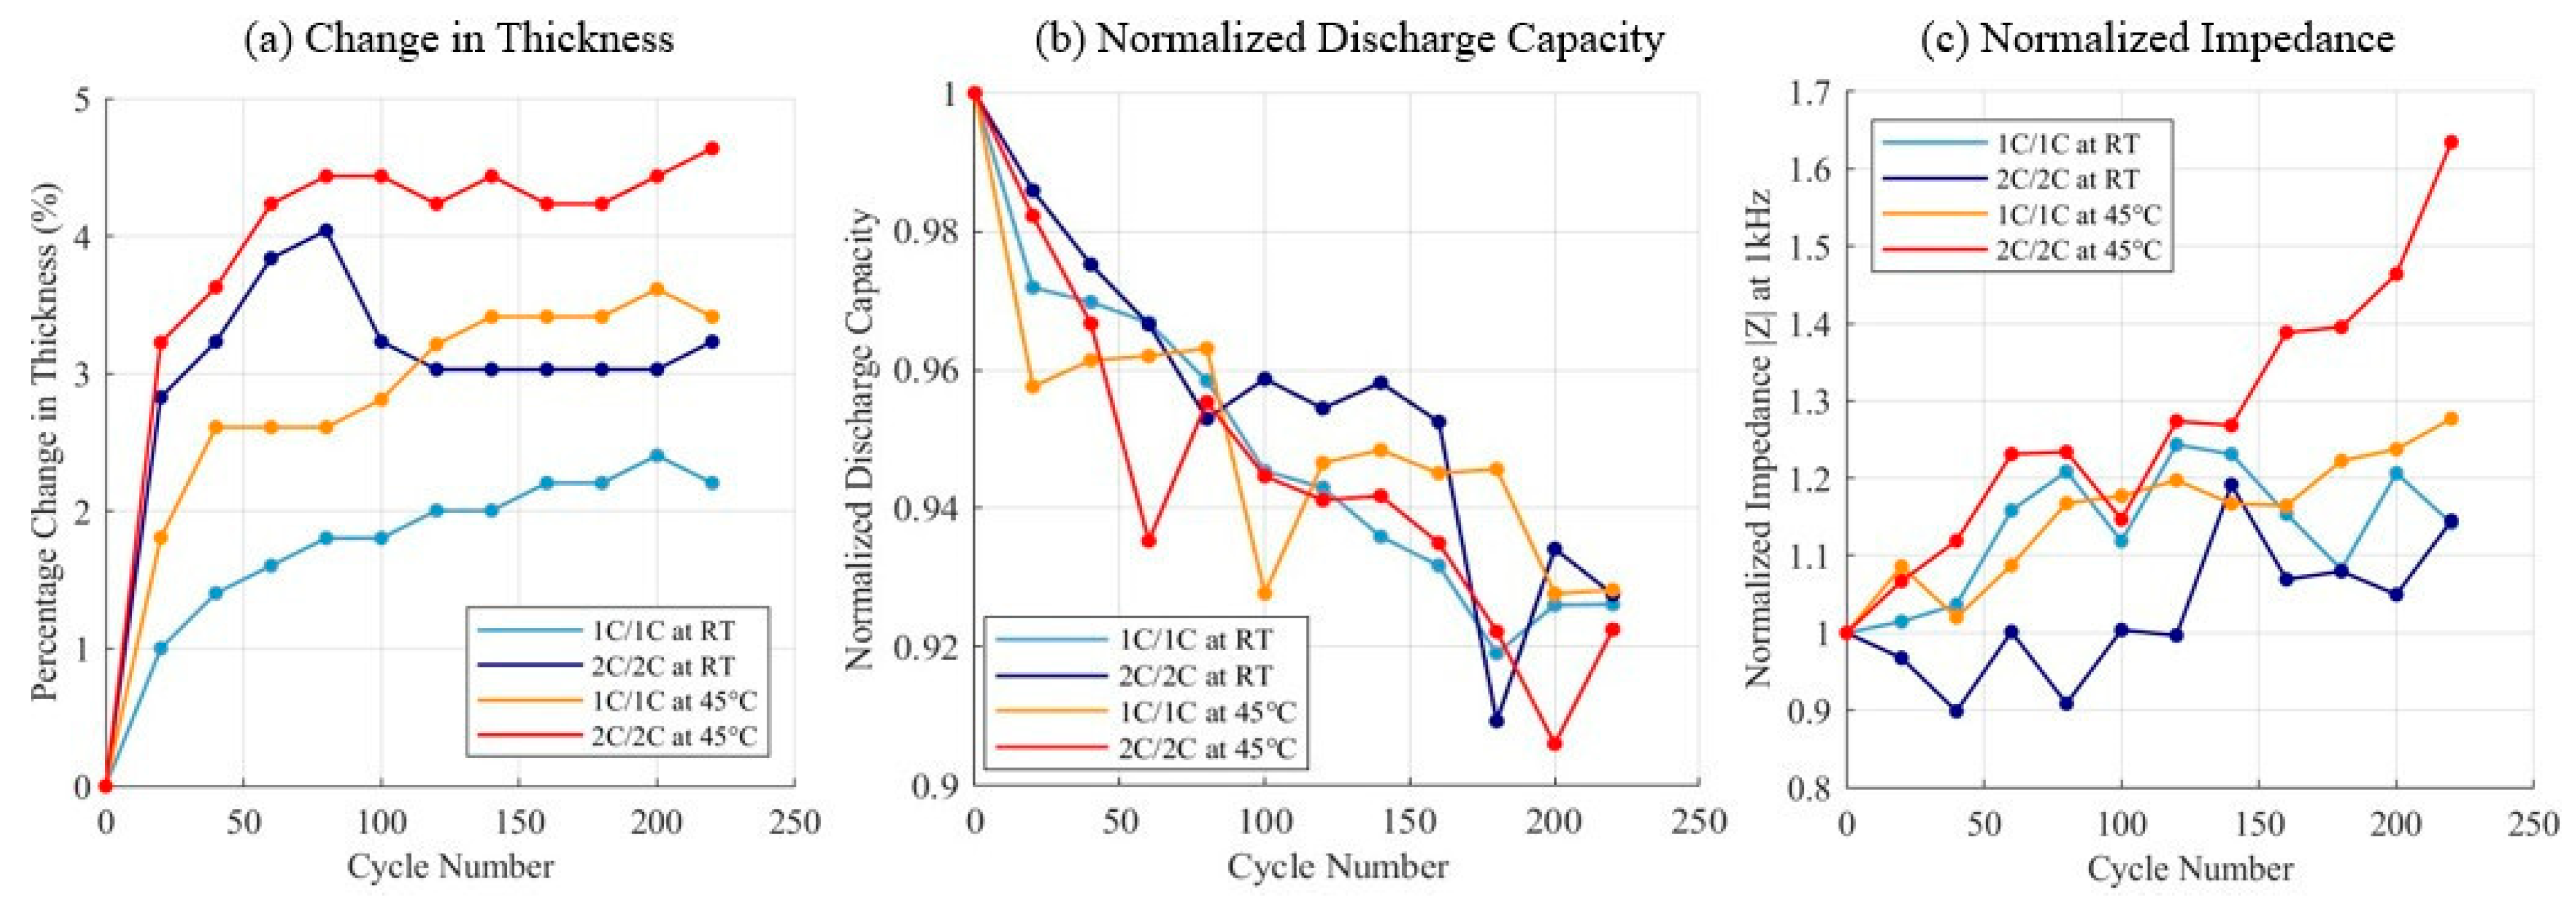
The swelling behavior of charge–discharge cycle tests was characterized by an initial steep increase, followed by a gradual increase, except for a plateau observed at 2C cycling at room temperature. The rapid growth in the start is generally associated with the gas generated due to the formation of the SEI layer [46]. The change in thickness for all 4 test conditions is shown in Figure 3a [47]. Only samples cycled at 2C at room temperature experienced a decrease in thickness after the initial increase, which could be caused by the crossover effect at electrodes. Mao et al. [15] reported that depletion of gaseous products during cycling, where the gases evolved at the cathode crossover to the anode, thickens the SEI layer and results in a reduction in the volume of gas generated.
The normalized capacity and normalized impedance measured at 1 kHz are shown in Figure 3b,c. All batteries exhibited a decrease in capacity with cycles, and there was minimal variation in capacity fade observed among the four test conditions. Although the overall trend indicates a decrease in discharge capacity with cycling or time, variations are observed between consecutive measurements, particularly in cells tested at higher temperatures. These variations are suspected to be due to factors such as residual temperature differences, slight differences in the timing of the tests after rest, and variations in contact resistance during tester connections, which can introduce variability in the measured capacity. For cycling at room temperature, there was an 18% increase in impedance after 220 cycles at both 1C and 2C rates. In the case of cycling at 45 °C, there was a 27% impedance increase at 1C from 8.8 mΩ to 11.3 mΩ and a 63% increase at 2C from 7.3 mΩ to 11.9 mΩ. The difference in impedance growth at 1C and 2C at 45 °C suggests that the combined effects of elevated temperature and higher charge–discharge rates accelerate internal degradation mechanisms. Increased C-rate cycling at high temperatures can intensify side reactions, electrode aging, and electrolyte decomposition, contributing to greater resistance buildup.
EIS data was analyzed using ECM to extract key parameters that reflect the battery’s performance over the cycling process. The bulk resistance ( R u ), which represents the overall ohmic resistance of the battery, is determined by identifying the magnitude of the impedance when the phase angle is zero [48]. The sum of the charge transfer resistance ( R c t ) and bulk resistance is obtained by locating the point where the semicircle region intersects the real axis at zero. The frequency corresponding to the highest point of the semicircle is used to calculate the double-layer capacitance ( C d l ) using the equation
C d l = 1 2 π f m a x R c t ,
where f m a x   is the frequency at the apex of the semicircle. The slope of the Warburg region is determined by applying a best-fit line to the linear portion of the Nyquist plot following the semicircle region.
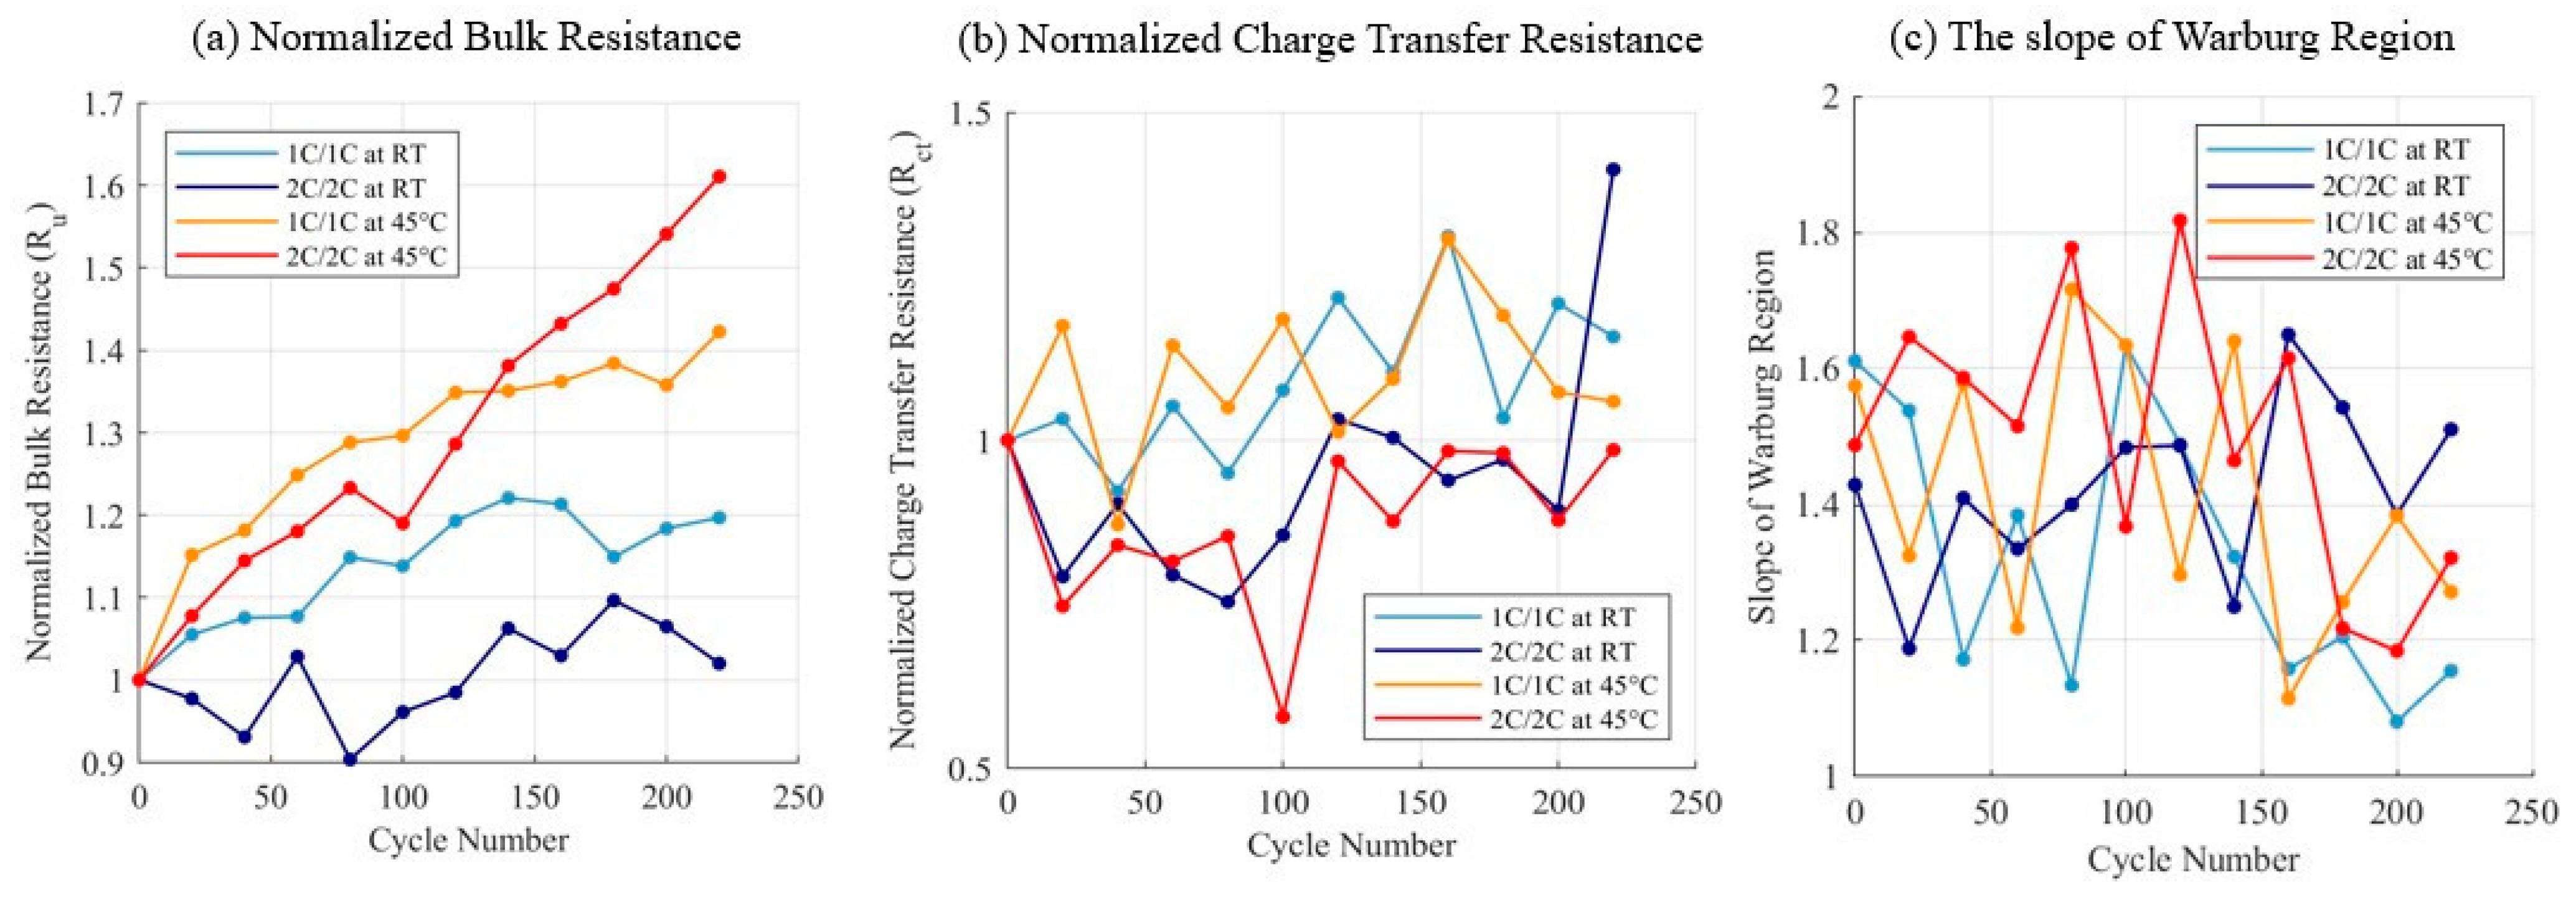
The observations from Figure 4a,b indicate that the bulk resistance increases more significantly for batteries cycled at 45 °C compared to those cycled at room temperature, which can be linked to the degradation of electrode materials, electrolyte decomposition, and changes in the SEI layer [35]. Despite the increase in bulk resistance, cells cycled at 45 °C exhibit lower charge transfer resistance. This indicates that the electrochemical kinetics are enhanced at higher temperatures, likely due to the improved ionic conductivity of the electrolyte, which facilitates faster charge transfer at the electrode-electrolyte interface [49].
The slope of the Warburg impedance region is shown in Figure 4c. In general, a slope of 45° in the Warburg region signifies purely diffusion-limited behavior, where the impedance is primarily governed by the diffusion of species within the electrode/electrolyte interface. Observing a slope greater than 1 in the Warburg region of the Nyquist plot for all test conditions indicates a deviation from the typical 45-degree slope, which is characteristic of semi-infinite diffusion. This suggests that the diffusion process within the battery deviates from ideal semi-infinite behavior, potentially due to limitations such as solid-phase diffusion resistance, changes in electrode microstructure, or inhomogeneous lithium-ion transport [50].
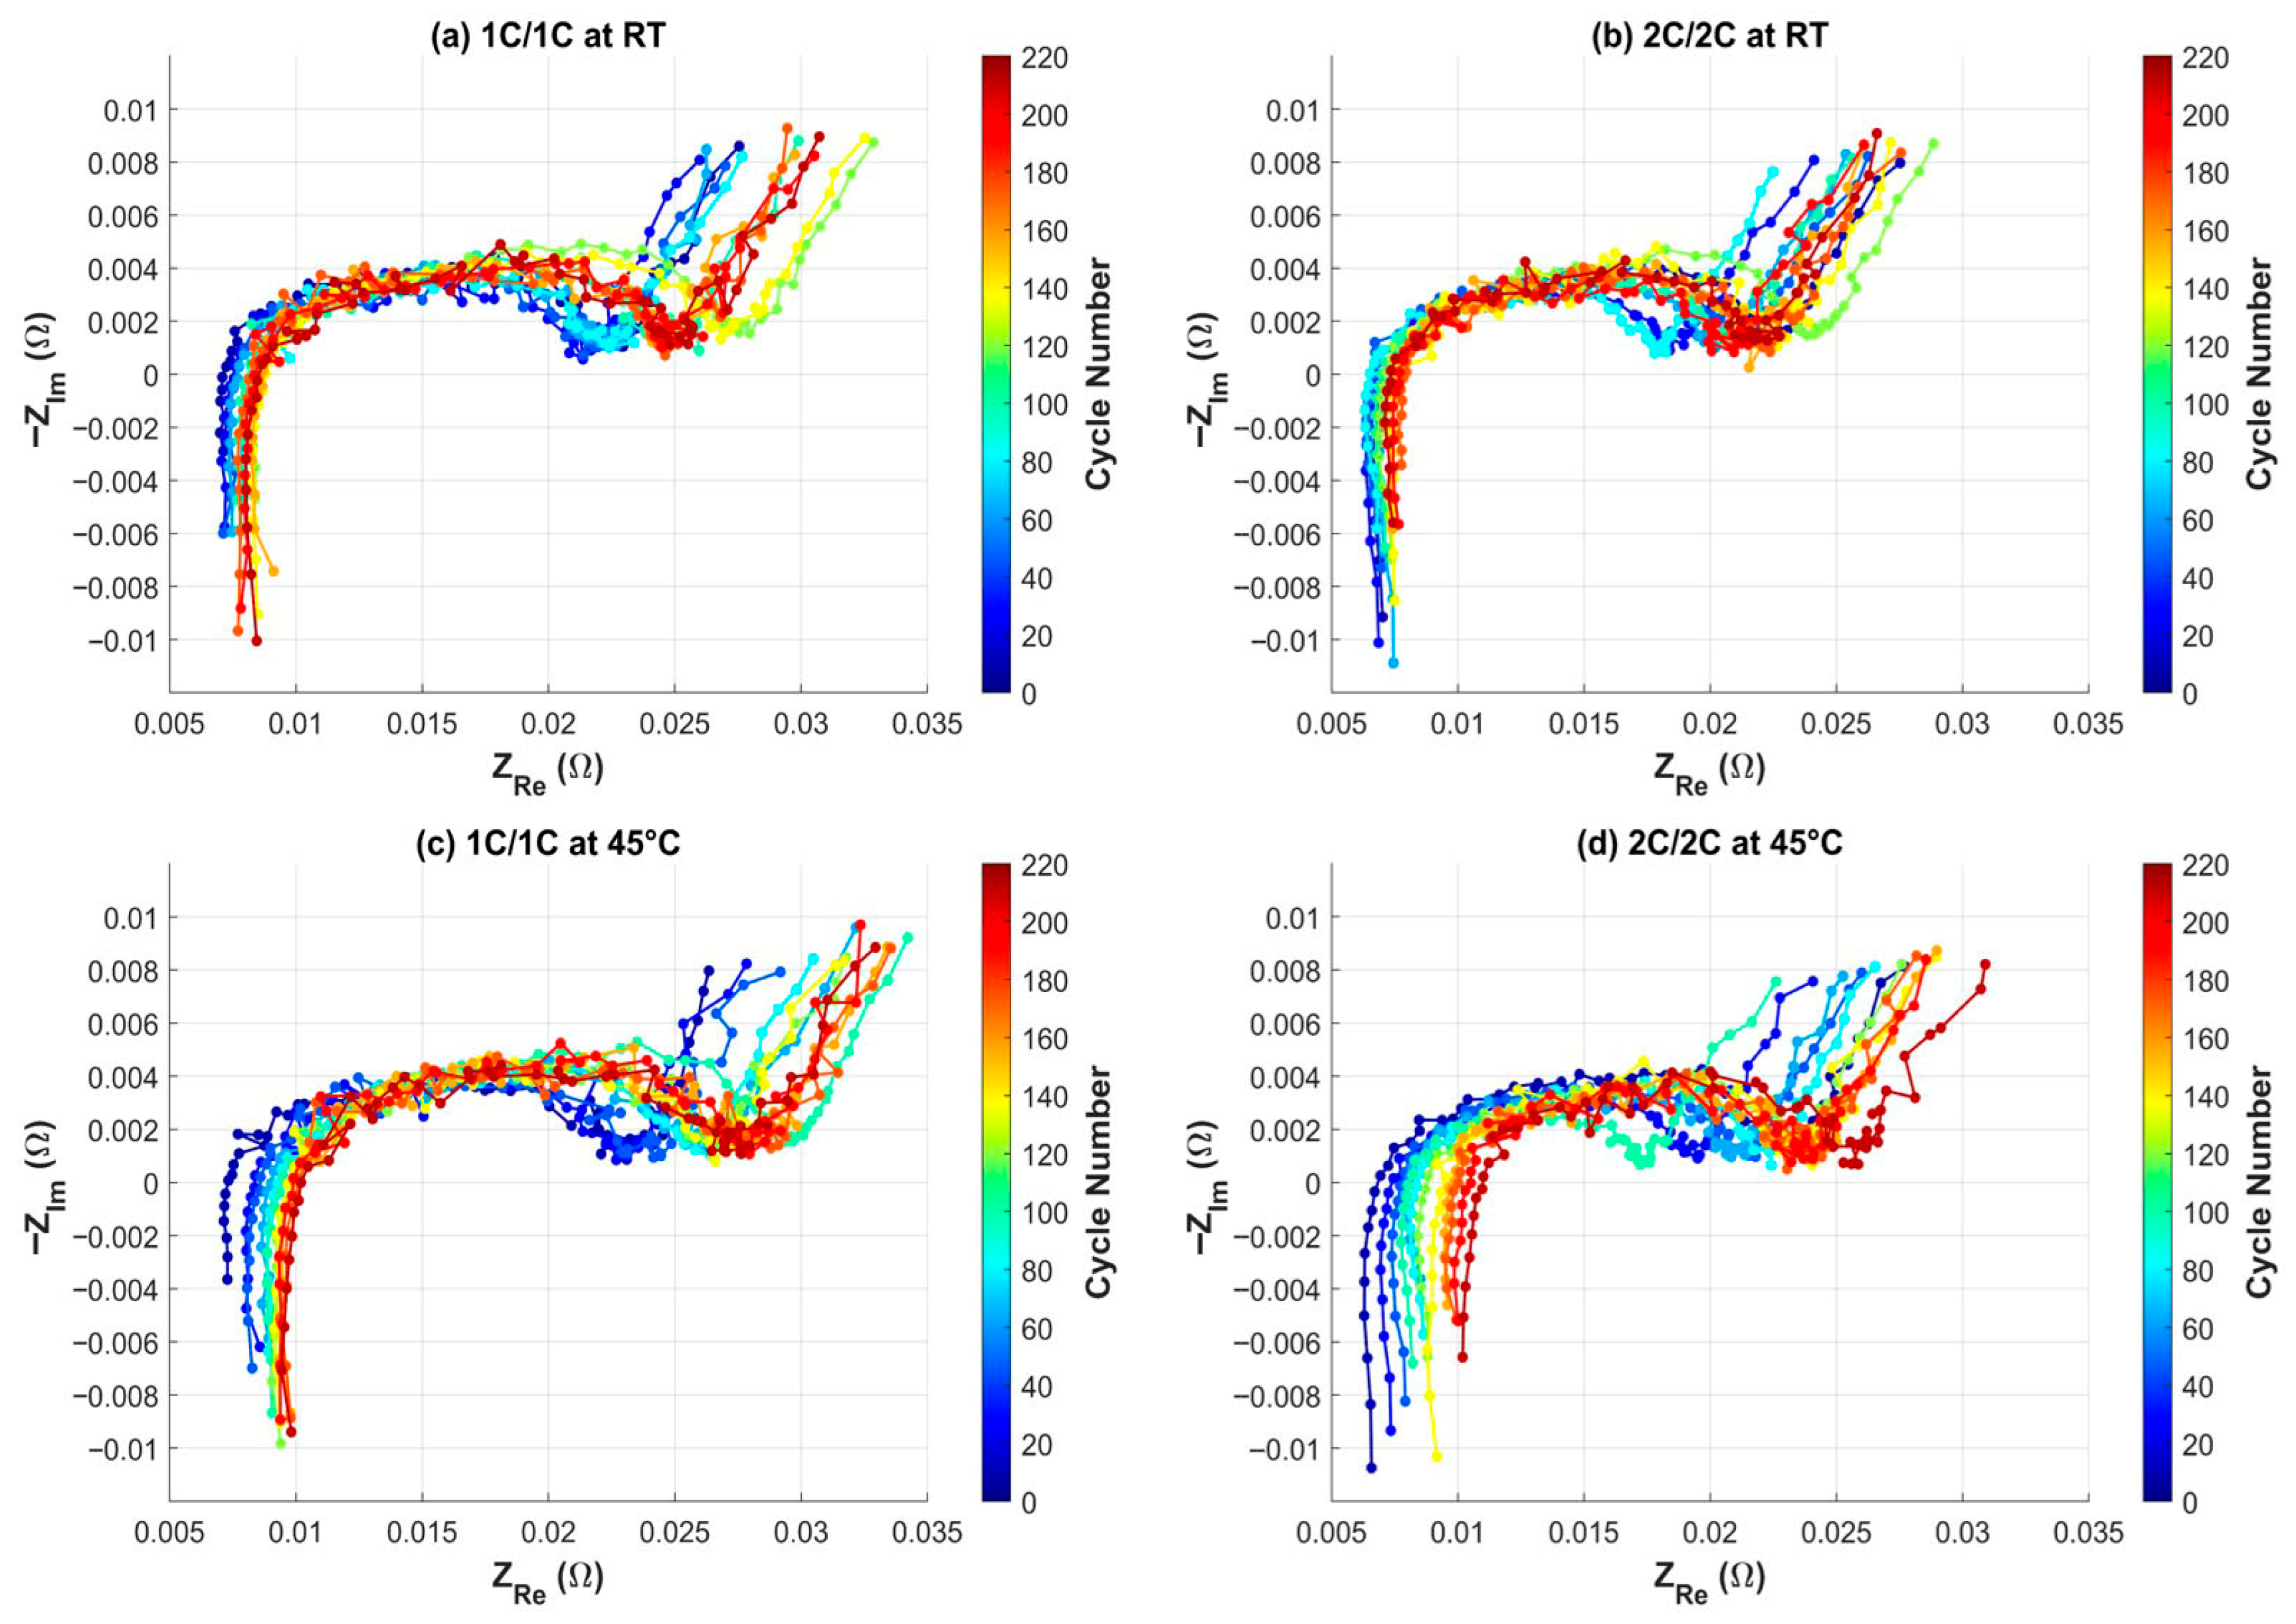
Figure 5 presents the Nyquist plots for all four test conditions. Each line graph depicts a measurement taken after 20 cycles, with dark blue representing the initial measurement and dark red indicating the measurement at 220 cycles. As cycling progressed, the Nyquist plots shifted to the right, indicating an increase in bulk resistance. However, the diameter of the semicircle, which corresponds to charge transfer resistance, did not exhibit a clear trend over the cycles.
A correlation analysis was performed between the swelling percentage and the normalized ECM parameters. Pearson’s correlation coefficient is shown in Table 3. The correlation analysis reveals a moderate positive correlation between swelling and bulk resistance. Its relationship with other ECM parameters, such as charge transfer resistance, double-layer capacitance, and the slope of the Warburg region, is either weak or negligible. While swelling can be related to SEI growth and measured by charge transfer resistance, the test results do not indicate a strong effect. The Pearson correlation coefficient between swelling percentage and charge transfer resistance ( R c t ) is −0.03, indicating a very weak linear correlation. This suggests that, at least during the initial stages of testing, macroscopic swelling does not directly track short-term variations in charge transfer resistance. However, R c t is influenced by interfacial processes such as the formation and evolution of the SEI layer and changes in electrode contact quality [34]. As the SEI grows thicker or its composition changes, the semicircle in the Nyquist plot typically increases in diameter. In such cases, a 2RC equivalent circuit model can better capture these evolving impedance features and distinguish between charge transfer and SEI contributions. The correlation with the slope of the Warburg region is also weakly positive, at 0.16, implying a minor impact of swelling on diffusion-related impedance.

3.2. Float Charging Test Results

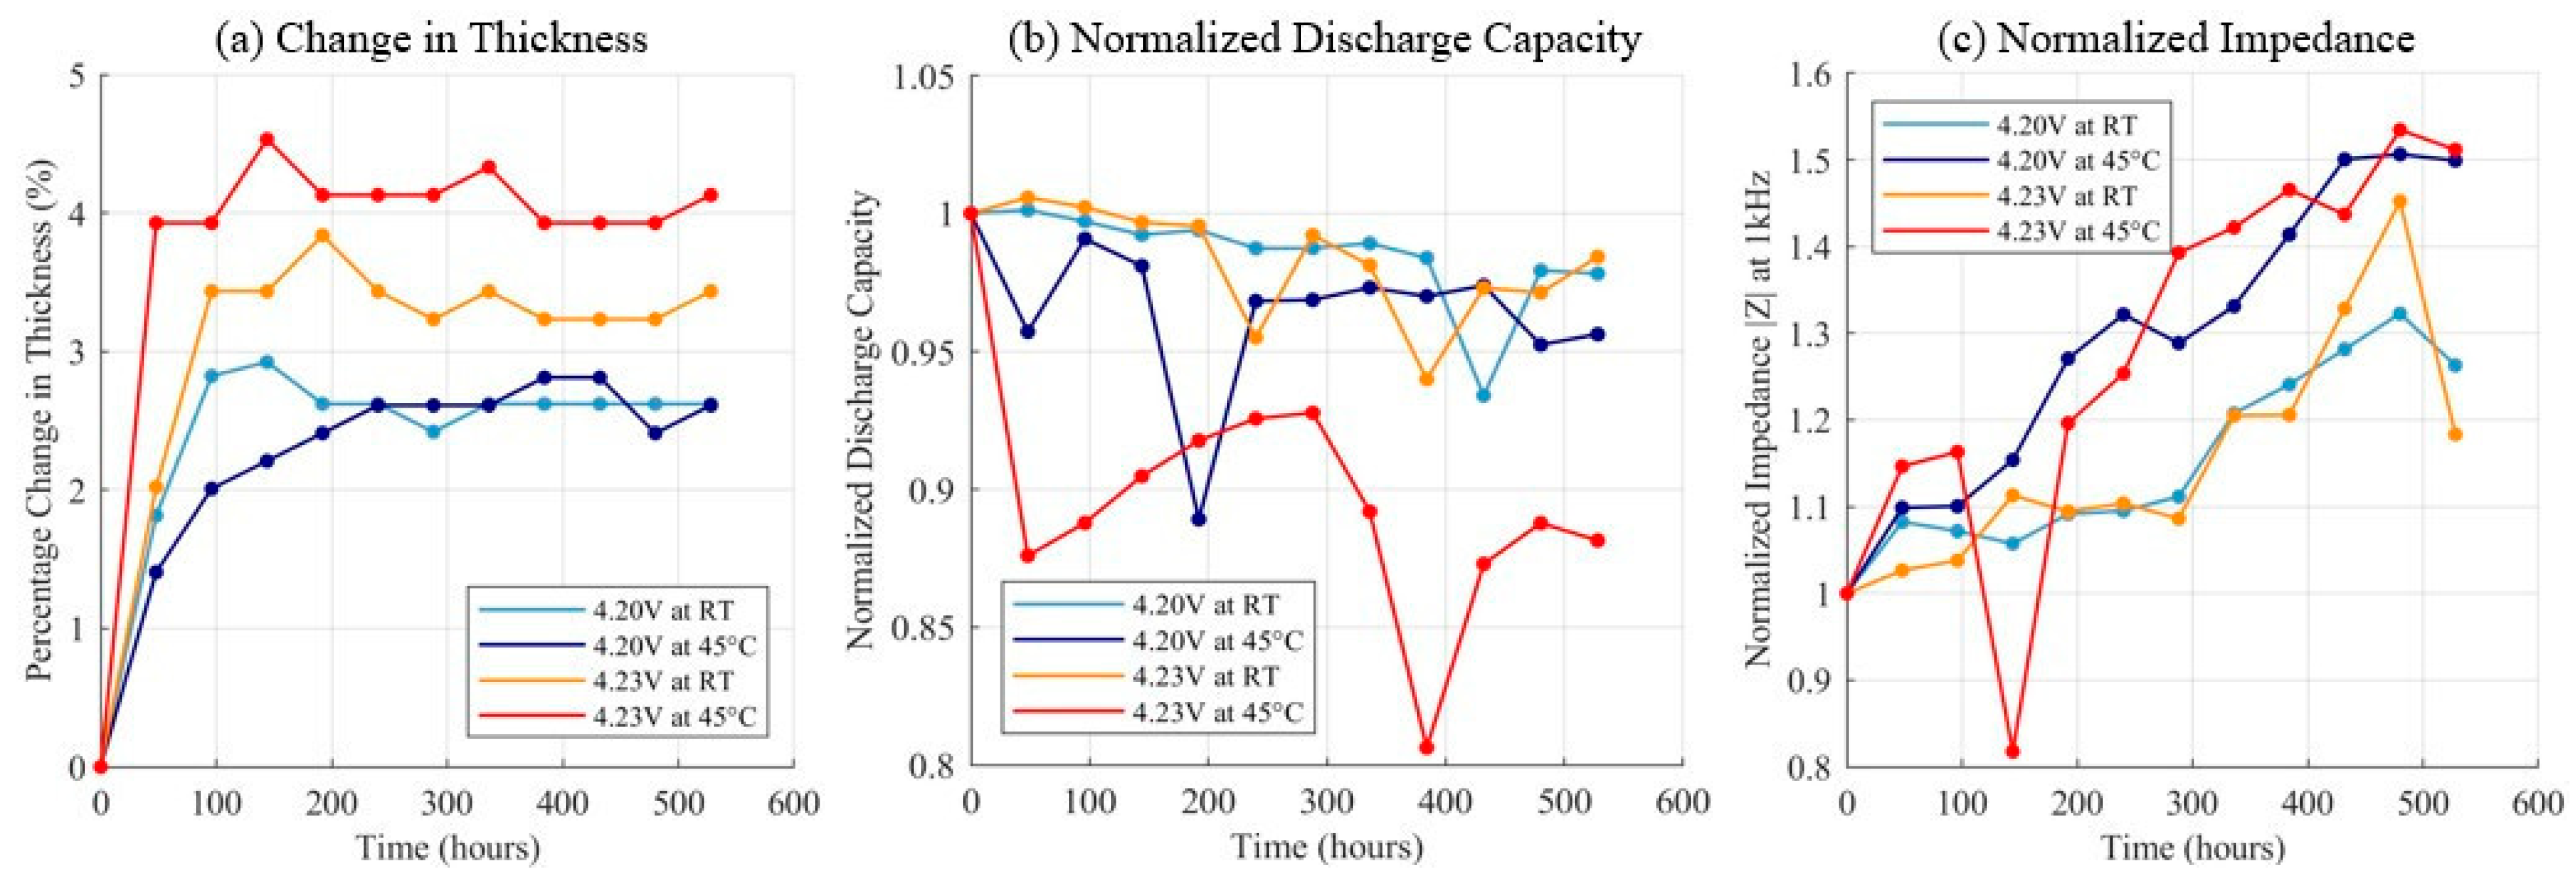
Figure 6a shows the change in thickness as a function of the upper voltage limit, temperature, and time for all 4 test conditions of constant voltage/float charging tests. The initial swelling behavior is similar to that observed in the charge–discharge cycle tests, characterized by an increase in thickness due to SEI layer formation, followed by a stabilization with no further changes in thickness. The normalized capacity and normalized impedance measured at 1 kHz are shown in Figure 6b,c. The battery held at a constant voltage of 4.23 V at 45 °C showed the highest capacity fade of 12%, while other batteries exhibited a decrease of approximately 2%. These results demonstrate the combined detrimental effect of elevated voltage and temperature on capacity fade. Batteries held at 4.23 V at 45 °C also demonstrated the highest increase in impedance, at 53%, followed by batteries at 4.2 V and 45 °C, with an increase of 47%. Batteries at room temperature exhibited an impedance increase of 20% to 25%. These findings suggest that temperature has a more significant impact on impedance growth than the voltage.
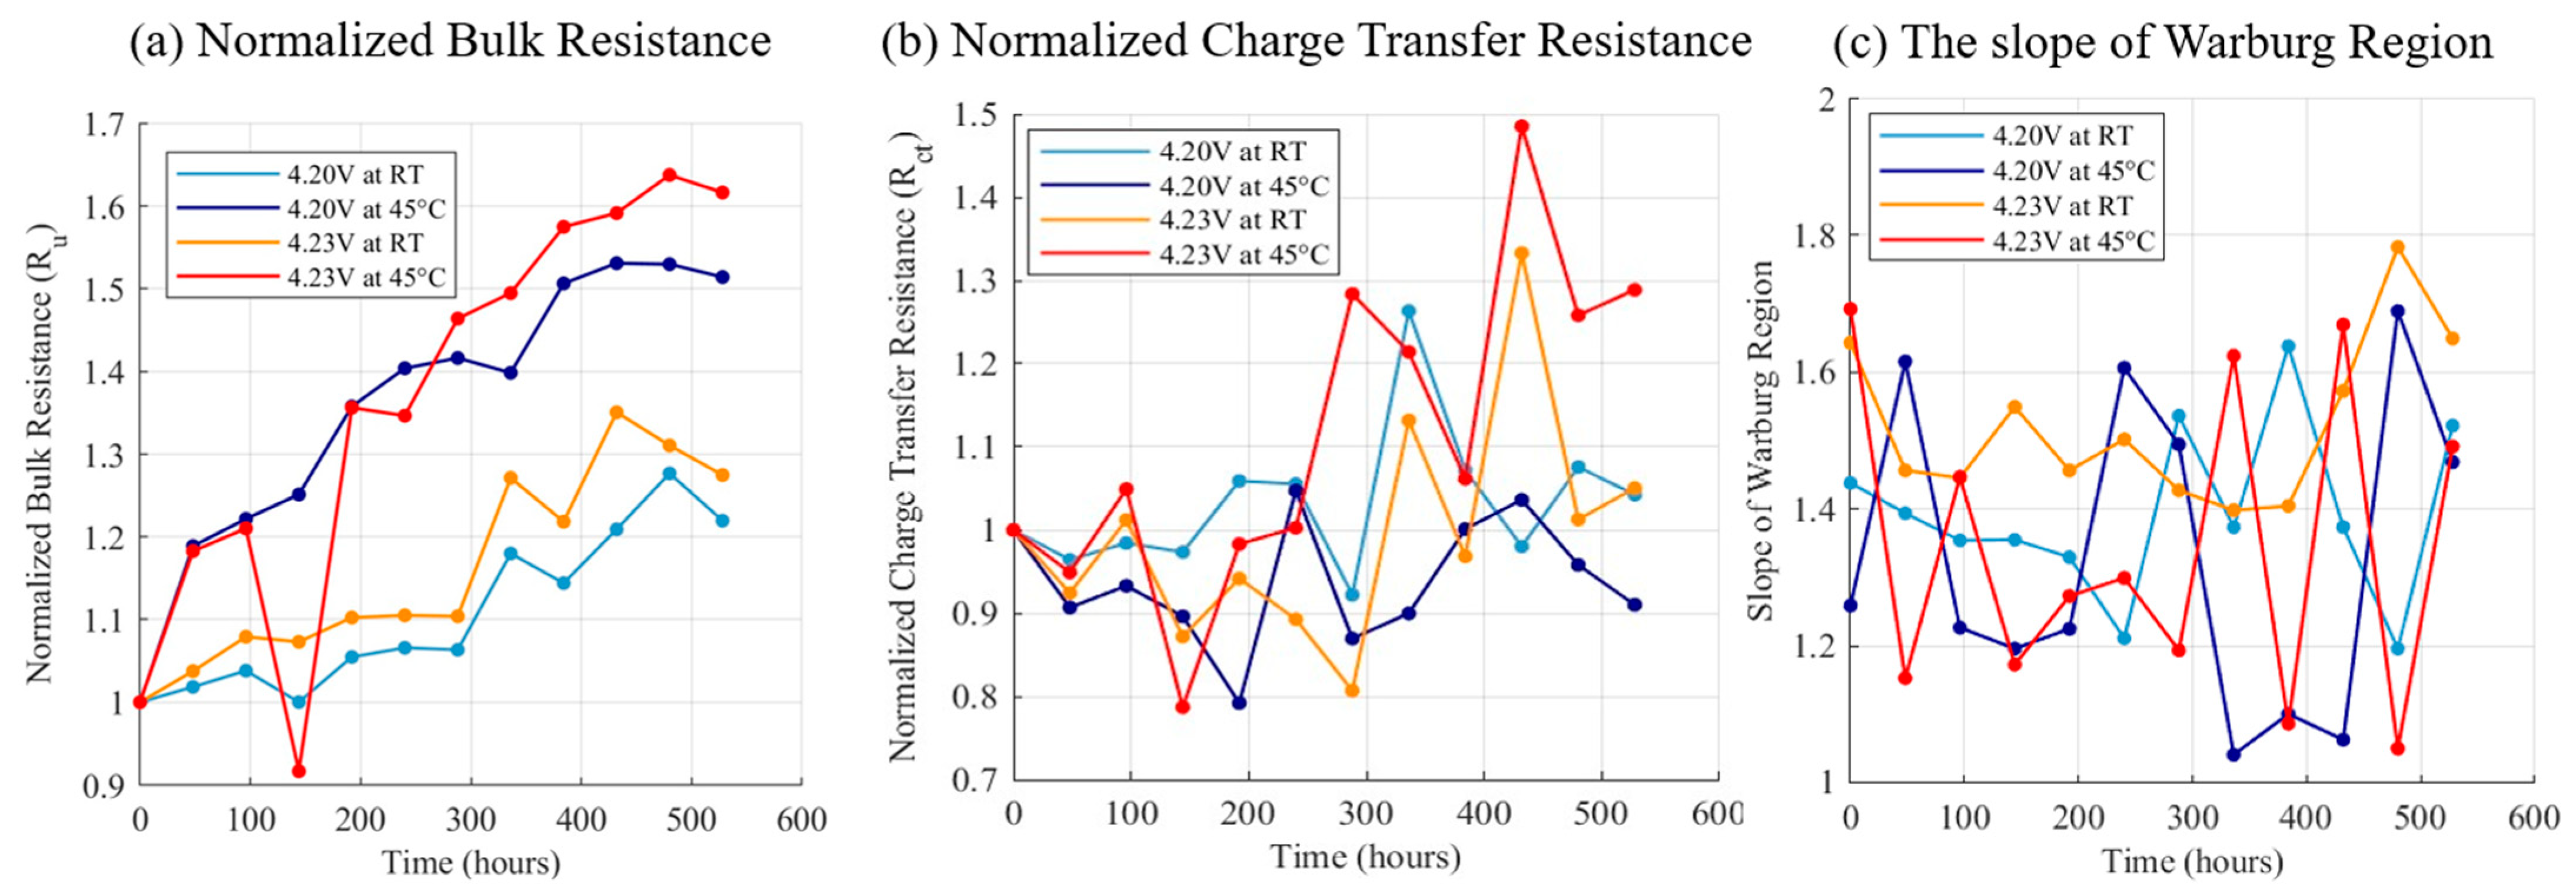
The bulk resistance ( R u ) calculated from the equivalent circuit modeling shows an increasing trend for all test conditions, as shown in Figure 7a. Similarly to the charge–discharge cycling tests, the bulk resistance increases even as the increase in thickness stabilizes. Regarding the charge transfer resistance ( R c t ), an irregular pattern is observed, characterized by an initial decrease followed by subsequent increases, as shown in Figure 7b. However, fluctuations are evident after each measurement, likely due to variations in R c t caused by temperature changes [49]. Since the EIS measurements were conducted at room temperature, which was not controlled, it is important to recognize the sensitivity of R c t to temperature variations. The ECM analysis reveals that the slope of the Warburg impedance exceeds one across all test conditions throughout the test, mirroring observations from charge–discharge tests as shown in Figure 7c.
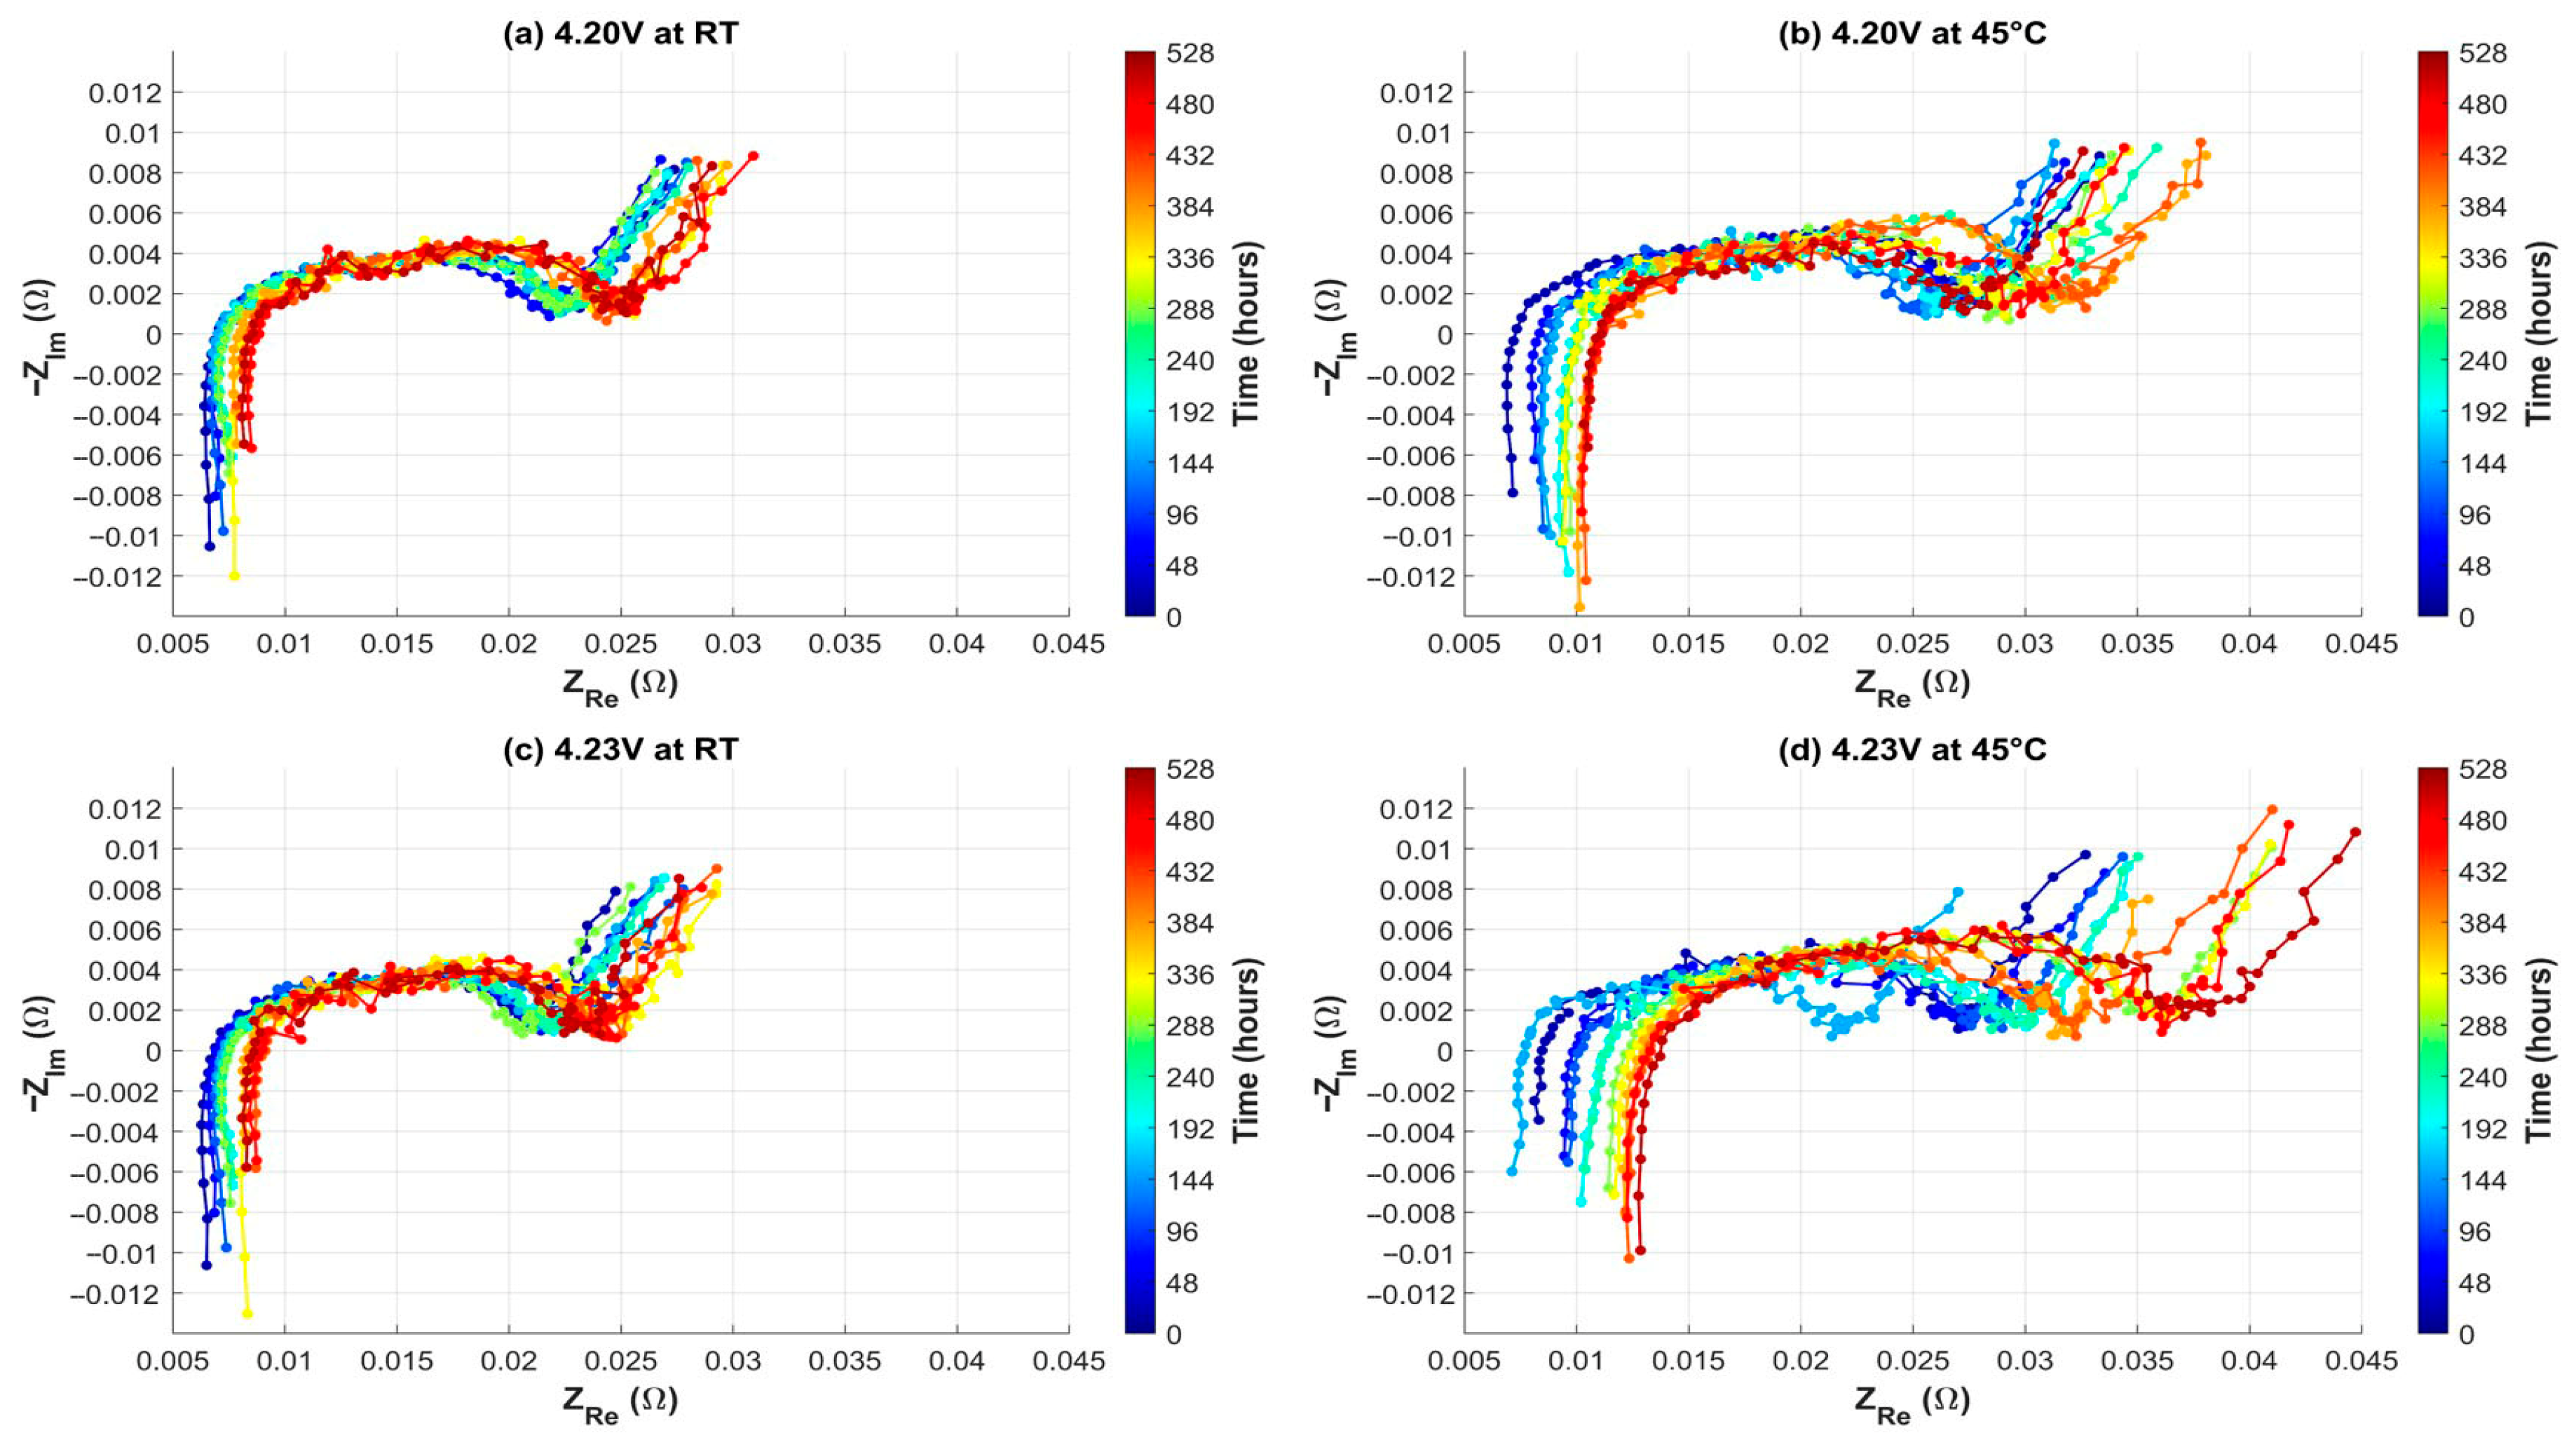
The EIS measurements, shown as Nyquist plots with real impedance on the x-axis and negative imaginary impedance on the y-axis, are presented in Figure 8 for all four test conditions. Each plot represents data collected after 48 h of continuous float charging, with dark blue indicating the initial measurement and dark red the measurement after 528 h. As charging progresses, the Nyquist plots shift to the right, reflecting an increase in bulk resistance associated with the electrolyte, separator, and electrodes. Comparing Figure 8a–d, the change in temperature from 25 °C to 45 °C resulted in a larger shift in Nyquist plots than the change in the upper voltage limit from 4.2 V to 4.23 V.
The results of the correlation analysis between swelling and ECM parameters are presented in Table 4. The bulk resistance keeps increasing even as the swelling stabilizes, suggesting that not all degradation mechanisms reflect an increase in thickness. The mild correlation between swelling and bulk resistance can be attributed to the consumption of mobile lithium ions and electrolyte by SEI formation [51]. As the battery ages, the SEI layer formation is stabilized, which explains the plateau in swelling. However, the bulk resistance accounts for the total loss of lithium inventory, explaining its continuous rise. This means that, even though the physical swelling stabilizes, the internal chemical processes continue to consume lithium, increasing the overall resistance within the battery.

3.3. Float Charging Test Results at Elevated Voltage and Temperature

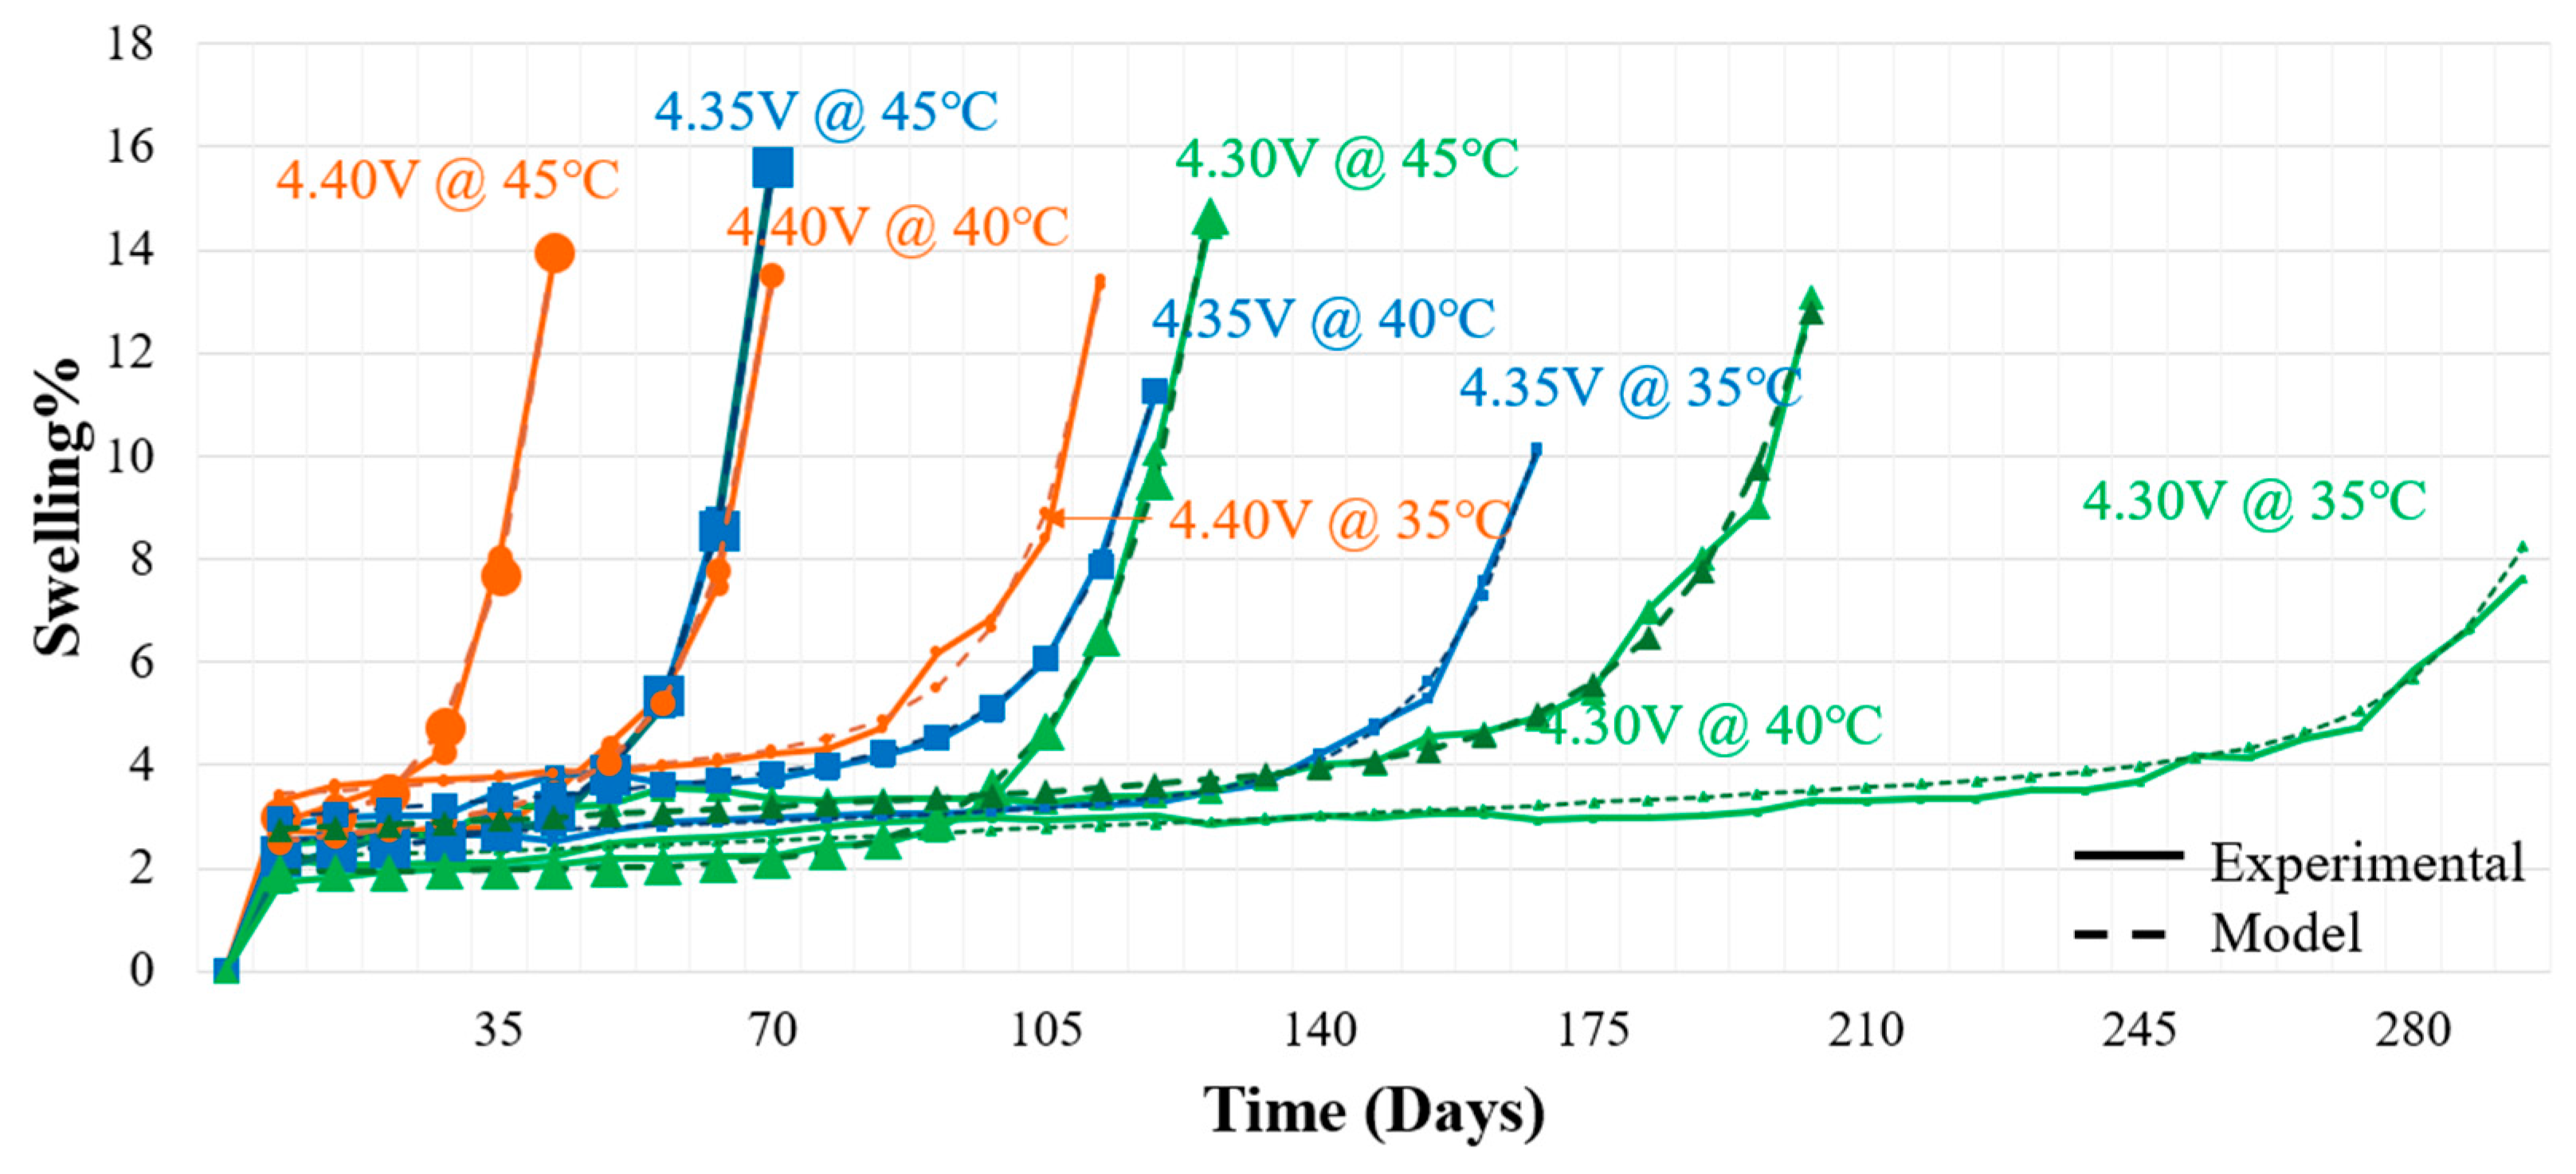
Testing was performed on a separate set of pouch batteries under elevated upper voltage and temperature conditions, as outlined in Table 2, to observe their complete swelling behavior in a shorter timeframe. The swelling behavior for float charging tests can be delineated as a three-stage process, as shown in Figure 9. The three stages encompass the onset, stabilization, and a subsequent surge in swelling. Prolonged exposure to these severe conditions revealed a sudden surge, marked by an inflection (knee point) in the swelling curve, potentially due to gas generation from electrolyte decomposition at the cathode. This abrupt volumetric increase raises concerns. Monitoring the knee-point and issuing early warnings to prevent potential incidents becomes important.
Observations indicated that increasing voltage and temperature decrease the time required to reach the knee point. These results can elucidate the swelling damage in multi-series-connected battery systems, where unbalanced voltage can lead to the overcharging of specific cells, causing swelling damage over time. This research provides experimental support for understanding swelling damage in large battery systems [52].
A mathematical model was developed using curve fitting and regression analysis, with the swelling measurements and operating conditions as input variables and the predicted swelling % as the output variable. The process of regression analysis involved finding a mathematical function that best describes the relationship between the response variable (swelling %) and the input parameters (upper voltage, ambient temperature, and time in hours). The model’s accuracy and effectiveness were assessed through comparison with experimental data and validated through statistical analysis.
The developed swelling model can estimate swelling for various operating conditions throughout the battery’s life and can be used to detect any anomalous behavior. The swelling model also serves as a tool for accelerated testing, where manufacturers can observe and predict swelling behavior in a shorter time by simulating various cycling scenarios and temperature conditions. This accelerates the development and testing phases, enabling a quicker assessment of cell performance under various conditions.
A double power law model, used to model the capacity fade in lithium-ion batteries, is employed, and its mathematical function is presented in Equation (2) [53]. This model not only estimates swelling for various operating conditions but also provides a prediction of the time to reach the knee point. This predicted time is valuable for establishing thresholds to mitigate swelling risks. The swelling model can serve as a baseline for comparing real-time swelling measurements and identifying anomalous behavior in lithium-ion batteries, thereby issuing early warnings.
S w e l l i n g   % = A t B + C t D + E ,
where t is the charging time in days and A , B , C , D , and E are model parameters. The data were fit for individual test conditions, and the model parameters, along with the R2 values for the fit, are shown in Table 5. The comparison between the experimental and modeled swelling data for is presented in Figure 9.
Empirical relationships for the parameters A , B , C , D , and E in Equation (2) are derived as functions of the upper cutoff voltage ( V ) and test temperature ( T ) by fitting the double-exponential model individually to swelling data for each test condition. The fitted parameter sets were then pooled, and multiple linear regression was performed to determine their dependence on voltage and temperature. Parameter C showed no clear dependence on either voltage or temperature. The resulting empirical relationships for A , B , D , and E are provided below:
A = 4.1 2.1 × V + 0.1 × T ,
B = 8.3 + 1.6 × V + 0.03 × T ,
D = 36 6.1 × V 0.06 × T ,
E = 42 + 11 × V 0.05 × T .
The intersection of two trendlines determines the time at which the knee point occurs. The first linear trendline is identified by considering the flat portion of the swelling curve, and the second trendline is identified by considering the last two data points. Utilizing tests performed under higher stress levels as training data, it becomes possible to predict the time to the knee point at lower stress levels. As observed in the experimental data, the most stressful swelling tests take the least duration to reach the knee point. The model could be developed by conducting swelling tests at a minimum of two voltage and temperature levels. Examining various mathematical functions, the function expressed in Equation (7) was found to fit the data best,
t k n e e p o i n t = 1016 × e x p b T e m p + 273 × V c .
In Equation (7), t k n e e p o i n t is the time to the knee point, while b and c are empirical coefficients specific to the battery under test. T e m p denotes temperature, and V represents the upper cutoff voltage. For the experimental dataset analyzed in this study, the fitted knee-point model coefficients b and c are 11,837 and −27.
Threshold-based warning systems can be designed in lithium-ion battery systems to detect deviations from normal behavior by setting predefined limits for swelling. These systems can provide alerts when these limits are breached, helping to identify potential issues before they become critical. Fixed threshold tolerances in design and as a warning system can be used to identify the anomalous swelling behavior of a battery. However, relying solely on a fixed upper limiting boundary (e.g., 10% of swelling) fails to capture the changing swelling behavior or provide early warnings for implementing preventive measures.
Examining the change in the slope of the time-sequential swelling profile can serve as an indicator for alterations in swelling patterns, allowing for detection before the knee point. Incorporating this slope-change indicator into the battery management system algorithm makes it possible to accurately identify critical points like the knee-point in the swelling data and effectively anticipate any deviations or abnormal behavior in the battery’s swelling characteristics.

4. Discussion

As lithium-ion cells age during storage and cycling, the combined effects of SEI layer growth, lithium plating, and electrolyte decomposition lead to irreversible expansion of the pouch cell. Such swelling poses mechanical and safety risks, including rupture and gas release. This paper examined the swelling behavior of NCA lithium-ion cells subjected to float charging for over 300 days. A three-stage swelling pattern was observed.
The first stage exhibited an initial thickness increase of 1.5–4.5%, attributed to SEI formation and gas generation resulting from electrolyte decomposition and reduction reactions. Early swelling may indicate partial formation inefficiencies or residual electrolyte instability. The second stage consisted of a plateau with negligible changes in thickness, indicating a stable SEI layer that limited further gas evolution. Under prolonged float charging at elevated temperatures and voltages, a third stage emerged, characterized by a knee point preceding rapid swelling (8–13%) due to accelerated electrolyte decomposition and gas evolution. This elevated swelling raises safety concerns, as excessive expansion can lead to mechanical stress on the battery casing and surrounding components, increasing the risk of rupture and leakage. In cells cycled only up to 220 cycles and float charging performed for up to 528 h, only the first two stages were observed; however, it is likely that if the tests had been continued, the third stage would have occurred.
EIS was employed to investigate the influence of internal electrochemical processes on swelling during charge–discharge cycling and float charging. The Nyquist plots showed a consistent rightward shift with cycles/time under all test conditions, indicating an increase in bulk resistance. This rise in resistance continued even after the swelling had stabilized during the float charging tests. A mild correlation was observed between bulk resistance and swelling for both charge–discharge cycling and float charging conditions. While this study used unconstrained cells to isolate intrinsic behavior, stack pressures should be considered to understand how mechanical compression affects swelling, impedance, and aging in modules and packs.
Swelling accelerated with increasing temperature, C-rate, and upper voltage during float charging. At 35 °C, increasing the upper voltage limit from 4.30 V to 4.35 V reduced the time to the knee point by 135 days, while raising the temperature from 35 °C to 45 °C at a constant upper voltage of 4.30 V decreased the time to the knee point by 170 days. At 4.40 V and 45 °C, the knee point occurred after 28 days, compared to 266 days at 4.30 V and 35 °C, representing an acceleration factor of approximately 8.5 times. These results provide a framework for accelerated aging protocols to simulate long-term swelling behavior.
A double exponential swelling model, with an average R2 of 0.96, captured both the early, slow growth and late, rapid expansion phases during float charging. This model can estimate swelling over the battery’s lifespan under varying stress factors and serve as a baseline for detecting abnormal expansion. By incorporating knowledge of swelling behavior and its relationship to critical thresholds, the BMS can control operating conditions to improve overall system reliability. Monitoring the slope of the swelling profile over time provides a predictive measure for identifying abnormal swelling patterns. This proactive approach could be used to enhance the overall safety and longevity of the battery system by addressing swelling issues before they escalate.

5. Conclusions

This study examined the swelling behavior of NCA-based lithium-ion pouch cells under various C-rates, temperatures, and float charging voltages. The results revealed that swelling progresses in three stages with an initial expansion due to SEI formation and gas evolution, followed by a plateau phase and then an escalation in swelling due to gas generation, whose onset occurs earlier as temperatures and voltage are increased. Electrochemical impedance spectroscopy, analyzed through an equivalent circuit model, demonstrated that bulk resistance increases consistently with aging and correlates moderately with swelling, while charge transfer resistance and diffusion characteristics exhibit weaker relationships. A double-exponential swelling model, developed from experimental data, captures both gradual and accelerated swelling phases and can estimate the time to the knee point under various operating conditions for the tested batteries. This work presents an approach to predicting lithium-ion pouch cell swelling, which can be integrated into battery management systems to enhance diagnostics, reliability, and safety of lithium-ion batteries.

Author Contributions

Conceptualization, S.M., L.K. and M.P.; methodology, S.M.; formal analysis, S.M. and L.K.; investigation, S.M. and L.K.; resources, J.K. and M.P.; data curation, S.M.; writing—original draft preparation, S.M. and L.K.; writing—review and editing, M.O., J.K. and M.P.; visualization, S.M.; supervision, M.P. All authors have read and agreed to the published version of the manuscript.

Funding

This work has been supported by the Electrochemical Safety Research Institute of UL Research Institutes through the Discoveries in Safety Grant Program.

Data Availability Statement

The raw data supporting the conclusions of this article will be made available by the authors on request.

Acknowledgments

The authors thank the Center for Advanced Life Cycle Engineering (CALCE) and its over 150 funding companies.

Conflicts of Interest

The authors declare no conflicts of interest. The funders had no role in the design of the study; in the collection, analyses, or interpretation of data; in the writing of the manuscript; or in the decision to publish the results.

Abbreviations

The following abbreviations are used in this manuscript:
SEISolid electrolyte interphase
NMCLithium nickel manganese cobalt oxide
BMSBattery management system
EISElectrochemical Impedance Spectroscopy
ECMEquivalent circuit model
1RCOne-resistor-capacitor pair
NCALithium nickel cobalt aluminum oxide
RTRoom temperature
CCConstant current
CVConstant voltage

References

  1. Maddipatla, S.; Rauf, H.; Osterman, M.; Arshad, N.; Pecht, M. Swelling Mechanisms, Diagnostic Applications, and Mitigation Strategies in Lithium-Ion Batteries. Batteries 2025, 11, 356. [Google Scholar] [CrossRef]
  2. Li, X.; Zeng, T.; Qin, H.; Huo, R.; Liu, Y.; Wei, D.; Ding, X. Investigation of Inhomogeneous Degradation in Large-Format Lithium-Ion Batteries. J. Energy Storage 2021, 42, 103113. [Google Scholar] [CrossRef]
  3. Aiken, C.P.; Self, J.; Petibon, R.; Xia, X.; Paulsen, J.M.; Dahn, J.R. A Survey of In Situ Gas Evolution during High Voltage Formation in Li-Ion Pouch Cells. J. Electrochem. Soc. 2015, 162, A760–A767. [Google Scholar] [CrossRef]
  4. Renfrew, S.E.; McCloskey, B.D. Residual Lithium Carbonate Predominantly Accounts for First Cycle CO2 and CO Outgassing of Li-Stoichiometric and Li-Rich Layered Transition-Metal Oxides. J. Am. Chem. Soc. 2017, 139, 17853–17860. [Google Scholar] [CrossRef]
  5. An, S.J.; Li, J.; Daniel, C.; Mohanty, D.; Nagpure, S.; Wood, D.L. The State of Understanding of the Lithium-Ion-Battery Graphite Solid Electrolyte Interphase (SEI) and Its Relationship to Formation Cycling. Carbon 2016, 105, 52–76. [Google Scholar] [CrossRef]
  6. Peled, E.; Menkin, S. Review—SEI: Past, Present and Future. J. Electrochem. Soc. 2017, 164, A1703–A1719. [Google Scholar] [CrossRef]
  7. Bernhard, R.; Metzger, M.; Gasteiger, H.A. Gas Evolution at Graphite Anodes Depending on Electrolyte Water Content and SEI Quality Studied by On-Line Electrochemical Mass Spectrometry. J. Electrochem. Soc. 2015, 162, A1984–A1989. [Google Scholar] [CrossRef]
  8. Metzger, M.; Strehle, B.; Solchenbach, S.; Gasteiger, H.A. Origin of H2 Evolution in LIBs: H2O Reduction vs. Electrolyte Oxidation. J. Electrochem. Soc. 2016, 163, A798–A809. [Google Scholar] [CrossRef]
  9. Mao, Z.; Farkhondeh, M.; Pritzker, M.; Fowler, M.; Chen, Z. Calendar Aging and Gas Generation in Commercial Graphite/NMC-LMO Lithium-Ion Pouch Cell. J. Electrochem. Soc. 2017, 164, A3469–A3483. [Google Scholar] [CrossRef]
  10. Lu, D.; Lin, S.; Cui, W.; Hu, S.; Zhang, Z.; Peng, W. Swelling Mechanism of 0%SOC Lithium Iron Phosphate Battery at High Temperature Storage. J. Energy Storage 2020, 32, 101791. [Google Scholar] [CrossRef]
  11. Jung, R.; Metzger, M.; Maglia, F.; Stinner, C.; Gasteiger, H.A. Oxygen Release and Its Effect on the Cycling Stability of LiNixMnyCozO2 (NMC) Cathode Materials for Li-Ion Batteries. J. Electrochem. Soc. 2017, 164, A1361–A1377. [Google Scholar] [CrossRef]
  12. Zhang, S.S. Insight into the Gassing Problem of Li-Ion Battery. Front. Energy Res. 2014, 2, 59. [Google Scholar] [CrossRef]
  13. Belharouak, I.; Koenig, G.M.; Tan, T.; Yumoto, H.; Ota, N.; Amine, K. Performance Degradation and Gassing of Li4Ti5O12/LiMn2O4 Lithium-Ion Cells. J. Electrochem. Soc. 2012, 159, A1165–A1170. [Google Scholar] [CrossRef]
  14. Berkes, B.B.; Schiele, A.; Sommer, H.; Brezesinski, T.; Janek, J. On the Gassing Behavior of Lithium-Ion Batteries with NCM523 Cathodes. J. Solid State Electrochem. 2016, 20, 2961–2967. [Google Scholar] [CrossRef]
  15. Mao, C.; Ruther, R.E.; Geng, L.; Li, Z.; Leonard, D.N.; Meyer, H.M.; Sacci, R.L.; Wood, D.L. Evaluation of Gas Formation and Consumption Driven by Crossover Effect in High-Voltage Lithium-Ion Batteries with Ni-Rich NMC Cathodes. ACS Appl. Mater. Interfaces 2019, 11, 43235–43243. [Google Scholar] [CrossRef]
  16. Wang, J.; Li, Y.; Liu, F.; Fang, Z.; Gu, N.; Chen, B.; Yang, N.; Jia, Y. A Comparative Study of Overcharge Thermal Runaway Force-Electrical-Thermal Characteristics and Safety Assessment of Lithium Batteries with Different Cathode Materials. Appl. Therm. Eng. 2024, 256, 124092. [Google Scholar] [CrossRef]
  17. Feng, X.; Ouyang, M.; Liu, X.; Lu, L.; Xia, Y.; He, X. Thermal Runaway Mechanism of Lithium Ion Battery for Electric Vehicles: A Review. Energy Storage Mater. 2018, 10, 246–267. [Google Scholar] [CrossRef]
  18. Xiong, D.J.; Petibon, R.; Nie, M.; Ma, L.; Xia, J.; Dahn, J.R. Interactions between Positive and Negative Electrodes in Li-Ion Cells Operated at High Temperature and High Voltage. J. Electrochem. Soc. 2016, 163, A546–A551. [Google Scholar] [CrossRef]
  19. Oh, K.-Y.; Epureanu, B.I. A Novel Thermal Swelling Model for a Rechargeable Lithium-Ion Battery Cell. J. Power Sources 2016, 303, 86–96. [Google Scholar] [CrossRef]
  20. Oh, K.-Y.; Siegel, J.B.; Secondo, L.; Kim, S.U.; Samad, N.A.; Qin, J.; Anderson, D.; Garikipati, K.; Knobloch, A.; Epureanu, B.I.; et al. Rate Dependence of Swelling in Lithium-Ion Cells. J. Power Sources 2014, 267, 197–202. [Google Scholar] [CrossRef]
  21. Oh, K.-Y.; Samad, N.A.; Kim, Y.; Siegel, J.B.; Stefanopoulou, A.G.; Epureanu, B.I. A Novel Phenomenological Multi-Physics Model of Li-Ion Battery Cells. J. Power Sources 2016, 326, 447–458. [Google Scholar] [CrossRef]
  22. Sauerteig, D.; Hanselmann, N.; Arzberger, A.; Reinshagen, H.; Ivanov, S.; Bund, A. Electrochemical-Mechanical Coupled Modeling and Parameterization of Swelling and Ionic Transport in Lithium-Ion Batteries. J. Power Sources 2018, 378, 235–247. [Google Scholar] [CrossRef]
  23. Li, Y.; Wei, C.; Sheng, Y.; Jiao, F.; Wu, K. Swelling Force in Lithium-Ion Power Batteries. Ind. Eng. Chem. Res. 2020, 59, 12313–12318. [Google Scholar] [CrossRef]
  24. Mohtat, P.; Lee, S.; Siegel, J.B.; Stefanopoulou, A.G. Reversible and Irreversible Expansion of Lithium-Ion Batteries Under a Wide Range of Stress Factors. J. Electrochem. Soc. 2021, 168, 100520. [Google Scholar] [CrossRef]
  25. Lin, X.; Khosravinia, K.; Hu, X.; Li, J.; Lu, W. Lithium Plating Mechanism, Detection, and Mitigation in Lithium-Ion Batteries. Prog. Energy Combust. Sci. 2021, 87, 100953. [Google Scholar] [CrossRef]
  26. Juarez-Robles, D.; Vyas, A.A.; Fear, C.; Jeevarajan, J.A.; Mukherjee, P.P. Overcharge and Aging Analytics of Li-Ion Cells. J. Electrochem. Soc. 2020, 167, 090547. [Google Scholar] [CrossRef]
  27. Sauerteig, D.; Ivanov, S.; Reinshagen, H.; Bund, A. Reversible and Irreversible Dilation of Lithium-Ion Battery Electrodes Investigated by in-Situ Dilatometry. J. Power Sources 2017, 342, 939–946. [Google Scholar] [CrossRef]
  28. Stravova, Z.; Klvac, O.; Bana, J.; Anothumakkool, B.; Zikmund, T.; Blazek, P.; Kaiser, J.; Kazda, T. Comprehensive Study of Rapid Capacity Fade in Prismatic Li-Ion Cells with Flexible Packaging. Sci. Rep. 2024, 14, 28546. [Google Scholar] [CrossRef]
  29. Wu, L.; Wei, X.; Lin, C.; Huang, Z.; Fan, Y.; Liu, C.; Fang, S. Battery SOC Estimation with Physics-Constrained BiLSTM under Different External Pressures and Temperatures. J. Energy Storage 2025, 117, 116205. [Google Scholar] [CrossRef]
  30. Zhou, H.; Yang, Y.; Song, Y.; Wang, W.; Yang, L.; Du, X. Capacity Degradation of NMC/Graphite Battery Based on Electrochemical-Mechanical-Thermal Coupling Aging Model. J. Energy Storage 2025, 135, 118249. [Google Scholar] [CrossRef]
  31. Tian, Y.; Lin, C.; Li, H.; Du, J.; Xiong, R. Detecting Undesired Lithium Plating on Anodes for Lithium-Ion Batteries—A Review on the in-Situ Methods. Appl. Energy 2021, 300, 117386. [Google Scholar] [CrossRef]
  32. Cai, T.; Pannala, S.; Stefanopoulou, A.G.; Siegel, J.B. Battery Internal Short Detection Methodology Using Cell Swelling Measurements. In Proceedings of the 2020 American Control Conference (ACC), Denver, CO, USA, 1–3 July 2020; pp. 1143–1148. [Google Scholar]
  33. Zhao, Y.; Spingler, F.B.; Patel, Y.; Offer, G.J.; Jossen, A. Localized Swelling Inhomogeneity Detection in Lithium Ion Cells Using Multi-Dimensional Laser Scanning. J. Electrochem. Soc. 2019, 166, A27–A34. [Google Scholar] [CrossRef]
  34. Choi, W.; Shin, H.-C.; Kim, J.M.; Choi, J.-Y.; Yoon, W.-S. Modeling and Applications of Electrochemical Impedance Spectroscopy (EIS) for Lithium-Ion Batteries. J. Electrochem. Sci. Technol. 2020, 11, 1–13. [Google Scholar] [CrossRef]
  35. Meddings, N.; Heinrich, M.; Overney, F.; Lee, J.-S.; Ruiz, V.; Napolitano, E.; Seitz, S.; Hinds, G.; Raccichini, R.; Gaberšček, M.; et al. Application of Electrochemical Impedance Spectroscopy to Commercial Li-Ion Cells: A Review. J. Power Sources 2020, 480, 228742. [Google Scholar] [CrossRef]
  36. Hahn, M.; Buqa, H.; Ruch, P.W.; Goers, D.; Spahr, M.E.; Ufheil, J.; Novák, P.; Kötz, R. A Dilatometric Study of Lithium Intercalation into Powder-Type Graphite Electrodes. Electrochem. Solid-State Lett. 2008, 11, A151. [Google Scholar] [CrossRef]
  37. Li, R.; Li, W.; Singh, A.; Ren, D.; Hou, Z.; Ouyang, M. Effect of External Pressure and Internal Stress on Battery Performance and Lifespan. Energy Storage Mater. 2022, 52, 395–429. [Google Scholar] [CrossRef]
  38. Leonard, A.; Planden, B.; Lukow, K.; Morrey, D. Investigation of Constant Stack Pressure on Lithium-Ion Battery Performance. J. Energy Storage 2023, 72, 108422. [Google Scholar] [CrossRef]
  39. Leung, P.K.; Moreno, C.; Masters, I.; Hazra, S.; Conde, B.; Mohamed, M.R.; Dashwood, R.J.; Bhagat, R. Real-Time Displacement and Strain Mappings of Lithium-Ion Batteries Using Three-Dimensional Digital Image Correlation. J. Power Sources 2014, 271, 82–86. [Google Scholar] [CrossRef]
  40. Cheng, X.; Pecht, M. In Situ Stress Measurement Techniques on Li-Ion Battery Electrodes: A Review. Energies 2017, 10, 591. [Google Scholar] [CrossRef]
  41. Plotnikov, Y.; Karp, J.; Knobloch, A.; Kapusta, C.; Lin, D. Eddy Current Sensor for In-Situ Monitoring of Swelling of Li-Ion Prismatic Cells. AIP Conf. Proc. 2015, 1650, 434–442. [Google Scholar]
  42. Bonefacino, J.; Ghashghaie, S.; Zheng, T.; Lin, C.-P.; Zheng, W.; Blanquer, L.A.; Huang, J.; Gervillié, C.; Tam, H.-Y.; Tarascon, J.-M.; et al. High-Fidelity Strain and Temperature Measurements of Li-Ion Batteries Using Polymer Optical Fiber Sensors. J. Electrochem. Soc. 2022, 169, 100508. [Google Scholar] [CrossRef]
  43. Wang, X.; Sone, Y.; Segami, G.; Naito, H.; Yamada, C.; Kibe, K. Understanding Volume Change in Lithium-Ion Cells during Charging and Discharging Using In Situ Measurements. J. Electrochem. Soc. 2007, 154, A14. [Google Scholar] [CrossRef]
  44. Hendricks, C.; Sood, B.; Pecht, M. Lithium-Ion Battery Strain Gauge Monitoring and Depth of Discharge Estimation. J. Electrochem. Energy Convers. Storage 2023, 20, 011008. [Google Scholar] [CrossRef]
  45. Willenberg, L.K.; Dechent, P.; Fuchs, G.; Sauer, D.U.; Figgemeier, E. High-Precision Monitoring of Volume Change of Commercial Lithium-Ion Batteries by Using Strain Gauges. Sustainability 2020, 12, 557. [Google Scholar] [CrossRef]
  46. Osterman, M.; Maddipatla, S. Swelling in Lithium-Ion Pouch Batteries. In Proceedings of the 2024 Pan Pacific Strategic Electronics Symposium (Pan Pacific), Kona, Big Island, HI, USA, 29 January–1 February 2024; IEEE: New York, NY, USA, 2024; pp. 1–4. [Google Scholar]
  47. Lazanas, A.C.; Prodromidis, M.I. Electrochemical Impedance Spectroscopy—A Tutorial. ACS Meas. Sci. Au 2023, 3, 162–193. [Google Scholar] [CrossRef]
  48. Hu, W.; Peng, Y.; Wei, Y.; Yang, Y. Application of Electrochemical Impedance Spectroscopy to Degradation and Aging Research of Lithium-Ion Batteries. J. Phys. Chem. C 2023, 127, 4465–4495. [Google Scholar] [CrossRef]
  49. Wu, X.; He, Z.; Wang, T.; Li, X.; Yang, D.; Wang, Q.; Li, Y. Effects of Temperature on Electrochemical Impedance Spectroscopy of the LiFePO4 Battery. IOP Conf. Ser. Earth Environ. Sci. 2021, 675, 012220. [Google Scholar] [CrossRef]
  50. Zhu, X.; Soult, M.C.; Wouters, B.; Mamme, M.H. Study of Solid-State Diffusion Impedance in Li-Ion Batteries Using Parallel-Diffusion Warburg Model. J. Electrochem. Soc. 2024, 171, 060539. [Google Scholar] [CrossRef]
  51. Maheshwari, A.; Heck, M.; Santarelli, M. Cycle Aging Studies of Lithium Nickel Manganese Cobalt Oxide-Based Batteries Using Electrochemical Impedance Spectroscopy. Electrochim. Acta 2018, 273, 335–348. [Google Scholar] [CrossRef]
  52. Chung, H.-C. The Long-Term Usage of an Off-Grid Photovoltaic System with a Lithium-Ion Battery-Based Energy Storage System on High Mountains: A Case Study in Paiyun Lodge on Mt. Jade in Taiwan. Batteries 2024, 10, 202. [Google Scholar] [CrossRef]
  53. Diao, W.; Kim, J.; Azarian, M.H.; Pecht, M. Degradation Modes and Mechanisms Analysis of Lithium-Ion Batteries with Knee Points. Electrochim. Acta 2022, 431, 141143. [Google Scholar] [CrossRef]
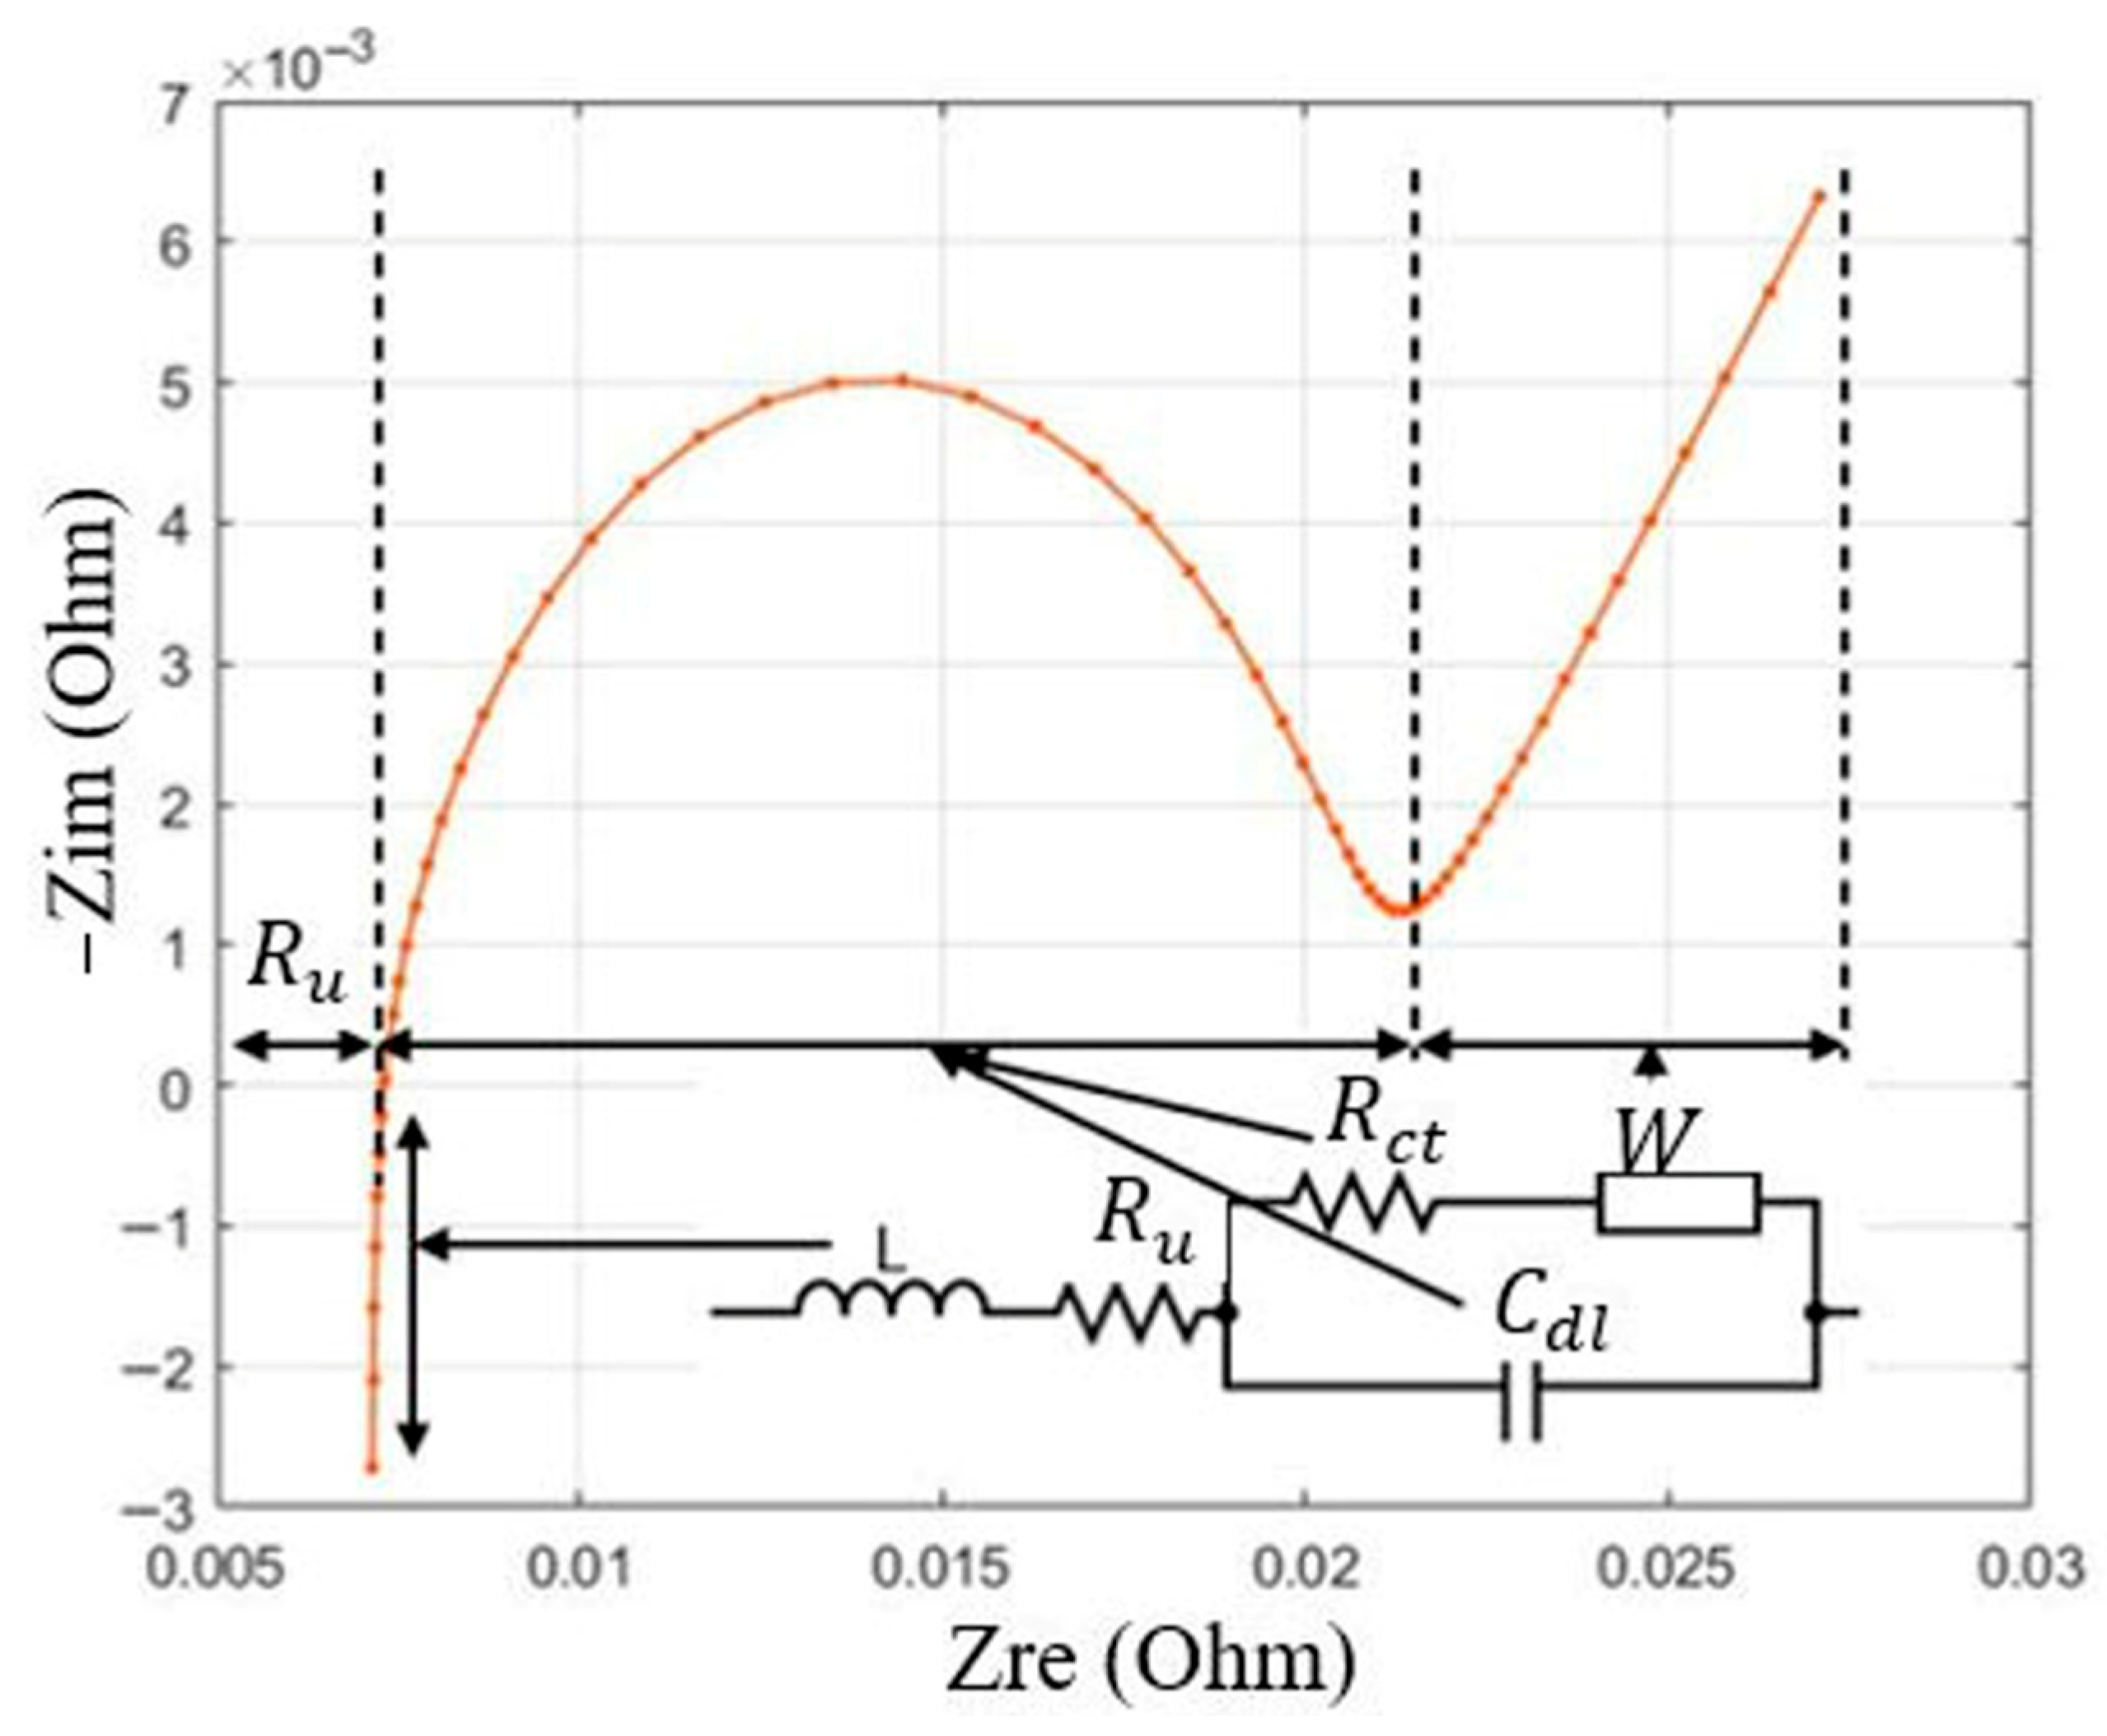
Figure 1. The equivalent circuit model corresponds to the impedance spectrum.
Batteries 11 00419 g001
Figure 2. Schematic of the experimental setup.
Batteries 11 00419 g002
Figure 3. (a) Change in thickness, (b) Normalized discharge capacity, and (c) Normalized impedance at 1 kHz as a function of C-rate, temperature, and number of cycles. All room temperature (RT) tests were conducted at 25 ± 3 °C.
Batteries 11 00419 g003
Figure 4. (a) Normalized bulk resistance, (b) Normalized charge transfer resistance, and (c) The slope of Warburg region as a function of C-rate, temperature, and number of cycles. All room temperature (RT) tests were conducted at 25 ± 3 °C.
Batteries 11 00419 g004
Figure 5. Nyquist plots for charge–discharge cycle tests: (a) 1C/1C at RT, (b) 1C/1C at 45 °C, (c) 2C/2C at RT, and (d) 2C/2C at 45 °C. The dark blue line graph represents initial EIS tests, while the dark red indicates the measurement at 220 cycles. All room temperature (RT) tests were conducted at 25 ± 3 °C.
Batteries 11 00419 g005
Figure 6. (a) Change in thickness, (b) Normalized discharge capacity, and (c) Normalized impedance at 1 kHz as a function of upper voltage limit, temperature, and time. All room temperature (RT) tests were conducted at 25 ± 3 °C.
Batteries 11 00419 g006
Figure 7. (a) Normalized bulk resistance, (b) Normalized charge transfer resistance, and (c) The slope of the Warburg region as a function of upper voltage limit, temperature, and time. All room temperature (RT) tests were conducted at 25 ± 3 °C.
Batteries 11 00419 g007
Figure 8. Nyquist plots for float charging tests: (a) 4.2 V at RT, (b) 4.2 V at 45 °C, (c) 4.23 V at RT, and (d) 4.23 V at 45 °C. The dark blue line graph represents initial EIS tests, while the dark red indicates the measurement at 528 h. All room temperature (RT) tests were conducted at 25 ± 3 °C.
Batteries 11 00419 g008
Figure 9. Experimental test results and model-predicted results of swelling % for float charging tests at high stress conditions.
Batteries 11 00419 g009
Table 1. Test conditions for charge–discharge cycling and float charging tests.
Test NameVoltage LimitsC-RateTemperature
Charge Discharge Cycling3.0 V to 4.20 V1 C25 ± 3 °C
3.0 V to 4.20 V2 C25 ± 3 °C
3.0 V to 4.20 V1 C45 °C
3.0 V to 4.20 V2 C45 °C
Constant Voltage Charging3.0 V to 4.20 V–Hold at 4.20 V0.5 C25 ± 3 °C
3.0 V to 4.20 V–Hold at 4.20 V0.5 C45 °C
3.0 V to 4.23 V–Hold at 4.23 V0.5 C25 ± 3 °C
3.0 V to 4.23 V–Hold at 4.23 V0.5 C45 °C
Table 2. Test conditions for accelerated float charging tests.
Test NameVoltage LimitsTemperature
Constant High Voltage Charging3.0 V to 4.30 V–Hold at 4.30 V35 °C
3.0 V to 4.30 V–Hold at 4.30 V40 °C
3.0 V to 4.30 V–Hold at 4.30 V 45 °C
3.0 V to 4.35 V–Hold at 4.35 V35 °C
3.0 V to 4.35 V–Hold at 4.35 V40 °C
3.0 V to 4.35 V–Hold at 4.35 V45 °C
3.0 V to 4.40 V–Hold at 4.40 V35 °C
3.0 V to 4.40 V–Hold at 4.40 V40 °C
3.0 V to 4.40 V–Hold at 4.40 V45 °C
Table 3. Correlation coefficients for ECM parameters for charge–discharge cycle tests.
ECM ParametersSwelling Pearson’s Correlation Coefficient
Bulk Resistance0.50
Charge Transfer Resistance−0.03
Double Layer Capacitance−0.25
Slope of Warburg Region0.16
Table 4. Correlation coefficients for ECM parameters for float charging tests.
ECM ParametersSwelling Pearson’s Correlation Coefficient
Bulk Resistance0.36
Charge Transfer Resistance0.09
Double Layer Capacitance−0.25
Slope of Warburg Region−0.52
Table 5. Model parameters for individual test conditions of constant voltage charge tests.
TemperatureVoltage A B C D E R2
35 °C4.40 V−2.38−0.198.59 × 10−157.334.840.98
35 °C4.35 V−2.04−0.611.03 × 10−146.652.820.95
35 °C4.30 V−1.56−0.339.04 × 10−218.423.040.93
45 °C4.40 V−0.90−0.044.84 × 10−106.393.830.97
45 °C4.35 V−1.17−0.266.68 × 10−137.212.841.00
45 °C4.30 V−1.33−0.171.67 × 10−147.072.540.99
40 °C4.40 V−2.10−0.428.93 × 10−137.083.330.99
40 °C4.35 V−1.96−0.558.85 × 10−157.193.590.98
40 °C4.30 V−1.86−0.642.90 × 10−167.143.120.97
Disclaimer/Publisher’s Note: The statements, opinions and data contained in all publications are solely those of the individual author(s) and contributor(s) and not of MDPI and/or the editor(s). MDPI and/or the editor(s) disclaim responsibility for any injury to people or property resulting from any ideas, methods, instructions or products referred to in the content.