Article

Electrode Capacity Balancing for Accurate Battery State of Health Prediction and Degradation Analysis

1
School of Mechanical Engineering, Tianjin University, Tianjin 300350, China
2
National Industry-Education Platform of Energy Storage, Tianjin University, Tianjin 300350, China
*
Author to whom correspondence should be addressed.
Batteries 2025, 11(10), 367; https://doi.org/10.3390/batteries11100367
Submission received: 15 September 2025 / Revised: 29 September 2025 / Accepted: 30 September 2025 / Published: 3 October 2025
(This article belongs to the Special Issue State-of-Health Estimation of Batteries)

Abstract

Battery technology plays an increasingly vital role in portable electronic devices, electric vehicles, and renewable energy storage. During operation, batteries undergo performance degradation, which not only reduces device efficiency, but may also pose safety risks. The State of Health (SOH) is a crucial indicator for assessing battery condition. Traditional SOH prediction methods face limitations in real-time adjustment and accuracy under complex operating conditions. By determining electrode capacity loss and identifying complex patterns that traditional methods struggle to detect, prediction accuracy can be improved. Based on electrode capacity matching and compensation relationships, this paper proposes an electrode capacity balance model to evaluate battery development trends and degradation during cycling. We use qLiqp state assessment as a trend criterion, qp to quantify aging, and Qc to identify thermal runaway risk levels, developing more efficient SOH prediction indicators and methods to ensure battery safety and performance.

1. Introduction

In today’s technology-driven world, battery technology has become the core driver for portable electronic devices, electric vehicles, and renewable energy storage systems. As these applications become increasingly prevalent, battery performance and reliability significantly impact overall device functionality and user experience. However, batteries inevitably undergo performance degradation during use, which affects device efficiency and may pose safety risks. Therefore, accurate prediction of battery State of Health (SOH) has become a crucial research topic.
SOH is a key indicator for measuring the condition of a battery’s health, monitoring battery status, predicting remaining life, and ensuring operation within safe parameters. Both battery manufacturers and users urgently need reliable SOH prediction methods so that appropriate measures can be taken before significant battery performance degradation occurs. Battery SOH prediction is not only crucial for extending battery life and improving device safety, but also represents an important direction for advancing battery technology.
Current traditional methods are static and complex, lacking self-adjustment capabilities based on battery aging states or usage pattern changes. They lag in real-time applications and cannot meet modern requirements for accuracy and immediacy. Their prediction accuracy is limited when facing complex battery chemical reactions and varying operating environments. Lithium-ion battery SOH assessment methods primarily fall into two categories: model-driven and data-driven approaches. For battery SOH estimation, three main indicators are defined: internal resistance, impedance, and capacity. Battery capacity reflects energy storage capability, while internal resistance and impedance indicate power capability. In hybrid power applications, battery power is more significant compared to in electric vehicles, where battery energy is crucial. Thus, the condition of health of batteries can be monitored through power indicators like internal resistance and impedance. Due to aging mechanisms, these parameters change throughout battery life. Battery SOH can be calculated using the ratio between current indicator values (capacity, impedance, or resistance) and their initial values. At End of Life (EOL), considering vehicle applications, battery capacity may degrade by up to 20%, while internal resistance may increase by up to 160% of its initial value [1]. Therefore, tracking these changes is essential for estimating battery SOH. This tracking is challenging as changes in battery resistance and capacity stem from various causes and their interactions. Several studies have traced these root causes from internal battery degradation perspectives [2]. The main causes appear to be Solid Electrolyte Interface (SEI) formation [3,4], lithium plating, and lithium loss in active carbon areas in batteries [5,6]. Additionally, changes in these SOH indicators may be caused by external conditions, such as temperature variations and SOC levels. However, these changes often represent specific points in battery chemical reaction processes and are mostly reversible; no systematic indicators have been proposed that adequately reflect the continuous deterioration of battery health status.
With advancing research into battery internal reactions and structural changes, new approaches to battery SOH prediction have emerged based on capacity and structural changes induced by electrode side reactions. This paper analyzes battery capacity and reaction data during usage to examine how electrode capacity changes and their interrelationships affect electrode structural evolution. This approach captures complex patterns and trends that traditional methods struggle to identify, enabling more accurate predictions. SOH prediction allows for real-time monitoring of battery status, precise health condition forecasting, and provision of appropriate maintenance recommendations.

2. Experimental System and Conditions

As shown in Figure 1, the experimental system employed 2.6 Ah cylindrical 18,650 commercial batteries (NCM532-LCO, Lishen Battery is based in Tianjin, China), using a lithium–nickel–cobalt–manganese oxide mixture as the cathode and graphite as the anode. To ensure result comparability, batteries were first screened based on their capacity and DC internal resistance. The twelve selected batteries had a capacity of 2.811 ± 0.062 Ah and an internal resistance of 0.0678 ± 0.0032 Ω, with detailed parameters shown in Table 1.
The health status of lithium-ion batteries not only depends on the material system and cell design, but also varies with usage conditions, with voltage and current being the primary factors affecting electrode structural changes [7]. Based on electric vehicle battery operating conditions, this study designed three room-temperature high-voltage cycling conditions to induce different battery health states. The charging cut-off voltages for the three experimental conditions were set at 4.4 V, 4.5 V, and 4.6 V, respectively, with the charge–discharge current set at 1 C, the cut-off current at 0.05 C, and the discharge cut-off voltage at 2.75 V.
The battery cycling process consisted of the following steps: (1) constant current charging to 4.4 V at the specified rate, followed by constant voltage charging until the current dropped below 0.05 C; (2) rest for 30 min; (3) constant current discharging to 2.75 V at the same rate as charging; (4) rest for 30 min. The battery underwent 45 cycles according to the rate protocol shown in Table 1. During the experiment, a temperature-measuring thermocouple was fixed to the center of the battery’s side surface using heat-resistant tape to collect surface temperature data. The measurement accuracy of the thermocouple was ±0.2 °C.

3. Battery Health State Analysis

Battery life is determined by changes in discharge capacity. SAE J2464 [8] and Feng, X [9] proposed critical temperature rise rates for battery thermal runaway of 10 °C/min and 1 °C/s, respectively. In experiments conducted at room temperature to capture the instantaneous heating characteristics during thermal runaway, thermocouples placed on the battery surface cannot precisely determine the internal temperature; therefore, the temperature rise rate during thermal runaway is used as the criterion. For the thermal runaway temperature, Feng [9] primarily relies on battery temperature measurements in an adiabatic ARC environment, whereas the SAE J2464 [8] standard assesses battery temperature during room-temperature experiments. Consequently, dT/dt > 10 °C/min is adopted as the criterion for identifying thermal runaway.
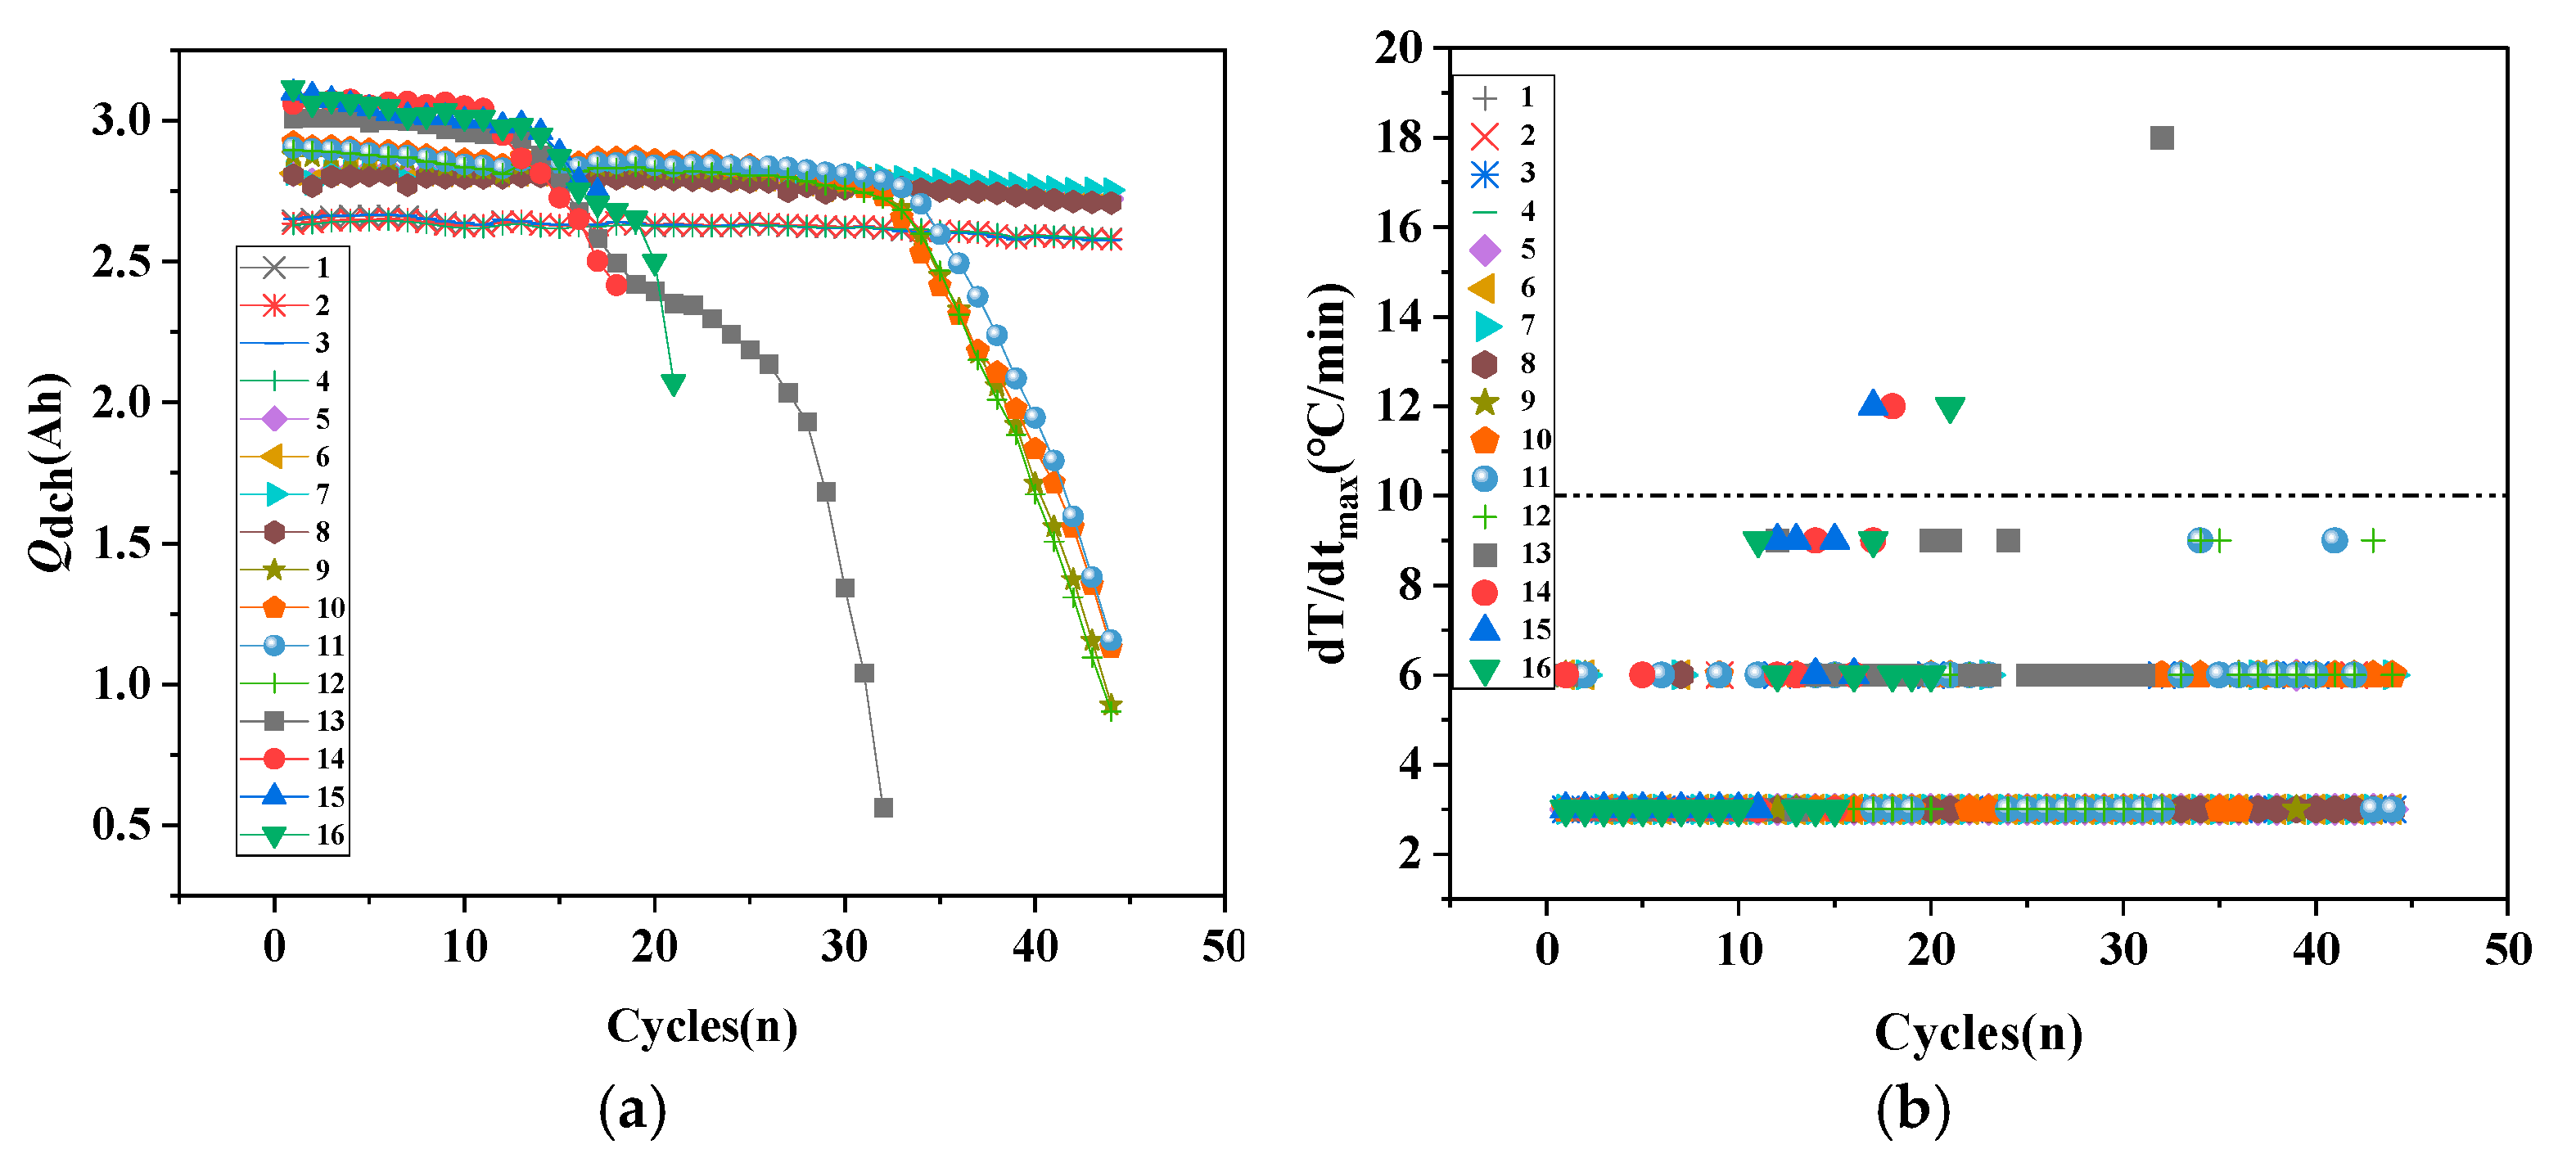
Based on different charging voltages (4.2 V, 4.4 V, 4.5 V, 4.6 V), battery cycling involved 16 cells and consisted of four replicate experiments under three operating conditions. The criteria for evaluating battery aging and thermal runaway were determined by changes in battery capacity (Figure 2a) and the rate of temperature rise (Figure 2b) during thermal runaway.
In Figure 2b, Condition 1 and Condition 2 show a stable battery discharge capacity with temperature rise rates below 10 °C/min. Under Condition 3, the battery exhibits gradual capacity degradation to 0.5 Ah, while maintaining temperature rise rates below 10 °C/min. Under Condition 4, capacity reduction occurs several cycles earlier than under Condition 3, with temperature rise rates exceeding 10 °C/min, meeting thermal runaway criteria. Since the trends under Operating Condition 1 and Operating Condition 2 are consistent, the following analysis will primarily focus on Operating Condition 2, Operating Condition 3, and Operating Condition 4.

3.1. Internal Capacity Balance Model for Battery Degradation During Cycling

In lithium-ion battery technology, multiple potential degradation modes of battery chemical characteristics indicate that different battery chemical compositions and structures significantly impact performance and safety. Loss of Lithium Inventory (LLI) at the anode due to SEI layer formation typically occurs in early battery aging stages. Additionally, lithium plating side reactions at the anode consume lithium ions, making them unavailable for cycling between the cathode and anode, leading to capacity degradation. Another degradation mode is Loss of Active Material (LAM), where active particles become unavailable for lithium intercalation due to electronic or ionic insulation, particle fracture, or structural disorder. Since active material loss and lithium loss can occur at both the cathode and anode, there are LAMpe, LAMne, and LLIne LLIpe modes. Wu, W et al. [9] proposed calculation methods for battery LLI and LAM, but could not differentiate between the cathode and anode. Therefore, this paper uses cathode lithium intercalation qp to represent cathode active material loss LAMpe. Attia, P. M. et al. [10] indicated that cathode active material loss significantly exceeds anode loss, while Han, X. et al. [11] showed that lithium inventory loss mainly results from anode SEI and plating. Thus, the anode lithium inventory loss qLi represents anode lithium loss. Battery degradation paths are determined by the relative relationship between LLI and LAM [10]. During cycling, electrode capacities establish LLI and LAM balance through qLiqp. Gauthier, R. et al. [12] demonstrated that capacity changes in half-cells and full cells correspond to qLiqp, also expressing battery capacity changes.
Based on lithium quantity consistency during capacity degradation from [13], the relationship between capacity and reactions yields the anode lithium inventory loss qLi and cathode lithium intercalation loss qp. Q d c h n and Q c h n are the discharge and charge capacities of the nth cycle, and t d c h ( n ) and t c h ( n ) are the discharge and charge times of the nth cycle, respectively, cathode capacity Qc is also included. Establishing the relationship between the electrode capacity and the quantity of lithium conservation in the battery during the cycling process. The primary source of capacity loss at the anode arises from reduction reactions occurring at the anode. During charging, lithium ions intercalate into the anode, and during discharging, lithium ions deintercalate; in both processes, reduction reactions occur. Assuming that the average rate of the reduction reaction in each cycle is Ired, the reduction reaction rate and the corresponding capacity loss are calculated as follows:
i red = Q ch ( n ) Q dch ( n ) t dch ( n ) + t ch ( n )
q L i ( n ) = i r e d ( t c h ( n ) + t d c h ( n ) )
The cathode capacity during discharge consists of lithium ions involved in lithium- ion transport and interfacial oxidation reactions at the cathode. A portion of the cathode lithium ions becomes intercalated into the cathode active particles and cannot be deintercalated, representing the lithium loss in the cathode active particles, qp. During charging, after excluding qp from the cathode, the remaining cycling lithium ions undergo complete deintercalation. Assuming that the average rate of interfacial oxidation reactions in each cycle is Iox, the cathode capacity Qc and the charging time tch satisfy the following equation:
t c h ( n ) = Q c q p i c h ( n ) i o x
Q c = Q d c h ( n 1 ) + i o x × t dch ( n 1 )
Combining Equations (3) and (4) yields
i o x ( n 1 ) = Q c h ( n ) Q d c h ( n 1 ) + q p ( n 2 ) t dch ( n 1 ) + t c h ( n )
q p ( n 1 ) = Q d c h ( n 1 ) Q c h ( n ) + i o x ( n 1 ) ( t dch ( n 1 ) + t c h ( n ) )
Assumption: n = 1 , q p = 0
i o x ( 1 ) = Q c h ( 2 ) Q d c h ( 1 ) t dch ( 1 ) + t c h ( 2 )
q p ( 2 ) = Q d c h ( 2 ) Q c h ( 3 ) + i o x ( 2 ) ( t dch ( 2 ) + t c h ( 3 ) )
According to Equations (7) and (8), the initial values of the cathode oxidation reaction rate and the capacity loss due to lithium intercalation in the cathode active particles are obtained, respectively. Based on Equations (5) and (6), the cathode oxidation reaction rate and the capacity loss due to lithium intercalation in the cathode active particles for each cycle are determined. Using the cathode oxidation reaction rate, the cathode capacity is computed according to Equation (4).
Changes in the electrode active particles are determined by the peak variations in the incremental capacity analysis (ICA) curve [9].
L A M = max d Q d V 1 max d Q d V n max d Q d V 1

3.2. Analysis of Battery Health Performance Decline

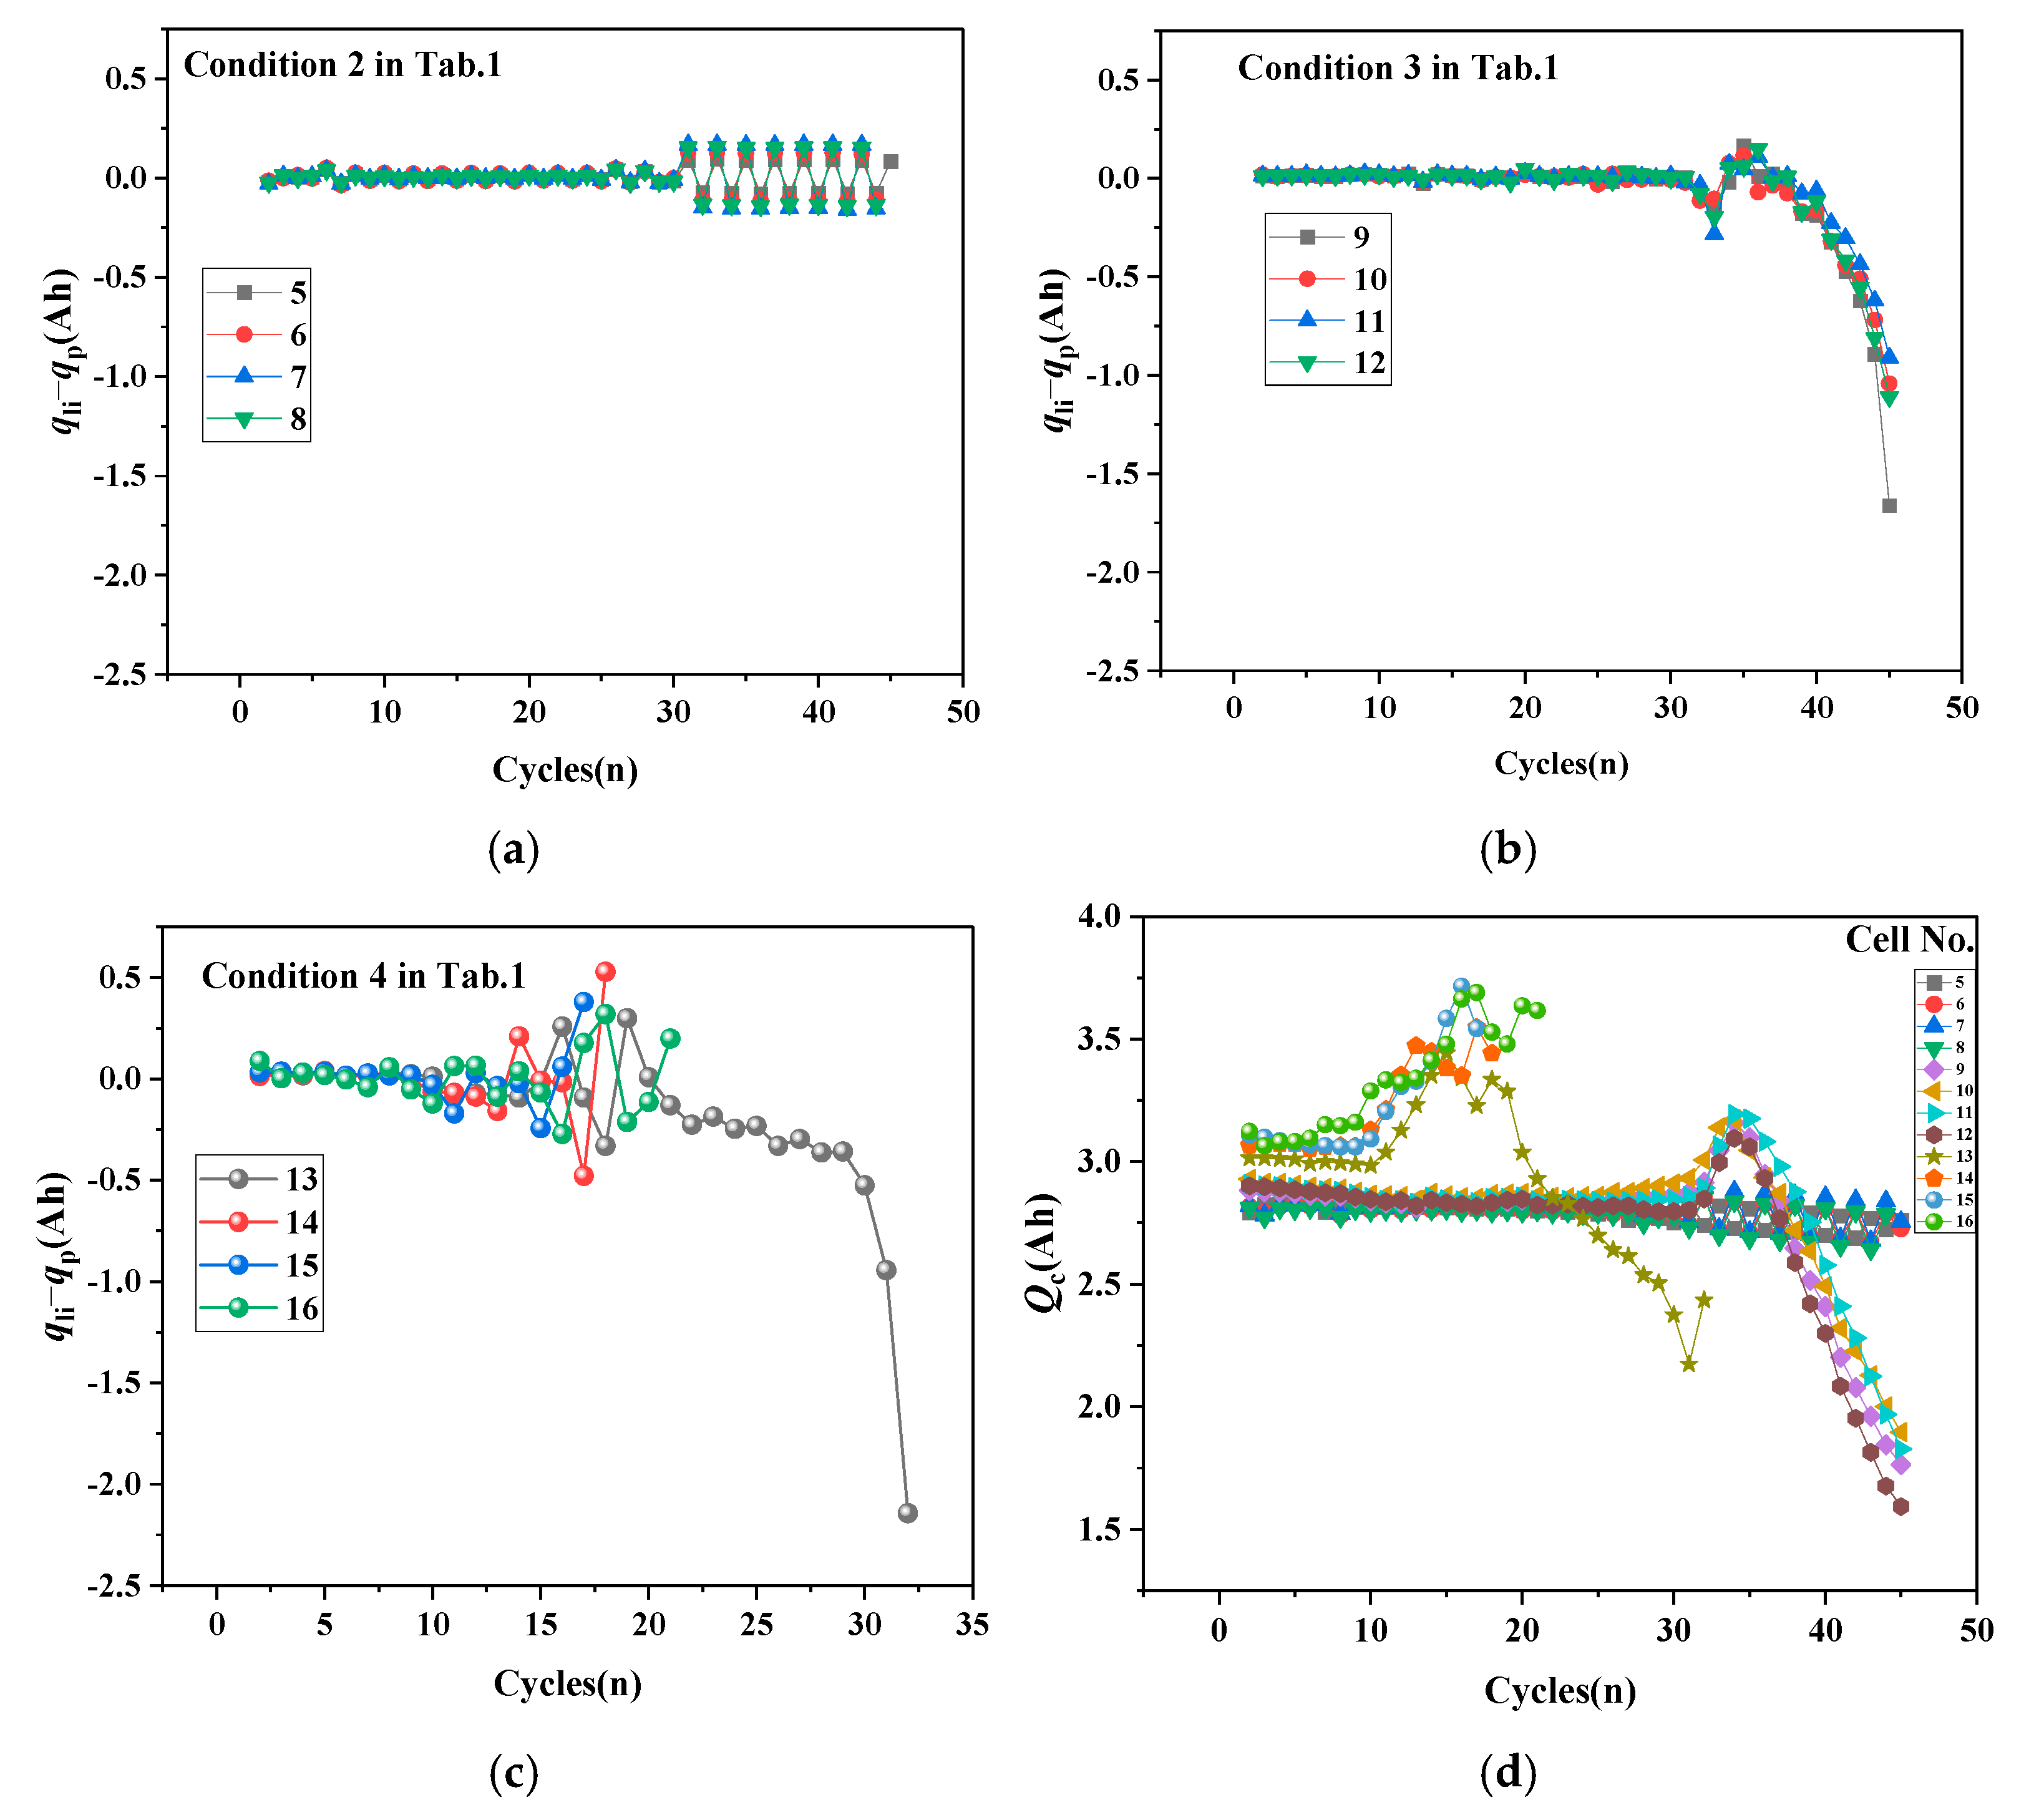
The difference in cathode and anode capacity losses can be obtained from the relationship between electrode capacities in Equations (2) and (6); the capacity loss difference between the cathode and anode is shown in Figure 3.
In Figure 3, the lithium loss at the anode maintains a stable balance with cathode lithiation in stable batteries. In aged batteries, cathode lithiation increases significantly. In thermal runaway batteries, after the anode lithium loss is compensated for by cathode structural lithiation loss, the anode lithium loss increases again, resulting in continuous fluctuations in the capacity difference between the cathode and anode. The cathode capacity follows the same trend as the capacity difference between the cathode and anode. When anode lithium loss increases, lithium deposition from the cathode structure compensates for this capacity loss to maintain the capacity balance between the two electrodes.
Under Condition 2, the stable battery shows steady lithium inventory loss at the anode, while cathode lithiation remains relatively stable. The later periodic fluctuations arise from dynamic compensation of structural lithium due to minor lithium inventory losses occurring at the anode interface, without affecting the capacity balance between the two electrodes. Under Condition 3, the aged battery experiences initial electrode capacity imbalance due to cathode lithiation, followed by the cathode structural lithium compensating for anode interface film lithium loss. Subsequently, cathode lithiation exceeds the anode lithium inventory loss. As the cathode lithiation rate aligns with the active particle loss rate, where active particle loss outpacing lithium loss during cathode compensation, the cathode voltage window widens [10]. This increases the battery voltage for quantitative lithium transfer and reduces the capacity between voltage limits, with electrodes reaching saturation and cut-off voltage before complete lithium transfer. Attia, P. M. et al [10] indicate that rapid capacity decay acceleration is triggered by electrode saturation, where active sites are reduced and cannot accommodate incoming lithium inventory, with one electrode’s LAM exceeding another’s LLI.
Under Condition 4, when anode lithium inventory loss exceeds cathode lithiation loss, cathode structural lithium provides compensation. Anode lithium inventory loss is influenced by the anode interface, with a stable interface preventing anode reduction reactions [14]. However, when anode lithium inventory loss recurs and exceeds the initial anode lithium inventory and cathode lithiation, it triggers repeated cathode structural lithium compensation, leading to cathode structural decomposition. The recurring and elevated anode lithium inventory loss indicates SEI instability and decomposition, which raises the anode potential and establishes a positive feedback loop for SEI decomposition. Lithium is irreversibly consumed during SEI formation, without compensation from cathode degradation and structural lithium deposition. During charging, a high anode potential requires more lithium-ion deposition at the cathode to meet the constant charging cut-off voltage, resulting in excessive structural lithium deposition causing cathode structural decomposition. The combination of cathode structural decomposition oxidation and sustained anode high-potential reduction reactions initiates a thermal runaway chain reaction.
Based on the above electrode capacity relationships, the battery’s internal capacity loss compensation mechanism is illustrated in Figure 4. Specifically, SLI (structure lithium inventory) refers to the structural lithium ions in the cathode. CLI (cyclable lithium inventory) represents the number of lithium ions in both electrodes that are removed from either electrode during cycling under the influence of potential, excluding the structural lithium ions of the cathode.
During cycling, SEI growth, decomposition, and lithium plating/dendrites cause lithium loss at the anode [15]. At the cathode, lithium-ion insertion and extraction lead to changes in the molar volume and phase, with both processes inducing mechanical strain on the cathode structure. Cathode degradation results in loss of lithium inventory during intercalation [16]. The difference between cathode lithiation and anode lithium inventory loss determines the capacity balance between the two electrodes. When anode lithium loss occurs, it is compensated for by the inherent degradation of active particles due to mechanical strain during cathode insertion/extraction processes, thus maintaining internal battery structure stability under Condition 2. When inherent cathode degradation cannot compensate for anode lithium loss, structural lithium is deposited from the cathode to compensate for anode lithium inventory loss. The transport pathway requires structural lithium to first be converted to lithium ions in the electrolyte before being transferred to the anode. This compensation process necessitates inter-electrode transport, leading to fluctuating capacity balance in later stages. When the lithium loss between the anode and cathode is negative, it indicates that cathode lithiation exceeds anode lithium loss, making the cathode the source of net capacity loss. The battery capacity becomes unbalanced during cathode lithiation. Rapid capacity degradation occurs when the cathode can compensate for the anode lithium inventory loss reaching electrode saturation. When the cathode cannot compensate for the anode lithium inventory loss, repeated structural lithium deposition occurs, leading to cathode structural instability and decomposition. The alternating capacity losses between the anode and cathode create an imbalance, while structural lithium deposition triggers chain reactions through anode interface decomposition and cathode structural breakdown.
Based on the experimental qLiqp values, we can determine the capacity balance relationship between anode lithium inventory loss and cathode inherent degradation. The battery maintains stable cycling when the electrodes reach equilibrium. When anode lithium inventory loss balances with inherent degradation and partial structural lithium deposition, electrode saturation occurs and the active particle degradation rate exceeds the lithium loss rate, triggering rapid capacity decay [10]. When anode lithium inventory loss cannot be compensated for by inherent degradation and partial structural lithium, leading to continuously increasing lithium inventory loss, it triggers increased structural lithium deposition, causing instability and decomposition of both electrodes.
Therefore, stable batteries maintain relatively low and stable anode lithium loss. In aging batteries, varying lithium inventory losses can be compensated for by the cathode. Structural lithium deposition causes cathode instability, leading to complete loss of cathode active particles. In thermal runaway batteries, continuous lithium loss and structural lithium deposition compensation cause rapid cathode structural decomposition and sustained chain reactions. Thus, during capacity imbalance and electrode saturation, the reduction in cathode active particles serves as an indicator for rapid capacity decay. Continuous structural lithium deposition from the cathode during capacity imbalance serves as a safety indicator for the battery.
Attia, P. M. et al. [10] suggested that aging pathways represent threshold trajectories, where rapid decay inflection points are triggered by electrode saturation when the LAM of one electrode exceeds the combined LAM and LLI of the other. However, this model currently applies only to theoretical applications [17,18]. In practical applications, specific changes in electrode structural elements cannot be determined [19]. Without concrete electrode indicators for practical use, this model cannot assess actual battery aging processes and is limited to modeling electrode structural element changes. Moreover, there are no indicators for predicting thermal runaway pathway development from a structural element perspective. Therefore, the second precipitation of Qc serves as an indicator of battery structural imbalance, while increased active particle degradation during electrode saturation indicates rapid capacity decay aging. Since qp correlates with LAM changes, qp characterizes rapid battery capacity decay.

3.3. SOH Prediction Indicators

Based on the relationship between electrode capacity loss, electrode capacity, battery aging, and temperature rise rate, the following are established as battery health prediction indicators.
(1)
The relationship between cathode active particle lithiation loss qp and discharge capacity.
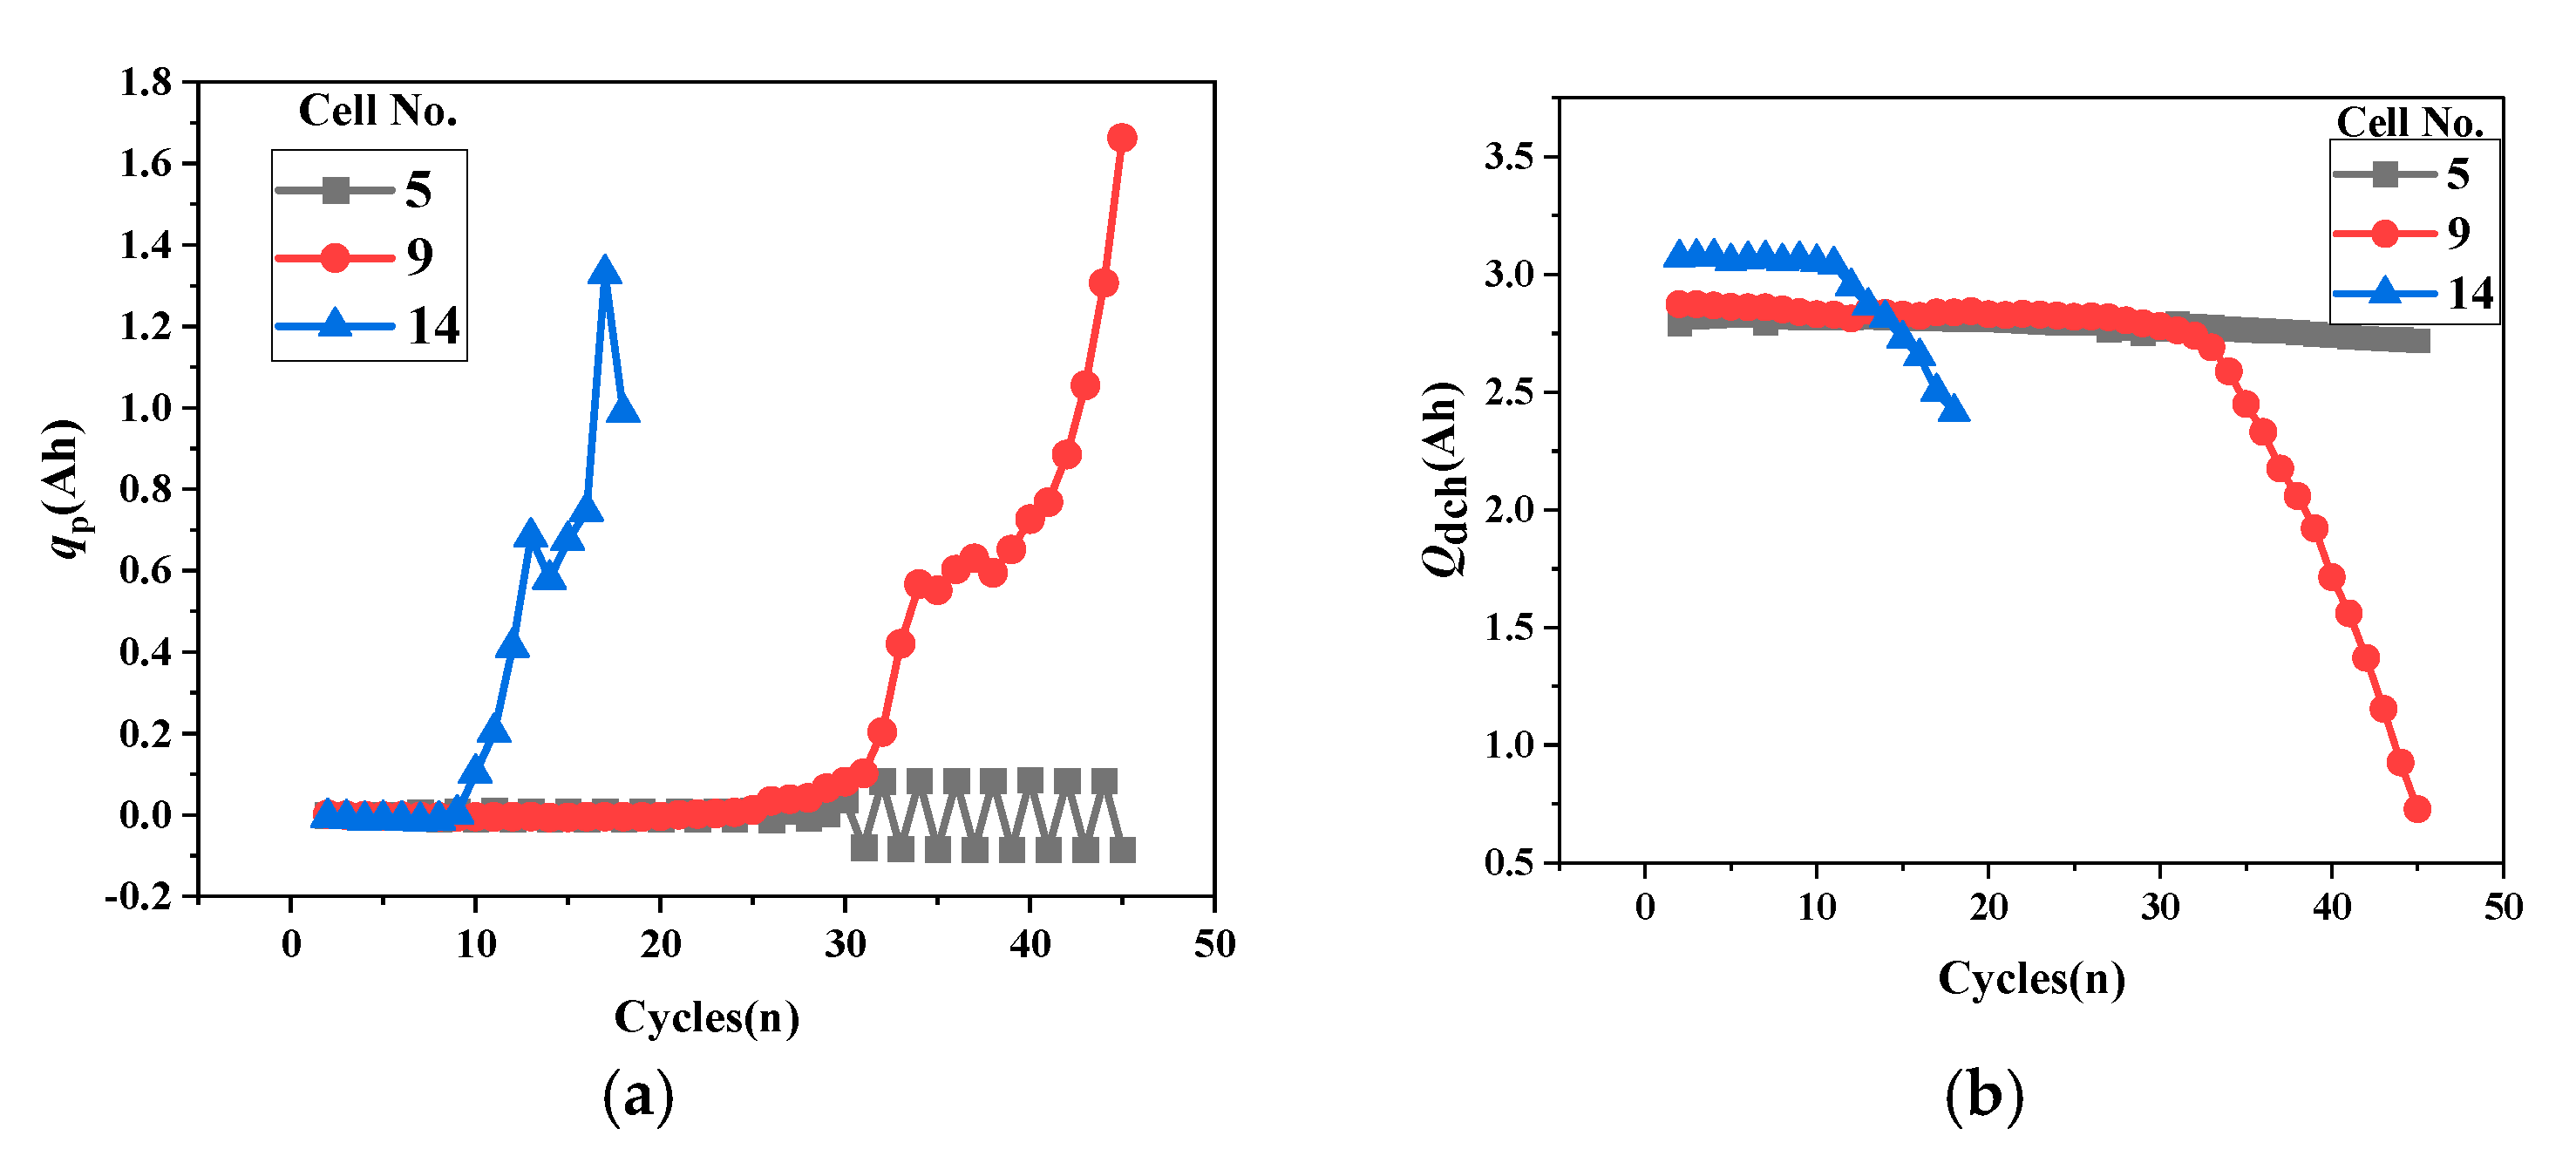
Since cathode lithiation occurs simultaneously with active particle loss, increased cathode structural lithiation represents accelerated active particle loss. When the cathode particle loss reaches electrode saturation, it triggers rapid battery capacity decay. Combining Figure 5a,b, it can be concluded that when qp exceeds 0.2, the battery discharge capacity declines rapidly.
(2)
The relationship between the cathode cyclic lithium Qc and the surface temperature rise rate.
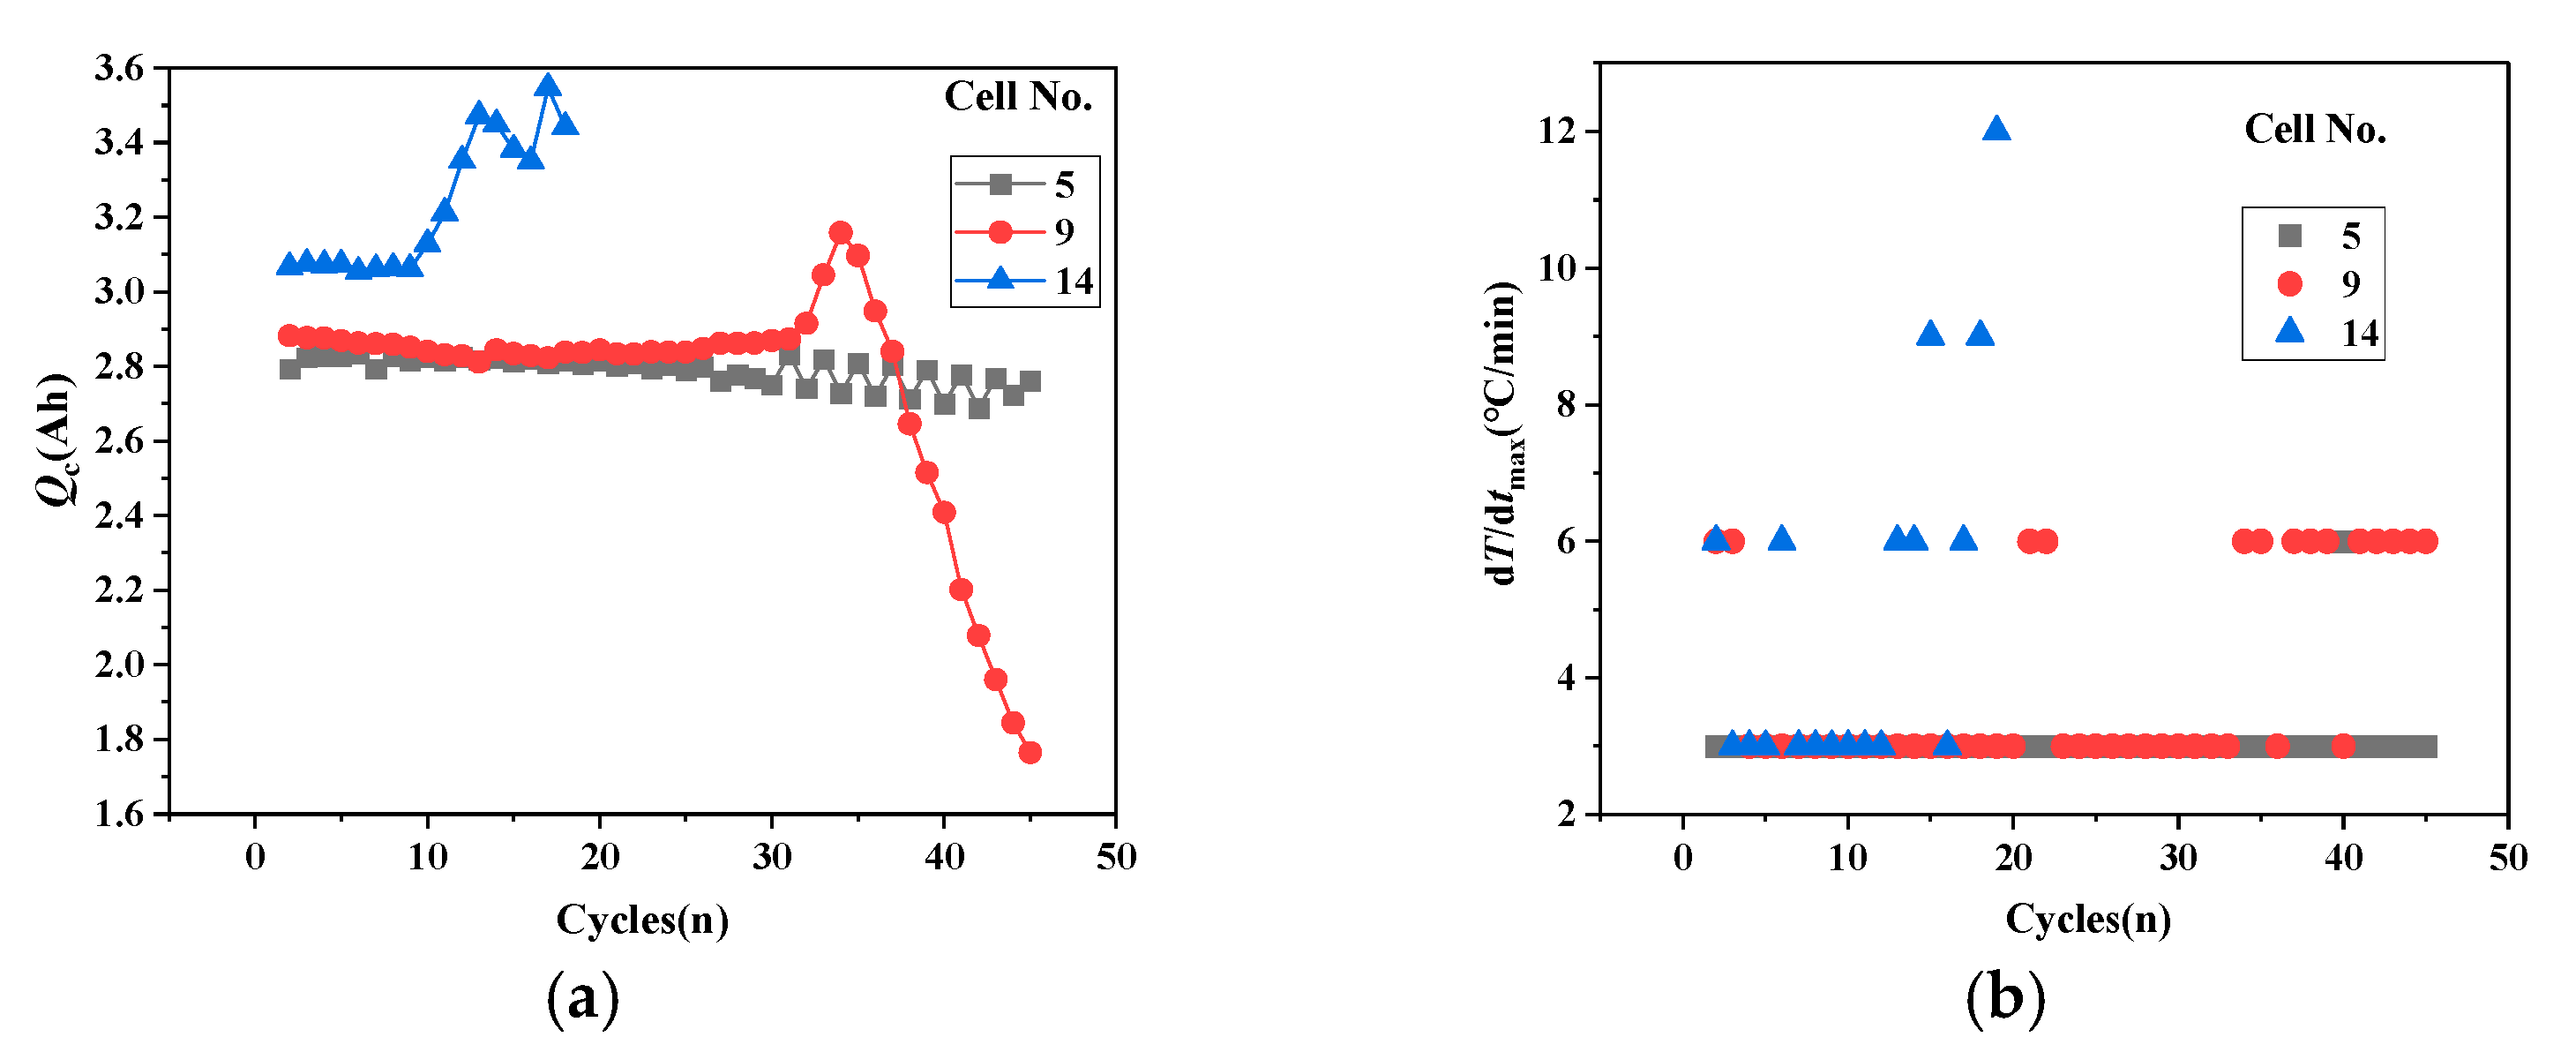
Combining the analysis of Figure 6a,b, we can determine that the trend of cathode cyclic lithium Qc corresponds with the temperature rise rate. Increasing Qc indicates more structural lithium ions converting to cyclic lithium in the cathode. This increase is accompanied by rising temperature rates. During massive structural lithium precipitation, cathode oxygen evolution and oxidation reactions intensify. Subsequently, transition metal ions dissolve in the electrolyte and are transported to the anode interface SEI film, causing anode interface decomposition.
The SOH prediction indicators are as follows:
(1)
First, qLi-qp determines battery development trends. When cathode lithiation compensates for anode lithium loss, the battery shows aging trends. When cathode lithiation cannot compensate for continuous anode lithium loss, the battery shows thermal runaway trends. When qLi-qp approaches zero, the battery maintains capacity balance and stability.
(2)
Using qLi-qp to distinguish battery stability, aging, and thermal runaway trends, qp assesses subsequent aging development, while Qc evaluates thermal runaway progression, enabling appropriate adjustment strategies to modify battery development trends.

3.4. Development Trends in Battery Cycling Condition Regulation

Cycling conditions can be adjusted to regulate health characteristics when identifying battery health state risks.
(1)
Mitigation of battery aging through charging cut-off voltage and discharge rate control.
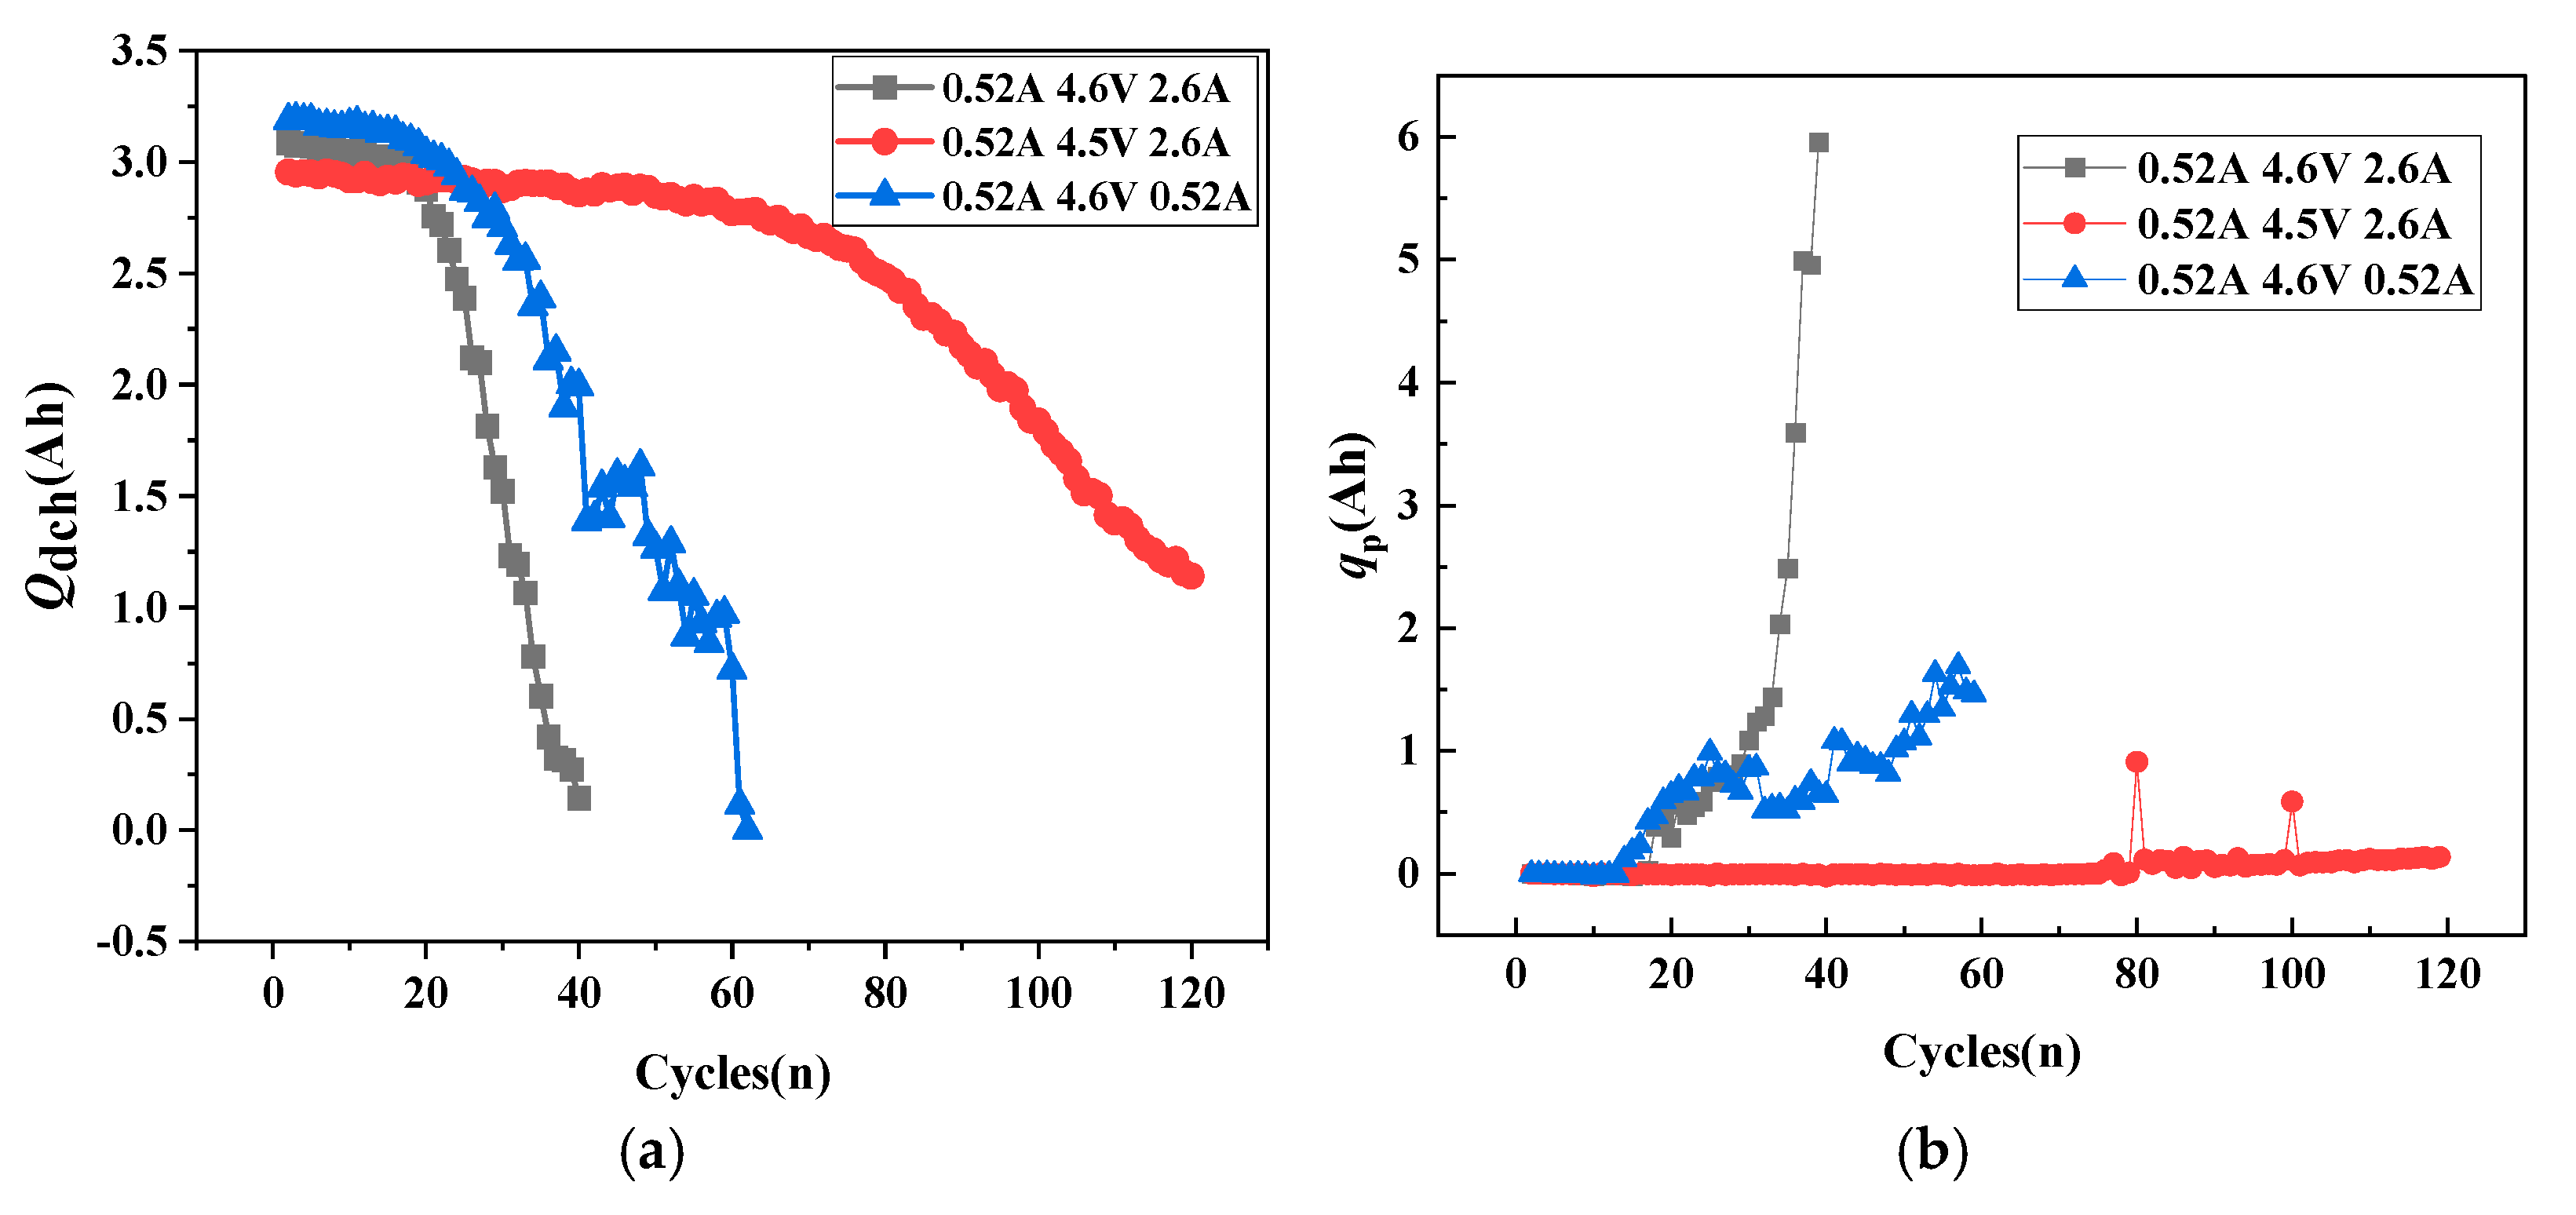
As shown in the Figure 7a, with a discharge cut-off voltage of 2.75 V, when cycling at 4.6 V charging with a 0.52 A current and a 2.6 A discharge current, the battery capacity decreased to zero within 40 cycles. When cycling at 4.5 V charging with a 0.52 A current and a 2.6 A discharge current, the rapid capacity degradation was delayed, maintaining 1 Ah capacity at the 120th cycle. The corresponding lithium intercalation in the cathode structure was zero. When cycling at 4.6 V charging with a 0.52 A current and a 0.52 A discharge current, the capacity degradation was further delayed, with the capacity dropping to zero after 60 cycles. As shown in the Figure 7b, corresponding cathode lithium intercalation (qp) fell between that of batteries cycled at 4.5 V/0.52 A charging with 2.6 A discharge and 4.6 V/0.52 A charging with 2.6 A discharge.
(2)
Enhanced battery safety through a reduction in the charging cut-off voltage.
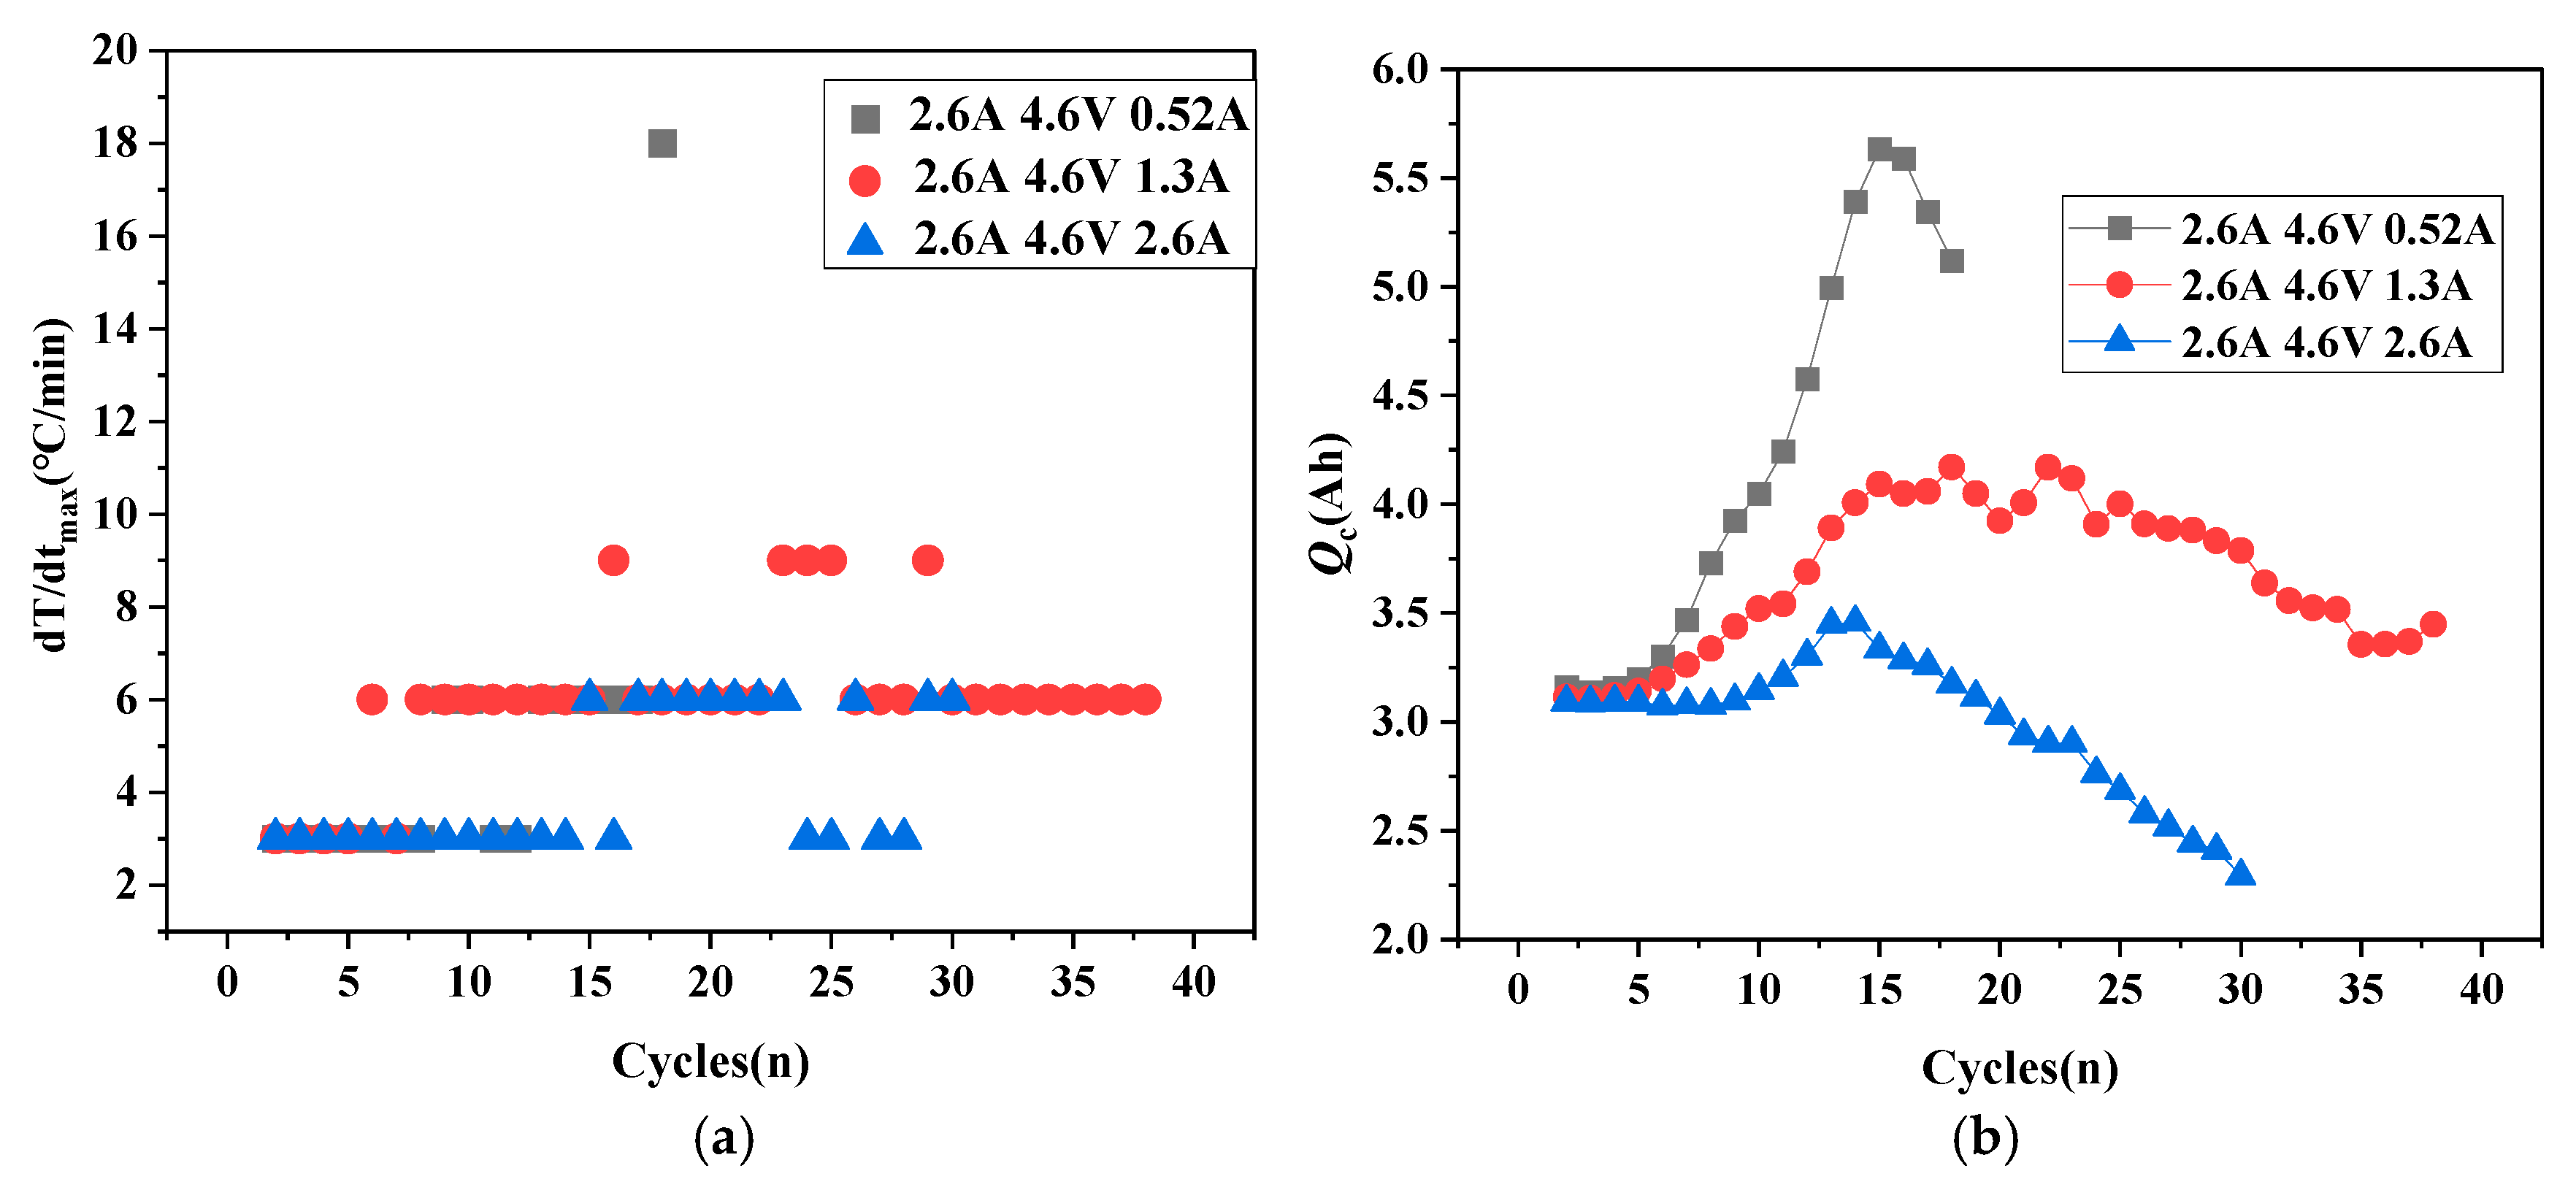
As shown in the Figure 8a, with a discharge cut-off voltage of 2.75 V, thermal runaway occurred in batteries cycled at a 2.6 A charging current/4.6 V voltage and a 0.52 A discharge current, with the surface temperature rise exceeding 10 °C/min. When the discharge current increased to 1.3 A, reducing the capacity imbalance caused by charge–discharge currents, the maximum heating rate decreased from 18 °C/min to 9 °C/min. At a 2.6 A discharge current, the maximum temperature rise rate further decreased to 6 °C/min. Battery safety improved as the discharge current increased and narrowed the gap between the charging and discharging currents. For batteries with a 1.3 A discharge current, the cathode cycling lithium-ion content fell between that of the 2.6 A and 0.52 A conditions, demonstrating a positive correlation between cathode capacity and battery safety in Figure 8b.

4. Conclusions

To overcome the limitations of traditional battery State of Health (SOH) prediction methods, which are hindered by inadequate accuracy and limited real-time adaptability under complex operating conditions, this study introduces an electrode capacity balance model based on variations in electrode capacity. The model creates a unified predictive framework for battery aging and thermal runaway by examining the relationships of electrode capacity matching, thus offering new theoretical foundations and practical methodologies for battery safety management. The main conclusions are as follows:
(1)
Based on the relationship between electrode capacity and battery stability, aging and thermal runaway processes, an electrode capacity balance, a model is proposed. The correlation between inherent cathode degradation-induced lithium loss and anode lithium inventory loss determines cathode structural lithium deposition, which, in turn, governs cathode structural stability.
(2)
The battery State of Health (SOH) prediction indicators based on the capacity balance model include the following: (a) The battery development trend: qLiqp determines the battery development trend. When qLiqp > 0 continues to increase, thermal runaway occurs; when qLiqp < 0, battery aging occurs; and when qLiqp = 0, battery performance remains stable. (b) Development degree assessment: qp indicates battery aging and Qc indicates thermal runaway; the operating conditions can be adjusted to improve these trends.
(3)
Battery thermal runaway and aging trends depend on whether active particle loss and lithium inventory loss can maintain electrode capacity balance. When cathode inherent degradation cannot compensate for anode lithium loss, increased cathode structural lithium deposition leads to active particle loss compensating for anode lithium inventory loss. When active particle loss exceeds anode lithium inventory loss, cathode saturation triggers rapid capacity decay. When active particle loss is lower than lithium inventory loss, anode lithium loss causes increased anode potential. At a constant charging cut-off voltage, more structural lithium from the cathode is deposited, raising the cathode potential and destabilizing the cathode structure. Deteriorating conditions cause delithiated cathode materials to decompose and release oxygen, generating heat through reactions with electrolytes. These exothermic reactions, combined with the reduction reactions from anode lithium loss, ultimately trigger thermal runaway.

Author Contributions

Conceptualization, J.W.; methodology, J.W.; validation, S.W. and Y.Z.; formal analysis, J.W.; investigation, J.W.; resources, J.W.; data curation, J.W.; writing—original draft preparation, J.W.; writ-ing—review and editing, J.W.; visualization, S.W.; supervision, S.W.; project administration, S.W.; funding acquisition, S.W. All authors have read and agreed to the published version of the manuscript.

Funding

This research received no external funding.

Data Availability Statement

The original contributions presented in this study are included in the article. Further inquiries can be directed to the corresponding author(s).

Conflicts of Interest

The authors declare no conflict of interest.

References

  1. Berecibar, M.; Gandiaga, I.; Villarreal, I.; Omar, N.; Van Mierlo, J.; Van den Bossche, P. Critical Review of State of health estimation methods of Li-ion batteries for real applications. Renew. Sustain. Energy Rev. 2016, 56, 572–587. [Google Scholar] [CrossRef]
  2. Jaguemont, J.; Boulon, L.; Dubé, Y. A comprehensive review of lithium-ion batteries used in hybrid and electric vehicles at cold temperatures. Appl. Energy 2016, 164, 99–114. [Google Scholar] [CrossRef]
  3. Xu, M.; Reichman, B.; Wang, X. Modeling the effect of electrode thickness on the performance of lithium-ion batteries with experimental validation. Energy 2019, 186, 115864. [Google Scholar] [CrossRef]
  4. Chang, C.-C.; Huang, S.-Y.; Chen, W.-H. Thermal and solid electrolyte interphase characterization of lithium-ion battery. Energy 2019, 174, 999–1011. [Google Scholar] [CrossRef]
  5. Vetter, J.; Novák, P.; Wagner, M.R.; Veit, C.; Möller, K.-C.; Besenhard, J.O.; Winter, M.; Wohlfahrt-Mehrens, M.; Vogler, C.; Hammouche, A. Ageing mechanisms in lithium-ion batteries. J. Power Sources 2005, 147, 269–281. [Google Scholar] [CrossRef]
  6. Spotnitz, R. Simulation of capacity fade in lithium-ion batteries. J. Power Sources 2003, 113, 72–80. [Google Scholar] [CrossRef]
  7. Chu, Y.; Shen, Y.; Guo, F.; Zhao, X.; Dong, Q.; Zhang, Q.; Li, W.; Chen, H.; Luo, Z.; Chen, L. Advanced characterizations of solid electrolyte Interphases in lithium-ion batteries. Electrochem. Energy Rev. 2019, 3, 187–219. [Google Scholar] [CrossRef]
  8. SAE J2464; Electric and Hybrid Electric Vehicle Rechargeable Energy Storage System (RESS) Safety and Abuse Testing. Society of Automotive Engineers: Warrendale, PA, USA, 2009.
  9. Feng, X.; Fang, M.; He, X.; Ouyang, M.; Lu, L.; Wang, H.; Zhang, M. Thermal runaway features of large format prismatic lithium ion battery using extended volume accelerating rate calorimetry. J. Power Sources 2014, 255, 294–301. [Google Scholar] [CrossRef]
  10. Wu, W.; Wu, W.; Qiu, X.; Wang, S. Low-temperature reversible capacity loss and aging mechanism in lithium-ion batteries for different discharge profiles. Int. J. Energy Res. 2018, 43, 243–253. [Google Scholar] [CrossRef]
  11. Attia, P.M.; Bills, A.; Brosa Planella, F.; Dechent, P.; dos Reis, G.; Dubarry, M.; Gasper, P.; Gilchrist, R.; Greenbank, S.; Howey, D.; et al. Review—“Knees” in lithium-ion battery aging trajectories. J. Electrochem. Soc. 2022, 169, 060517. [Google Scholar] [CrossRef]
  12. Han, X.; Ouyang, M.; Lu, L.; Li, J.; Zheng, Y.; Li, Z. A comparative study of commercial lithium-ion battery cycle life in electrical vehicle: Aging mechanism identification. J. Power Sources 2014, 251, 38–54. [Google Scholar] [CrossRef]
  13. Gauthier, R.; Luscombe, A.; Bond, T.; Bauer, M.; Johnson, M.; Harlow, J.; Louli, A.; Dahn, J.R. How do depth of discharge, C-rate and calendar age affect capacity retention, impedance growth, the electrodes, and the electrolyte in li-ion cells? J. Electrochem. Soc. 2022, 169, 020518. [Google Scholar] [CrossRef]
  14. Wen, J.; Zhu, Y.; Wang, S. Detection of the chain reaction pathway and early warning method of thermal runaway by battery management system for lithium cobalt manganese oxide (NCM) batteries. J. Energy Storage 2025. submitted for publication. [Google Scholar]
  15. Adenusi, H.; Chass, G.A.; Passerini, S.; Tian, K.V.; Chen, G. Lithium batteries and the solid electrolyte interphase (SEI)—Progress and outlook. Adv. Energy Mater. 2023, 13, 2203307. [Google Scholar] [CrossRef]
  16. Birkl, C.R.; Roberts, M.R.; McTurk, E.; Bruce, P.G.; Howey, D.A. Degradation diagnostics for lithium-ion cells. J. Power Sources 2017, 341, 373–386. [Google Scholar] [CrossRef]
  17. Smith, A.J.; Burns, J.C.; Xiong, D.; Dahn, J.R. Interpreting high precision coulometry results on Li-Ion Cells. J. Electrochem. Soc. 2011, 158, A1136. [Google Scholar] [CrossRef]
  18. Dubarry, M.; Truchot, C.; Liaw, B.Y. Synthesize battery degradation modes via a diagnostic and prognostic model. J. Power Sources 2012, 219, 204–216. [Google Scholar] [CrossRef]
  19. Smith, K.; Saxon, A.; Keyser, M.; Lundstrom, B.; Ziwei, C.; Roc, A. Life prediction model for grid-connected Li-Ion Battery Energy Storage System. In Proceedings of the 2017 American Control Conference (ACC), Seattle, WA, USA, 24–26 May 2017. [Google Scholar] [CrossRef]
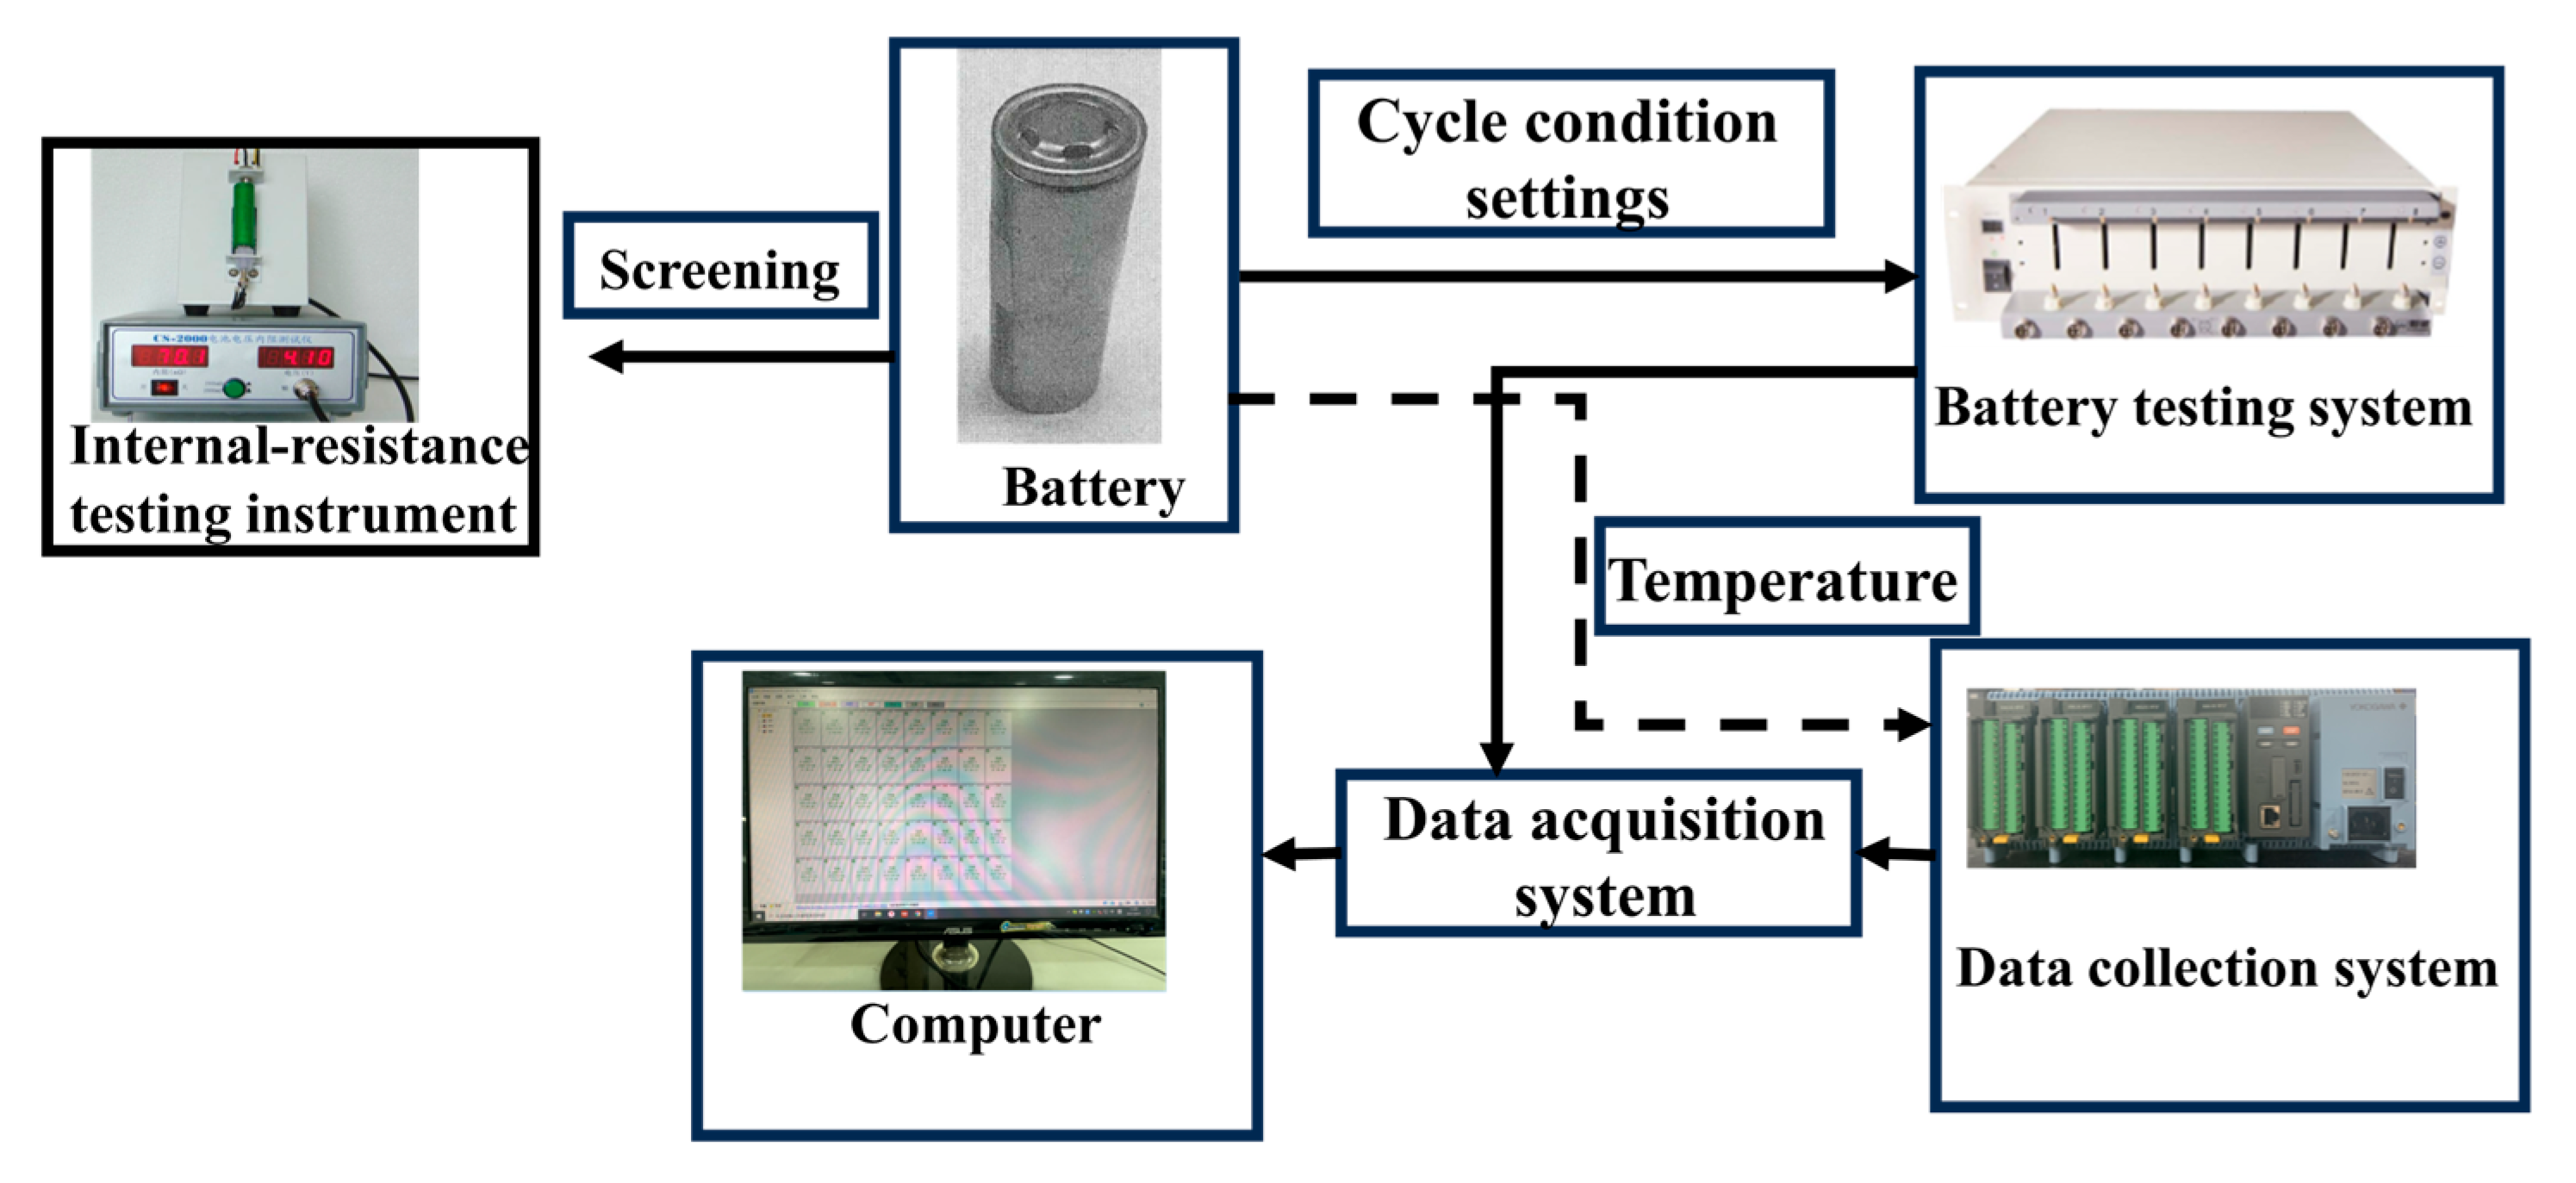
Figure 1. Schematic diagram of experimental system connections.
Batteries 11 00367 g001
Figure 2. Battery performance under different cycle conditions. (a) Battery discharge capacity; (b) maximum temperature rise rate.
Batteries 11 00367 g002
Figure 3. Capacity loss difference between cathode and anode. (a), (b) and (c) represent the electrode capacity difference used to characterize the electrode capacity balance under working conditions 2, 3, and 4, respectively; (d) Cathode capacity during cycling for Operating Conditions 2, 3, and 4.
Batteries 11 00367 g003
Figure 4. Battery internal lithium loss compensation mechanism. The yellow circles represent CLI, the orange circles represent SLI, and whether the losses of qli and qp are consistent determines battery capacity balancing. (a) Cathode capacity and anode lithium loss; (b) cathode lithium loss and loss of active battery particles; (c) internal structural changes of the electrode.
Batteries 11 00367 g004
Figure 5. Battery aging performance: (a) loss of lithium in the battery cathode; (b) Battery discharge capacity.
Batteries 11 00367 g005
Figure 6. Battery safety performance: (a) cathode capacity; (b) maximum temperature rise rate.
Batteries 11 00367 g006
Figure 7. Battery degradation mitigation through cycling condition regulation.
Batteries 11 00367 g007
Figure 8. Improving battery safety by reducing the charging cut-off voltage.
Batteries 11 00367 g008
Table 1. Battery screening results and charge–discharge cycling conditions.
Cell No.ConditionCharging Current/ACharging Voltage/VDischarge Current/ADischarge Voltage/V
112.64.22.62.75
2
3
4
522.64.42.62.75
6
7
8
932.64.52.62.75
10
11
12
1342.64.62.62.75
14
15
16
Disclaimer/Publisher’s Note: The statements, opinions and data contained in all publications are solely those of the individual author(s) and contributor(s) and not of MDPI and/or the editor(s). MDPI and/or the editor(s) disclaim responsibility for any injury to people or property resulting from any ideas, methods, instructions or products referred to in the content.