Article

Hollow Carbon Nanorod-Encapsulated Eu2O3 for High-Energy Hybrid Supercapacitors

Department of Chemistry and Biochemistry, The University of Texas at Dallas, 800 West Campbell Rd, Richardson, TX 75080, USA
*
Author to whom correspondence should be addressed.
Batteries 2025, 11(10), 355; https://doi.org/10.3390/batteries11100355
Submission received: 31 August 2025 / Revised: 22 September 2025 / Accepted: 25 September 2025 / Published: 27 September 2025

Abstract

Carbon nanorods have been synthesized from acetylene and steam using europium oxide nanorods as a template. The resulting carbon exhibits a high conductivity of 4.66 × 10⁵ S/m and a surface area of 1226 m2/g. The Eu2O3 was partially or completely washed from the carbon, creating hollow nanorods. Hybrid supercapacitors were fabricated where the Eu2O3 contributes a redox pseudocapacitance. A gravimetric capacitance of 501.2 F/g for the hybrid cell and 202 F/g for the carbon-only cell was measured at 1 A/g using 1 M lithium bis(trifluoromethanesulfonyl)imide (LiTFSI) in propylene carbonate as an electrolyte. The hybrid supercapacitor exhibited an excellent energy density of 108 Wh/kg at 1 A/g compared to 43 Wh/g at 1 A/g for the carbon-only supercapacitor.

Graphical Abstract

1. Introduction

Hybrid supercapacitors, which combine electric double-layer capacitance (EDLC) and pseudocapacitance, generally exhibit improved energy density [1,2,3]. In EDLC, the energy storage is based on the electrode surface area and double-layer distance [4,5,6]. EDLCs are typically graphitic carbons that perform better with higher surface areas, electrical conductivities, and porosity [7,8]. For pseudocapacitors, enhanced energy storage may be achieved via redox reactions of the active electrode material [9,10,11]. For EDLC, biomass-derived carbons and activated carbon fibers have high surface areas but low electrical conductivity [12,13,14]. Graphitic carbons have a high surface area, porosity, and electrical conductivity that facilitate excellent energy density [15,16,17,18,19]. In particular, carbide-derived carbons can be produced to form graphene-like materials [20].
For redox pseudocapacitance, it is important that multiple oxidation states be accessible within the voltage range of the electrolyte [11,21,22,23,24]. Transition metals have been extensively studied, whereas lanthanides have been less studied for energy storage. Recently, europium oxide and reduced graphene oxide were used in a hybrid supercapacitor with a high capacitance of 403 F/g at a scan rate of 2 mV/s with an energy density of 35.8 Wh/kg [25]. Using an aqueous electrolyte, 3 M KOH, a polypyrrole/Eu2O3 composite exhibited a volumetric capacitance of 535 F/cm3 but with a low energy density of 13.5 Wh/L [26].
While previous studies demonstrate the redox activity of the Eu2O3 in composite electrodes, the interaction between the oxide and carbon is often limited. Recent studies indicate that if carbons are grown directly on the oxide surface, it produces an intimate interface between oxides and graphitic carbon that enhances charge transfer and increases the capacitance. Recently, templated carbons were grown on Ca(OH)2, La(OH)3, and Y(OH)3 nanoparticles [27,28,29,30,31]. In these cases, acetylene gas was reacted with the metal hydroxide to create a metal acetylide, which then reacts with steam to form graphitic carbon. Unlike these templated oxides, which yield graphitic carbon but do not participate in charge storage, Eu2O3 nanorods offer a dual role by acting as a template to grow carbon and provide additional pseudocapacitance through a Eu3+/Eu2+ couple. This couple is rare among lanthanides, as europium is among few lanthanides that can stably access both oxidation states and remain active in organic electrolytes, which is important for the broader voltage window [25]. Together these features enable the design of a hybrid electrode that couples EDLC- and pseudocapacitance-based energy storage mechanisms.
In this study, Eu2O3 nanorods were synthesized and used as templates to grow graphitic carbon with high conductivity (4.66 × 10⁵ S/m) and a high surface area (1226 m2/g). The Eu2O3 template was partially removed, allowing the electrolyte to diffuse into the carbon. The results from a John Miller Energy (JME) cell included a gravimetric capacitance of 501.2 F/g and an energy density of 108.0 Wh/kg at 1 A/g.

2. Experimental Section

All reagents were used as received. Europium(III) nitrate hexahydrate was purchased from Sigma-Aldrich. Hydrochloric acid (HCl) was acquired from Fisher Scientific. Lithium bis(trifluoromethanesulfonyl)imide was purchased from Tokyo Chemical Industry and propylene carbonate was purchased from Sigma-Aldrich. Acetylene and ultrahigh purity nitrogen were obtained from Airgas. Tetracyanoethylene (98%) was purchased from Sigma-Aldrich.

2.1. Synthesis of Eu2O3 Nanorods

Europium(III) nitrate hexahydrate (2.1 g), sodium hydroxide solution (7 mL, 18.9 M), and cetyltrimethylammonium bromide (2.0 g) were dissolved in 20 mL of deionized water and transferred to a 23 mL Teflon-lined autoclave. The temperature was maintained at 60 °C for 16 h under hydrothermal conditions [32]. The resulting Eu(OH)3 nanorods were collected by vacuum filtration, washed repeatedly with deionized water to remove residual reagents, and then calcined at 500 °C for 6 h to yield Eu2O3 nanorods.

2.2. Chemical Vapor Deposition (CVD)

We placed 2 g of Eu2O3 nanorods inside an alumina crucible that was covered by a graphite canopy under a flow of N2(g) at 200 mL/min. The reactor was heated at 10 °C/min to 650 °C then heated for 42 min using a flow of acetylene and deionized water at 35 mL/min and 2 mL/hr, respectively. A deposition time of 42 min was employed, as this provides a continuous carbon coating that is approximately 8 layers thick. After chemical vapor deposition, the samples were heated to 900 °C for two hours with a 2 °C/min ramp rate under a N2(g) flow of 200 mL/min for further graphitization of the carbon. It is named as C@Eu2O3. After carbon deposition, the templated Eu2O3 NRs were partially removed to expose the internal carbon surface and allow electrolyte access to the redox-active metal oxide. For this, 1 g of C@Eu2O3 was washed with 1 M of HCl for 1 h, followed by washing and filtration with deionized water. The partially washed sample (p-C@Eu2O3) was dried at 80 °C overnight. For comparison, Eu2O3 NRs were also fully washed to obtain Eu2O3-templated mesoporous carbon (Eu-TMC).

2.3. Preparation of Electrodes and Supercapacitor Assembly

Supercapacitor cells were fabricated as JME cells [33]. A total of 0.1 g of active material was first blended with 5 wt% polytetrafluoroethylene binder, corresponding to an electrode composition of 95 wt% active material and 5 wt% binder. Afterwards, the material was pressed into a thin film followed by punching out the circular electrodes (1.10 cm diameter). The electrodes were impregnated with 50 μL of 1 M LiTFSI in propylene carbonate and left for 12 h under vacuum inside a glovebox. The cell assembly wash was then completed by placing a Gore Teflon separator (1.59 cm) and sandwiching it between two Toyal-Carbo Aluminum Keach current collectors (2.54 cm) to create symmetric cells. The cell was then heat-sealed and pressed using a polymer gasket (1.91 cm inner × 2.70 cm outer dimensions) on both sides to hold it together [34].

3. Characterization

The powder X-ray diffraction (PXRD) was carried out on a Rigaku Ultima IV diffractometer (USA) with Cu Kα radiation (λ = 1.54184 Å). A transmission electron microscope (TEM) was conducted on JEOL JEM-2100 (Tokyo, Japan) operating at 200 kV, while scanning electron microscopy (SEM) images were collected using a LEO 1530 VP field emission microscope. X-ray photoelectron spectroscopy (XPS) was performed using a PHI VersaProbe II microprobe (Physical Electronics, Chanhassen, MN, USA) equipped with an Al Kα excitation source (Ep = 1486.7 eV) under high pressure (1.6 × 10⁻⁸ Torr). High-resolution spectra were recorded with a pass energy of 23.5 eV and a step size of 0.2 eV, applying a 2–6 µA charge neutralization. Samples were fixed onto conductive copper tape and coated with gold by using a Gas-Cluster Ion Beam (GCIB) (Kanagawa, Japan) with 5 kV of energy. Data were analyzed with CasaXPS (v 2.3.26), with an energy calibration to the adventitious C 1 s peak at 284.8 eV and Au 4f7/2 at 83.95 eV [35]. Raman spectra were obtained on a Thermo Scientific DXR (Madison, WI, USA) system using 532 nm excitation. Fourier transform infrared (FTIR) spectra were collected on a Nicolet Avatar 360 spectrometer (Madison, WI, USA) with KBr pellets, and additional ATR-FTIR measurements were performed using a Nicolet 380 instrument (Madison, WI, USA) with a diamond accessory for carbon-containing samples.
For the Tetracyanoethylene (TCNE) probe experiment, 10 mg of Eu2O3, C@Eu2O3, or p-C@Eu2O3 was mixed with the TCNE (98%, Sigma-Aldrich (USA)) solution in acetonitrile (1 mg/mL) and stirred for 2 h at room temperature. The solid was filtered, rinsed with acetonitrile to remove excess TCNE, and dried under a vacuum. FTIR spectra were then collected to monitor the nitrile stretching frequency shifts relative to the pure TCNE.
Thermogravimetric and calorimetric analyses were carried out simultaneously with a TA Instruments Q600 SDT (Dallas, TX, USA) to evaluate the oxide content and stability. Electrical conductivity was measured using a Pro4-4400 four-point probe system coupled with a Keithley 2400 source meter (Solon, OH, USA). Gas adsorption–desorption isotherms at 77 K were obtained with a Micromeritics ASAP 2020 (Norcross, GA, USA). Surface areas were derived from the BET analysis, mesopore volumes from the BJH calculations, and pore distributions using the two-dimensional non-linear density functional theory (2D-NLDFT) method [36].

4. Electrochemical Measurements

Galvanostatic charge–discharge tests and cycling stability were evaluated on an Arbin supercapacitor system (College Station, TX, USA) within a voltage range of 0–2.5 V. Cyclic voltammetry (CV) and electrochemical impedance spectroscopy (EIS) were carried out using a Princeton Applied Research 2273 A potentiostat/galvanostat (Oak Ridge, TN, USA). For three-electrode measurements, a Pt wire served as the reference electrode in 0.01 M Ag/AgCl (propylene carbonate medium), and carbon nanorods were used as the counter electrode. Impedance spectra were obtained over the frequency range of 1 MHz to 100 kHz using a 10 mV AC perturbation at a 0 V bias. The gravimetric capacitance (Csp, F g−1), energy density (E, Wh kg−1), and power density (P, W kg−1) of the cells were calculated from the discharge curves of galvanostatic cycles according to
C s p = 4 I t m V
E = C s p V 2 7.2
P = E × 3600 t
where I is the discharge current (A), Δt is the discharge time (s), ΔV is the potential window (V) after subtracting the IR drop, and m is the total mass of the active electrode material.

5. Results and Discussion

Eu2O3 NRs were hydrothermally synthesized, followed by the deposition of carbon on its surface by chemical vapor deposition (CVD) to obtain C@Eu2O3. Afterward, the Eu2O3 NRs were partially and completely washed with 1 M HCl at different times to obtain access to the inner surface of the carbon as well as the Eu2O3 via the electrolyte for the EDLC and pseudocapacitance, respectively.
Figure 1a shows the p-XRD of the synthesized Eu2O3 nanorods with major diffraction peaks at 28.3°, 32.8°, and 47.3°, which correspond to the (200), (400), and (440) planes, respectively (Figure S1). These diffraction peaks matched with JCPDS 34-0392 [37]. After the carbon deposition, a broad graphitic peak emerged at around 22° to 24° along with sharp peaks of Eu2O3 (Figure 1b). After washing with 1 M HCl for 60 min, a decrease in the relative intensity of the Eu2O3 peaks was observed in p-C@Eu2O3, as shown in Figure 1c. After the complete removal of the metal oxide, Eu-TMC shows two broad peaks of graphitic carbon at around 24.89° (002) and the reflection of the weak (101) faces at 43.11°, as shown in Figure 1d [28].
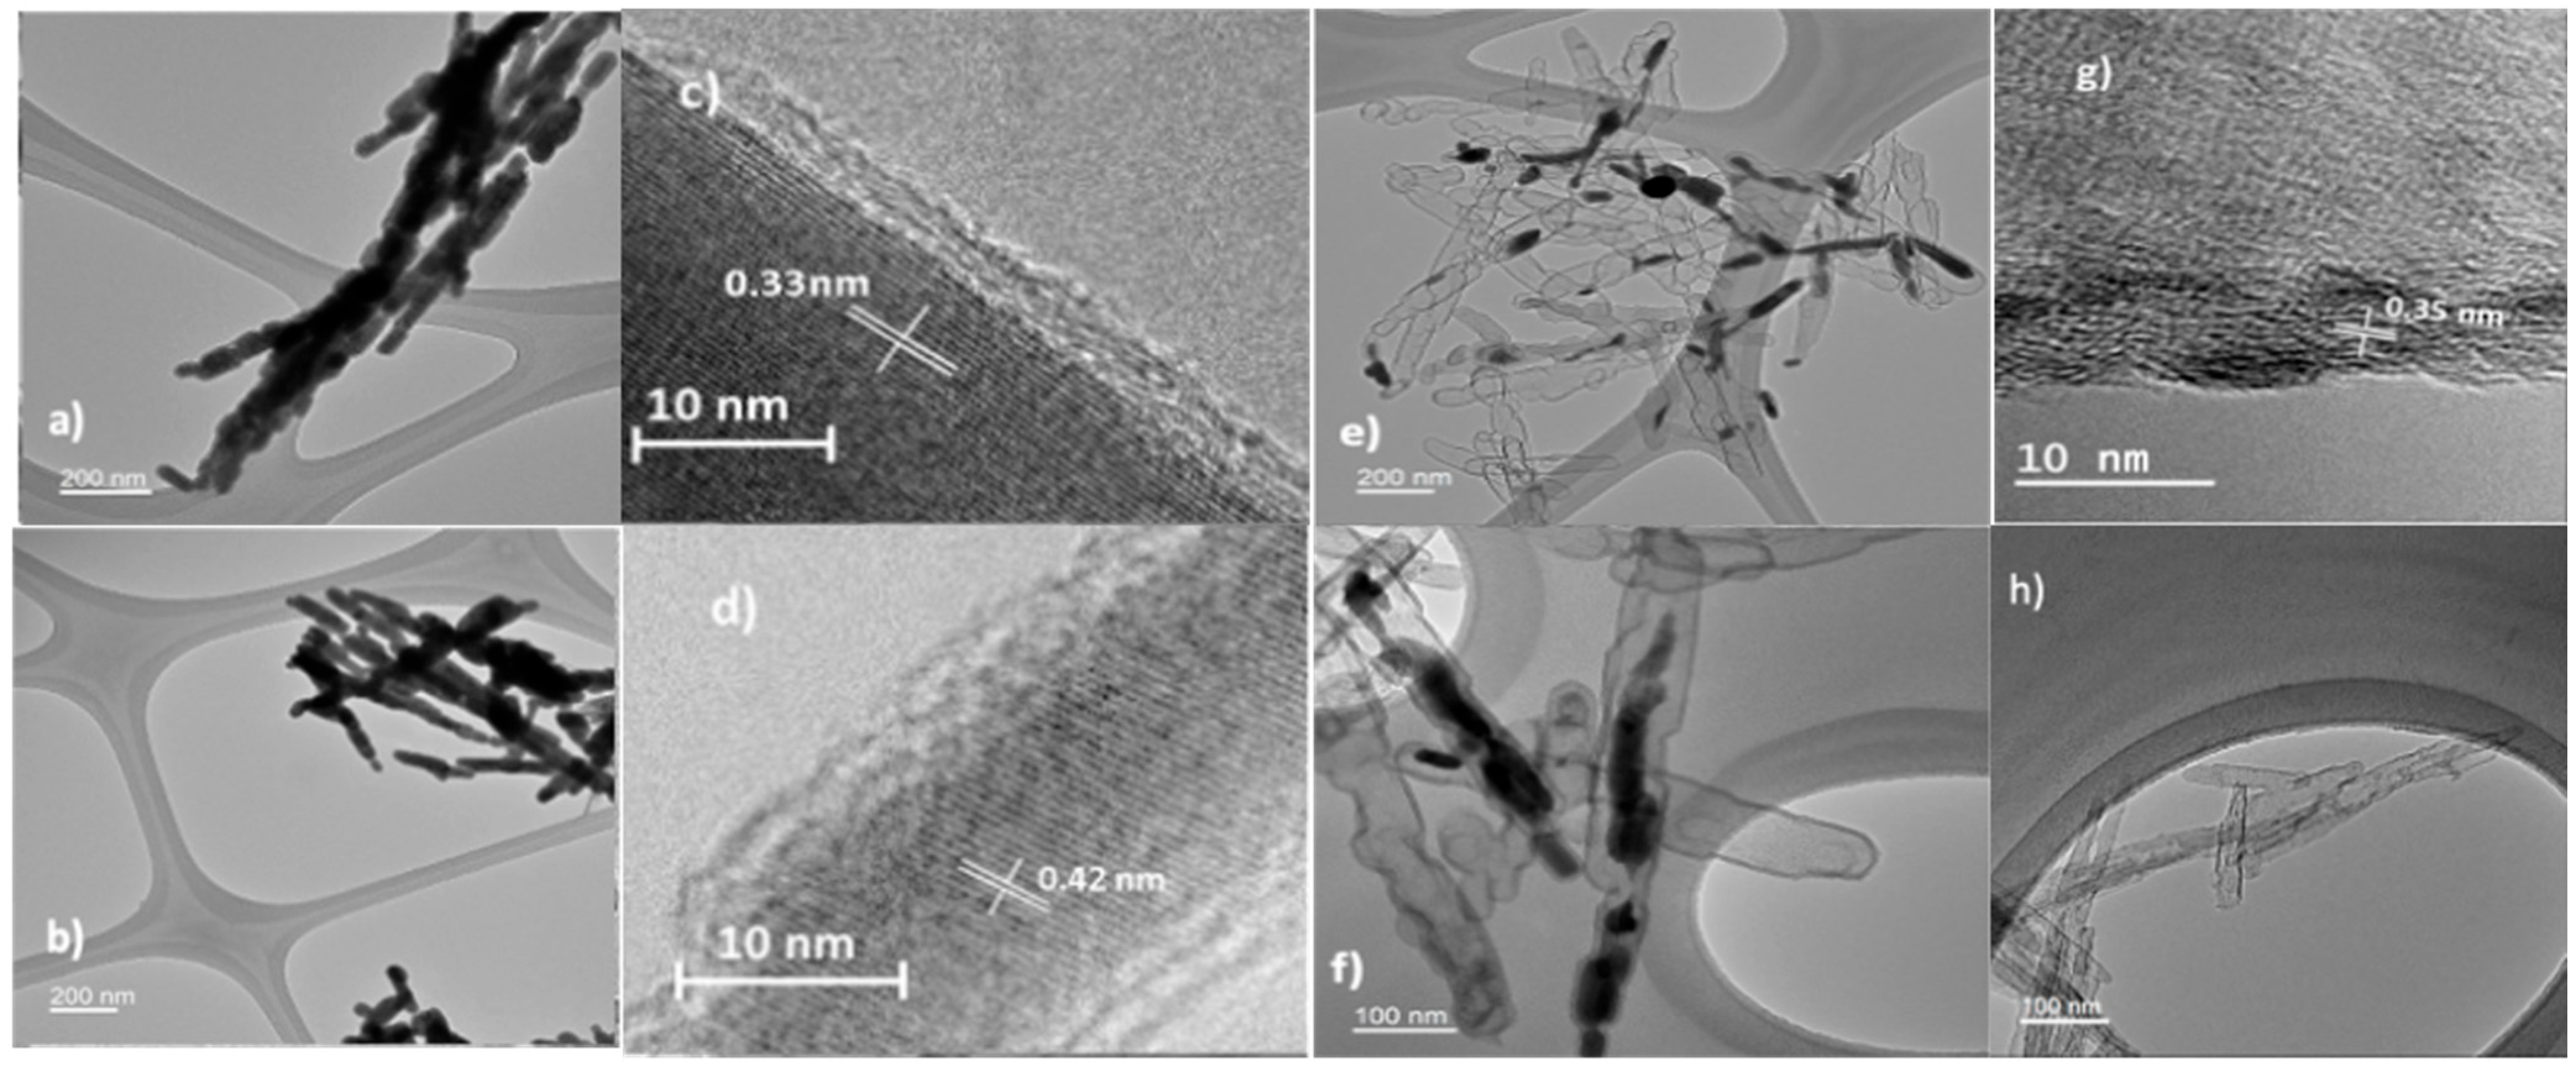
The TEM images in Figure 2 show the morphology of the synthesized Eu2O3 NRs, C@ Eu2O3, p-C@ Eu2O3, and Eu-TMC. Eu2O3 NRs are 400–500 nm long with a diameter of ~30 nm (Figure 2a,b). After the CVD, TEM images show that the carbon covers the surface of the Eu2O3 NRs. Lattice fringes are observable in C@Eu2O3 in Figure 2c, which correspond to the (200) planes with a d–d-spacing of 0.33 nm, corresponding to 2ϴ = 28°. Additional lattice fringes with a d-spacing of 0.42 nm have been observed in Figure 2d, which correspond to the (440) planes and 2θ = 47.3° [38]. Eu2O3 nanorods have also been reported with lattice fringes that correspond to (400) planes [37]. The layers of carbon can also be seen in Figure 2c and are eight layers deep after 42 min of CVD, which yields a 0.19 layers/min deposition rate. Other CVD studies using acetylene and steam yielded deposition rates of ~0.25 layers/min and ~0.05 layers/min for magnesium and lanthanum hydroxide templates, respectively [27,29,30]. Additionally, in Figure 2g the carbon layers have a d–spacing of 0.35 nm, which corresponds to the p-XRD pattern with a wide peak centered at 26°. The turbostratic stacking of the graphitic domains could be the cause of the slightly higher d-spacing than the pristine graphite (0.34 nm). The SEM image in Figure S6a shows the C@Eu2O3 with no change in its morphology after the CVD. In Figure S6b the partially washed nanorods can also be observed to have no change in their morphology.
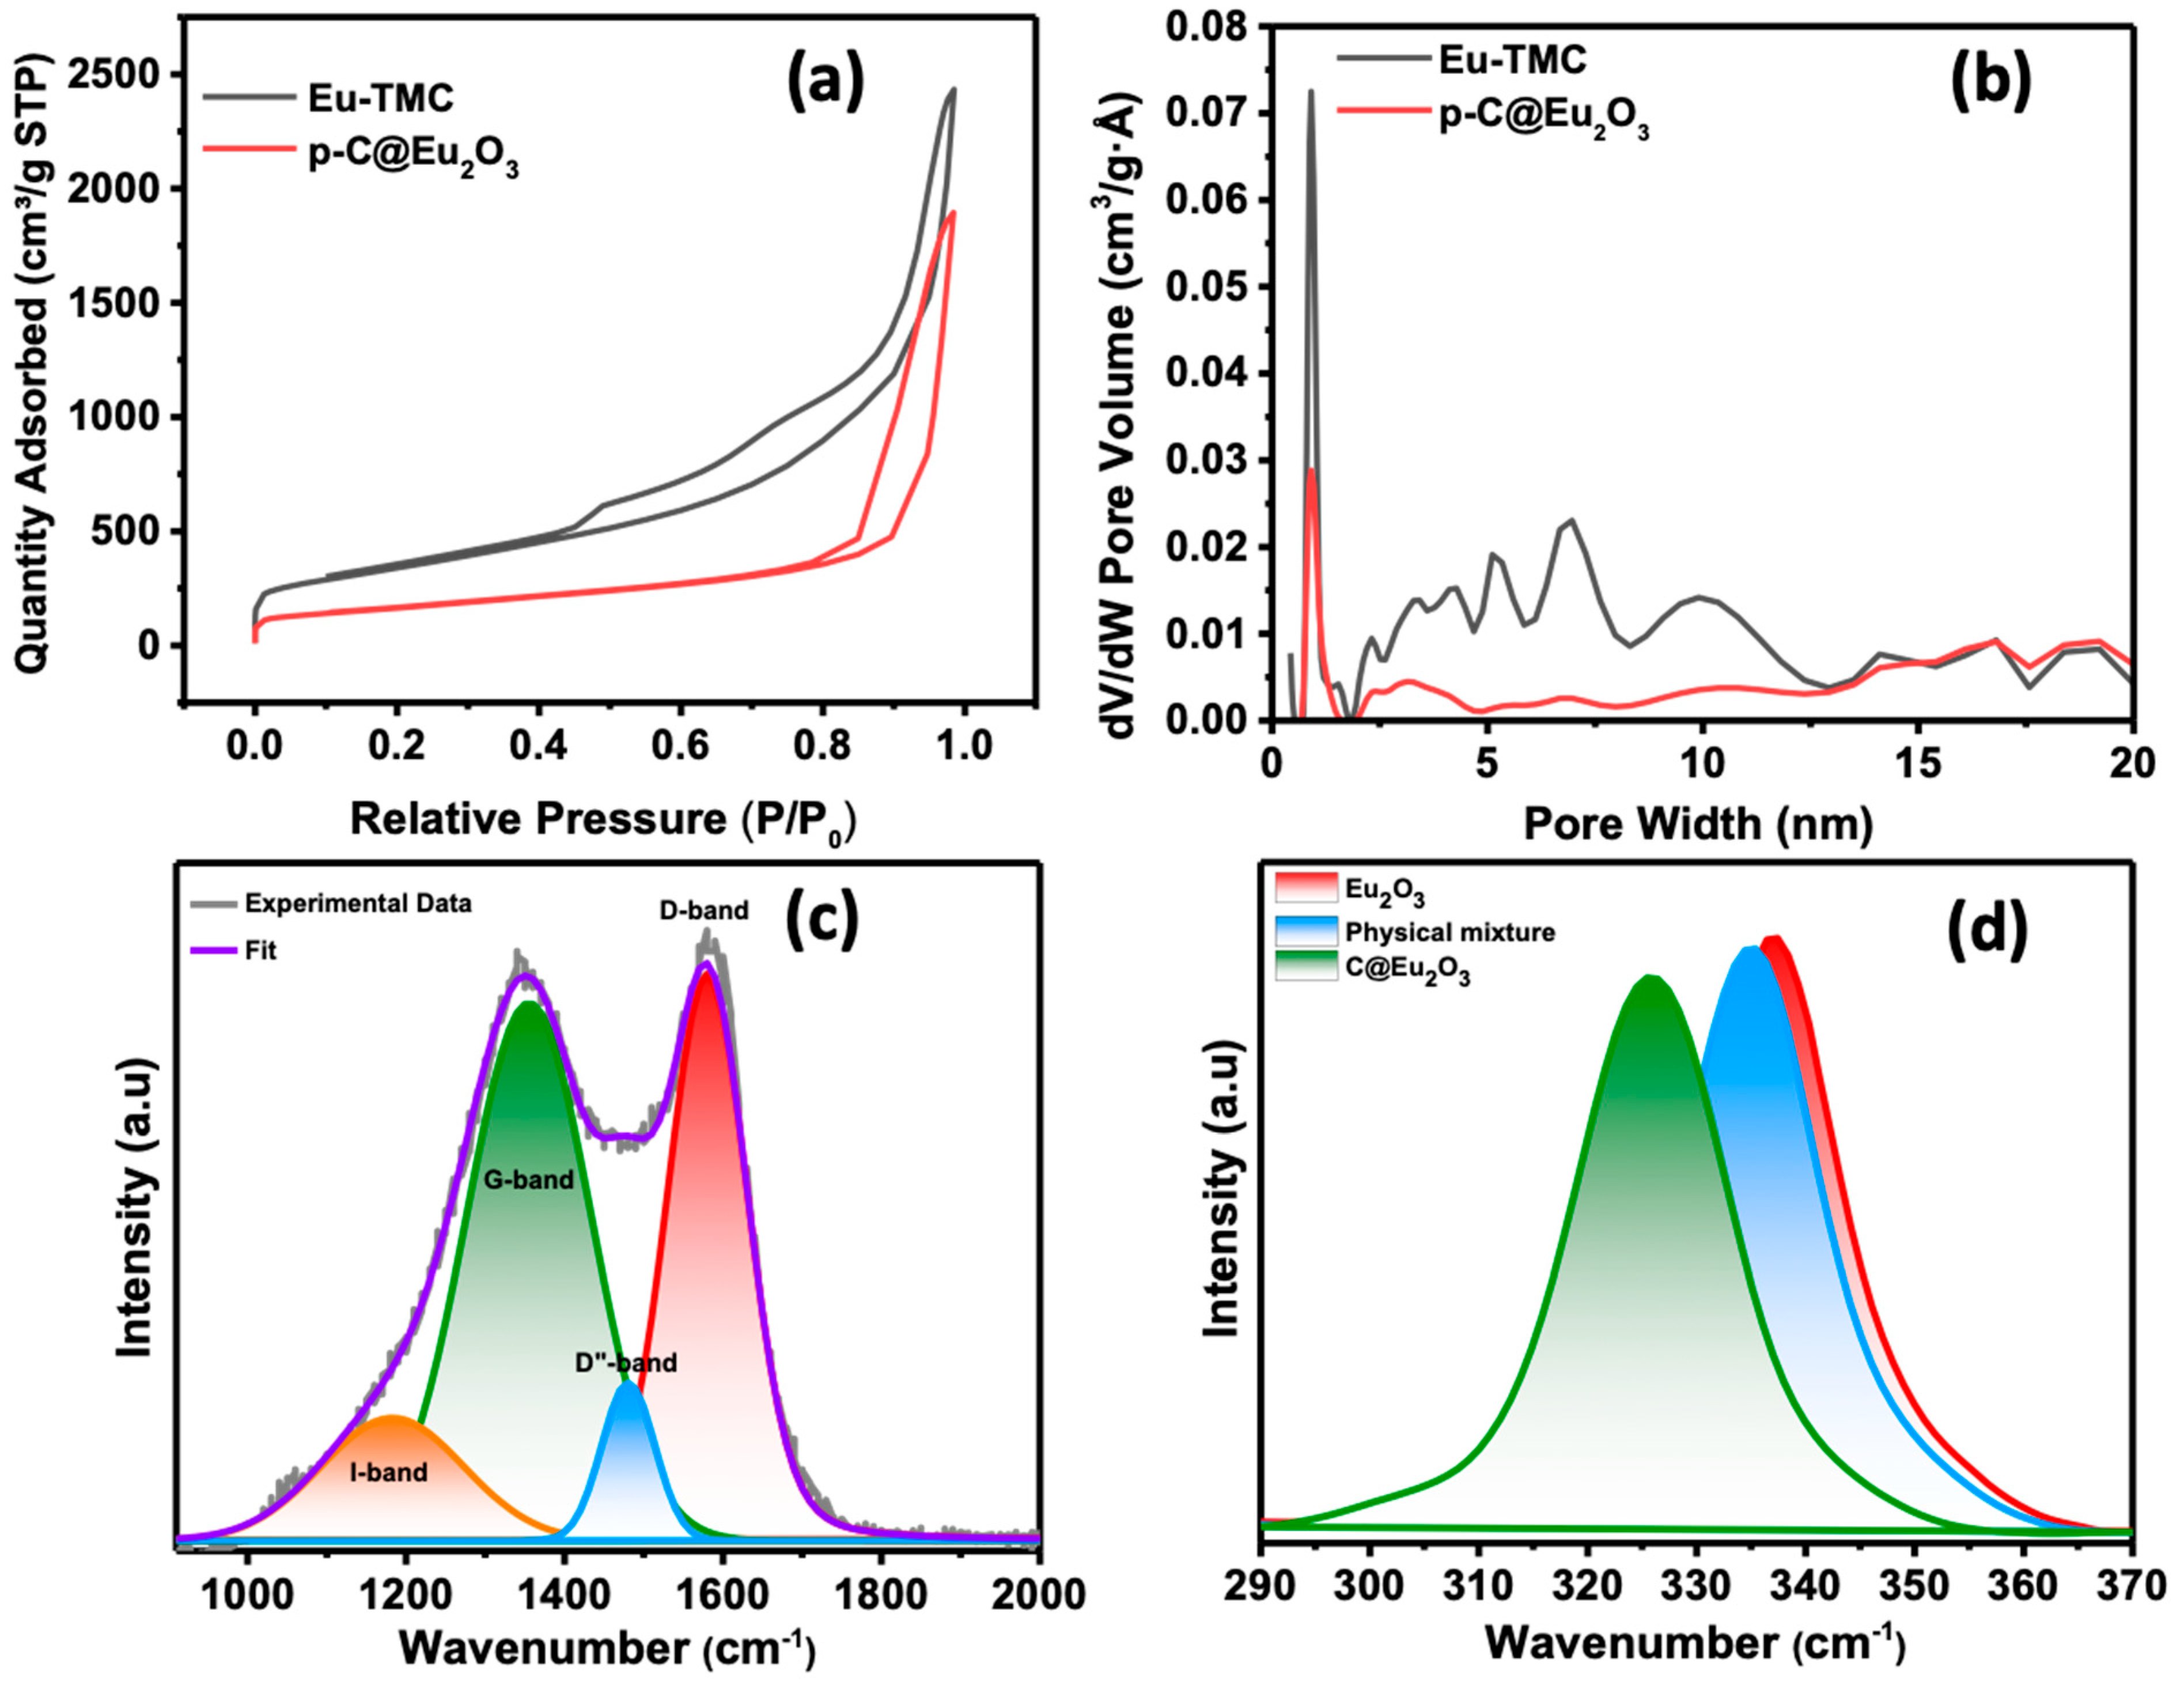
The gas adsorption isotherm shown in Figure 3a,b of the Eu-TMC is a Type IV + Type II also known as a pseudo-type II, with type H3 hysteresis. In a mesoporous material, the absence of a mere inflection point plateau in a (Type IV + Type II) isotherm is indicative of macropores [39]. The pore size distribution determined by 2D-NLDFT shows mesopores ranging from 2.2 nm to 20.3 nm, with an average micropore size of 0.9 nm. This is higher than similar lanthanide-templated carbons (<1000 m2/g) but lower than magnesium oxide-templated carbon [29,40]. The small knee is indicative of a small amount of microporosity, 4.7% of the total surface area. The isotherm for the p-C@ Eu2O3 is Type V, which is characteristically seen when there is pore filling [41]. There is a 21% reduction in micropores and a 55% reduction in mesopores in the 2.2–12.9 nm range compared to the pure carbon due to the Eu2O3 blocking the pores. Consequently, the micropores account for 10.1% of the total porosity, with a total surface area of 587 m2/g. This can be compared to single-walled nanotubes which have <400 m2/g [42].
Conductivity measurements were performed on the C@ Eu2O3, p-C@ Eu2O3, and Eu-TMC, which exhibited conductivities of 3.46 × 10⁵ S/m, 3.58 × 10⁵ S/m, and 4.66 × 10⁵ S/m, respectively. This conductivity is the same order of magnitude as other templated carbon derived from nanorods and two orders of magnitude higher than templated carbon nanosheets [27,28,30,43]. This increase in the conductivity is attributed to the partial removal of insulating Eu2O3 domains, which slightly improves the conductivity of the p-C@Eu2O3. After complete washing, the Eu2O3 is fully removed, leaving a continuous graphitic carbon network, which maximizes the conductivity. The Raman spectrum shows four peaks for the Eu-TMC, as shown in Figure 3c. The I peak is (1180 cm−1), D band is (1360 cm−1), D” band is (1480 cm−1), and G band is (1590 cm−1), with an ID/IG ratio of 0.95. The I band represents sp2-sp3 hybridized carbon bonds, the D band represents disordered carbons, the D’’ band represents sp2–sp3 carbons, and the G band represents graphitic carbons [27]. A substantial portion of the D band is due to disordered C-sp2 bonding. The ID/IG ratio was used to calculate the graphite crystallite size (La) using the equation La = 4.4 Å (ID/IG)−1, yielding 4.63 nm. The ID/IG ratio is in between reported templated carbons using La2O3 (1.03), Y2O3 (0.91), Mg(OH)2 (0.95), and Ca(OH)2 (1.41), with corresponding La values of 4.53 nm, 4.00 nm, 4.18 nm, and 6.20 nm, respectively [27,28,43]. The G band positions of templated carbons are 1600 cm−1 (Y2O3) and 1590 cm−1 (Mg(OH)2), indicating the degree of sp2 clustering [27,30]. The G band for graphite is at 1580 cm−1, whereas nanocrystallite graphite is at 1600 cm−1.
Raman spectroscopy can help us to understand the interaction between electrode materials in hybrid supercapacitors [31,44]. Figure 3d shows the Raman spectra for Eu2O3, C@Eu2O3, and a physical mixture of carbon and Eu2O3. The peak at 337 cm−1 that is assigned to the Fg mode and shifts can be seen based on the interaction of the carbon and the oxide surface [37,45]. The physical mixture has a small shift from 337 cm−1 to 335 cm−1, while the C@ Eu2O3 has a much larger shift of 337 cm−1 to 327 cm−1. This is due to a weak charge transfer interaction in the physical mixture and a stronger charge transfer interaction present when the carbon is grown on the surface of the oxide, respectively. These charge transfer interactions have also been observed using Y2O3, where the carbon was directly grown on the oxide [45].
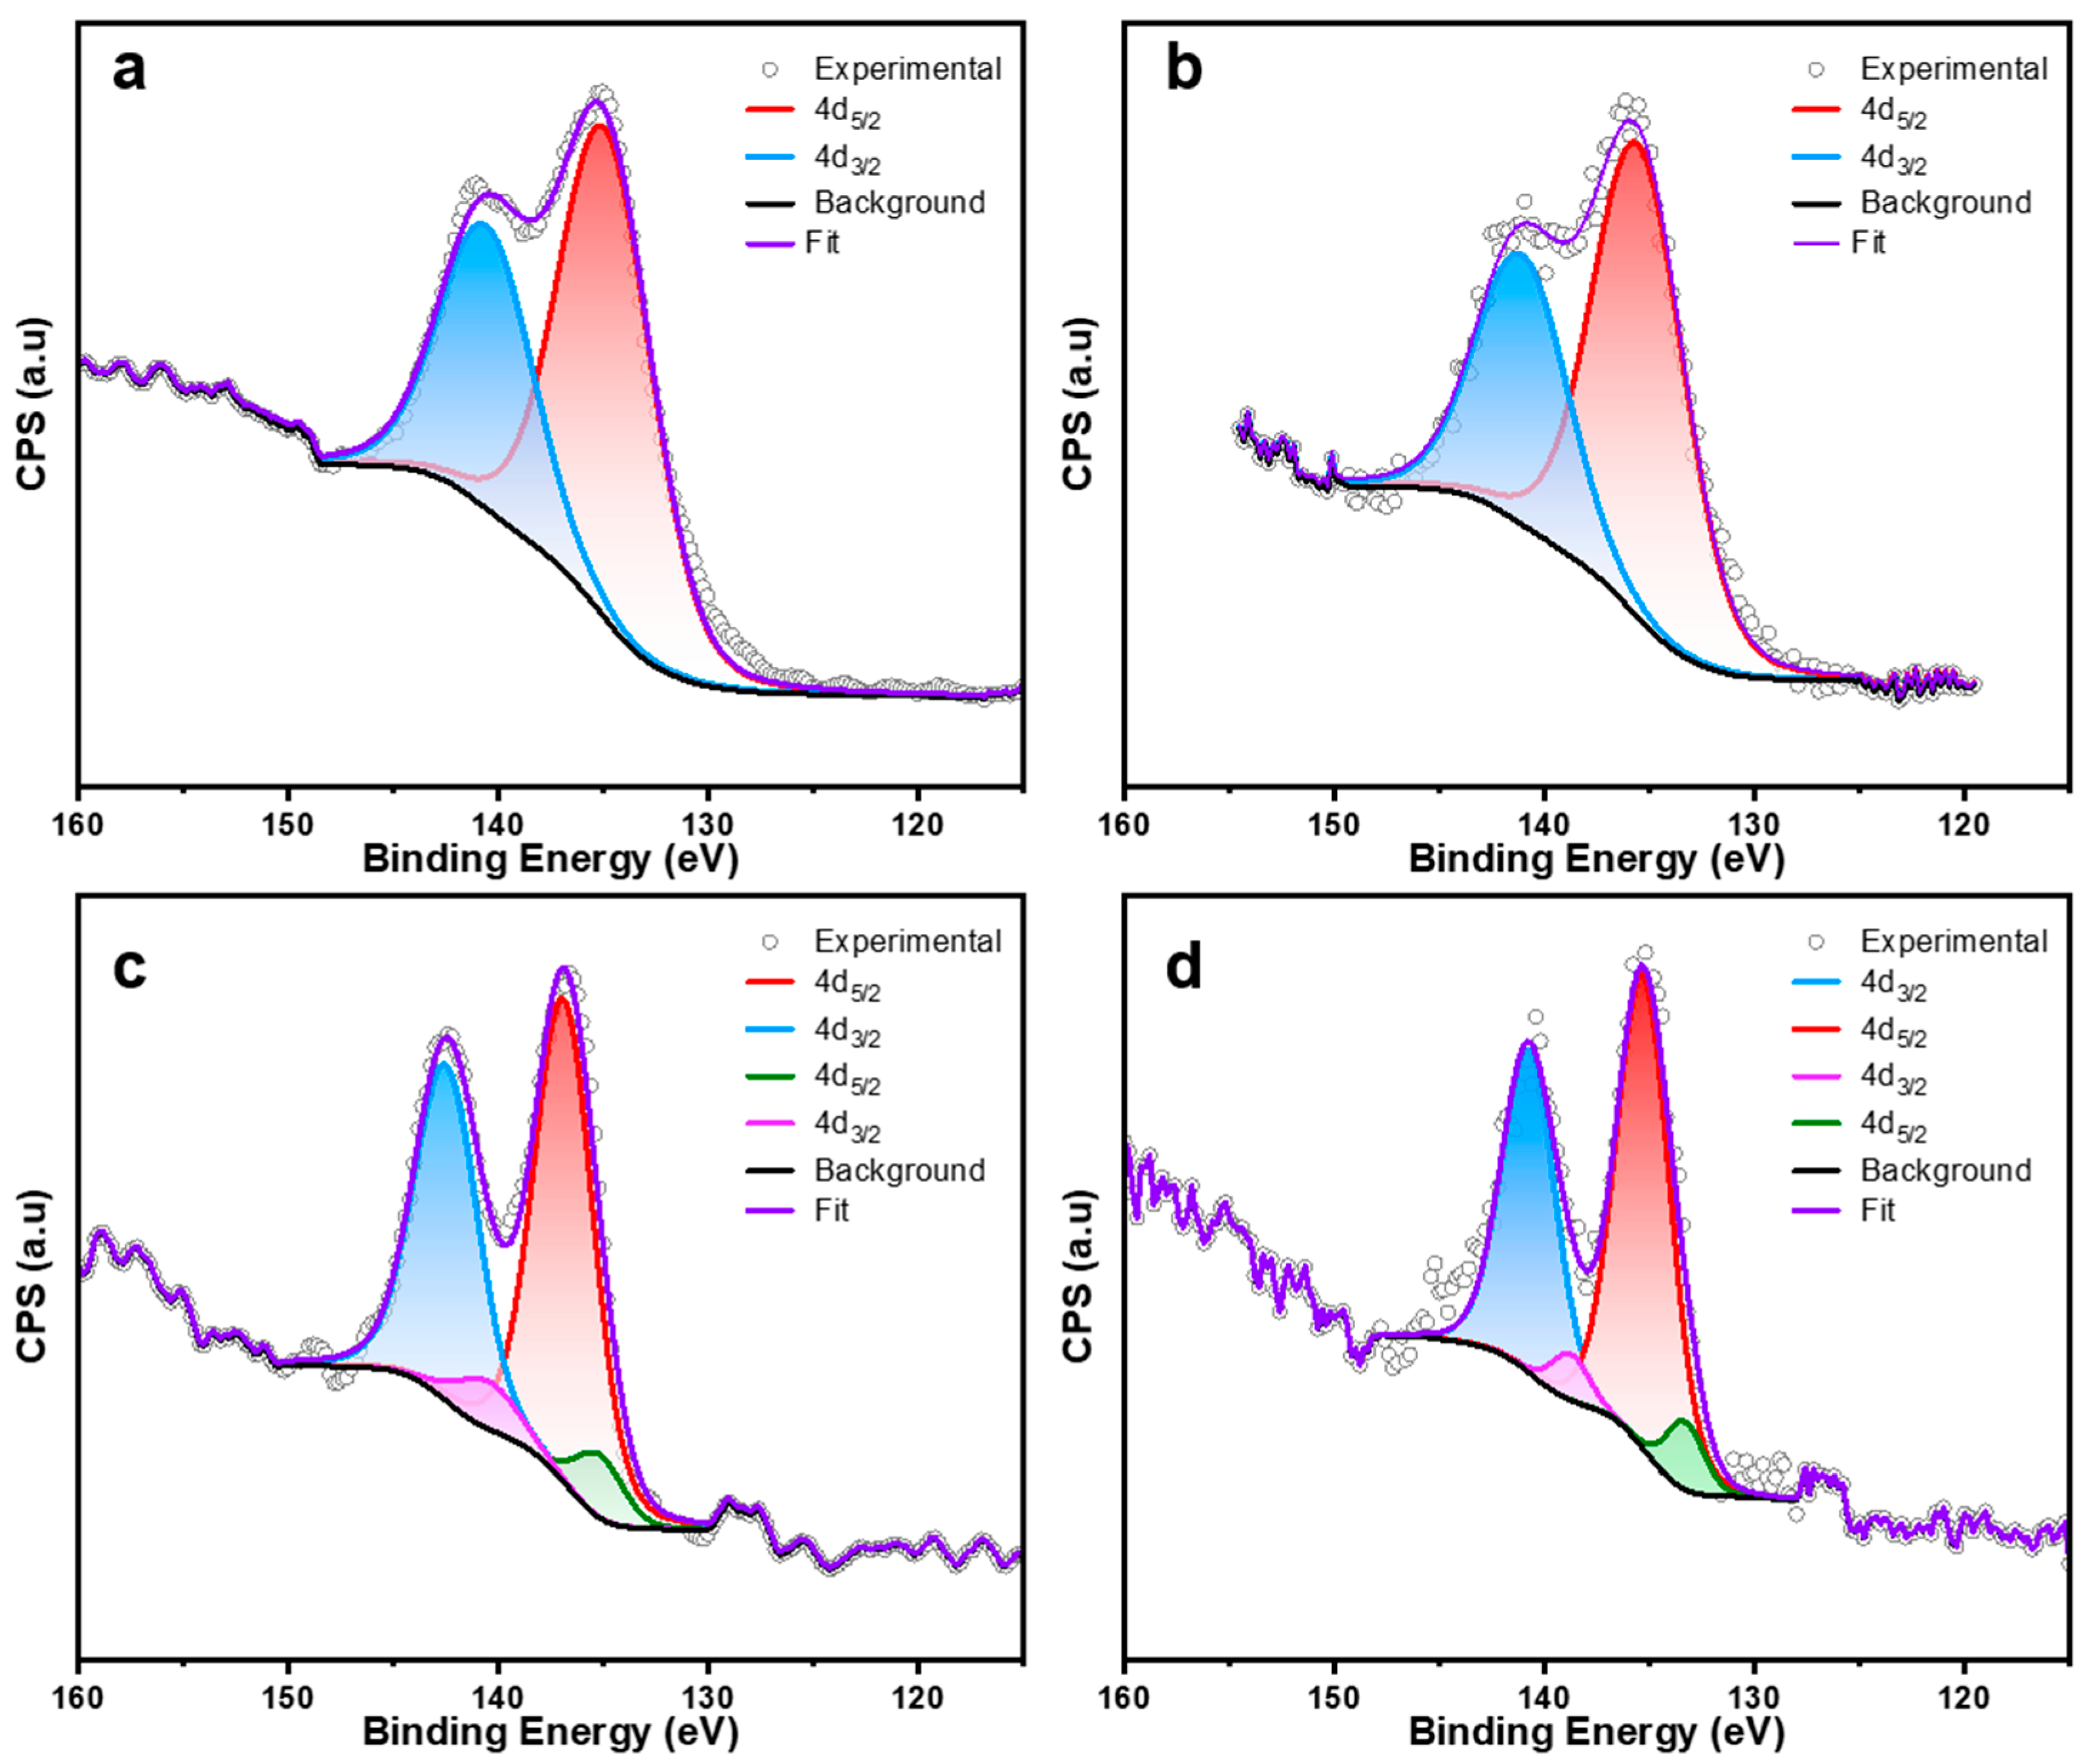
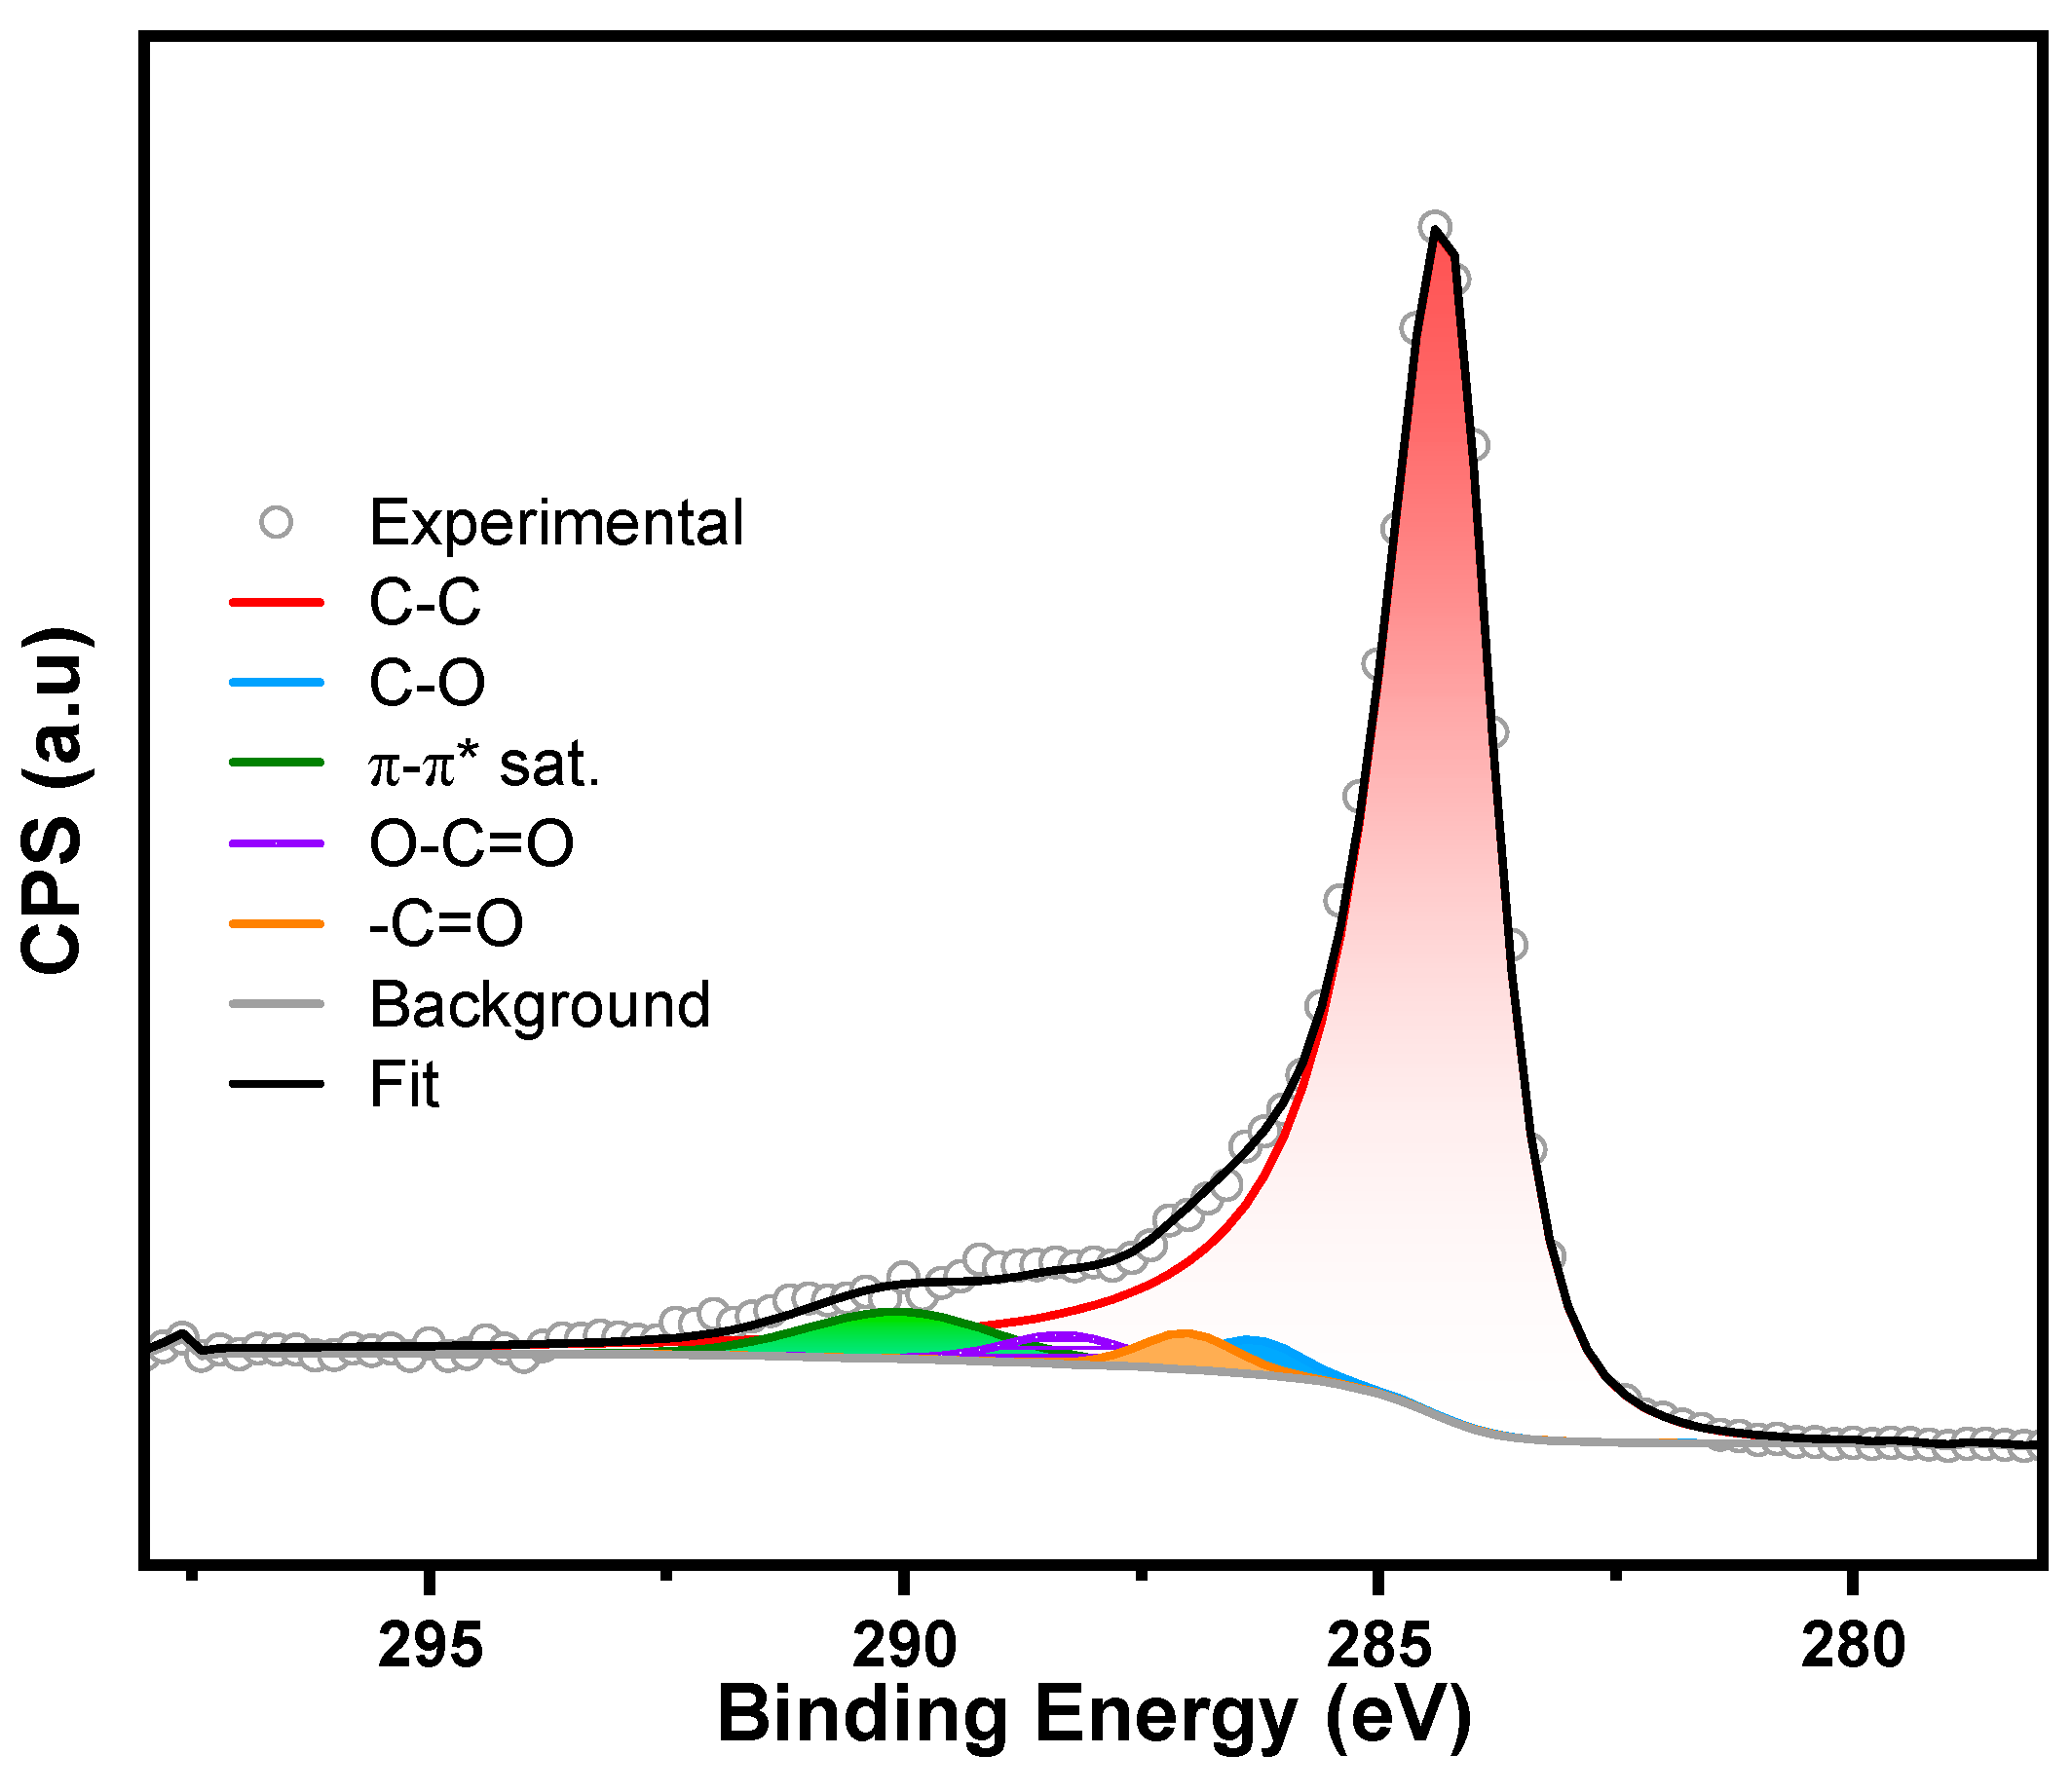
X-Ray photoelectron spectroscopy was used to examine the interaction at the interface between Eu2O3 nanorods and carbon (Figure 4a–d). Figure 4a shows the Eu 4d peaks of pristine Eu2O3 nanorods, while Figure 4b presents those of a physical mixture of Eu2O3 and carbon. The full spectra was shown in Figure S4. In both cases, Eu3+ exhibits only a single 4d doublet. In contrast, Figure 4c,d (C@Eu2O3 and p-C@Eu2O3) display two additional 4d3/2 and 4d5/2 peaks at lower binding energies, indicating a secondary phase arising from the electronic interaction between Eu2O3 and carbon, and values are listed in Table S1 [46]. Importantly, the persistence of these low-binding-energy Eu peaks in the p-C@Eu2O3 confirms that the Eu–C charge transfer interaction survives the acid rinse, while only excess bulk oxide is removed. This demonstrates that the mild washing preserves the intimate oxide–carbon interface responsible for pseudocapacitance. Similar shifts have been observed in a Y2O3 study, with the oxide peaks shifting to a lower energy after the carbon deposition [30]. XPS was also used to determine the nature of the carbon nanorods. The C1s spectrum of Eu-TMC in Figure 5 shows a strong peak for C-C at 284.4 eV, which is likely sp2 hybridized carbons and is asymmetric due to C-sp2 hybridization defects [47]. The deconvoluted spectra also show the presence of oxygen species, including C—O, O—C=O, and C=O [48]. The graphitic carbons and sp2–sp3 hybridized carbons contribute to the high conductivity. The π-π* satellite peak at 290–292 eV corresponds to delocalized π-bonding, which is indicative of electrically conductive C-sp2 hybridized carbons. Similar π-π* satellite peaks have been observed in electrically conductive carbons and graphene materials including templated carbons [28].
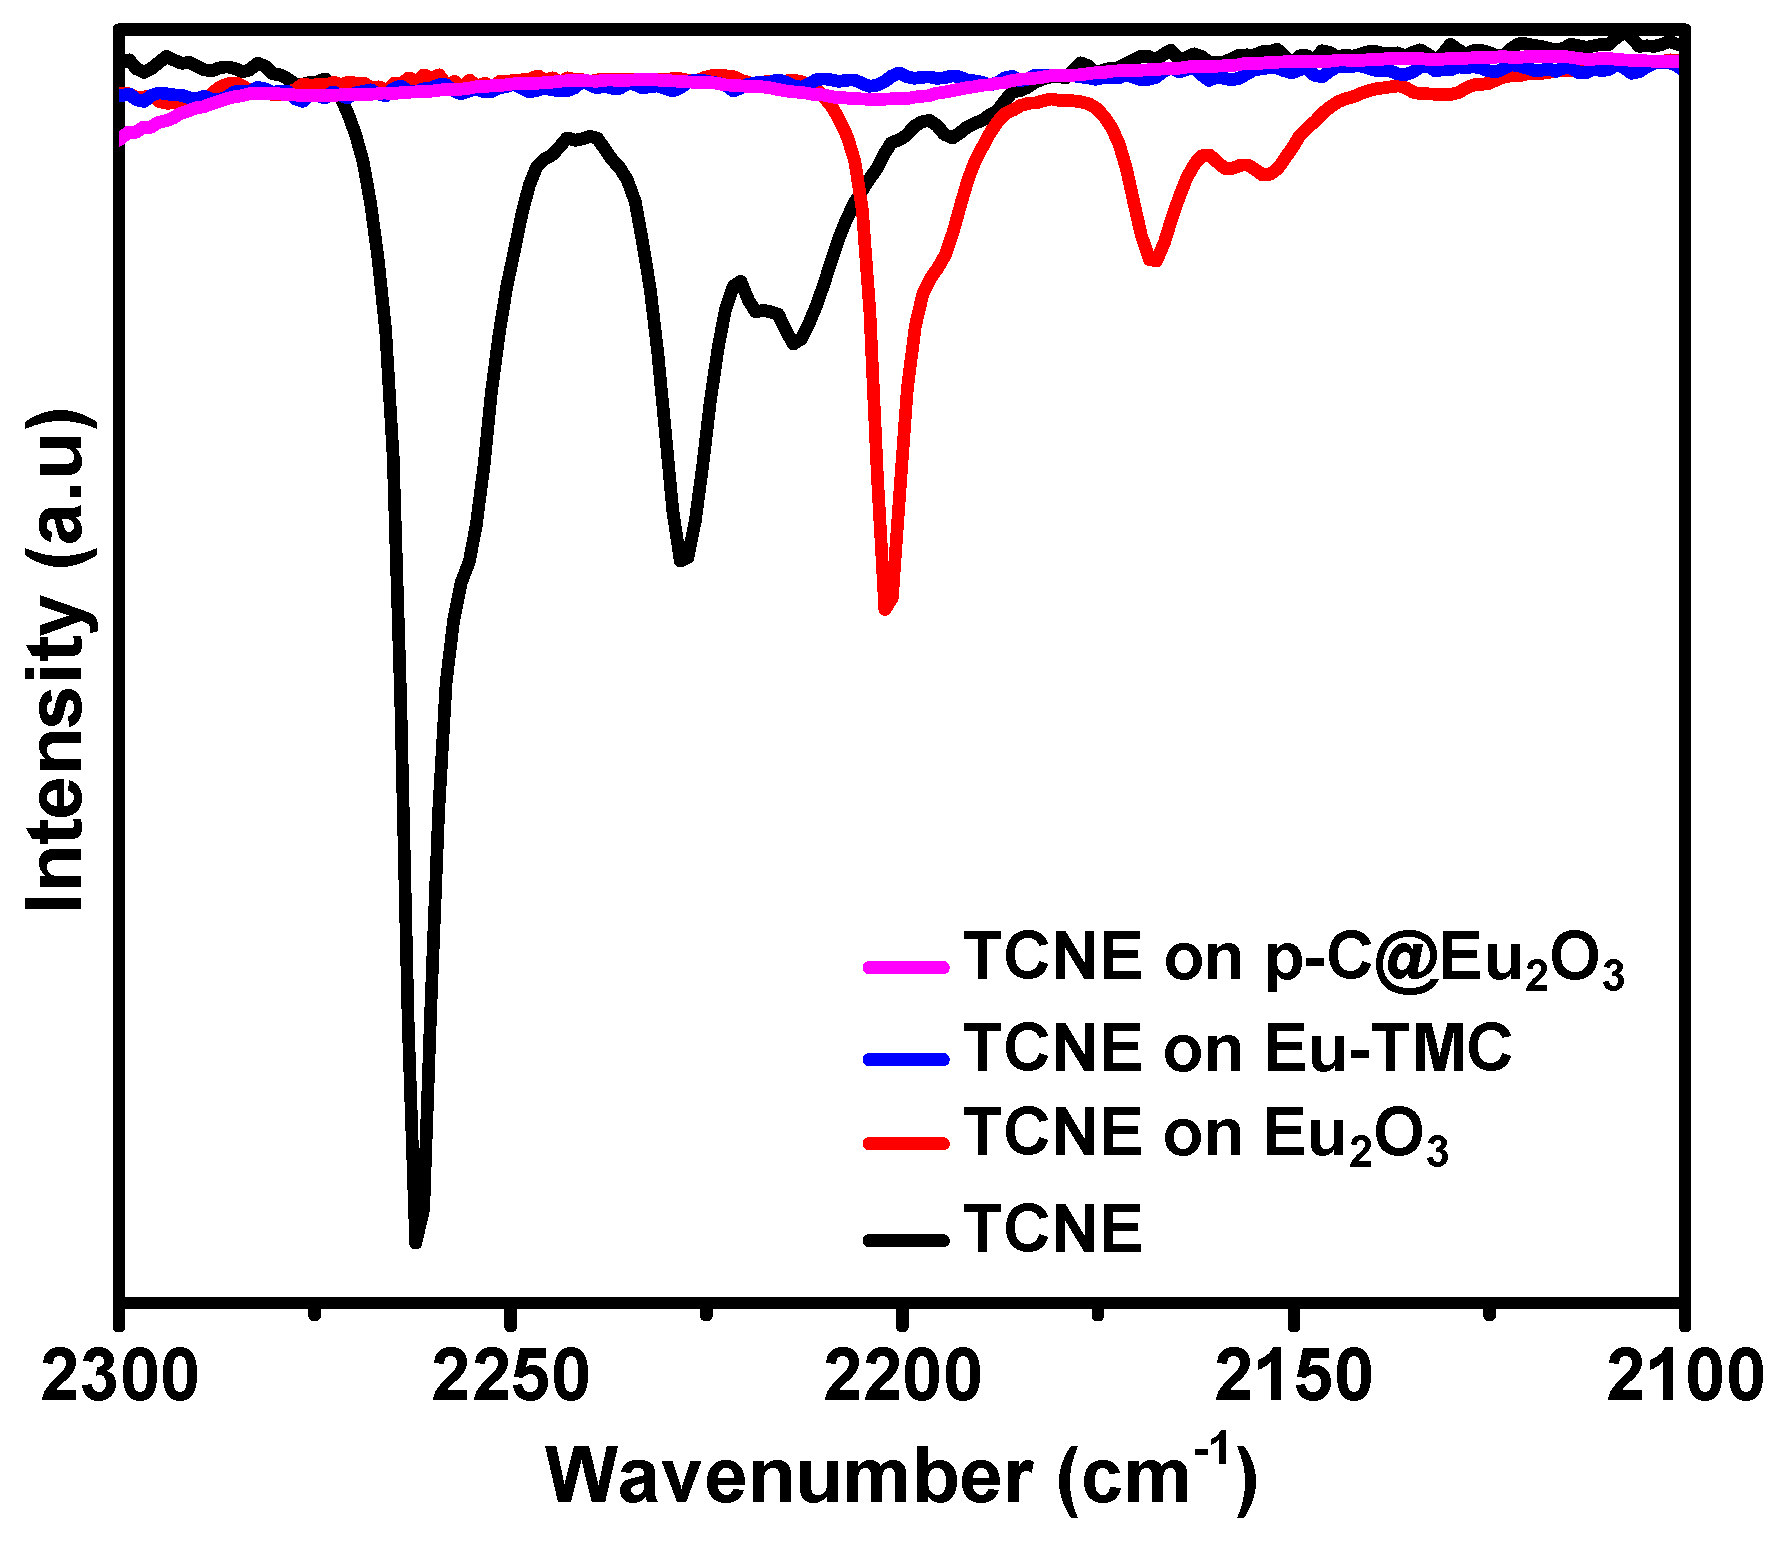
Infrared spectroscopy (IR) was used to further probe the interface and the accessibility of the oxide. Tetracyanoethylene (TCNE) was selected as a probe molecule because it binds to Eu2O3 and is 6 Å in size (similar to the electrolyte size). Figure 6 shows that the TCNE was absorbed onto Eu2O3, and a significant shift was observed from 2261 cm−1 to 2202 cm−1 for the nitrile stretching mode. This shift is due to the coordination of the cyano groups causing a shift to a lower wavenumber as seen in previous studies [49,50]. The p-C@ Eu2O3 sample also exhibited the same shift but had a lower relative intensity due to the lower oxide content. The C@Eu2O3 nanorods did not show a peak for TCNE due to the carbon blocking the access to most of the Eu2O3. This interaction shows that the metal oxide is accessible in p-C@ Eu2O3 after washing.
The thermogravimetric analysis (Figure S3) of C@Eu2O3 illustrates that the extent of the washing of the metal oxide can be controlled by varying the washing time of the metal oxide by 1 M HCl. After 15 min of washing in 1 M HCl, 55% of the Eu2O3 remained, with a BET surface area of 95 m2/g. After 45 min in 1 M HCl, 37% of the oxide remained, with a surface area of 237 m2/g. Finally, after 60 min of 1 M HCl, 19% of the oxide remained, and the surface area increased to 587 m2/g. This composition was selected for the electrochemical testing, as it provides a good ratio of the metal oxide-derived pseudocapacitance and a high surface area. With a further increase in washing time to 75 min, all the metal oxide was washed out, resulting in a surface area of 1226 m2/g for carbon.
The HCl solution was used to wash out the oxide and was collected and treated with sodium hydroxide, resulting in the regeneration of europium hydroxide. The europium hydroxide (Figure S2) was recycled with a 95% yield, thus allowing this material to be used many times for CVD as a template for carbon growth. This high recyclability makes it cost-effective and scalable.
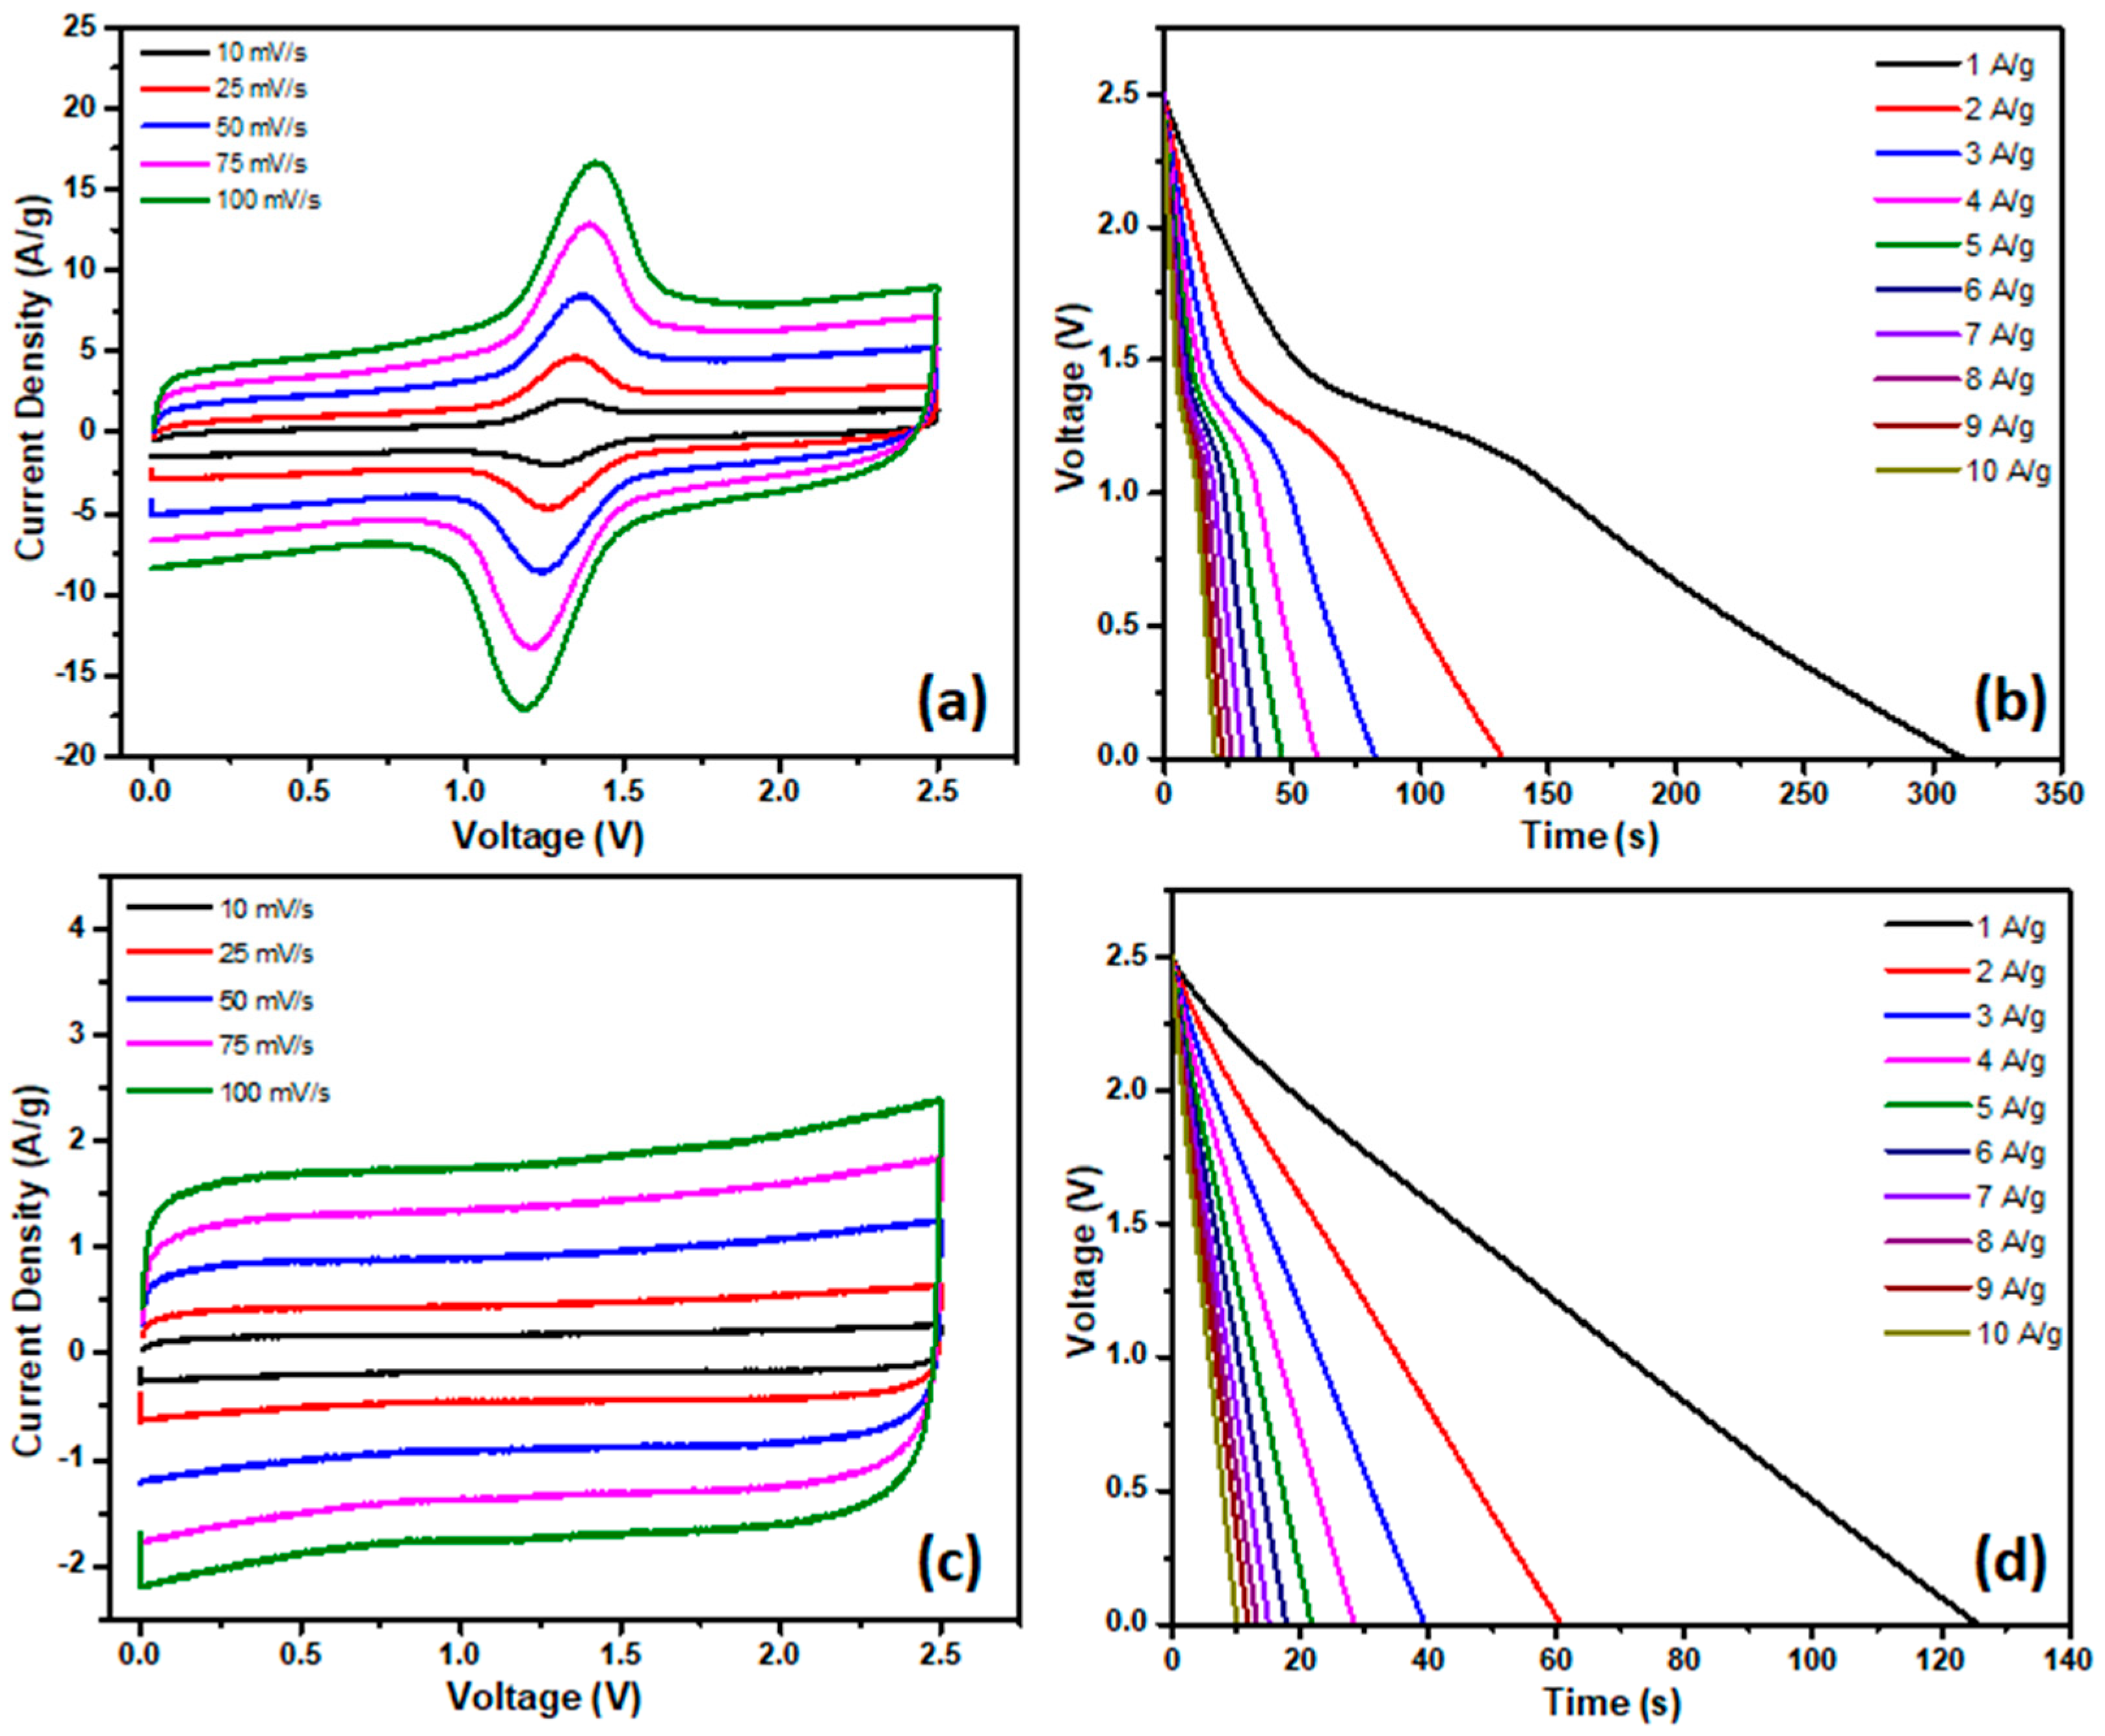
Carbon electrodes were prepared with the p-C@Eu2O3 and assembled into a symmetric John Miller Energy (JME) cell. Cyclic voltammetry (CV) was performed on the cell at different scan rates, with a voltage range of 2.5 V (0 to 2.5 V) using the organic electrolyte LiTFSI in PC.
The CV diagram in Figure 7a has a reversible oxidation–reduction peak at 1.4 V and 1.19 V, respectively, at a scan rate of 100 mV/s, which indicates the contribution of Eu2O3 to the overall capacitance of the cell by the Eu3+/2+ couple along with the electric double-layer capacitance (EDLC) due to the carbon nanorods [25,26]. During the charging and discharging, Eu3+ is reversibly reduced to Eu2+ and oxidized back, providing the pseudocapacitive contribution. The intimate Eu2O3–carbon interface promotes fast electron transfer between the oxide and the conductive carbon backbone, which enhances the utilization of redox-active sites. Moreover, the use of an organic electrolyte extends the voltage window to 2.5 V, far beyond the 1.2 V limit of the aqueous electrolyte, which results in a higher energy density. To compare the results with pure carbon, Eu-TMC electrodes were also assembled in a JME cell. The CV diagram of the Eu-TMC in Figure 8c shows the rectangular-shaped curve without any redox peak, indicative of ideal EDLC behavior. In contrast, the unwashed C@Eu2O3 (Figure S8) shows only 98.1 F/g with EDLC-type curves and no distinct Eu3+/2+ peaks, confirming that the oxide is mostly inaccessible under the graphitic carbon.
The discharge curve measurements were obtained by first charging the cell from 0 to 2.5 V and stabilizing it for 30 s before complete discharging. Figure 8b shows the galvanostatic discharge curve at different current densities (1–10 A/g) for the p-C@Eu2O3. An inflection in the discharge curve at 1.4 V shows the contribution of the pseudocapacitance due to Eu2O3 inside the nanorods. Furthermore, the peaks also indicate the accessibility of the metal oxide to the electrolyte. The gravimetric capacitance, calculated from the charge–discharge curves (CDCs) after subtracting the small IR drop of 0.009 V at 1 A/g, was 501.2 F/g, which is 147% higher than the cell produced with Eu-TMC (Tables S2 and S3). The IR drops ranged from 0.009 V at 1 A to 0.08 V at 10 A/g, which reflects the high conductivity of the carbon and the short ion diffusion distance.
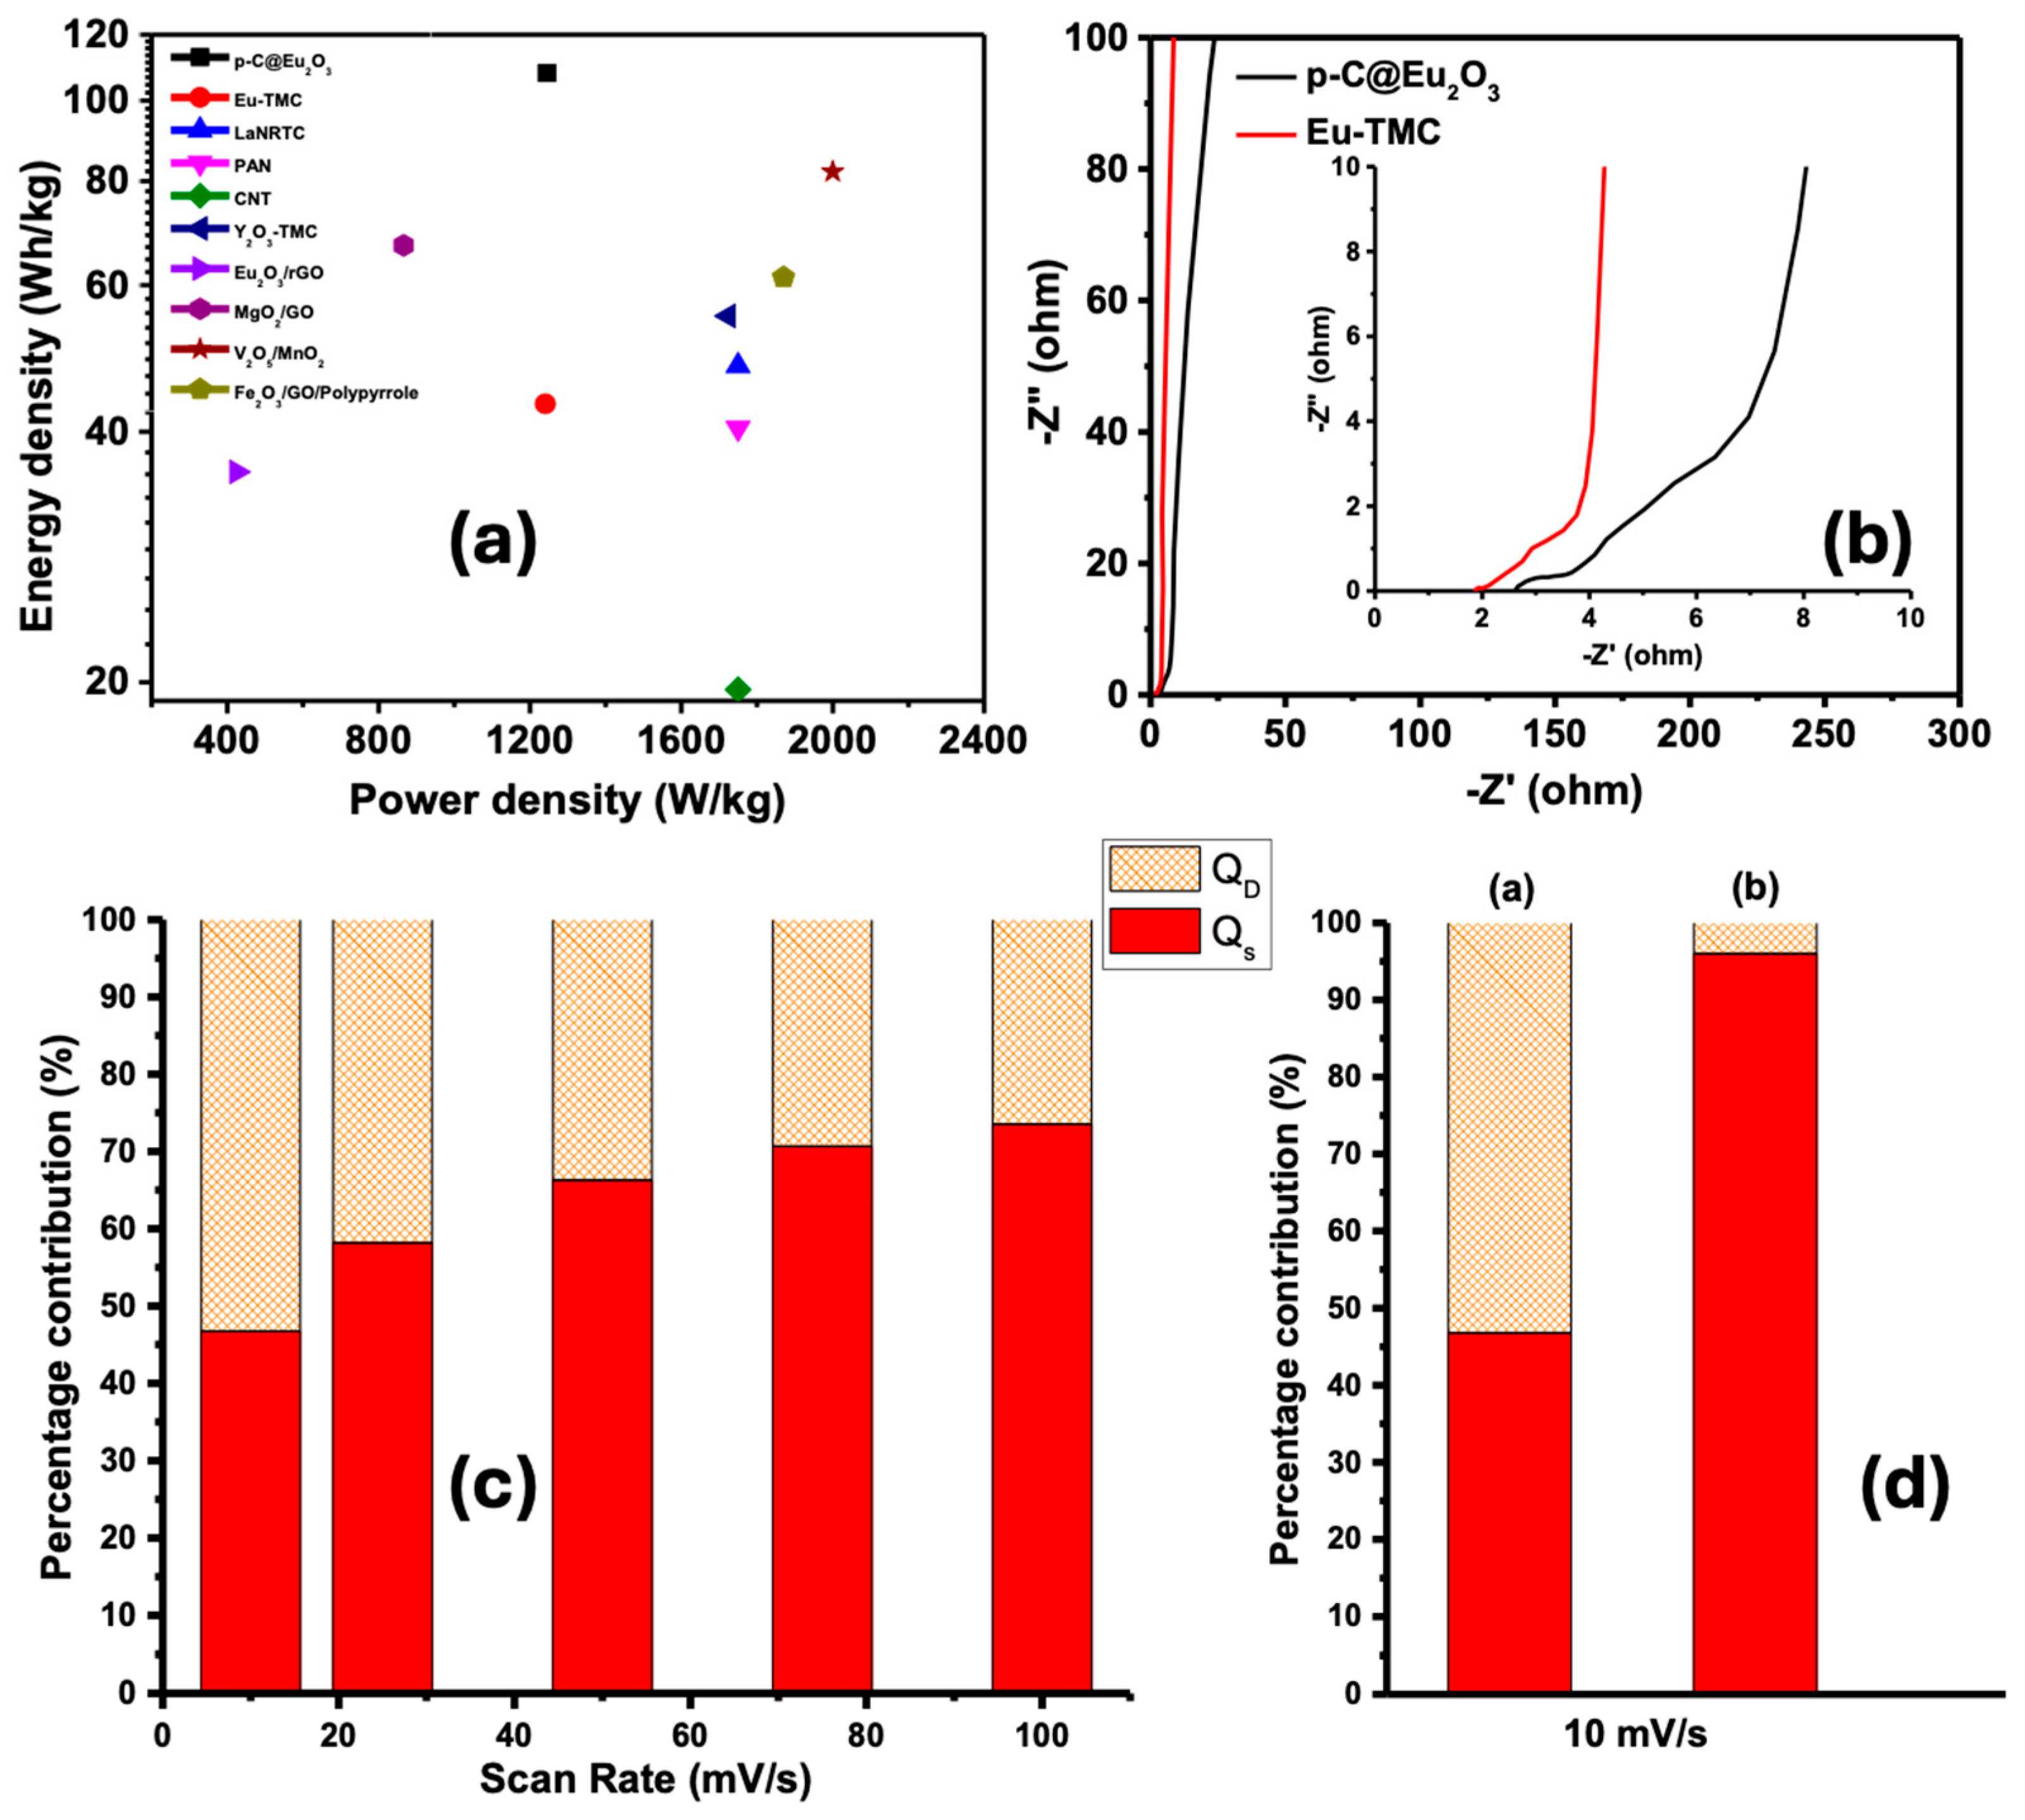
The energy and power densities were calculated from the gravimetric capacitance using Equations (1) and (2) and are listed in Table S2. At a current density of 1 A/g, the energy density and power density of the p-C@ Eu2O3 were 108 Wh/kg and 1245 W/kg, respectively, which is 251% higher than the energy density of the Eu-TMC (43.2 Wh/kg at 1 A/g). Table 1 shows that compared to reported Eu2O3 composites, templated carbons and other transition metal-based hybrids, the p-C@Eu2O3 exhibits a higher capacitance (501.2 F/g) and energy density (108 Wh/Kg).
The Ragone plot is shown in Figure 8a and compares the energy and power density of the p-C@ Eu2O3 with the Eu-TMC at different current densities (1 to 10 A/g), demonstrating the superior performance at different current densities in cells with metal oxide due to the combination of the pseudocapacitance.
A three-electrode experiment, shown in Figure S5, was conducted to determine the position of the Eu3+/2+ redox couple, which was 1.26 V vs. RHE in the organic electrolyte. The Eu3+/2+ couple has not been studied in organic electrolytes to our knowledge. This value is higher than a reported aqueous value (1.15 V), which used a platinum wire as an counter electrode [54,55,56].
Electrochemical impedance spectroscopy was performed to determine resistance contributions on the assembled cells. A recent study described the precise process for the physical interpretation of redox-active electrodes for electrical energy storage [57]. The summation of electrode resistances is shown in Figure 8b and defined by the first point on the real axis (x-axis) and was 1.86 Ωcm2 and 2.59 Ωcm2 for Eu-TMC and p-C@Eu2O3, respectively. Typically, the bulk electrolyte resistance is determined by the diameter of the semi-circle, but there is only a small height in each spectrum at 2.93 Ωcm2 and 4.32 Ωcm2 for Eu-TMC and p-C@Eu2O3, respectively, which the electrolyte resistance can be attributed to [58]. The second point of resistance is ascribed to the diffuse layer resistance, which is marked as the tangent point when the curve sharply increases in slope. For Eu-TMC, the diffuse layer resistance was 4.06 Ωcm2 and for p-C@Eu2O3 it was 8.41 Ωcm2. The steep slope is indicative of an electric double-layer formation that is thin compared to the electrolyte layer. This suggests that the charging process is not limited by ion diffusion in the Eu-TMC electrodes and shows that the electrolyte can easily access the large amount of mesopores present in the electrodes [34,58]. The slope of the tail in the p-C@Eu2O3 sample was less steep and had an inflection in the tail that is indicative of ion diffusion in the electrolyte.
Figure S7 shows that after 5000 cycles at 10 A/g, the hybrid supercapacitor retained 77.5% capacitance. This moderate degradation is common for pseudocapacitive electrodes, where faradic reactions can lead to partial oxide dissolution after long cycles. Previously reported supercapacitors with redox-active material (i.e., MnO2 and NiCo2O4-based material) show the same trend, whereas purely carbon-based EDLC shows above 90% retentions due to the absence of redox strain.
CV can also be used to probe the kinetics of the electrochemical reactions by plotting a linear relationship between the inverse scan rate (v1/2) and the total stored charge. The total volumetric charge (Qt) can be divided into two components: surface-controlled charge (Qs) and diffusion-controlled charge (Qd). The Qs is obtained from the electric double layer and fast, easily accessible faradaic reactions, while Qd is obtained from the slower redox and Li+ insertion. All three variables are related in Equation (4).
Q T = Q S + Q D  
Q T = Q S + C v   1 / 2
Figure 8c,d show a plot of the % Qs and Qd verses scan rates. The trend at faster scan rates shows that the diffusion capacitance is limited. The p-C@Eu2O3 exhibits a larger diffusion capacitance of 53% versus 4% in the case of Eu-TMC at 10 mv/s. The larger diffusion contribution of the p-C@Eu2O3 is attributed to the redox predominantly, while the relatively small 4% diffusion contribution in the Eu-TMC is attributed to the Li intercalation, as seen in other studies [49]. This shows that the europium synergistically enhances the performance of the supercapacitor.

6. Conclusions

In conclusion, Eu2O3-templated graphitic carbon hollow nanorods were synthesized from acetylene and steam using Eu(OH)3 nanorods as a template. The resulting carbon had a conductivity of 4.66 × 10⁵ S/m and had a surface area of 1226 m2/g with mesoporosity. The partial washing of Eu2O3 exposed the carbon surface while retaining some Eu2O3 to contribute to the redox pseudocapacitance. The deposition created intimate contact between the carbon and Eu2O3. This interface enabled fast charge transfer and combined EDLC with the Eu3+/Eu2+ pseudocapacitance. The hybrid cell delivered 501.2 F/g and 107.9 Wh/kg at 1 A/g, with a power density of 12,097 W/kg. The capacitance retention was 77.5% after 5000 cycles. Eu2O3 was recycled into Eu(OH)3 with a 95% yield. These results show that the partial washing together with the Eu2O3–carbon interface play a role in the high energy density and capacitance.

Supplementary Materials

The following supporting information can be downloaded at https://www.mdpi.com/article/10.3390/batteries11100355/s1: Figure S1: Eu(OH)3 JCPDS No. 83-2305 (a) and synthesized Eu(OH)3 nanorods (b); Figure S2: Recycled Eu(OH)3 nanorods; Figure S3: TGA curves of C@Eu2O3 after 1 M HCl washings for 15, 45, 60, and 75 min; Figure S4: XPS survey spectra of Eu2O3 (a), physical mixture (b), and C@Eu2O3 (c); Figure S5: Three-electrode cyclic voltammetry of 19 % Eu2O3 in carbon nanorods; Figure S6: SEM images of carbon-coated Eu2O3 nanorods (a) and 19 % Eu2O3 in carbon nanorods (b). Figure S7: Cycling tests of p-C@ Eu2O3 in carbon nanorods; Figure S8: Cyclic voltammetry of C@ Eu2O3; Table S1: XPS peak position and binding energy shifts in the Eu 4d; Table S2: Electrochemical values for 19 % Eu2O3 in carbon nanorods; Table S3: Electrochemical values for pure carbon nanorods; and XRD diffractions patterns, a TEM image, a SEM image, adsorption isotherms, XPS survey spectra and table, and additional electrochemical data tables are provided in the supporting file.

Author Contributions

Conceptualization, A.U., D.W.T., K.J.B.J. and J.P.F.; methodology, A.U. and D.W.T.; formal analysis, A.U. and M.A.; writing—original draft preparation, A.U. and D.W.T.; writing—review and editing, K.J.B.J., A.U., M.A. and J.P.F.; supervision, K.J.B.J. and J.P.F.; funding acquisition, K.J.B.J. All authors have read and agreed to the published version of the manuscript.

Funding

The authors gratefully acknowledge the Robert A. Welch Foundation (AT-1153) for financial support. Additional funding was provided by the University of Texas at Dallas Office of Research through the Core Facility Voucher Program (10319) as needed.

Data Availability Statement

The original contributions presented in this study are included in the article/Supplementary Material. Further inquiries can be directed to the corresponding author.

Conflicts of Interest

The authors declare that they have no competing financial interest.

References

  1. Liu, W.; Sun, X.; Yan, X.; Gao, Y.; Zhang, X.; Wang, K.; Ma, Y. Review of Energy Storage Capacitor Technology. Batteries 2024, 10, 271. [Google Scholar] [CrossRef]
  2. Salaheldeen, M.; Eskander, T.N.A.; Fathalla, M.; Zhukova, V.; Blanco, J.M.; Gonzalez, J.; Zhukov, A.; Abu-Dief, A.M. Empowering the Future: Cutting-Edge Developments in Supercapacitor Technology for Enhanced Energy Storage. Batteries 2025, 11, 232. [Google Scholar] [CrossRef]
  3. Yaseen, M.; Khattak, M.A.K.; Humayun, M.; Usman, M.; Shah, S.S.; Bibi, S.; Hasnain, B.S.U.; Ahmad, S.M.; Khan, A.; Shah, N.; et al. A Review of Supercapacitors: Materials Design, Modification, and Applications. Energies 2021, 14, 7779. [Google Scholar] [CrossRef]
  4. Obreja, V.V. On the performance of supercapacitors with electrodes based on carbon nanotubes and carbon activated material—A review. Phys. E Low-Dimens. Syst. Nanostructures 2008, 40, 2596–2605. [Google Scholar] [CrossRef]
  5. Lin, Z.; Goikolea, E.; Balducci, A.; Naoi, K.; Taberna, P.-L.; Salanne, M.; Yushin, G.; Simon, P. Materials for supercapacitors: When Li-ion battery power is not enough. Mater. Today 2018, 21, 419–436. [Google Scholar] [CrossRef]
  6. Banerjee, S.; Mordina, B.; Sinha, P.; Kar, K.K. Recent advancement of supercapacitors: A current era of supercapacitor devices through the development of electrical double layer, pseudo and their hybrid supercapacitor electrodes. J. Energy Storage 2025, 108, 115075. [Google Scholar] [CrossRef]
  7. Davies, A.; Yu, A. Material advancements in supercapacitors: From activated carbon to carbon nanotube and graphene. Can. J. Chem. Eng. 2011, 89, 1342–1357. [Google Scholar] [CrossRef]
  8. Shah, S.S.; Aziz, M.A.; Yamani, Z.H. Recent Progress in Carbonaceous and Redox-Active Nanoarchitectures for Hybrid Supercapacitors: Performance Evaluation, Challenges, and Future Prospects. Chem. Rec. 2022, 22, e202200018. [Google Scholar] [CrossRef]
  9. Chen, R.; Yu, M.; Sahu, R.P.; Puri, I.K.; Zhitomirsky, I. The development of pseudocapacitor electrodes and devices with high active mass loading. Adv. Energy Mater. 2020, 10, 1903848. [Google Scholar] [CrossRef]
  10. Liu, F.; Wang, Z.; Zhang, H.; Jin, L.; Chu, X.; Gu, B.; Huang, H.; Yang, W. Nitrogen, oxygen and sulfur co-doped hierarchical porous carbons toward high-performance supercapacitors by direct pyrolysis of kraft lignin. Carbon 2019, 149, 105–116. [Google Scholar] [CrossRef]
  11. Lu, Z.; Ren, X. Pseudocapacitive Storage in High-Performance Flexible Batteries and Supercapacitors. Batteries 2025, 11, 63. [Google Scholar] [CrossRef]
  12. Liu, F.; Feng, X.; Wu, Z.-S. The key challenges and future opportunities of electrochemical capacitors. J. Energy Chem. 2023, 76, 459–461. [Google Scholar] [CrossRef]
  13. Muzaffar, A.; Ahamed, M.B.; Deshmukh, K. Conducting polymer electrolytes for flexible supercapacitors. Flex. Supercapacitor Nanoarchitectonics 2021, 233–262. [Google Scholar] [CrossRef]
  14. Wei, L.; Zhao, W.; Yushin, G. Carbons from biomass for electrochemical capacitors. Prod. Mater. Sustain. Biomass Resour. 2019, 153–184. [Google Scholar] [CrossRef]
  15. Li, J.; Tang, J.; Yuan, J.; Zhang, K.; Shao, Q.; Sun, Y.; Qin, L.-C. Interactions between graphene and ionic liquid electrolyte in supercapacitors. Electrochimica Acta 2016, 197, 84–91. [Google Scholar] [CrossRef]
  16. Zhuo, J.; Zheng, Y.; Li, S.; Sha, J. A supercapacitor with high specific volumetric capacitance produced by 12-phosphomolybdate anchored on graphene balls. ACS Appl. Energy Mater. 2022, 5, 13627–13634. [Google Scholar] [CrossRef]
  17. Liu, P.; Ge, Y.; Li, H.; Wen, Y.; Chen, T.; Zeng, X. New insights into the performance of biomass carbon-based supercapacitors based on interpretable machine learning approach. J. Energy Storage 2025, 118, 116300. [Google Scholar] [CrossRef]
  18. Umasankar, Y.; Brooks, D.B.; Brown, B.; Zhou, Z.; Ramasamy, R.P. Three dimensional carbon nanosheets as a novel catalyst support for enzymatic bioelectrodes. Adv. Energy Mater. 2014, 4, 1301306. [Google Scholar] [CrossRef]
  19. Aziz, A.; Shah, S.S.; Kashem, A. Preparation and Utilization of Jute-Derived Carbon: A Short Review. Chem. Rec. 2020, 20, 1074–1098. [Google Scholar] [CrossRef]
  20. Presser, V.; Heon, M.; Gogotsi, Y. Carbide-derived carbons–from porous networks to nanotubes and graphene. Adv. Funct. Mater. 2011, 21, 810–833. [Google Scholar] [CrossRef]
  21. Wang, L.; Zhang, X.; Li, C.; Sun, X.-Z.; Wang, K.; Su, F.-Y.; Liu, F.-Y.; Ma, Y.-W. Recent advances in transition metal chalcogenides for lithium-ion capacitors. Rare Met. 2022, 41, 2971–2984. [Google Scholar] [CrossRef]
  22. Zeng, Y.; Yu, M.; Meng, Y.; Fang, P.; Lu, X.; Tong, Y. Iron-based supercapacitor electrodes: Advances and challenges. Adv. Energy Mater. 2016, 6, 1601053. [Google Scholar] [CrossRef]
  23. Perera, S.D.; Rudolph, M.; Mariano, R.G.; Nijem, N.; Ferraris, J.P.; Chabal, Y.J.; Balkus, K.J., Jr. Manganese oxide nanorod–graphene/vanadium oxide nanowire–graphene binder-free paper electrodes for metal oxide hybrid supercapacitors. Nano Energy 2013, 2, 966–975. [Google Scholar] [CrossRef]
  24. Raut, B.; Ahmed, M.S.; Kim, H.-Y.; Rahman Khan, M.M.; Bari, G.A.K.M.R.; Islam, M.; Nam, K.-W. Battery-Type Transition Metal Oxides in Hybrid Supercapacitors: Synthesis and Applications. Batteries 2025, 11, 60. [Google Scholar] [CrossRef]
  25. Aryanrad, P.; Naderi, H.R.; Kohan, E.; Ganjali, M.R.; Baghernejad, M.; Dezfuli, A.S. Europium oxide nanorod-reduced graphene oxide nanocomposites towards supercapacitors. RSC Adv. 2020, 10, 17543–17551. [Google Scholar] [CrossRef] [PubMed]
  26. Majumder, M.; Choudhary, R.B.; Thakur, A.K.; Kumar, U. Augmented gravimetric and volumetric capacitive performance of rare earth metal oxide (Eu2O3) incorporated polypyrrole for supercapacitor applications. J. Electroanal. Chem. 2017, 804, 42–52. [Google Scholar] [CrossRef]
  27. Tian, Y.; Zhu, X.; Abbas, M.; Tague, D.W.; Wunch, M.A.; Ferraris, J.P.; Balkus, K.J. Magnesium hydroxide templated hierarchical porous carbon nanosheets as electrodes for high-energy-density supercapacitors. ACS Appl. Energy Mater. 2022, 5, 6805–6813. [Google Scholar] [CrossRef]
  28. Brown, A.T.; Lin, J.; Vizuet, J.P.; Thomas, M.C.; Balkus, K.J. Graphene-like carbon from calcium hydroxide. ACS Omega 2021, 6, 31066–31076. [Google Scholar] [CrossRef]
  29. Kim, K.; Lee, T.; Kwon, Y.; Seo, Y.; Song, J.; Park, J.K.; Lee, H.; Park, J.Y.; Ihee, H.; Cho, S.J. Lanthanum-catalysed synthesis of microporous 3D graphene-like carbons in a zeolite template. Nature 2016, 535, 131–135. [Google Scholar] [CrossRef]
  30. Brown, A.T.; Agrawal, V.S.; Wunch, M.A.; Lin, J.; Thomas, M.C.; Ferraris, J.P.; Chabal, Y.J.; Balkus, K.J., Jr. Yttrium oxide-catalyzed formation of electrically conductive carbon for supercapacitors. ACS Appl. Energy Mater. 2021, 4, 12499–12507. [Google Scholar] [CrossRef]
  31. Abbas, M.; Haque, S.F.B.; Tian, Y.; Ferraris, J.P.; Balkus, K.J., Jr. Organic–Inorganic Nanohybrids in Supercapacitors. In Hybrid Nanomaterials: Biomedical, Environmental and Energy Applications; Springer: Berlin/Heidelberg, Germany, 2022; pp. 359–383. [Google Scholar]
  32. Yan, T.; Zhang, D.; Shi, L.; Li, H. Facile synthesis, characterization, formation mechanism and photoluminescence property of Eu2O3 nanorods. J. Alloys Compd. 2009, 487, 483–488. [Google Scholar] [CrossRef]
  33. Miller, J.R.; Simon, P. Electrochemical capacitors for energy management. Science 2008, 321, 651–652. [Google Scholar] [CrossRef] [PubMed]
  34. Brown, B.; Swain, B.; Hiltwine, J.; Brooks, D.B.; Zhou, Z. Carbon nanosheet buckypaper: A graphene-carbon nanotube hybrid material for enhanced supercapacitor performance. J. Power Sources 2014, 272, 979–986. [Google Scholar] [CrossRef]
  35. Tran, C.; Lawrence, D.; Richey, F.W.; Dillard, C.; Elabd, Y.A.; Kalra, V. Binder-free three-dimensional high energy density electrodes for ionic-liquid supercapacitors. Chem. Commun. 2015, 51, 13760–13763. [Google Scholar] [CrossRef]
  36. Puziy, A.M.; Poddubnaya, O.I.; Gawdzik, B.; Sobiesiak, M. Comparison of heterogeneous pore models QSDFT and 2D-NLDFT and computer programs ASiQwin and SAIEUS for calculation of pore size distribution. Adsorption 2016, 22, 459–464. [Google Scholar] [CrossRef]
  37. Kang, J.-G.; Jung, Y.; Min, B.-K.; Sohn, Y. Full characterization of Eu(OH)3 and Eu2O3 nanorods. Appl. Surf. Sci. 2014, 314, 158–165. [Google Scholar] [CrossRef]
  38. Pol, V.G.; Palchik, O.; Gedanken, A.; Felner, I. Synthesis of europium oxide nanorods by ultrasound irradiation. J. Phys. Chem. B 2002, 106, 9737–9743. [Google Scholar] [CrossRef]
  39. Sing, K.S.; Williams, R.T. Physisorption hysteresis loops and the characterization of nanoporous materials. Adsorpt. Sci. Technol. 2004, 22, 773–782. [Google Scholar] [CrossRef]
  40. Tian, Y.; Zhu, X.; Abbas, M.; Tague, D.W.; Ferraris, J.P.; Balkus, K.J., Jr. Two-dimensional hexagonal-shaped mesoporous carbon sheets for supercapacitors. ACS Omega 2022, 7, 27896–27902. [Google Scholar] [CrossRef]
  41. Thommes, M.; Kaneko, K.; Neimark, A.V.; Olivier, J.P.; Rodriguez-Reinoso, F.; Rouquerol, J.; Sing, K.S. Physisorption of gases, with special reference to the evaluation of surface area and pore size distribution (IUPAC Technical Report). Pure Appl. Chem. 2015, 87, 1051–1069. [Google Scholar] [CrossRef]
  42. Yang, Q.-H.; Cheng, H.-M. Carbon nanotubes: Surface, porosity, and related applications. In Carbon Nanotechnology; Elsevier: Amsterdam, The Netherlands, 2006; pp. 323–359. [Google Scholar]
  43. Wang, Z.; Perera, W.A.; Perananthan, S.; Ferraris, J.P.; Balkus, K.J., Jr. Lanthanum hydroxide nanorod-templated graphitic hollow carbon nanorods for supercapacitors. ACS Omega 2018, 3, 13913–13918. [Google Scholar] [CrossRef] [PubMed]
  44. Hausbrand, R.; Jaegermann, W. Reaction Layer Formation and Charge Transfer at Li-Ion Cathode—Electrolyte Interfaces: Concepts and Results Obtained by a Surface Science Approach; Elsevier: Amsterdam, The Netherlands, 2018. [Google Scholar]
  45. Dilawar, N.; Mehrotra, S.; Varandani, D.; Kumaraswamy, B.V.; Haldar, S.K.; Bandyopadhyay, A.K. A Raman spectroscopic study of C-type rare earth sesquioxides. Mater. Charact. 2008, 59, 462–467. [Google Scholar] [CrossRef]
  46. Kumar, S.; Prakash, R.; Choudhary, R.J.; Phase, D.M. Structural, XPS and magnetic studies of pulsed laser deposited Fe doped Eu2O3 thin film. Mater. Res. Bull. 2015, 70, 392–396. [Google Scholar] [CrossRef]
  47. Estrade-Szwarckopf, H. XPS photoemission in carbonaceous materials: A “defect” peak beside the graphitic asymmetric peak. Carbon 2004, 42, 1713–1721. [Google Scholar] [CrossRef]
  48. Kundu, S.; Wang, Y.; Xia, W.; Muhler, M. Thermal stability and reducibility of oxygen-containing functional groups on multiwalled carbon nanotube surfaces: A quantitative high-resolution XPS and TPD/TPR study. J. Phys. Chem. C 2008, 112, 16869–16878. [Google Scholar] [CrossRef]
  49. Everitt, G.F. Transition-Metal Complexes of Tetracyanoethylene. Ph.D. Thesis, Louisiana State University and Agricultural & Mechanical College, Baton Rouge, Louisiana, 1971. [Google Scholar]
  50. Miller, J.S. Tetracyanoethylene (TCNE): The characteristic geometries and vibrational absorptions of its numerous structures. Angew. Chem. Int. Ed. 2006, 45, 2508–2525. [Google Scholar] [CrossRef]
  51. Han, L.; Xu, Z.; Wu, J.; Guo, X.; Zhu, H.; Cui, H. Controllable preparation of graphene/MnO2/Co3O4 for supercapacitors. J. Alloys Compd. 2017, 729, 1183–1189. [Google Scholar] [CrossRef]
  52. R, R.; Thejas Prasannakumar, A.; V, M.; Varma, S.J. V2O5/MnO2 Nanostructured Electrodes for High-Energy-Density Supercapacitors. ACS Appl. Nano Mater. 2025, 8, 13861–13875. [Google Scholar] [CrossRef]
  53. Vigneshwaran, J.; Abraham, S.; Muniyandi, B.; Prasankumar, T.; Li, J.-T.; Jose, S. Fe2O3 decorated graphene oxide/polypyrrole matrix for high energy density flexible supercapacitor. Surf. Interfaces 2021, 27, 101572. [Google Scholar] [CrossRef]
  54. Moghaddam, M.R.; Ganjali, M.R.; Hosseini, M.; Faridbod, F. A novel electrochemiluminescnece sensor based on an Ru(bpy)32+-Eu2O3-nafion nanocomposite and its application in the detection of diphenhydramine. Int. J. Electrochem. Sci. 2017, 12, 5220–5232. [Google Scholar] [CrossRef]
  55. Regueiro-Figueroa, M.; Barriada, J.L.; Pallier, A.; Esteban-Gomez, D.; de Blas, A.; Rodríguez-Blas, T.; Toth, E.; Platas-Iglesias, C. Stabilizing divalent europium in aqueous solution using size-discrimination and electrostatic effects. Inorg. Chem. 2015, 54, 4940–4952. [Google Scholar] [CrossRef]
  56. Burnett, M.E.; Adebesin, B.; Funk, A.M.; Kovacs, Z.; Sherry, A.D.; Ekanger, L.A.; Allen, M.J.; Green, K.N.; Ratnakar, S.J. Electrochemical investigation of the Eu3+/2+ redox couple in complexes with variable numbers of glycinamide and acetate pendant arms. Eur. J. Inorg. Chem. 2017, 2017, 5001–5005. [Google Scholar] [CrossRef]
  57. Mei, B.-A.; Lau, J.; Lin, T.; Tolbert, S.H.; Dunn, B.S.; Pilon, L. Physical interpretations of electrochemical impedance spectroscopy of redox active electrodes for electrical energy storage. J. Phys. Chem. C 2018, 122, 24499–24511. [Google Scholar] [CrossRef]
  58. Miller, J.R.; Outlaw, R.A.; Holloway, B.C. Graphene double-layer capacitor with ac line-filtering performance. Science 2010, 329, 1637–1639. [Google Scholar] [CrossRef]
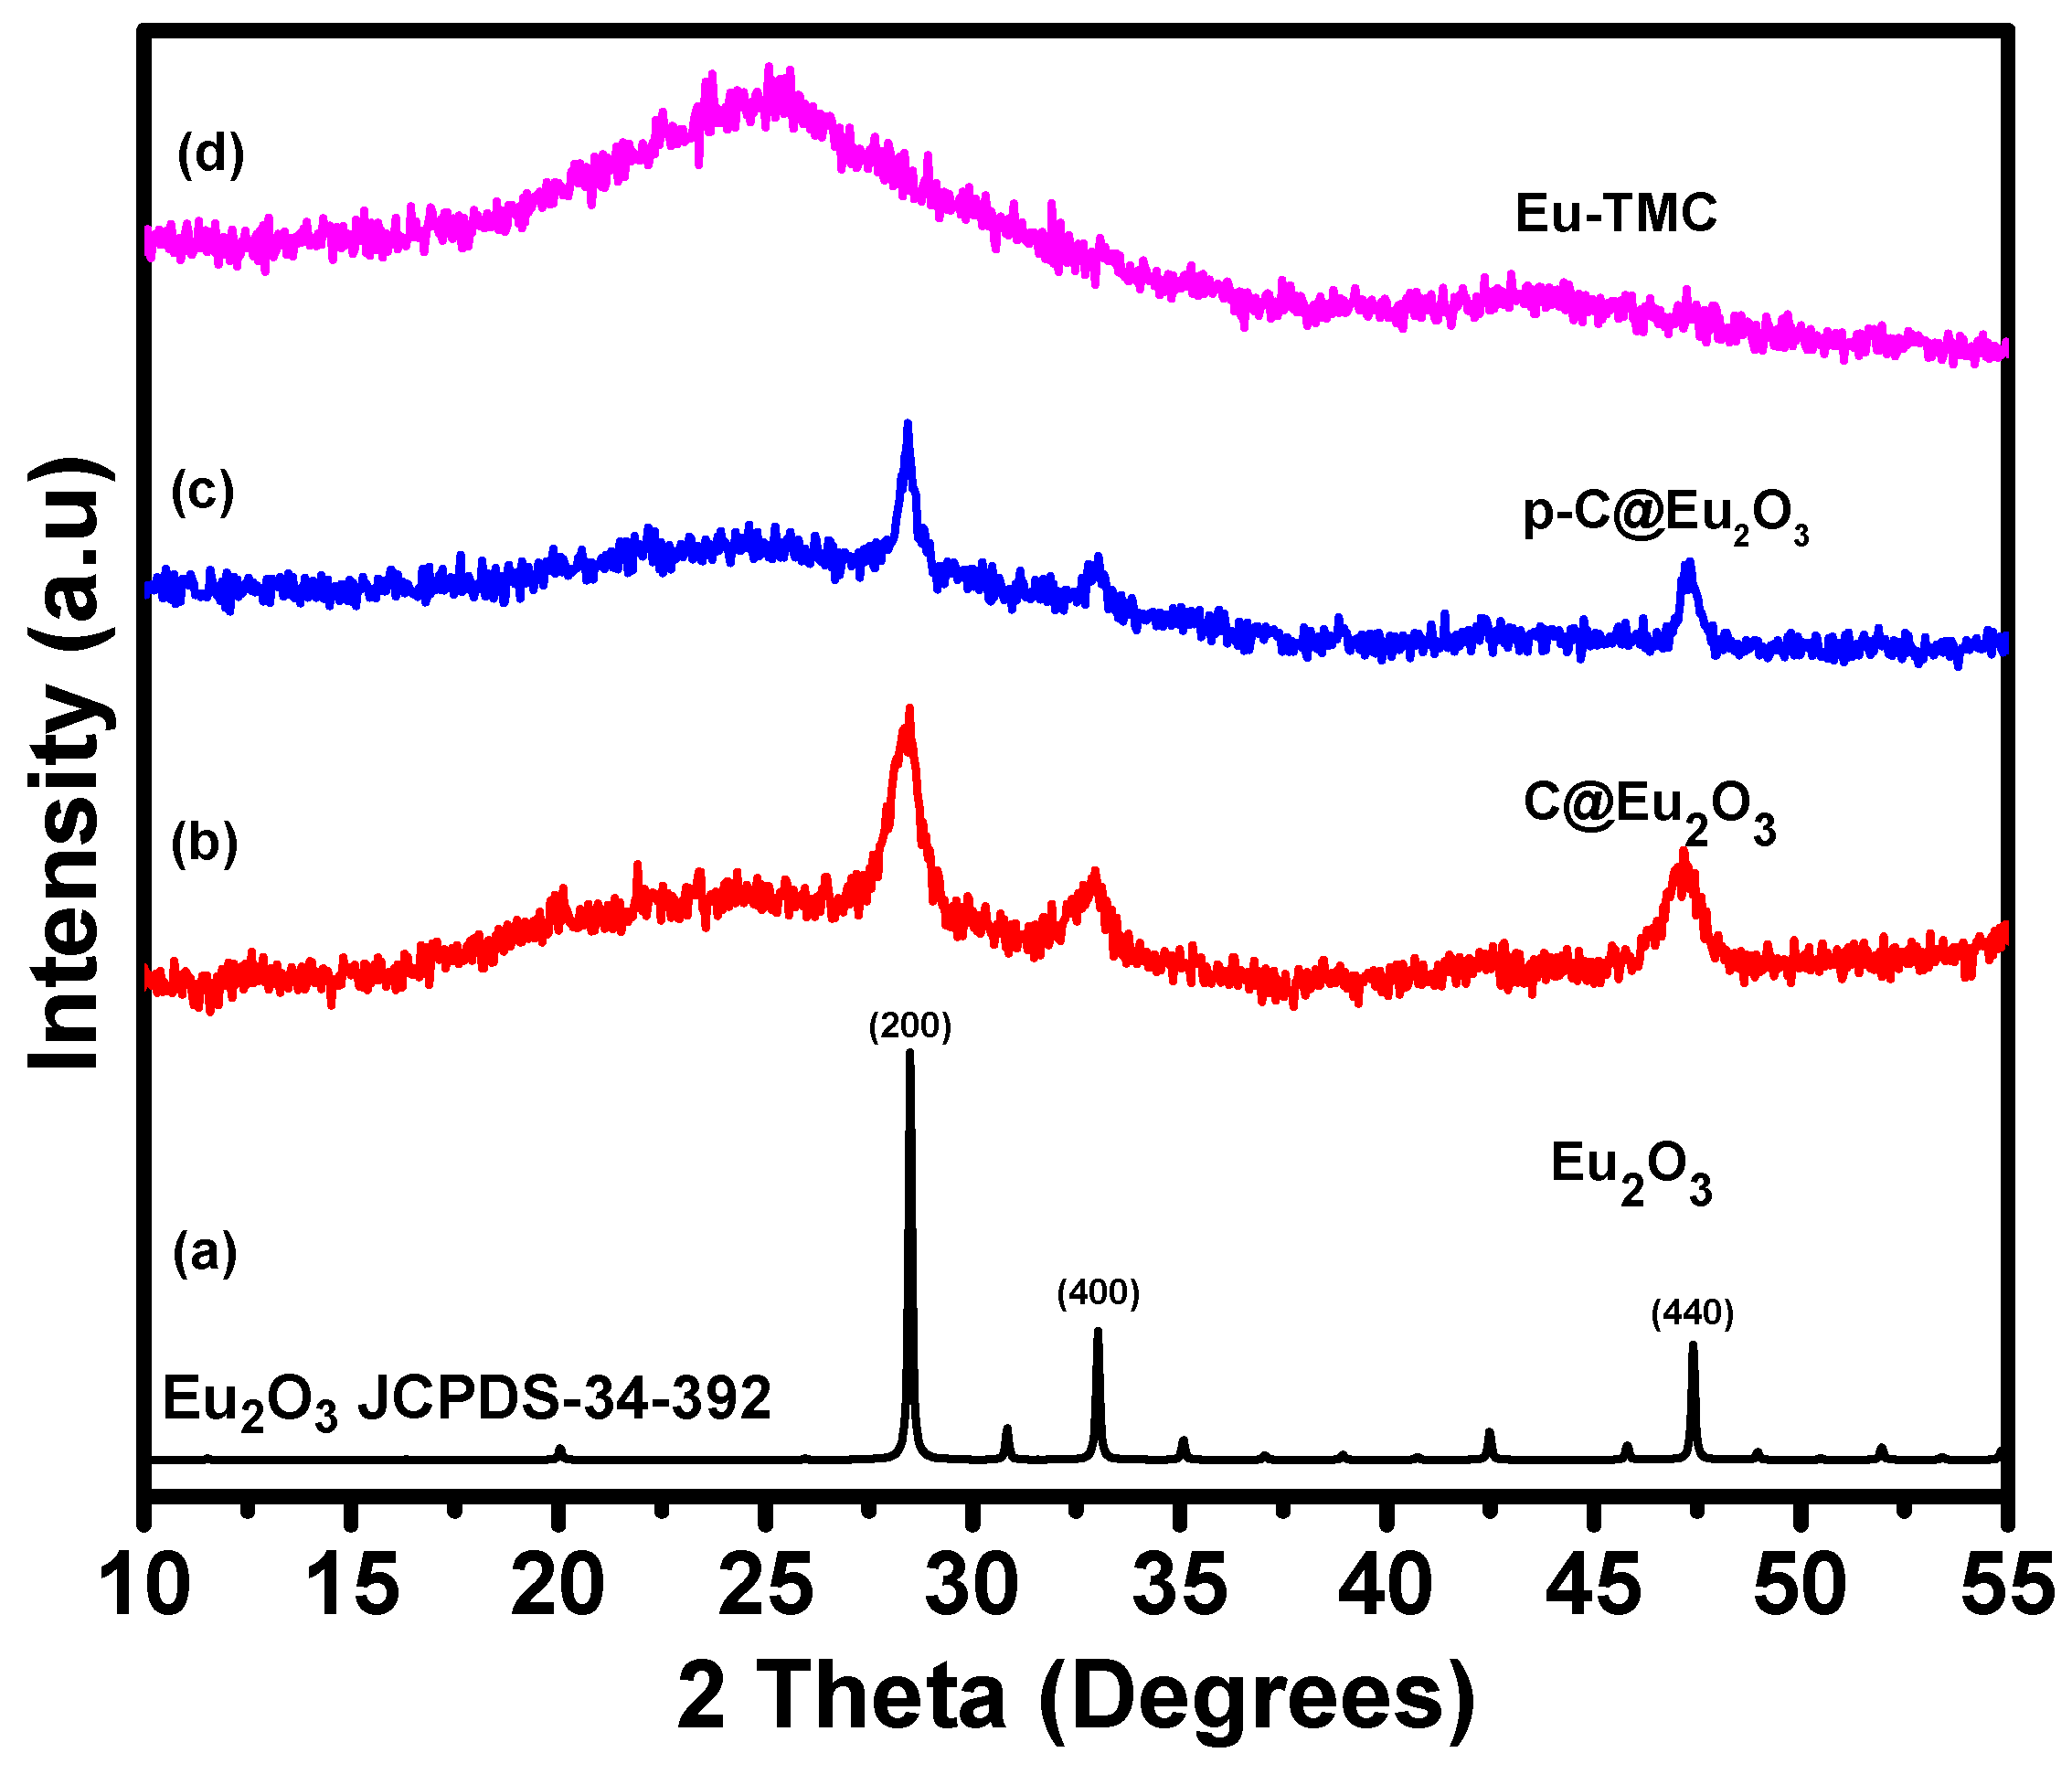
Figure 1. An overlay of XRD patterns for Eu2O3 NRs (a), C@Eu2O3 (b), p-C@Eu2O3 (c), and Eu-TMC (d).
Batteries 11 00355 g001
Figure 2. High resolution TEM of pristine Eu2O3 NRs (a), C@Eu2O3 (bd), p-C@Eu2O3 (e,f), and Eu-TMC (g,h).
Batteries 11 00355 g002
Figure 3. Isotherms (a) and pore size distributions (b) of the p–C@Eu2O3 (red) and Eu–TMC (black). Deconvoluted Raman spectrum of Eu–TMC (c) and Raman spectra of Eu2O3, C@ Eu2O3, and physical mixture (d).
Batteries 11 00355 g003
Figure 4. High-resolution Eu 4d XPS spectra of Eu2O3 (a), Eu2O3 and carbon physical mixture (b), C@ Eu2O3 (c), and p-C@ Eu2O3 (d).
Batteries 11 00355 g004
Figure 5. Deconvoluted XPS C1s spectrum of the Eu-TMC.
Batteries 11 00355 g005
Figure 6. FT–IR spectra of TCNE, TCNE on Eu2O3, TCNE on carbon nanorods, and TCNE on 19% Eu2O3 in carbon nanorods.
Batteries 11 00355 g006
Figure 7. CV (a) and CDC (b) of p-C@ Eu2O3 in carbon nanorods and CV (c) and CDC (d) of Eu–TMC in 1 M LiTFSI/PC, showing redox peaks from Eu3+/Eu2+ couple for p–C@Eu2O3 and ideal EDLC behavior for Eu–TMC.
Batteries 11 00355 g007
Figure 8. (a)Ragone plot of p-C @ Eu2O3 and Eu-TMC (comparison with other reported electrode material). (b) Nyquist plots of p-C@ Eu2O3 and Eu-TMC. (c) A plot of Qs and QD contributions of p-C@Eu2O3. (d) A bar graph comparison of charge storage contributions from EDLC and pseudocapacitance for p-C@Eu2O3 (a) and Eu-TMC (b) at 10 mv/s.
Batteries 11 00355 g008
Table 1. Performance comparison of p-C@Eu2O3 with reported electrode material.
Electrode MaterialCapacitanceEnergy DensityReference
Eu2O3@rGO composite403 F/g35.8 Wh/kg[25]
MgO-templated carbon nanosheets~280 F/g70 Wh/kg[27]
G/Co3O4/MnO2502.3 F/g-[51]
V2O5/MnO2394.5 F/g82 Wh/Kg[52]
Fe2O3-GO/polypyrrole442 F/g61.3 Wh/kg[53]
La2O3-templated porous carbon~220 F/g~50 Wh/kg[29]
Y2O3-templated graphitic carbon~240 F/g55 Wh/kg[30]
This work: p-C@Eu2O3501.2 F/g108 Wh/kgThis work
Disclaimer/Publisher’s Note: The statements, opinions and data contained in all publications are solely those of the individual author(s) and contributor(s) and not of MDPI and/or the editor(s). MDPI and/or the editor(s) disclaim responsibility for any injury to people or property resulting from any ideas, methods, instructions or products referred to in the content.