Abstract
Lithium iron phosphate (LFP) batteries have become a popular choice for energy storage, electrified mobility, and plants. All lithium-based batteries produce flammable vent gas as a result of failure through thermal runaway. LFP cells produce less gas by volume than nickel-based cells, but the composition of this gas most often contains less carbon dioxide and more hydrogen. However, when LFP cells fail, they generate lower temperatures, so the vent gas is rarely ignited. Therefore, the hazard presented by a LFP cell in thermal runaway is less of a direct battery fire hazard but more of a flammable gas source hazard. This research identified the constituents and components of the vent gas for different sized LFP prismatic cells when overcharged to failure. This data was used to calculate the maximum homogenous concentration of gas that would be released into a 1.73 m3 test rig and the percentage of the lower explosive limit (LEL). Overcharge experiments were conducted using the same type of cells in the test rig in the presence of remote ignition sources. Ignition and deflagration of the vent gas were possible at concentrations below the theoretical LEL of the vent gas if it was homogeneously mixed.
1. Introduction
Batteries are seen as a critical enabler for the drive toward achieving net zero [1]. Nickel-based lithium-ion batteries (LIBs) have traditionally been the battery of choice due to their ability to achieve high energy densities, whereas other technologies, such as lithium iron phosphate (LFP) batteries, have been neglected due to their lower energy densities and voltage output. However, despite the lower energy density of LFP cells, they have environmental and economic advantages over nickel-based LIBs, as they do not rely on metals such as cobalt [2]. Due to the lower costs for LFP components, longer cell lifetime, and global supply levels, these cells are currently the cell of choice for many applications and most battery energy storage systems (BESSs), whether on a grid scale, commercial, domestic, or portable scale. One of the current battery energy storage applications is the replacement of diesel generators currently used as back-ups for process plants, or to supply heavy plants, equipment, or machinery with high electrical load demands. They are an attractive alternative to diesel generators as they do not produce exhaust emissions and are advertised as being low maintenance, due to their not having moving parts. Many major car manufacturers are selling, or planning to sell, electric vehicles with power trains supplied by LFP battery packs. They are also being used in all forms of electrical mobility used by industries, from delivery vehicles to heavy plants [3,4,5].
When battery cells are exposed to abnormal or abusive conditions, such as overcharge or overheating, the separator between the anode and cathode can become damaged, leading to internal short circuits; this can lead to a process of self-heating and escalating separator damage known as thermal runaway. If thermal runaway continues, the heat within the cell vaporises the electrolyte and causes chemical reactions that evolve gases, leading to a pressure build up. This can cause swelling in pouch cells or the activation of built-in safety vents in cylindrical and prismatic cells. If thermal runaway continues, rapid failure of the cell will occur, and significant quantities of gas and vapour will be released over a short duration. High energy density nickel-based cells can fail violently at this point, leading to the failure of cell containment [6]. The final rapid failure in these cells can lead to very high temperatures. The cell contents can be ejected along with flammable gases, which can burn rapidly and resemble a deflagration [7].
LFP cells are also considered safer; Bugryniec et al. (2019) [8] state that “LFP cells present no explosion risk”. This is because, by contrast, when LFP cells fail, they generate lower internal temperatures that are usually below the autoignition temperatures of any released flammable gases; therefore, they do not tent to explosively disassemble in the way nickel-based cells can. It is also uncommon, but not unheard of, for LFP cells to fail with flames during abuse testing. Many researchers need to introduce an external ignition source above the cell to observe the combustion phenomena of the venting gases from LFP cells during failure [9,10,11]. The lower failure temperatures of LFP cells mean that thermal runaway propagation from cell to cell due to secondary heating is less likely. However, it is not impossible; Huang et al. (2021) [12] investigated the possibility, and propagation was successful in one of three experiments. Some fatal accidents which have occurred due to the cascade failure of LFP energy storage systems have been discussed in the literature [12,13].
The fact that LFP cells do produce flammable gas and do not tend to self-ignite may mean they present a hazard due to the potential formation of an explosive atmosphere, a subsequent ignition of which could result in a flash fire or deflagration. When presented with a flammable gas or vapour hazard, it is important to understand the constituency, flammability, and dispersion characteristics of the substance or mixture of substances to help implement control measures. During processes that produce flammable substances, two avenues are generally used to reduce the chance of an explosive atmosphere forming and persisting, namely, choosing to operate either above or below the flammable range [14]. To ensure a system is above the flammable range, the level of oxygen needs to be reduced, either by adding an inert gas, reducing the empty volume, or by ensuring the vapours of the flammable substance sufficiently fill the volume, resulting in too little oxygen to sustain combustion. The issue with being above the flammable range is that, if levels of the flammable gas decrease or oxygen increases, you can cross into the flammable range. If possible, maintaining the concentration below the flammable limit and ensuring that the flammable boundary is not crossed may be a better solution [15]; this can be achieved by controlling inventory and vaporisation or release rates, controlling ventilation, and having a sufficient volume for the gas. However, monitoring is required to warn of any high concentration formation. A recognised conservative value for high alarms is 25% of the substance’s lower explosive limit (LEL) [16]. However, an issue with this methodology is that it assumes gases will be homogenously dispersed within a volume or, where higher concentrations can occur in localised regions, the concentrations are still detected at 25% of the LEL.
The consequences of the flammable gases from a failed cell module or pack depend on knowing the quantity, composition, and release rate of the battery vent gas. However, there is so much variation in research for LFP cells; taking just one flammable component, hydrogen (H2), the vent gas concentrations stated in the literature range from 18% to 60% by volume [10,17,18,19,20,21,22,23,24,25,26,27,28,29,30,31,32,33,34,35]. There are several potential reasons for the variation, such as different collection, measurement, and analysis techniques and a variation in format. Most researchers use a pressure vessel to measure the quantity of gas realised by a failed cell. However, Xie and Zhang (2025) [33] used a thermal mass flow meter and recorded volumes of 1339.1 litres when overheating a 280 Ah cell at a 100% state of charge. By comparison, Wang et al. (2023) [10] measured 163 litres from a cell of the same capacity using a pressure vessel and the same abuse method. There are a variety of different analysis techniques available to measure gas concentrations, such as mass spectrometry (MS), gas chromatography–mass spectrometry (GC-MS), Fourier transform infrared spectroscopy (FTIR), or other equipment specifically designed for gas analysis.
Another reason for variations in results is the variations in cells available; much of the previous research has been on small cylindrical cells with lower energy densities than current large format prismatic offerings; cylindrical cells are typically 2–5 Ah, whereas there are currently prismatic cells on the open market with a capacity above 300 Ah; larger cells are being forecast. Research shows that prismatic cells produce more gas to equivalent mass and capacity than cylindrical cells, and the ratio of H2 in prismatic cell vent gas is much higher than for cylindrical cells [17,19]. This research shows that prismatic LFP cells produce less gas per mass and unit of energy capacity than nickel-based LIBs, but they have the potential to produce a higher ratio of H2 and a lower ratio of carbon dioxide (CO2) [20,22,30,36].
The variation in stated flammable gas ratios in the literature leads to a variation in calculated LEL values. There are several methods of LEL calculation, with Le Chatelier’s formula for fractional calculation of LEL being the most common [17]. This method appears to have been scientifically validated for battery vent gas; Chen et al. (2020) [37] reported an error of less than 5% when calculated values using Le Chatelier’s formula were compared to the results of experiments with collected battery vent gas. State of charge (SoC) and abuse method will affect generated gas quantities and components due to breaking down of the cell at different chemical states. Values for calculated LEL found in the literature range from 5.6 to 36% by volume [17,18,37,38,39,40,41]. In the face of such variations, choosing the most conservative value is sensible: the SoC and abuse method that gives the lowest LEL value. The major components of the battery vent gas, H2 and carbon monoxide (CO), have a very wide flammable range, and the combination leads to a higher LEL than just H2 alone. However, long-chain hydrocarbons tend to have a narrow flammable range but have a lower LEL value; for example, propane (C3H8) has an LEL of 2.1%, and small fractions of these gases will result in a lower overall LEL [42]. If long-chain hydrocarbons are not detected by analysis, the calculated LEL will be higher than reality.
Another consideration is that the permanent gas component of the vapours from a venting LFP cell is not the only flammable component. A dense white smoke is produced during venting; Yang et al. (2023) [34] inferred that a major component of this smoke is vapourised electrolyte. A common and most volatile component of the electrolyte, dimethyl carbonate (DMC), was found in experiments to have a similar laminar burning velocity to some of the vent gases and had an LEL of 4.2% [19,43]. Wang et al. (2024) [31] state that ethyl methyl carbonate (EMC) is the predominate component of the vapour produced by failing LFP cells, stating its LEL as 2.85%. Knowing how much electrolyte vapour is released and remains airborne when an ignition source is present is difficult. Experiments to determine gas quantities that involve a pressure vessel rely on the temperature inside the vessel stabilising to determine the volumetric pressure rise; in this case, the electrolyte will likely have condensed due to its higher boiling point. Shen et al. (2023) [30] documented electrolyte residue on the bottom of the pressure vessel. Yang et al. (2023) [34] imaged the smoke clearing inside the pressure vessel as the electrolyte vapour cooled and condensed.
LEL calculations assume a homogenous mixture; when a battery vents, the pressure inside the cell forces the gas through the safety vent. Jia et al. (2024) [21] measured gas velocities of up to 83 m/s, with a 10% degree of uncertainty. Jets of gas will entrain air via turbulence, leading to regions of flammable concentrations around the jet and anything it impinges upon. The gas is potentially at a higher temperature than the surrounding environment and the significant components are buoyant; this leads to the possibility of stratification. Jet releases of hydrogen in confined spaces can stratify and form a layer of stoichiometric concentrations [44]. LFP vent gas is not pure hydrogen; however, stratification of the vent gas cannot be discounted. Zhang et al. (2024) [35] modelled dispersion from 105 Ah LFP prismatic cells in a simulated BESS and demonstrated the stratified accumulation of the vent gas.
Most experiments that investigate the ignitability and combustion dynamics of battery vent gases rely on data from the literature, or researchers conduct gas analysis experiments and then produce a clean synthetic gas that replicates the analysis results. This paper aims to investigate the potential for ignition of LFP battery vent gases when the flammable dry gas concentrations are theoretically below the LEL, using gas vented directly from overcharged LFP prismatic cells. The paper aims to address if the dispersion, accumulation, and flammability characteristics of LFP vent gases are worthy of further detailed investigation.
2. Methods
Two experimental programs were completed. The first was to determine the volumes and concentrations of the gaseous component of vent release from a cell failure; this work has been reported by Howard et al. (2025) [20]. The second set was to determine if the vented releases directly from a battery could be ignited in a cube-shaped rig of a set volume, both during the venting process and after the venting process has subsided; this is the focus of this paper.
2.1. Battery Samples
Commercially available LFP prismatic cells from the same manufacturer were purchased; Table 1 details the four types used in the experiments. The cells were cycled three times before being charged to 75%, ready for the overcharge experiments.

Table 1.
Details of the LFP battery samples used in the experiments.
2.2. Gas Volume and Composition Determination
To measure the released gas volumes and contain the gases for collection and analysis, a 47-litre pressure vessel was used. A detailed description of the method for measuring and calculating gas volumes using the ideal gas law, including details of gas collection and mass spectrometry, has been previously published by Abbott et al. (2022) [22], Reeve et al. (2025) [45], and Howard et al. (2025) [36]. This work was undertaken and reported by Howard et al. (2025) [20]; the results from the experiments that recorded the highest volume of gas released were taken as the results for the purposes of this study.
2.3. Cell Abuse Method
Different methods of abuse were trialled inside the vessel by Howard et al. (2025) [20]: overheating by application of an external heater, nail penetration, and overcharging. Nail penetration was found not to induce thermal runaway, and overcharging was found to produce larger quantities of gas than external heating. Therefore, overcharging from a 75% SoC starting point was selected as the method for this research. Due to the current capacity of the vessel’s electrical passthrough connections, the charge rate for cells A, B, and C was 0.5C and for cell type D was 0.25C. For all the overcharge experiments, a direct current (DC) power supply was used on constant current mode to supply the current to the cell at the required current until failure. For the pressure vessel experiments, this was a 30 VDC power supply, and for all experiments in the cube rig a 60 VDC power supply was used.
2.4. Ignition Experiments
A cube frame rig was constructed using a 50 mm mild steel angle measuring 1.2 m in each direction (Figure 1). The floor was constructed of 3 mm mild steel plate; the front was constructed using 5 mm clear polycarbonate bolted to the frame. The sides were constructed using a 6 mm Promat SuperluxTM fireboard (Promat GmbH, Maintal, Germany) bolted to the frame on one side, the top, and the back. The remaining side was used to provide a vent area for pressure relief. This was achieved by two methods: either by using fireboard connected with a hinge and held in place by two pieces of foil tape or by using polythene sheeting. The rig with the sides had a nominal volume of 1.728 m3. The rig had an inlet and outlet valve to allow purging of the rig post-test. The edges of the rig were taped, but the rig was not designed to be gastight. LED strip lights were installed in the rig’s base to illuminate any vent vapours or smoke. The rig was situated in a purpose-built battery abuse testing chamber fitted with a multi-bed filtered extraction system. The chamber has pressure relief panels designed to fail at around 2 kPa. All experiments were controlled remotely from a control room situated 60 m away (Figure 2).
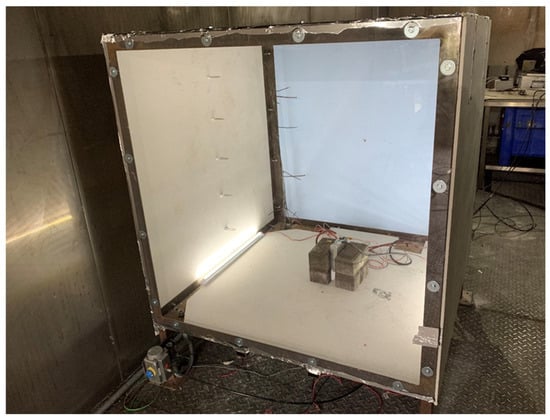
Figure 1.
Cube rig used for ignition experiments with cell present for testing.
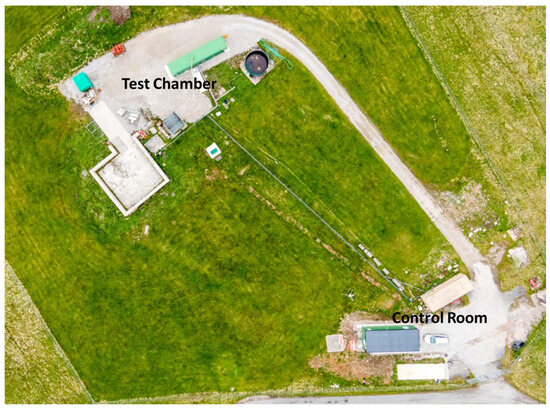
Figure 2.
Aerial photo of the test area for the ignition experiments.
The rig was equipped with a Kulite 30 psia (206.8 kPa) fast response pressure transducer in the centre of the back wall. There were five spark ignitor electrodes positioned at 0.2 m from the floor and every 0.2 m up to 1 m from the floor in the centre of the side wall facing the hinged panel; these were supplied with gas burner 1.5 VDC spark generators producing sparks at a rate of around 2–4 Hz across a nominal 3 mm gap. The ends of the electrodes were positioned so they were around 0.5 m laterally from the cell positioned on the base of the rig. A tree of five 3 mm K-type thermocouples with a grounded tip swaged to 0.5 mm diameter was present, with the tips facing diagonally 0.25 m from the back corner; the first was at ceiling height and the rest at 0.25 m intervals (Figure 3). High-speed pressure data was recorded on a manually triggered Graphtec Corporation, Yokohama, Japan, GL980 datalogger at a sample rate of 50 kHz. Temperature, high-speed data trigger, and voltage data were recorded using a National Instruments, Austin, TX, USA CompactDAQ datalogger at a rate of 1 Hz. Tests were recorded with a Phantom, Wrexham, UK, Miro C210 high-speed video camera at 1000 frames per second and standard HD cameras at several angles. The cell was placed in the centre of the rig on a fireboard base; house bricks were used to hold the cell in an upright position without adding constriction to the cell, and an exposed tip K-type thermocouple was taped to the centre of one of the cell’s largest sides with Kapton tape. The overcharge cables were attached via ring crimps to the cell terminals with the supplied nuts or bolts, depending on the gender of the terminals. A power supply was set to provide a current equivalent 0.5C charge rate at a maximum voltage of 60 VDC, and a contactor was used on the positive circuit to provide a method of remote control of the experiment.
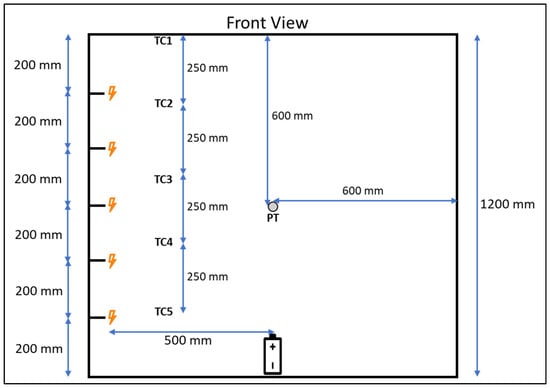
Figure 3.
Front view diagram of instrument and spark ignitor locations in enclosure used for experiments.
Initially, the ignition source was initiated after the onset of significant cell venting, when vapour or smoke had visibly obscured the cell from view, usually within a minute. If there was no ignition, the spark continued throughout the venting process. If an ignition occurred with a cell type, repeat experiments were carried out with a delay to the initiation of the ignition source. In these experiments, the ignitor was not initiated until a period of sustained cell cooling, when most of the gas had likely been vented.
3. Results and Discussion
3.1. Gas Analysis
The gas analysis results for the overcharge tests, as detailed by Howard et al. (2025) [20], are detailed in Table 2. Note that the cell designation was changed to simplify the reporting of data; in Howard et al. (2025) [20], Cell E designation is Cell A in this paper, Cell G is Cell B, Cell I is Cell C, and Cell J is now Cell D.

Table 2.
Results of the gas analysis, giving the volumetric percentages of the components.
The results that recorded the highest volumes of gas were selected, as they provide a worst-case scenario for flammable gas accumulation; these results were used to calculate the theoretical LEL. When sampled, the gas bags contained clear gas and no vapour; therefore, the fraction sampled was the dry gaseous component. As noticed by other researchers using a pressure vessel gas measurement method, a residue was present at the bottom of the vessel [30]. Samples of the residue were collected for FTIR analysis. The samples were not analysed immediately; however, analysis confirmed they were a mixture of carbonate compounds, which is consistent with the common components of LFP electrolytes.
3.2. LEL Calculation of Vent Gases
The theoretical LEL for each cell was calculated using a fractional method derived from the Le Chatallier formula (Equation (1)), and the LEL values were determined by Zabetakis (1964) [42], with the assumption the mixture was homogenous.
where
LELmix = LEL of gaseous mixture;
LELi = LEL of one component in the gaseous mixture;
xi = mole fraction, but, as ideal gas is assumed, the volume fraction of one component in the gaseous mixture;
n = number of the components.
The theoretical LEL and the volume data from the pressure vessel tests [20] were used to calculate the maximum proportion of LEL that could be in the cubic test rig after the thermal runaway of the cell induced via overcharge, if the mixture was homogenous. The cubic rig is taped but not fully gastight, and the assumption was made that the vented gas would displace air, and that there would also be a proportional loss of gas as a result of the displacement. The results are displayed in Table 3. The figures given are the maximum possible and are highly theoretical, as it is unknown how much gas continues to vent during cooling after the attempted ignition. However, they give a reasonably conservative figure, and it can be assumed that the proportion of flammable gas present in the rig at the attempted ignition is lower than the calculated maximum.

Table 3.
Calculated LEL and theoretical maximum proportion possible in the cubic rig.
Cell C has a lower LEL due to higher levels of C3H8 and propene (C3H6), which are found in the vent gas. The released CO2 was accounted for in the volume of gas released into the cube to calculate the displacement of air, but the diluent effect was not taken into account when calculating the LEL, as this gave a more conservative value. The highest volume of CO2 released is around 13.2 L into a volume of 1728 L. In this instance, the flammability limit of the gas will be close to the calculated value if the CO2 was not present [46].
3.3. Overview of Ignition Experiment Results
These experiments were carried out with the same type of cells used for the gas analysis experiments [20], overcharging the cells in a 1.2 m cube rig with air present and spark ignitors at intervals on the side wall of the rig. The aim was to determine if remote ignition of the vent gases was possible. The results of positive or negative ignition are detailed in Table 4. All experiments with 105 Ah D cells resulted in an ignition at the time of the initiation of the spark ignitors. As no ignition occurred in the 50 Ah C cells and 32 Ah B cells, it was decided not to proceed with the 22 Ah A cells. The ignition sources are highly localised and situated at a distance remote to the cell (approximately 0.5 m with this set-up); no flammable gas concentrations reached the ignition sources for cell types B and C.

Table 4.
Results of ignition experiments.
The typical cell voltage and temperature over time trace for the experiments is detailed in Figure 4. In all experiments, the cell temperature remains stable during normal charging, rising as expected for normal use. Once the overcharging stage has commenced, the temperature rise increases with the cell voltage until the safety vent opens and a limited amount of gas is released; this leads to a slight drop in temperature and a gradual decrease in voltage. The temperature then gradually increases until the cell fails; at this point, the voltage and temperature spike significantly. Note that, in these experiments, the limit of the data logging card was 10 VDC, so the maximum voltage recorded is the maximum of the card, not the cell voltage. However, Kang et al. (2024) [24] saw much higher voltages between 34 V and 59 V, and they explained that this behaviour was due to separator shrinkage and collapse. With cell failure, as the temperature spikes, significant venting starts. Figure 5 shows the cell voltage and temperature over time for the thermal runaway and venting; also marked are the typical points for initiating the ignition sources for the two types of experiments.
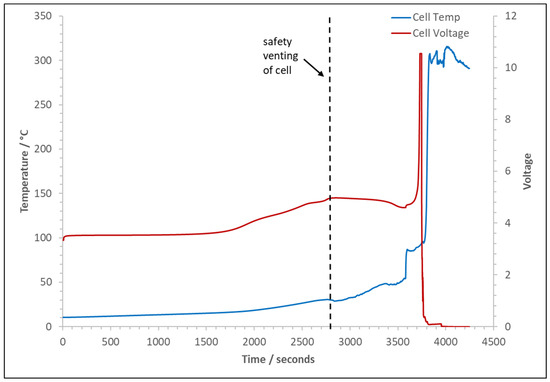
Figure 4.
Typical trace of cell voltage and temperature over time for the experiments.
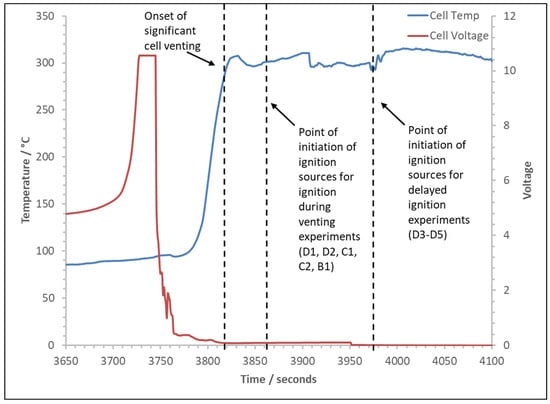
Figure 5.
Typical trace of cell voltage and temperature over time with onset of significant venting and initiation of ignition sources for both types of experiments.
3.4. Near Immediate Initiation of Ignition Source Experiments
In these experiments, the ignition sources are initiated once significant venting has begun and vapour or smoke has filled the chamber. The onset of significant venting is easily detectable as the vent release is a jet, clearly audible on the chamber video system, and the cube fills rapidly with white smoke or vapour, usually within a minute (Figure 6). The spark ignitors are initiated when the cube lights are obscured and are then left on until ignition is achieved or it is evident that ignition will not occur.
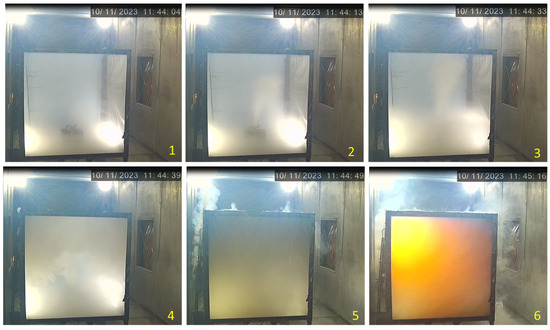
Figure 6.
Stills from the chamber video showing onset of significant venting and point of ignition for Cell D2.
In both the D cell experiments, D1 and D2 (105 Ah), the ignition was immediate upon initiating the ignition source. Analysis of the high-speed video from the experiment with Cell D2 shows that ignition occurred at the top of the cube and progressed across the top (Figure 7). The flame appears to take around 420 ms from the first detected visible light to travel the 1.2 m span of the rig. The flame ignited the jet of vented gas coming from the cell; this continued to burn for around 5 s as the level of the top of the cloud of white vapour moved downwards. It is unclear if the expanding combustion products force out this cloud, if it is entrained in the jet fire from the cell, or if it simply burns with a less luminous flame than the jet fire. It is clear however that the top portion of the cube burns more efficiently than the lower part. The flame will start spherically from the ignition kernel until it reaches the top and side of the rig; the side of the rig is 0.1 m from the ignition point and the ceiling is 0.2 m. There is no congestion within the rig and the plastic sheeting covering the vent has not burst at this point, so there is no venting to drive the flame front in a specific direction. Once combustion is complete and no remaining flames exist, the cube looks clear of vapour. However, the cell continues to vent enough vapour to obscure the cube again, but this vapour is not ignited by the continued sparks generated by the ignition source.
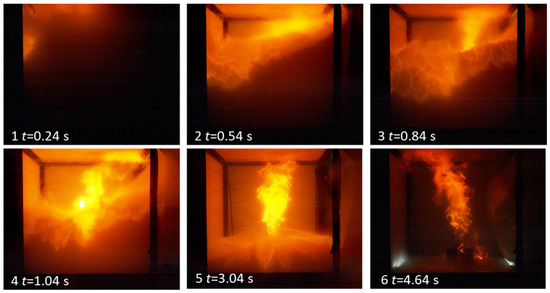
Figure 7.
Stills from the high-speed footage of Cell D2; t = 0 is the point of first visible light from ignition.
For these experiments, the internal pressure transducers did not record any overpressure effects; an increase in the transducer output was recorded, but this was consistent with the heat effects of flame impingement on the transducer. The polyethene sheet vent coverings also melted rather than burst, and no combustion occurred outside of the rig.
3.5. Delayed Ignition Experiments
Three experiments (D3–D5) were carried out, and in all the experiments ignition occurred immediately upon initiation of the spark ignitors, which were initiated when cell venting had subsided. The ignition resulted in a dynamic event in which a pressure rise caused the opening or bursting of the vent covering and consequent venting of unburnt gas into the test chamber, which combusted outside the cube. During deflagrations in confined spaces where the ignition is at the back wall, such as this cube rig, the growing flame causes a rise in pressure which bursts the vent and forces out the majority of the unburnt gas, which can ignite outside the rig leading to a secondary explosion, known as an external explosion [47]. As well as conditions such as the equivalence ratio of gas (concentration) in a confined space like the cube, where there are no internal congestion elements, the size of the vent and the force required to burst or open the vent dominate the severity of the explosion inside the rig and have an effect on the severity of the external explosion [48,49]. In all three experiments, the combustion was resemblant of a deflagration.
The first experiment with Cell D3 used the hinging vent, but this was damaged beyond repair in the first experiment, so a polythene sheet was used for D4 and D5. The data and high-speed video footage show that the ignition started at the top of the rig for all three experiments. However, due to smoke obscuration, it is impossible to see the flame’s progress clearly. For Cell D3, the pressure trace recorded on the cube rig’s internal pressure transducer is detailed in Figure 8. The trace is typical of a deflagration in a confined environment with a large hinging vent [50]. The first peak in pressure is the pressure rise to the point at which the cube side vent panel opens and is labelled as Popen. The peak pressure of this point is dictated by the rate of pressure rise and the vent catch’s strength; in this case, the two pieces of foil tape holding the vent are easily torn, so they are very weak. After Popen, the rate of pressure rise declines as the expanding flame kernel forces out the unburnt gases, relieving the pressure within the rig. As combustion and expansion of the flame continue, the rate of excess volume production in the flame exceeds the capacity of the vent, and pressure rises again. Eventually, this leads to the second peak in pressure, measured as 2.8 kPa, at the point when flames rather than unburned gas start to exit the vessel, labelled as Pmax. The following fall in internal pressure corresponds to a rapid drop in the density of gases passing through the vent. There is a negative phase as combustion declines and the remaining hot gases cool; at this point, the vent closes again. The remaining oscillations on the trace are a likely consequence of the vent slamming shut with enough force to crack the fireboard and oscillations due to the explosion in the cube. The closed vent also likely isolates the internal PT from the external explosion, as this would typically occur approximately at the time the flame exits, after the negative phase [38]. This external explosion inside the test chamber was strong enough to blow out the pressure relief vents, which would fail at around 2 kPa. The explosion was heard inside the windowless control room, which is situated 60 m from the test chamber.
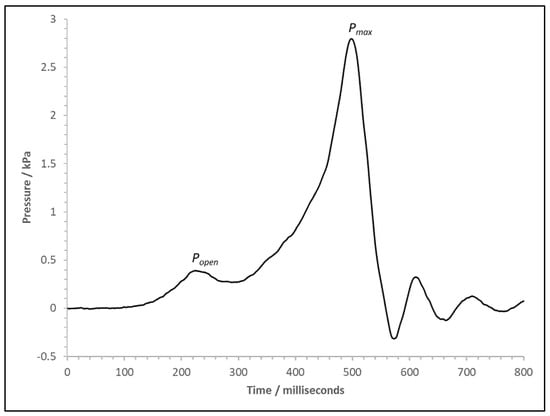
Figure 8.
Pressure versus time trace for the cube pressure transducer for test with Cell D3.
The explosions were less severe with cells D4 and D5. For D3, the hinged covering had a mass of around 8.2 kg and had substantial inertia; it did not fully open during the event, and therefore restricted the vent area. The polythene does not allow partial venting like a hinge cover; it stretches and then bursts. For D4, this was at 0.9 kPa, as indicated by Popen (Figure 9). Once burst, the polythene cleared the vent area, leading to a large vent area and increased vent efficiency compared to D3, and the Pmax was 1.6 kPa.
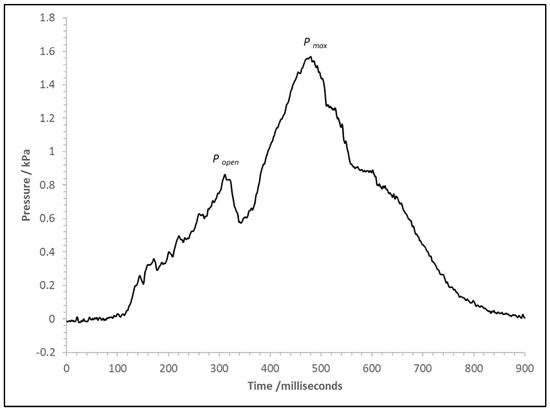
Figure 9.
Pressure versus time trace for the cube pressure transducer for test with Cell D4.
It was impossible with the experimental set-up to measure the gas concentrations at the ignition point. However, it was noted that, after the explosion, the cube looked reasonably clear, and it was possible to see the battery continuing to vent (Figure 10). After the explosion for Cell D3, the lower half of the vent panel that was damaged by the event dropped off; within 23 s of the vent closing, the cube was filled with smoke or vapour to the bottom of the remaining vent panel. Again, the constituents of this vented vapour are not known. Therefore, the exact ratio of flammable gas at the ignition point is unknown. However, it would likely be below the theoretical maximum calculated: 79% of the LEL. The other unknown is the concentration gradients; the vented gas jet from the cell hits the ceiling and rolls off into the cube volume. The white vapour gives the appearance of homogeneity; however, there is a temperature gradient within the rig, as seen in Figure 11. The ambient temperature in the test chamber was 8 °C before venting; due to heating by the cell, the temperature within the cube rig was around 12 °C before any venting occurred. The period of significant venting created higher temperatures at the ceiling, but, even as venting subsided and the temperatures in the rig dropped, there were still temperature gradients before ignition. The main flammable components of the gas, H2, CO, and methane (CH4), are also buoyant at ambient temperature, and H2 is known to be able to stratify even when released as a jet. In all experiments, the ignition occurred at the highest ignition source in the rig at 1 m from the floor.
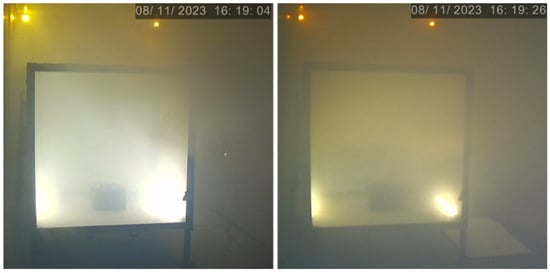
Figure 10.
Stills from chamber video cameras after the explosion for Cell D3.
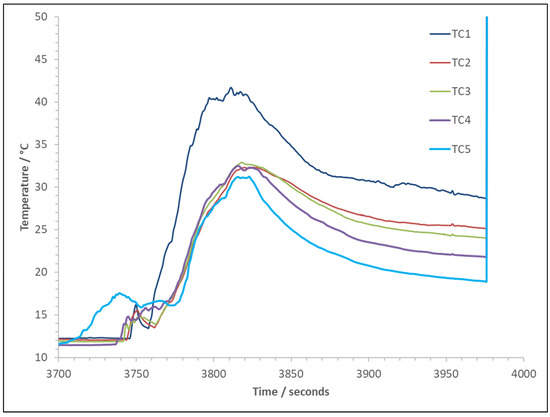
Figure 11.
Pre-ignition test rig temperatures for Cell D3.
4. Conclusions
With the thermal runaway failure of LFP cells rarely resulting in a self-ignited direct battery fire, the hazard moves from battery fire to a potential gas explosion hazard due to the release of significant volumes of flammable gases. This research aimed to investigate the ignitability of battery vent gases (released live, rather than formed from surrogate mixes) from large format prismatic LFP cells when the expected concentration falls below the homogenous lower explosive limit (LEL). The gas volumes and constituents were obtained from four sizes of cells when overcharged. The vent gas was a mixture of flammable gases and CO2, with H2 being the highest volumetric component at 44.8% to 48.7%. Cells were then overcharged to failure in the presence of remote ignition sources. It was discovered that all experiments with a 105 Ah cell in a cubic test rig with a volume of 1.728 m3 resulted in the ignition of the vent gases. When the ignition source was delayed, a deflagration resulted, with overpressures up to 2.8 kPa recorded in the rig. The maximum concentration of flammable gas possible in this volume is 79% of the LEL, if the gas is assumed to be homogenous, but is likely less at the time of ignition. The smoke or vapour released into the rig had the appearance of homogeneity; however, analysis of high-speed videography indicates the ignition occurred at the top of the test rig. The temperature gradients recorded after venting indicate that the flammable gases may have stratified; this could lead to localised higher concentrations of flammable gas at the top of the rig. This shows that the placement of gas detectors and vents should be carefully considered to account for stratification.
No ignitions occurred in tests with 50 Ah, 32 Ah, or 22 Ah prismatic cells. This indicates that flammable concentrations of gases did not occur at the ignition points. The ignition sources were highly localised and situated away from the cells and their safety vents; it cannot be discounted that flammable accumulation occurred away from the ignition sources.
Only single cells were failed in these tests; consideration should be given to scaling and multi-cell failure scenarios when assessing potential flammable gas hazards. Additionally, the volumes and geometries of a specific system may need to be considered in any such assessment.
Recommendations for Future Work
Further work is needed to achieve the following:
- Further research is required to understand the concentrations of flammable gases in different layers within a volume as a cell, module, or battery pack fails, and to ascertain the thickness and concentration of any stratified layer and understand the persistence of the layers as cooling occurs.
- Further research is required to understand the reactivity of the vent gases directly from a failed cell, with the resultant heat and contamination with vapourised electrolytes, aerosols, and particles, and to determine if the gases have the propensity for sonic combustion and possible deflagration to detonation transition.
Supplementary Materials
The following supporting information can be downloaded at https://www.mdpi.com/article/10.3390/batteries11100352/s1. Table S1: Fraction calculation of gas mixtures; Table S2: Calculation of gas equivalence ratio expected in cube rig; Figure S1: FTIR traces of liquid residue samples from pressure vessel.
Author Contributions
Conceptualization, J.G., J.E.H.B. and G.E.H.; data curation, J.G. and G.E.H.; formal analysis, J.G. and G.E.H.; funding acquisition, J.G. and J.E.H.B.; investigation, J.G., G.E.H., S.L.G., P.A.P.R. and J.W.M.; methodology, J.G.; supervision, J.E.H.B.; validation, J.G. and G.E.H.; visualisation, J.G.; writing—original draft, J.G. and G.E.H.; writing–review and editing, J.E.H.B. All authors have read and agreed to the published version of the manuscript.
Funding
This work received no external funding.
Data Availability Statement
The data presented in this study are available in the article, Supplementary Data, and cited works.
Acknowledgments
The contents of this publication, including any opinions and/or conclusions expressed, are those of the authors alone and do not necessarily reflect HSE policy.
Conflicts of Interest
The authors declare that they have no known competing financial interests or personal relationships that could have appeared to influence the work reported in this paper.
Abbreviations
The following abbreviations are used in this manuscript:
| LFP | Lithium iron phosphate |
| SoC | State of charge |
| LIB | Lithium-ion batteries |
| BESS | Battery energy storage system |
| GC-MS | Gas chromatography–mass spectrometry |
| FTIR | Fourier transform infrared spectroscopy |
| MS | Mass spectrometry |
| LEL | Lower explosive limit |
References
- Nordelöf, A.; Messagie, M.; Tillman, A.-M.; Ljunggren Söderman, M.; Van Mierlo, J. Environmental impacts of hybrid plug-in hybrid battery electric vehicles—What can we learn from life cycle assessment? Int. J. Life Cycle Assess. 2014, 19, 1866–1890. [Google Scholar] [CrossRef]
- Ballinger, B.; Stringer, M.; Schmeda-Lopez, D.R.; Kefford, B.; Parkinson, B.; Greig, C.; Smart, S. The vulnerability of electric vehicle deployment to critical mineral supply. Appl. Energy 2019, 255, 113844. [Google Scholar] [CrossRef]
- Abulelsamid, S. Lithium iron phosphate set to be the next big thing in ev batteries. In Forbes; Forbes Media: Jersey City, NJ, USA, 2023; Available online: https://www.forbes.com/sites/samabuelsamid/2023/08/16/lithium-iron-phosphate-set-to-be-the-next-big-thing-in-ev-batteries/ (accessed on 1 December 2024).
- Crownhart, C. What’s next for batteries. In MIT Technology Review; Massachusetts Institute of Technology: Boston, MA, USA, 2023; Available online: https://www.technologyreview.com/2023/01/04/1066141/whats-next-for-batteries/ (accessed on 1 December 2024).
- Jaswani, P. Battery Markets in Construction, Agriculture & Mining Machines 2024–2034. Available online: https://www.idtechex.com/en/research-report/battery-markets-in-construction-agriculture-and-mining-machines-2024-2034/1008 (accessed on 2 December 2024).
- Abbott, K.C.; Buston, J.E.H.; Gill, J.; Goddard, S.L.; Howard, D.; Howard, G.E.; Read, E.; Williams, R.C.E. Experimental study of three commercially available 18650 lithium ion batteries using multiple abuse methods. J. Energy Storage 2023, 65, 107293. [Google Scholar] [CrossRef]
- Liu, P.; Wang, C.; Sun, S.; Zhao, G.; Yu, X.; Hu, Y.; Mei, W.; Jin, K.; Wang, Q. Understanding the influence of the confined cabinet on thermal runaway of large format batteries with different chemistries: A comparison and safety assessment study. J. Energy Storage 2023, 74, 109337. [Google Scholar] [CrossRef]
- Bugryniec, P.J.; Davidson, J.N.; Cumming, D.J.; Brown, S.F. Pursuing safer batteries: Thermal abuse of lifepo4 cells. J. Power Sources 2019, 414, 557–568. [Google Scholar] [CrossRef]
- Liu, P.; Liu, C.; Yang, K.; Zhang, M.; Gao, F.; Mao, B.; Li, H.; Duan, Q.; Wang, Q. Thermal runaway and fire behaviors of lithium iron phosphate battery induced by over heating. J. Energy Storage 2020, 31, 101714. [Google Scholar] [CrossRef]
- Wang, S.; Song, L.; Li, C.; Tian, J.; Jin, K.; Duan, Q.; Wang, Q. Experimental study of gas production and flame behavior induced by the thermal runaway of 280 ah lithium iron phosphate battery. J. Energy Storage 2023, 74, 109368. [Google Scholar] [CrossRef]
- Rappsilber, T.; Yusfi, N.; Krüger, S.; Hahn, S.-K.; Fellinger, T.-P.; Krug von Nidda, J.; Tschirschwitz, R. Meta-analysis of heat release and smoke gas emission during thermal runaway of lithium-ion batteries. J. Energy Storage 2023, 60, 106579. [Google Scholar] [CrossRef]
- Huang, Z.; Li, X.; Wang, Q.; Duan, Q.; Li, Y.; Li, L.; Wang, Q. Experimental investigation on thermal runaway propagation of large format lithium ion battery modules with two cathodes. Int. J. Heat Mass Transf. 2021, 172, 121077. [Google Scholar] [CrossRef]
- Zhou, Z.; Li, M.; Zhou, X.; Li, L.; Ju, X.; Yang, L. Investigating thermal runaway triggering mechanism of the prismatic lithium iron phosphate battery under thermal abuse. Renew. Energy 2024, 220, 119674. [Google Scholar] [CrossRef]
- NFPA. NFPA 69 Standard on Explosion Prevention Systems; NFPA: Quincy, MA, USA, 2024. [Google Scholar]
- Zabetakis, M.G. Fire Safety; Safety manual; no. 13. United States Department of Labor, Mine Safety and Health Administration; National Mine Health and Safety Academy: Washington, DC, USA, 1986.
- BS EN 60079-29-2:2015; Explosive Atmospheres-Gas Detectors. Selection, Installation, Use and Maintenance of Detectors for Flammable Gases and Oxygen. BSI: Hong Kong, China, 2015.
- Baird, A.R.; Archibald, E.J.; Marr, K.C.; Ezekoye, O.A. Explosion hazards from lithium-ion battery vent gas. J. Power Sources 2020, 446, 227257. [Google Scholar] [CrossRef]
- Bugryniec, P.J.; Resendiz, E.G.; Nwophoke, S.M.; Khanna, S.; James, C.; Brown, S.F. Review of gas emissions from lithium-ion battery thermal runaway failure—Considering toxic and flammable compounds. J. Energy Storage 2024, 87, 111288. [Google Scholar] [CrossRef]
- Fernandes, Y.; Bry, A.; de Persis, S. Identification and quantification of gases emitted during abuse tests by overcharge of a commercial li-ion battery. J. Power Sources 2018, 389, 106–119. [Google Scholar] [CrossRef]
- Howard, G.E.; Buston, J.E.H.; Gill, J.; Goddard, S.L.; Mellor, J.W.; Reeve, P.A.P. Comprehensive study of the gas volume and composition produced by different 3–230 ah lithium iron phosphate (lfp) cells failed using external heat, overcharge and nail penetration under air and inert atmospheres. Batteries 2025, 11, 267. [Google Scholar] [CrossRef]
- Jia, Z.; Min, Y.; Qin, P.; Mei, W.; Meng, X.; Jin, K.; Sun, J.; Wang, Q. Effect of safety valve types on the gas venting behavior and thermal runaway hazard severity of large-format prismatic lithium iron phosphate batteries. J. Energy Chem. 2024, 89, 195–207. [Google Scholar] [CrossRef]
- Abbott, K.C.; Buston, J.E.H.; Gill, J.; Goddard, S.L.; Howard, D.; Howard, G.; Read, E.; Williams, R.C.E. Comprehensive gas analysis of a 21700 li(ni0.8co0.1mn0.1o2) cell using mass spectrometry. J. Power Sources 2022, 539, 231585. [Google Scholar] [CrossRef]
- Jia, Z.; Wang, S.; Qin, P.; Li, C.; Song, L.; Cheng, Z.; Jin, K.; Sun, J.; Wang, Q. Comparative investigation of the thermal runaway and gas venting behaviors of large-format lifepo4 batteries caused by overcharging and overheating. J. Energy Storage 2023, 61, 106791. [Google Scholar] [CrossRef]
- Kang, R.; Jia, C.; Zhao, J.; Zhao, L.; Zhang, J. Effects of capacity on the thermal runaway and gas venting behaviors of large-format lithium iron phosphate batteries induced by overcharge. J. Energy Storage 2024, 87, 111523. [Google Scholar] [CrossRef]
- Liu, Y.; Ju, L.; Jia Zz Cheng, Z.; Min, Y.; Mei, W.; Qin, P.; Wang, Q. Experimental study on the internal pressure evolution of large-format lifepo4 battery during thermal runaway. J. Energy Storage 2024, 102, 114196. [Google Scholar] [CrossRef]
- Mao, B.; Liu, C.; Yang, K.; Li, S.; Liu, P.; Zhang, M.; Meng, X.; Gao, F.; Duan, Q.; Wang, Q.; et al. Thermal runaway and fire behaviors of a 300 ah lithium ion battery with lifepo4 as cathode. Renew. Sust. Energy Rev. 2021, 139, 110717. [Google Scholar] [CrossRef]
- Ogunfuye, S.; Sezer, H.; Said, A.O.; Simeoni, A.; Akkerman, V.Y. An analysis of gas-induced explosions in vented enclosures in lithium-ion batteries. J. Energy Storage 2022, 51, 104438. [Google Scholar] [CrossRef]
- Qian, F.; Wang, H.; Li, M.; Li, C.; Shen, H.; Wang, J.; Li, Y.; Ouyang, M. Thermal runaway vent gases from high-capacity energy storage lifepo4 lithium iron. Energies 2023, 16, 3485. [Google Scholar] [CrossRef]
- Qin, P.; Jia, Z.; Wu, J.; Jin, K.; Duan, Q.; Jiang, L.; Sun, J.; Ding, J.; Shi, C.; Wang, Q. The thermal runaway analysis on lifepo4 electrical energy storage packs with different venting areas and void volumes. Appl. Energy 2022, 313, 118767. [Google Scholar] [CrossRef]
- Shen, H.; Wang, H.; Li, M.; Li, C.; Zhang, Y.; Li, Y.; Yang, X.; Feng, X.; Ouyang, M. Thermal runaway characteristics and gas composition analysis of lithium-ion batteries with different lfp and ncm cathode materials under inert atmosphere. Electronics 2023, 12, 1603. [Google Scholar] [CrossRef]
- Wang, S.; Zhang, C.; Chen, D.; Qin, Y.; Xu, L.; Li, Y.; Wang, Q.; Feng, X.; Wang, H. Explosion characteristics of two-phase ejecta from large-capacity lithium iron phosphate batteries. eTransportation 2024, 22, 100377. [Google Scholar] [CrossRef]
- Wang, S.-L.; Gong, X.; Liu, L.-N.; Li, Y.-T.; Zhang, C.-Y.; Xu, L.-J.; Feng, X.-N.; Wang, H.-B. Numerical analysis of explosion characteristics of vent gas from 18650 lifepo 4 batteries with different states of charge. J. Energy Chem. 2024, 30, 3. [Google Scholar] [CrossRef]
- Xie, W.; Zhang, L. Experimental study on thermal runaway and venting gas explosion hazards in prismatic lithium-ion batteries at different states of charge. Process Saf. Environ. Prot. 2025, 198, 107118. [Google Scholar] [CrossRef]
- Yang, M.; Rong, M.; Ye, Y.; Yang, A.; Chu, J.; Yuan, H.; Wang, X. Comprehensive analysis of gas production for commercial lifepo4 batteries during overcharge-thermal runaway. J. Energy Storage 2023, 72, 108323. [Google Scholar] [CrossRef]
- Zhang, M.; Yang, K.; Zhang, Q.; Chen, H.; Fan, M.; Geng, M.; Wei, B.; Xie, B. Simulation of dispersion and explosion characteristics of lifepo4 lithium-ion battery thermal runaway gases. ACS Omega 2024, 9, 17036–17044. [Google Scholar] [CrossRef]
- Howard, G.E.; Abbott, K.C.; Buston, J.E.H.; Gill, J.; Goddard, S.L.; Howard, D. Comprehensive study of the gas volume and composition generated by 5 ah nickel manganese cobalt oxide (nmc) li-ion pouch cells through different failure mechanisms at varying states of charge. Batteries 2025, 11, 197. [Google Scholar] [CrossRef]
- Chen, S.; Wang, Z.; Wang, J.; Tong, X.; Yan, W. Lower explosion limit of the vented gases from li-ion batteries thermal runaway in high temperature condition. J. Loss Prev. Process Ind. 2020, 63, 103992. [Google Scholar] [CrossRef]
- Li, W.; Rao, S.; Xiao, Y.; Gao, Z.; Chen, Y.; Wang, H.; Ouyang, M. Fire boundaries of lithium-ion cell eruption gases caused by thermal runaway. iScience 2021, 24, 102401. [Google Scholar] [CrossRef] [PubMed]
- Wang, K.; Wu, D.; Chang, C.; Zhang, J.; Ouyang, D.; Qian, X. Charging rate effect on overcharge-induced thermal runaway characteristics gas venting behaviors for commercial lithium iron phosphate batteries. J. Clean. Prod. 2024, 434, 139992. [Google Scholar] [CrossRef]
- Wei, G.; Huang, R.; Zhang, G.; Jiang, B.; Zhu, J.; Guo, Y.; Han, G.; Wei, X.; Dai, H. A comprehensive insight into the thermal runaway issues in the view of lithium-ion battery intrinsic safety performance and venting gas explosion hazards. Appl. Energy 2023, 349, 121651. [Google Scholar] [CrossRef]
- Yang, X.; Wang, H.; Li, M.; Li, Y.; Li, C.; Zhang, Y.; Chen, S.; Shen, H.; Qian, F.; Feng, X.; et al. Experimental study on thermal runaway behavior of lithium-ion battery and analysis of combustible limit of gas production. Batteries 2022, 8, 250. [Google Scholar] [CrossRef]
- Zabetakis, M.G. Flammability Characteristics of Combustible Gases and Vapors. Available online: https://www.osti.gov/biblio/7328370 (accessed on 12 December 2024).
- Henriksen, M.; Vaagsaether, K.; Lundberg, J.; Forseth, S.; Bjerketvedt, D. Explosion characteristics for li-ion battery electrolytes at elevated temperatures. J. Hazard. Mater. 2019, 371, 1–7. [Google Scholar] [CrossRef]
- Liang, Z.; Gardner, L.; Clouthier, T.; MacCoy, R. Hydrogen deflagrations in stratified flat layers in the large-scale vented combustion test facility. Int. J. Hydrogen Energy 2021, 46, 12533–12544. [Google Scholar] [CrossRef]
- Reeve, P.A.; Buston, J.E.; Gill, J.; Goddard, S.L.; Howard, G.E.; Mellor, J.W. Failure gas analysis of lithium–nickel–cobalt–aluminium oxide cells from different manufacturers. RSC Adv. 2025, 15, 5084–5095. [Google Scholar] [CrossRef]
- Coward, H.F.; Jones, G.W. Limits of Flammability of Gases and Vapours; US Government Printing Office: Washington, DC, USA, 1952.
- Rui, S.; Wang, C.; Luo, X.; Jing, R.; Li, Q. External explosions of vented hydrogen-air deflagrations in a cubic vessel. Fuel 2021, 301, 121023. [Google Scholar] [CrossRef]
- Fakandu, B.M.; Andrews, G.E.; Phylaktou, H.N. Vent burst pressure effects on vented gas explosion reduced pressure. J. Loss Prev. Process Ind. 2015, 36, 429–438. [Google Scholar] [CrossRef]
- Tang, Z.; Li, J.; Guo, J.; Zhang, S.; Duan, Z. Effect of vent size on explosion overpressure and flame behavior during vented hydrogen–air mixture deflagrations. Nucl. Eng. Des. 2020, 361, 110578. [Google Scholar] [CrossRef]
- Gill, J.; Atkinson, G.; Cowpe, E.; Phylaktou, H.; Andrews, G. Experimental investigation of potential confined ignition sources for vapour cloud explosions. Process Saf. Environ. Prot. 2020, 135, 187–206. [Google Scholar] [CrossRef]
Disclaimer/Publisher’s Note: The statements, opinions and data contained in all publications are solely those of the individual author(s) and contributor(s) and not of MDPI and/or the editor(s). MDPI and/or the editor(s) disclaim responsibility for any injury to people or property resulting from any ideas, methods, instructions or products referred to in the content. |
© 2025 by the authors. Licensee MDPI, Basel, Switzerland. This article is an open access article distributed under the terms and conditions of the Creative Commons Attribution (CC BY) license (https://creativecommons.org/licenses/by/4.0/).