
Electrochemical Impedance Spectroscopy-Based Characterization and Modeling of Lithium-Ion Batteries Based on Frequency Selection


 ,
,  ,
,  and
and 
Abstract
:1. Introduction
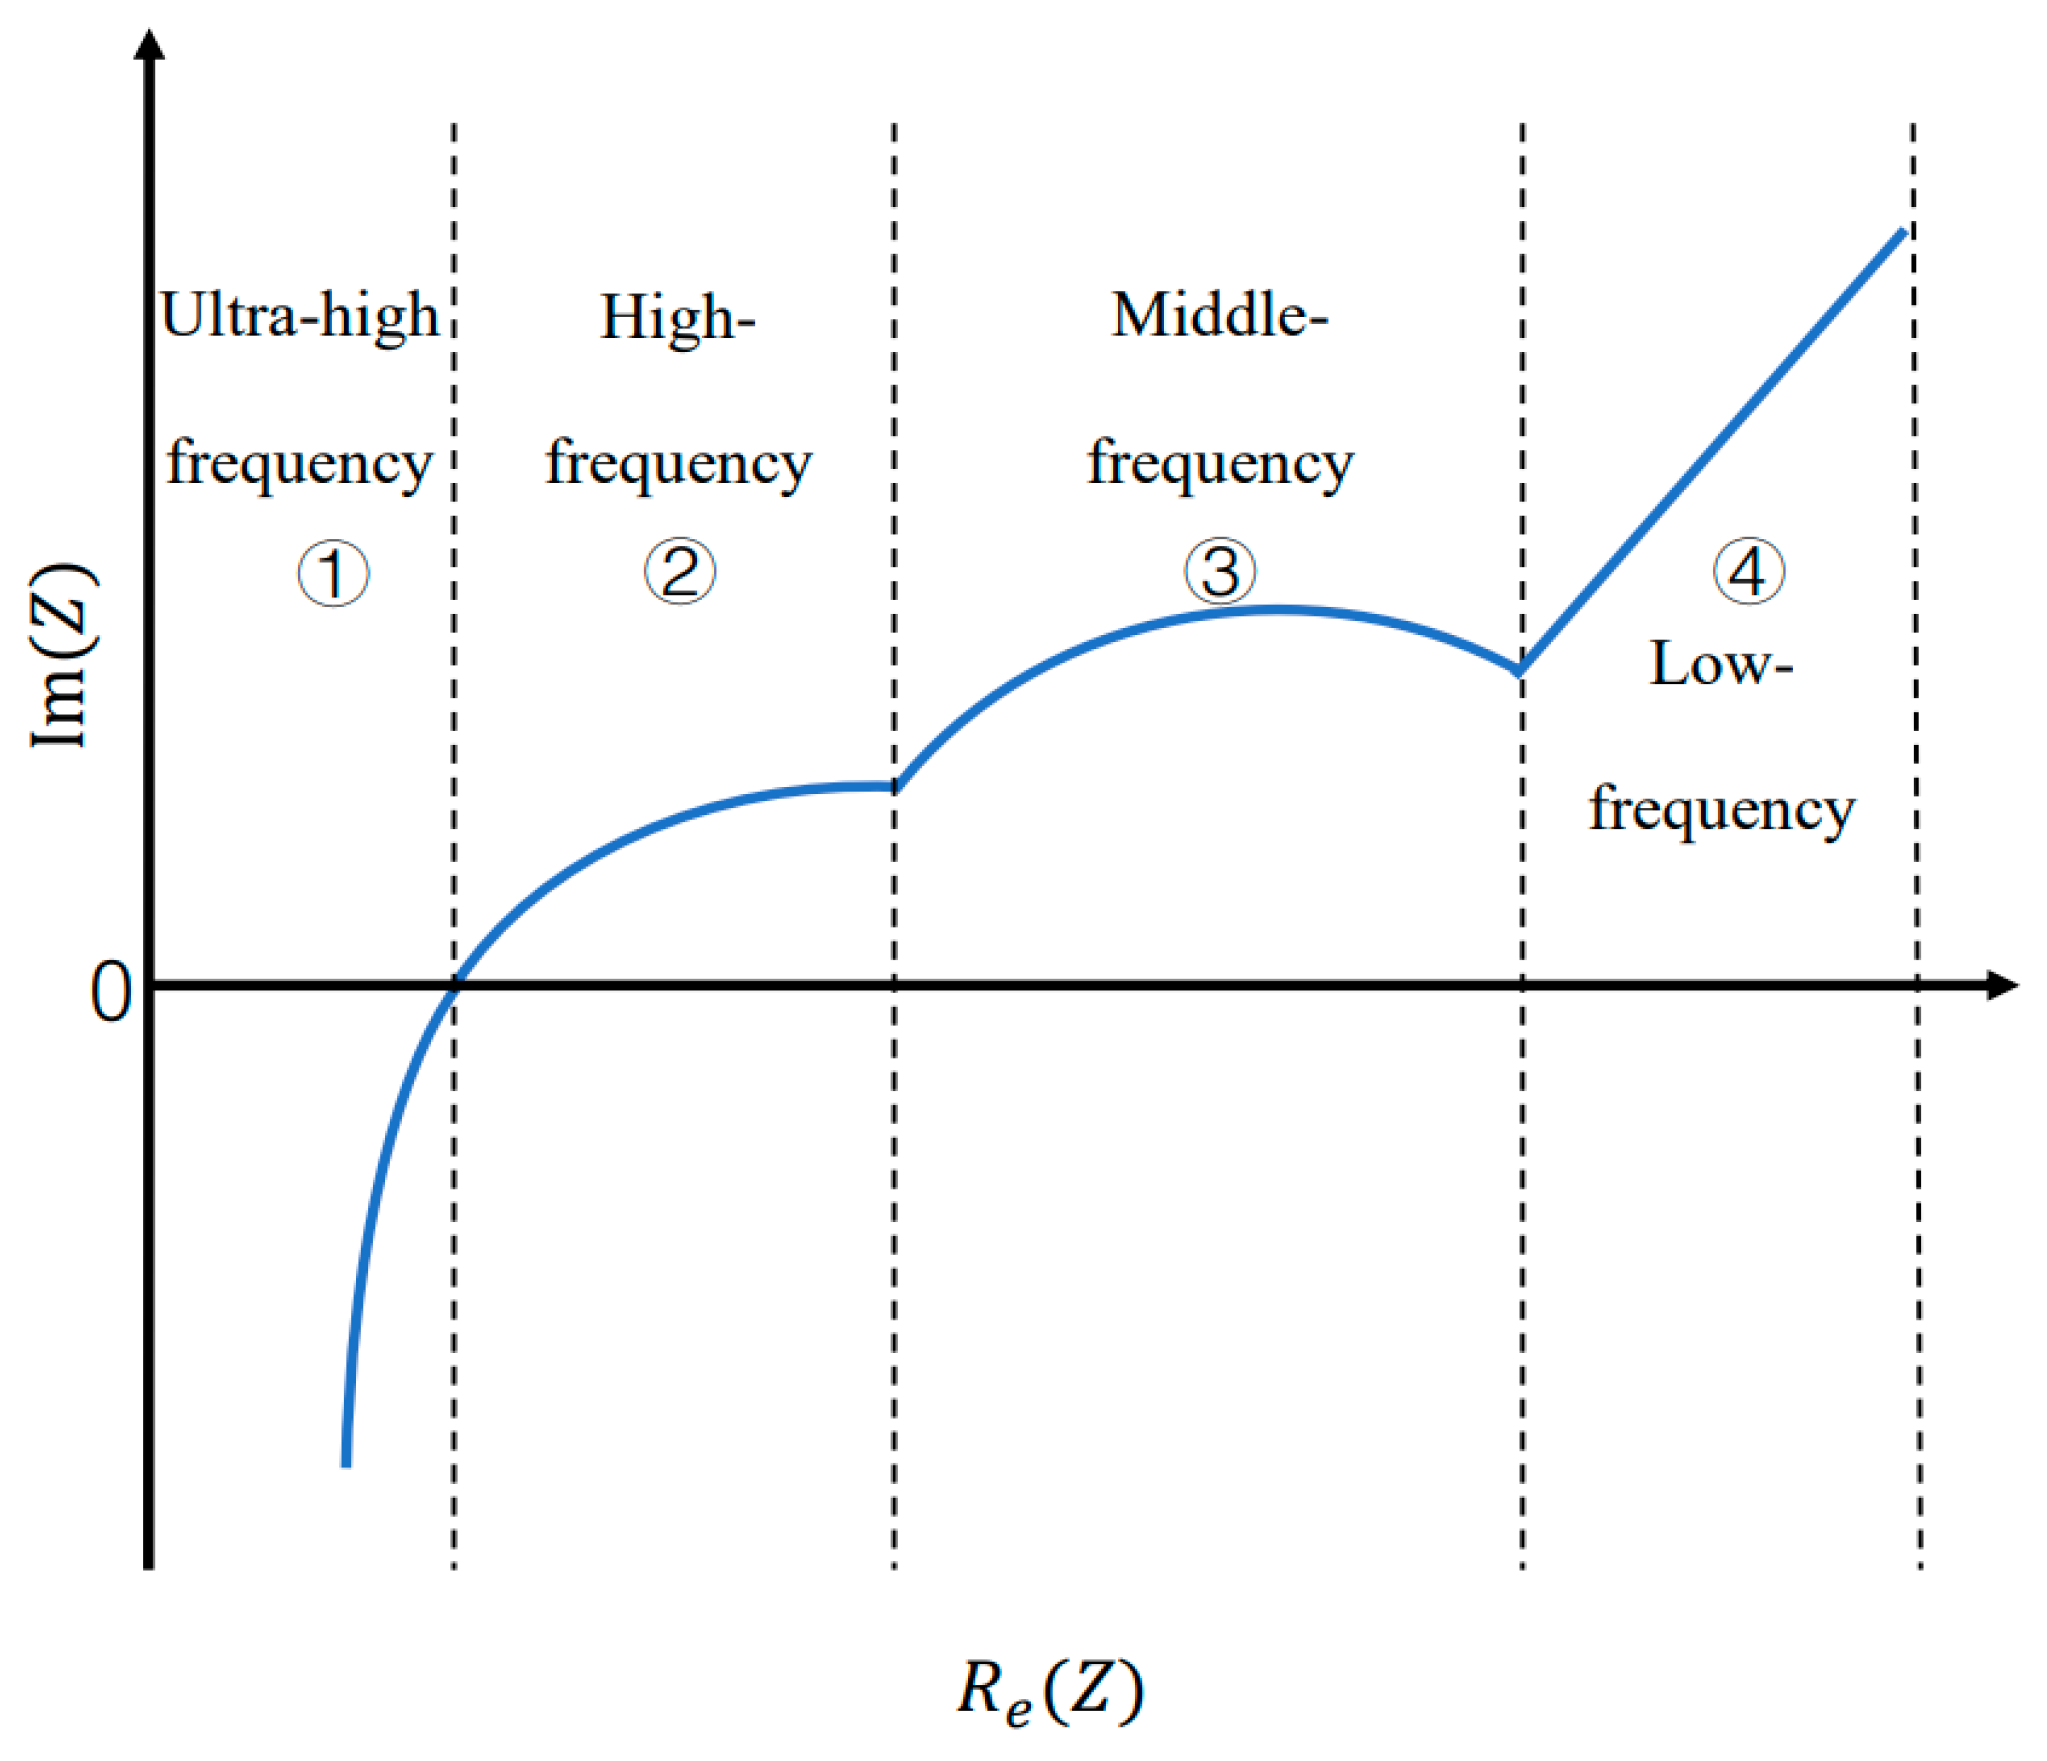
2. Impedance Model
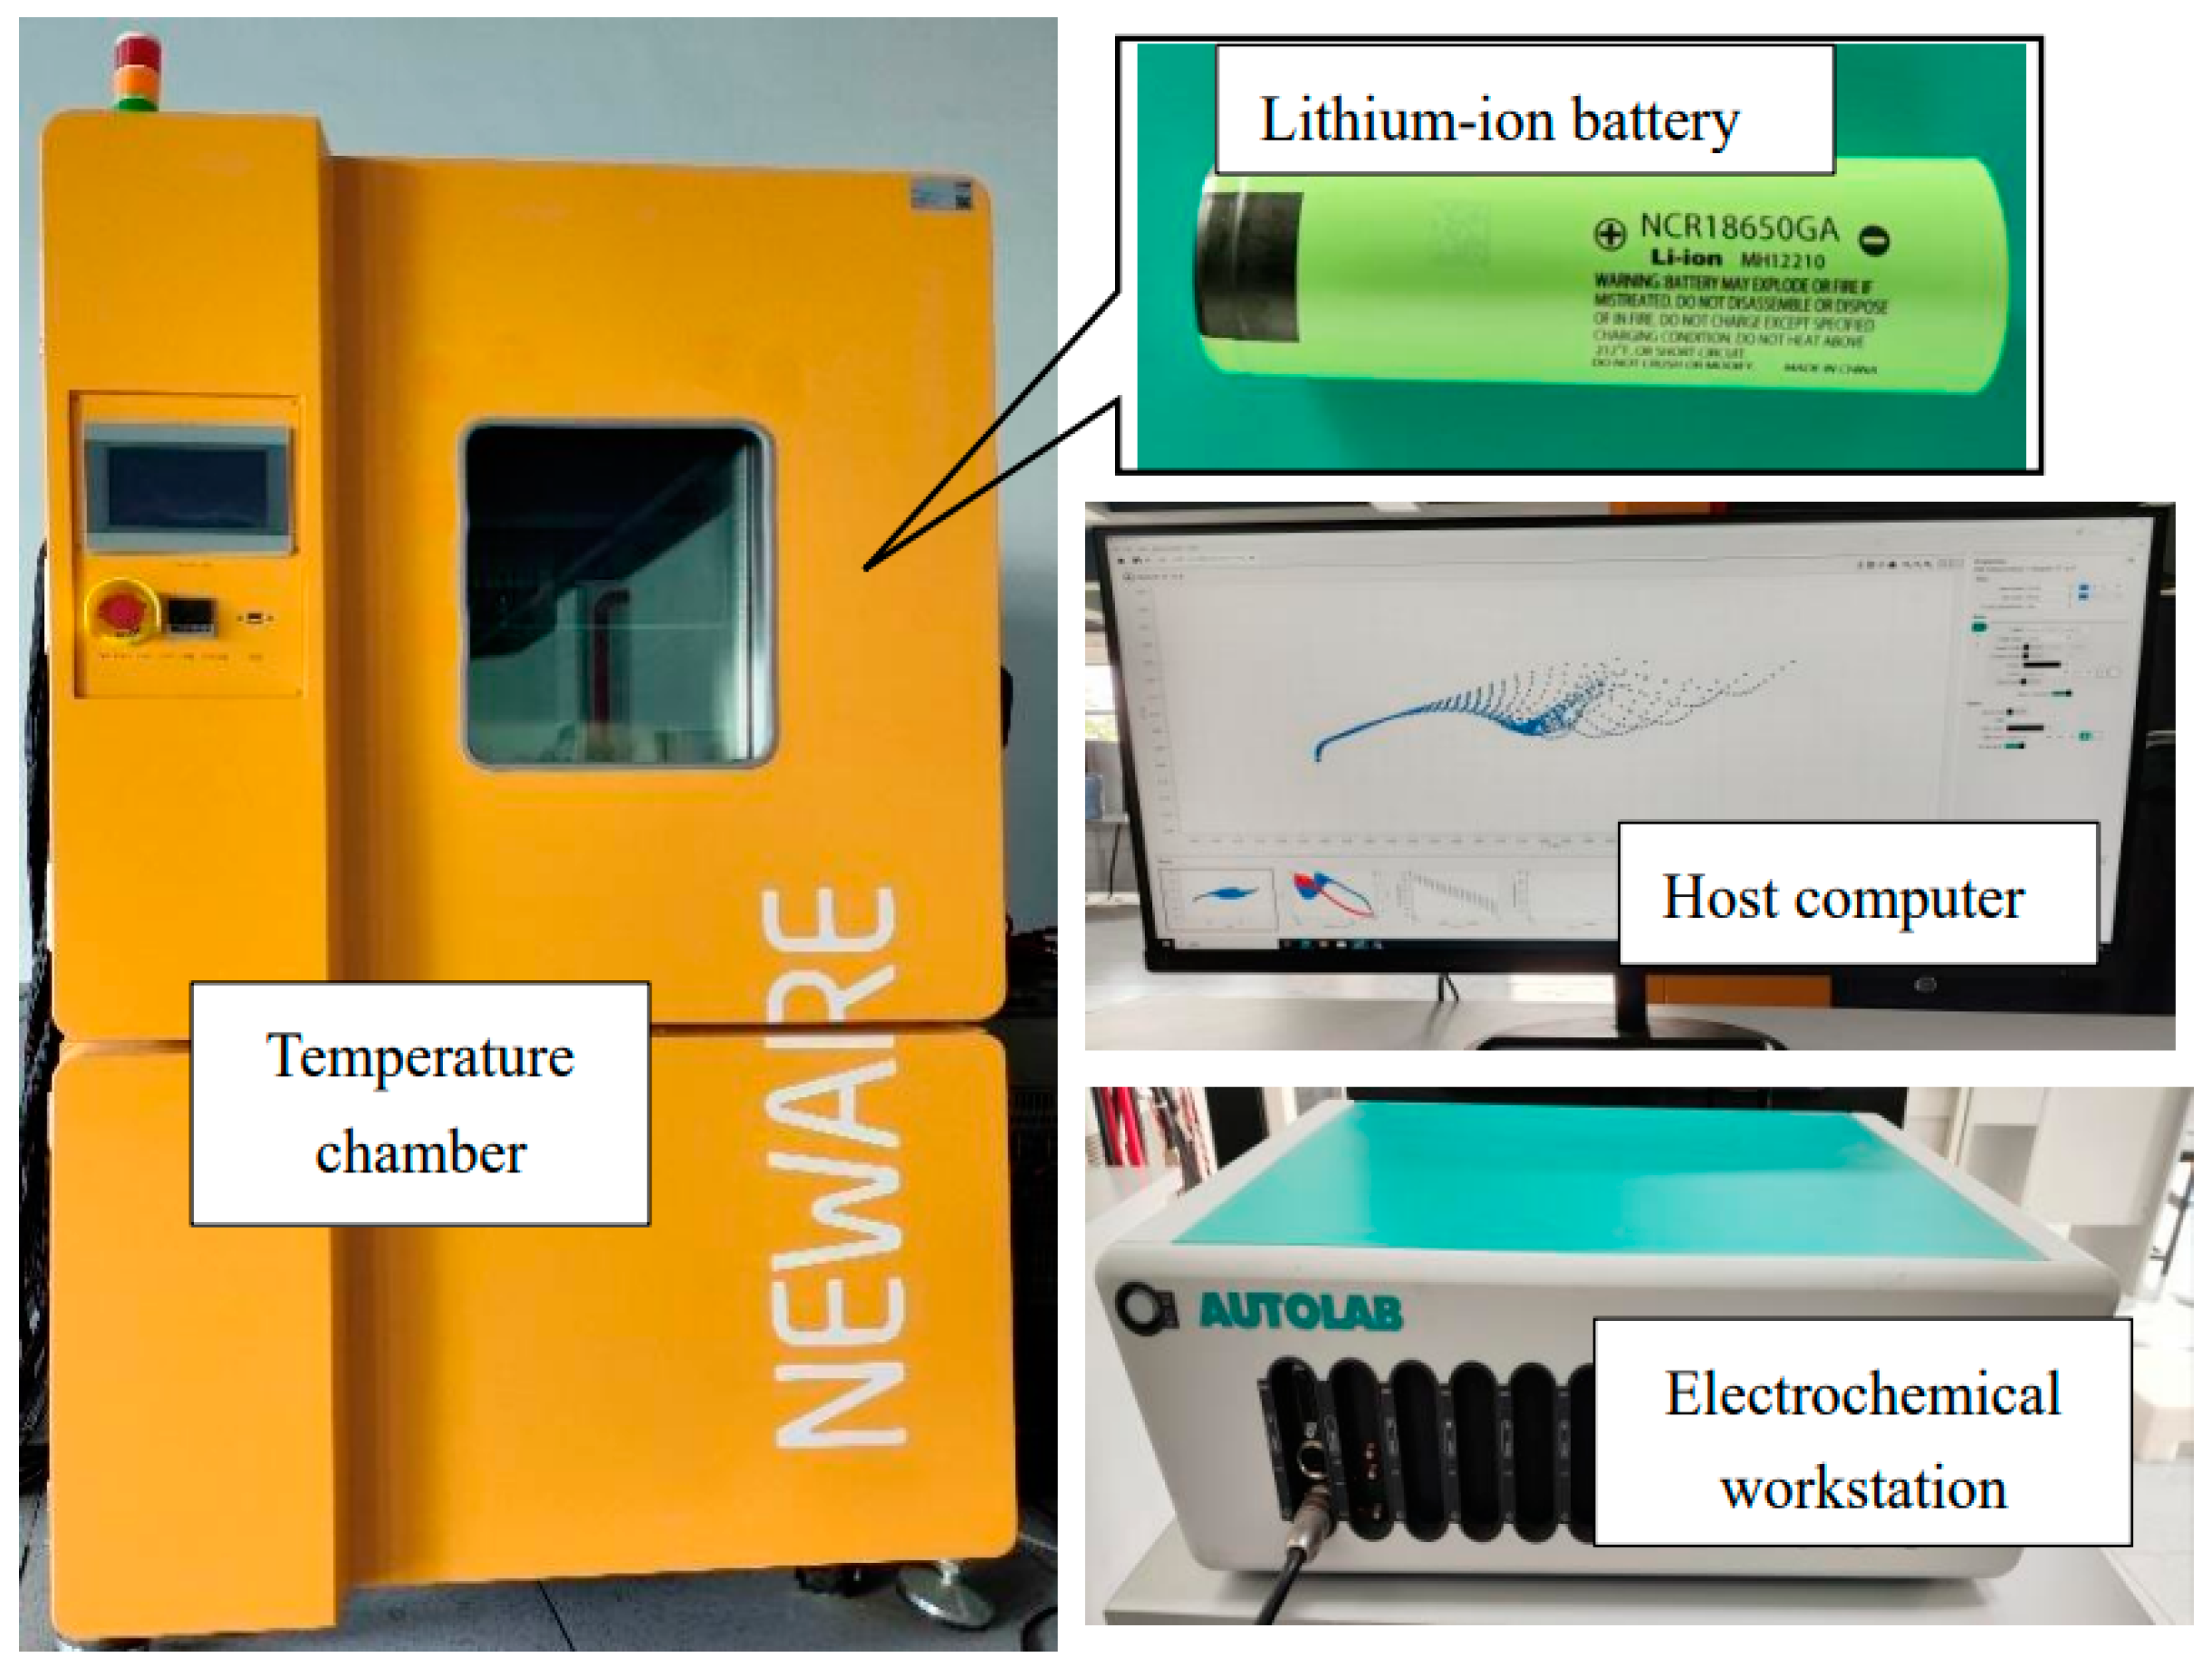
3. Experiment Method
3.1. Experimental Procedure
3.2. Experimental Results
4. Discussion
4.1. Regression Analysis of Resistance and Temperature
4.2. Regression Analysis of Resistance and SOC
4.3. ANOVA Tables for , and
4.4. Impedance Versus Frequency
5. Conclusions
Author Contributions
Funding
Data Availability Statement
Conflicts of Interest
References
- IEA. Trends in electric cars. In Global EV Outlook 2024; IEA: Paris, France, 2024. [Google Scholar]
- Arsalis, A.; Papanastasiou, P.; Georghiou, G.E. A comparative review of lithium-ion battery and regenerative hydrogen fuel cell technologies for integration with photovoltaic applications. Renew. Energy 2022, 191, 943–960. [Google Scholar] [CrossRef]
- Peng, F.; Xie, X.; Wu, K.; Zhao, Y.; Ren, L. Online hierarchical energy management strategy for fuel cell based heavy-duty hybrid power systems aiming at collaborative performance enhancement. Energy Convers. Manag. 2023, 276, 116501. [Google Scholar] [CrossRef]
- Carthy, K.M.; Gullapalli, H.; Ryan, K.M.; Kennedy, T. Review-Use of Impedance Spectroscopy for the Estimation of Li-ion Battery State of Charge, State of Health and Internal Temperature. J. Electrochem. Soc. 2021, 168, 080517. [Google Scholar] [CrossRef]
- Zou, Y.; Hu, X.; Ma, H.; Li, S.E. Combined State of Charge and State of Health estimation over lithium-ion battery cell cycle lifespan for electric vehicles. J. Power Sources 2015, 273, 793–803. [Google Scholar] [CrossRef]
- Saha, B.; Goebel, K.; Poll, S.; Christophersen, J. Prognostics Methods for Battery Health Monitoring Using a Bayesian Framework. IEEE Trans. Instrum. Meas. 2009, 58, 291–296. [Google Scholar] [CrossRef]
- Mc Carthy, K.; Gullapalli, H.; Ryan, K.M.; Kennedy, T. Electrochemical impedance correlation analysis for the estimation of Li-ion battery state of charge, state of health and internal temperature. J. Energy Storage 2022, 50, 104608. [Google Scholar] [CrossRef]
- Zhang, G.; Wei, X.; Han, G.; Dai, H.; Zhu, J.; Wang, X.; Tang, X.; Ye, J. Lithium plating on the anode for lithium-ion batteries during long-term low temperature cycling. J. Power Sources 2021, 484, 229312. [Google Scholar] [CrossRef]
- Zhu, J.; Darma, M.S.D.; Knapp, M.; Sorensen, D.R.; Heere, M.; Fang, Q.; Wang, X.; Dai, H.; Mereacre, L.; Senyshyn, A.; et al. Investigation of lithium-ion battery degradation mechanisms by combining differential voltage analysis and alternating current impedance. J. Power Sources 2020, 448, 227575. [Google Scholar] [CrossRef]
- Zhu, J.; Knapp, M.; Liu, X.; Yan, P.; Dai, H.; Wei, X.; Ehrenberg, H. Low-Temperature Separating Lithium-Ion Battery Interfacial Polarization Based on Distribution of Relaxation Times (DRT) of Impedance. Ieee Trans. Transp. Electrif. 2021, 7, 410–421. [Google Scholar] [CrossRef]
- Kassem, M.; Delacourt, C. Postmortem analysis of calendar-aged graphite/LiFePO4 cells. J. Power Sources 2013, 235, 159–171. [Google Scholar] [CrossRef]
- Westerhoff, U.; Kurbach, K.; Lienesch, F.; Kurrat, M. Analysis of Lithium-Ion Battery Models Based on Electrochemical Impedance Spectroscopy. Energy Technol. 2016, 4, 1620–1630. [Google Scholar] [CrossRef]
- Seaman, A.; Dao, T.-S.; McPhee, J. A survey of mathematics-based equivalent-circuit and electrochemical battery models for hybrid and electric vehicle simulation. J. Power Sources 2014, 256, 410–423. [Google Scholar] [CrossRef]
- Doyle, M.; Fuller, T.F.; Newman, J. Modeling of galvanostatic charge and discharge of the lithium/polymer/insertion cell. J. Electrochem. Soc. 1993, 140, 1526–1533. [Google Scholar] [CrossRef]
- Bizeray, A.M.; Zhao, S.; Duncan, S.R.; Howey, D.A. Lithium-ion battery thermal-electrochemical model-based state estimation using orthogonal collocation and a modified extended Kalman filter. J. Power Sources 2015, 296, 400–412. [Google Scholar] [CrossRef]
- Zhang, H.; Deng, C.; Zong, Y.; Zuo, Q.; Guo, H.; Song, S.; Jiang, L. Effect of Sample Interval on the Parameter Identification Results of RC Equivalent Circuit Models of Li-ion Battery: An Investigation Based on HPPC Test Data. Batteries 2023, 9, 1. [Google Scholar] [CrossRef]
- Pastor-Fernandez, C.; Uddin, K.; Chouchelamane, G.H.; Widanage, W.D.; Marco, J. A Comparison between Electrochemical Impedance Spectroscopy and Incremental Capacity-Differential Voltage as Li-ion Diagnostic Techniques to Identify and Quantify the Effects of Degradation Modes within Battery Management Systems. J. Power Sources 2017, 360, 301–318. [Google Scholar] [CrossRef]
- Choi, W.; Shin, H.-C.; Kim, J.M.; Choi, J.-Y.; Yoon, W.-S. Modeling and Applications of Electrochemical Impedance Spectroscopy (EIS) for Lithium-ion Batteries. J. Electrochem. Sci. Technol. 2020, 11, 1–13. [Google Scholar] [CrossRef]
- Meng, J.; Du, X.; Peng, J.; Lin, M.; Song, Z. Rapid Lithium-Ion Battery Impedance Measurements Using Binary Sequence With Optimized Frequency Components. IEEE Trans. Ind. Electron. 2024, 71, 7190–7198. [Google Scholar] [CrossRef]
- Meng, J.; Peng, J.; Cai, L.; Song, Z. Rapid Impedance Extraction for Lithium-Ion Battery by Integrating Power Spectrum and Frequency Property. IEEE Trans. Ind. Electron. 2024, 71, 7220–7229. [Google Scholar] [CrossRef]
- Wang, L.; Zhao, X.; Deng, Z.; Yang, L. Application of electrochemical impedance spectroscopy in battery management system: State of charge estimation for aging batteries. J. Energy Storage 2023, 57, 106275. [Google Scholar] [CrossRef]
- Wang, Q.-K.; He, Y.-J.; Shen, J.-N.; Hu, X.-S.; Ma, Z.-F. State of Charge-Dependent Polynomial Equivalent Circuit Modeling for Electrochemical Impedance Spectroscopy of Lithium-Ion Batteries. IEEE Trans. Power Electron. 2018, 33, 8449–8460. [Google Scholar] [CrossRef]
- Kong, L.; Fang, S.; Niu, T.; Chen, G.; Yang, L.; Liao, R. Fast State of Charge Estimation for Lithium-ion Battery Based on Electrochemical Impedance Spectroscopy Frequency Feature Extraction. IEEE Trans. Ind. Appl. 2024, 60, 1369–1379. [Google Scholar] [CrossRef]
- Zhang, Q.; Huang, C.-G.; Li, H.; Feng, G.; Peng, W. Electrochemical Impedance Spectroscopy Based State-of-Health Estimation for Lithium-Ion Battery Considering Temperature and State-of-Charge Effect. IEEE Trans. Transp. Electrif. 2022, 8, 4633–4645. [Google Scholar] [CrossRef]
- Jiang, B.; Zhu, J.; Wang, X.; Wei, X.; Shang, W.; Dai, H. A comparative study of different features extracted from electrochemical impedance spectroscopy in state of health estimation for lithium-ion batteries. Appl. Energy 2022, 322, 119502. [Google Scholar] [CrossRef]
- Zhu, J.G.; Sun, Z.C.; Wei, X.Z.; Dai, H.F. A new lithium-ion battery internal temperature on-line estimate method based on electrochemical impedance spectroscopy measurement. J. Power Sources 2015, 274, 990–1004. [Google Scholar] [CrossRef]
- Beelen, H.P.G.J.; Raijmakers, L.H.J.; Donkers, M.C.F.; Notten, P.H.L.; Bergveld, H.J. An improved impedance-based temperature estimation method for Li-ion batteries. IFAC-Pap. Online 2015, 48, 383–388. [Google Scholar] [CrossRef]
- Mc Carthy, K.; Gullapalli, H.; Kennedy, T. Real-time internal temperature estimation of commercial Li-ion batteries using online impedance measurements. J. Power Sources 2022, 519, 230786. [Google Scholar] [CrossRef]
- Li, R.; Wu, J.; Wang, H.; Li, G. Prediction of state of charge of Lithium-ion rechargeable battery with electrochemical impedance spectroscopy theory. In Proceedings of the 2010 5th IEEE Conference on Industrial Electronics and Applications, Taichung, Taiwan, 15–17 June 2010; pp. 684–688. [Google Scholar]
- Schmidt, J.P.; Arnold, S.; Loges, A.; Werner, D.; Wetzel, T.; Ivers-Tiffee, E. Measurement of the internal cell temperature via impedance: Evaluation and application of a new method. J. Power Sources 2013, 243, 110–117. [Google Scholar] [CrossRef]
- Beelen, H.P.G.J.; Raijmakers, L.H.J.; Donkers, M.C.F.; Notten, P.H.L.; Bergveld, H.J. A comparison and accuracy analysis of impedance-based temperature estimation methods for Li-ion batteries. Appl. Energy 2016, 175, 128–140. [Google Scholar] [CrossRef]
- Spinner, N.S.; Love, C.T.; Rose-Pehrsson, S.L.; Tuttle, S.G. Expanding the Operational Limits of the Single-Point Impedance Diagnostic for Internal Temperature Monitoring of Lithium-ion Batteries. Electrochim. Acta 2015, 174, 488–493. [Google Scholar] [CrossRef]
- Richardson, R.R.; Ireland, P.T.; Howey, D.A. Battery internal temperature estimation by combined impedance and surface temperature measurement. J. Power Sources 2014, 265, 254–261. [Google Scholar] [CrossRef]
- Srinivasan, R. Monitoring dynamic thermal behavior of the carbon anode in a lithium-ion cell using a four-probe technique. J. Power Sources 2012, 198, 351–358. [Google Scholar] [CrossRef]
- Waag, W.; Fleischer, C.; Sauer, D.U. Critical review of the methods for monitoring of lithium-ion batteries in electric and hybrid vehicles. J. Power Sources 2014, 258, 321–339. [Google Scholar] [CrossRef]
- Zhuang, Q.; Yang, Z.; Zhang, L.; Cui, Y. Research Progress on Diagnosis of Electrochemical Impedance Spectroscopy in Lithium Ion Batteries. Prog. Chem. 2020, 32, 761–791. [Google Scholar] [CrossRef]
- Yamashiro, S.; Nakamura, K. Equivalent Circuit Model for Electric Double Layer Capacitors and its Applications. Electr. Eng. Jpn. 2012, 180, 29–37. [Google Scholar] [CrossRef]
- von Srbik, M.-T.; Marinescu, M.; Martinez-Botas, R.F.; Offer, G.J. A physically meaningful equivalent circuit network model of a lithium-ion battery accounting for local electrochemical and thermal behaviour, variable double layer capacitance and degradation. J. Power Sources 2016, 325, 171–184. [Google Scholar] [CrossRef]
- Waag, W.; Kaebitz, S.; Sauer, D.U. Experimental investigation of the lithium-ion battery impedance characteristic at various conditions and aging states and its influence on the application. Appl. Energy 2013, 102, 885–897. [Google Scholar] [CrossRef]
- Feng, F.; Yang, R.; Meng, J.; Xie, Y.; Zhang, Z.; Chai, Y.; Mou, L. Electrochemical impedance characteristics at various conditions for commercial solid-liquid electrolyte lithium-ion batteries: Part. 2. Modeling and prediction. Energy 2022, 243, 123091. [Google Scholar] [CrossRef]


| Model | 18650 |
|---|---|
| Nominal capacity | 3500 mAh |
| Nominal voltage | 3.7 V |
| Anode material | Li(NiCoMn)O2 |
| Cathode material | Plumbago |
| Battery internal resistance | 25 mΩ |
| Charge cut-off voltage | 4.2 V |
| Discharge cut-off voltage | 2.5 V |
| Charge cut-off current | 0.02 C |
| Format | Cylindrical, 18650 |
| Weights | 48 g |
| Operating temperature range | Charge: 10–45 °C Discharge: −20–60 °C |
| Parameters | ||||||||
|---|---|---|---|---|---|---|---|---|
| Error (%) | 0.26 ± 0.08 | 0.11 ± 0.05 | 0.73 ± 0.07 | 1.82 ± 0.3 | 0.63 ± 0.07 | 0.13 ± 0.06 | 3.34 ± 0.5 | 0.97 ± 0.1 |
| Source | SS | df | MS | F | p-Value |
|---|---|---|---|---|---|
| T | 0.00140 | 6 | 0.00023 | 1.09657 | 0.36843 |
| SOC | 0.00422 | 20 | 0.00021 | 0.98801 | 0.48144 |
| Errors | 0.02559 | 120 | 0.00021 | ||
| Total | 0.03121 | 146 |
| Source | SS | df | MS | F | p-Value |
|---|---|---|---|---|---|
| T | 2.87871 | 6 | 0.47978 | 94.39260 | 4.69503 × 10−43 |
| SOC | 0.17989 | 20 | 0.00899 | 1.76963 | 0.03160 |
| Errors | 0.60994 | 120 | 0.00508 | ||
| Total | 3.66855 | 146 |
| Source | SS | df | MS | F | p-Value |
|---|---|---|---|---|---|
| T | 9.17838 | 6 | 1.529731 | 8.636748 | 8.21953 × 10⁻⁸ |
| SOC | 9.14384 | 20 | 0.457192 | 2.581271 | 0.000802 |
| Errors | 21.25426 | 120 | 0.177119 | ||
| Total | 39.57648 | 146 |
| Ranges | Temperature Range (°C) | SOC Range (%) | Frequency (Hz) | R2 | RMSE | ||||
|---|---|---|---|---|---|---|---|---|---|
| Narrow | [0, 20] | [40, 60] | 3100 | 2.8700 | 0.4097 | −0.0001 | 0.0001 | 0.91471 | 0.00324 |
| 20 | 1.1437 | 0.2781 | −0.0005 | 0.0001 | 0.97675 | 0.00712 | |||
| 1 | 0.3186 | 0.2959 | −0.0011 | 0.0003 | 0.95078 | 0.02019 | |||
| Wide | [−20, 20] | [20, 80] | 3100 | 1.4471 | 0.1018 | −0.0005 | 0.0000 | 0.75294 | 0.06018 |
| 20 | 0.3086 | 0.0535 | −0.0012 | 0.0001 | 0.84957 | 0.05514 | |||
| 1 | \ | \ | \ | \ | \ | \ |
Disclaimer/Publisher’s Note: The statements, opinions and data contained in all publications are solely those of the individual author(s) and contributor(s) and not of MDPI and/or the editor(s). MDPI and/or the editor(s) disclaim responsibility for any injury to people or property resulting from any ideas, methods, instructions or products referred to in the content. |
© 2024 by the authors. Licensee MDPI, Basel, Switzerland. This article is an open access article distributed under the terms and conditions of the Creative Commons Attribution (CC BY) license (https://creativecommons.org/licenses/by/4.0/).
Share and Cite
Xiao, Y.; Huang, X.; Meng, J.; Zhang, Y.; Knap, V.; Stroe, D.-I. Electrochemical Impedance Spectroscopy-Based Characterization and Modeling of Lithium-Ion Batteries Based on Frequency Selection. Batteries 2025, 11, 11. https://doi.org/10.3390/batteries11010011
Xiao Y, Huang X, Meng J, Zhang Y, Knap V, Stroe D-I. Electrochemical Impedance Spectroscopy-Based Characterization and Modeling of Lithium-Ion Batteries Based on Frequency Selection. Batteries. 2025; 11(1):11. https://doi.org/10.3390/batteries11010011
Chicago/Turabian StyleXiao, Yuechan, Xinrong Huang, Jinhao Meng, Yipu Zhang, Vaclav Knap, and Daniel-Ioan Stroe. 2025. "Electrochemical Impedance Spectroscopy-Based Characterization and Modeling of Lithium-Ion Batteries Based on Frequency Selection" Batteries 11, no. 1: 11. https://doi.org/10.3390/batteries11010011
APA StyleXiao, Y., Huang, X., Meng, J., Zhang, Y., Knap, V., & Stroe, D.-I. (2025). Electrochemical Impedance Spectroscopy-Based Characterization and Modeling of Lithium-Ion Batteries Based on Frequency Selection. Batteries, 11(1), 11. https://doi.org/10.3390/batteries11010011