Abstract
As the preferred technology in the current energy storage field, lithium-ion batteries cannot completely eliminate the occurrence of thermal runaway (TR) accidents. It is of significant importance to employ real-time monitoring and warning methods to perceive the battery’s safety status promptly and address potential safety hazards. Currently, the monitoring and warning of lithium-ion battery TR heavily rely on the judgment of single parameters, leading to a high false alarm rate. The application of multi-parameter early warning methods based on data fusion remains underutilized. To address this issue, the evaluation of lithium-ion battery safety status was conducted using the cloud model to characterize fuzziness and Dempster–Shafer (DS) evidence theory for evidence fusion, comprehensively assessing the TR risk level. The research determined warning threshold ranges and risk levels by monitoring voltage, temperature, and gas indicators during lithium-ion battery overcharge TR experiments. Subsequently, a multi-parameter fusion approach combining cloud model and DS evidence theory was utilized to confirm the risk status of the battery at any given moment. This method takes into account the fuzziness and uncertainty among multiple parameters, enabling an objective assessment of the TR risk level of lithium-ion batteries.
1. Introduction
The lithium-ion battery (LIB), prized for its high energy density, lightweight design, and eco-friendly attributes, stands as the preferred technology in the realm of energy storage. Its applications span across various domains, including mobile electronic devices, medical equipment, electric vehicles, and energy storage systems. Yet, amidst this broad range of utilization, safety concerns must not be underestimated. Between 2017 and 2022, over 14 incidents of fire and explosion accidents occurred in energy storage stations. Present warning methodologies for LIBs hinge on distinct threshold models for diverse parameters like voltage, temperature, and gas production. Based on the evolution of internal reaction, thermal runaway (TR) can be categorized into different stages. Randolph et al. [] segmented the TR of LIB into four stages based on internal reactions. At present, there are several methods for monitoring and warning based on multiple parameters, with the conventional single-parameter threshold determination being a prevalent approach.
1.1. Early Warning Technology Based on External Parameters
Sensors enable monitoring of parameters such as voltage and temperature during battery use, which allows for thermal runaway warning based on anomalies detected in these monitored parameters. Xia et al. [] utilized multi-voltage sensors and algorithms to monitor the operational status of each battery in a battery pack. Jia et al. [] employed K-type thermocouples and fiber Bragg grating (FBG) sensors to monitor temperature variations at three different positions of LIB, enabling temperature warnings for TR. Nascimento et al. [,] proposed a network comprising 37 FBG sensors to prevent severe consequences of TR incidents and enhance battery safety. However, accurately assessing internal chain reactions remains difficult due to the challenge of measuring the difference between internal and surface temperatures. Current monitoring of battery voltage and surface temperature is insufficient to effectively prevent battery failure [].
1.2. Early Warning Technology Based on Surface Strain of the Battery
Peng et al. [] developed a high-precision strain sensor with 11.5 times greater sensitivity compared to FBG sensors. Chen et al. [] used strain gauges to detect surface strain changes in batteries under thermal abuse, finding earlier detection compared to conventional electrical signals. However, due to the closed nature of lithium-ion batteries, external parameters cannot accurately reflect internal electrochemical reactions or assess thermal runaway risks precisely.
1.3. Early Warning Technology Based on Internal Temperature, Pressure, and Impedance
Raghavan et al. [] showed that embedded FBG temperature sensors can accurately measure internal battery temperatures. Lyu et al. [] identified a shift in impedance spectrum from negative to positive within the 30 Hz to 90 Hz frequency range and used this change to develop an early warning system for thermal runaway based on impedance frequency slope variations. Mei et al. [] developed a fiber optic sensor tailored for insertion into commercial 18650 batteries, which enables continuous monitoring of internal temperature and pressure during TR, issuing warnings before safety valves are triggered.
1.4. Early Warning Technology Based on Characteristic Gases
Cai et al. [] suggested CO2 as a characteristic gas in TR scenarios, verified and established thresholds with sensors. Jin et al. [] demonstrated that H2 can serve as an early safety warning indicator through overcharging experiments with LIB packs. Threshold determination methods involve setting upper and lower limits for various battery parameters. When parameters collected by on-site sensors exceed the established range, an alert is triggered.
1.5. Early Warning Technology Based on Neural Networks
Conversely, AI-based monitoring and warning predict potential battery anomalies by establishing various types of network models. Jiang et al. [] employed LSTM-RNN and GRU-RNN to achieve accurate real-time battery temperature estimation, with a maximum absolute error of about 0.75 °C. Zhang et al. [] established a data-driven MMTPFNN model for forecasting TR propagation when battery temperature exceeds 60 °C, while employing an LSTM model for regular temperature prediction. This method enables more precise prediction of battery temperature, but still relies on a single parameter for early warning, which may not avoid errors such as false negatives.
In the realm of monitoring and early warning technologies for lithium-ion battery thermal runaway, parameters such as voltage, temperature, gas, impedance, and pressure are typically monitored to facilitate early warning. However, these parameters are often treated as independent, and effective integration methods for comprehensive analysis remain lacking. When employing a solitary parameter threshold model for monitoring and warning of battery TR, there is a lack of adequate description regarding the interplay of parameters’ fuzziness. Dealing with this fuzziness issue involves subjectivity, posing challenges in acquiring a thorough and objective understanding of TR. And this undermines the precision and dependability of TR warning system.
The cloud model is an evaluation method that transforms qualitative concepts into quantitative descriptions, addressing the fuzziness and uncertainty between qualitative concepts and quantitative descriptions. The Dempster–Shafer (DS) evidence theory is a typical method used to analyze and fuse uncertain information. Xiang et al. [] proposed a multi-sensor data fusion method based on the cloud model and improved evidence theory. By integrating evidence similarity and credibility, this method enhances fusion accuracy. Validation through early indoor fire detection demonstrates that the approach achieves higher detection precision and reduced false alarm rates.
To address the issues of ambiguity and randomness in assessment, a novel multi-parameter warning method based on cloud model and DS evidence theory was proposed to evaluate the TR risk of LIB in this paper. Based on the empirical model derived from previous TR experiments, three-level warning thresholds are established to categorize thermal runaway risk levels. By applying cloud models to illustrate the degree of involvement within each of the three risk levels and employing Dempster’s combination rule for the fusion of data from various sensors, uncertainty was converted into basic probability assignment (BPA). This procedure produces the mass function, belief function, and plausibility function for the TR risk level of LIBs. As a result, the TR risk level of LIBs can be evaluated at any specific moment based on these findings.
Based on the voltage, temperature, gas multi-parameter variations, a multi-level warning strategy was developed to map thermal runaway risks through different warning stages. By integrating the cloud model with DS evidence theory, this approach combines multiple parameters to assess risk levels, reducing subjective influences and enhancing early warning accuracy. This method offers new insights and techniques for thermal runaway monitoring and early warning.
2. Thermal Runaway Experiment for Lithium-Ion Batteries
2.1. TR Test Apparatus Setup
In the previous study, a thermal runaway experiment was conducted on LIBs using 20 Ah LFP batteries (with a cutoff current of 2 A and a cutoff voltage of 2.5 V). Figure 1 shows the setup of the overcharge test platform. The entire overcharge test process was carried out in an explosion-proof box, and a camera positioned in front of the explosion-proof glass was used to record the experimental phenomena. A battery testing system (BTS, Neware BTS-50 V/20 A, Shenzhen, China) was employed for the charging and discharging cycles of the battery, as well as for recording the voltage data during the overcharge test. During the test, 3 K-type thermocouples (1 mm in diameter) were used to measure the surface temperature of the battery, with measurement points indicated as Tc1-Tc3 in Figure 1. A gas analyzer (Shenzhen Qi’an Technology Co., Ltd., Shenzhen, China) was used, with a gas pipe inserted above the battery’s safety valve. An air pump was used to draw the gas produced by the battery into H2 sensor (0–2000 ppm, resolution: 1 ppm), VOC sensor (0–100 ppm, accuracy: 0.1%), and CO sensor (0–2000 ppm, resolution: 1 ppm) of the instrument to monitor real-time changes in gas concentration.
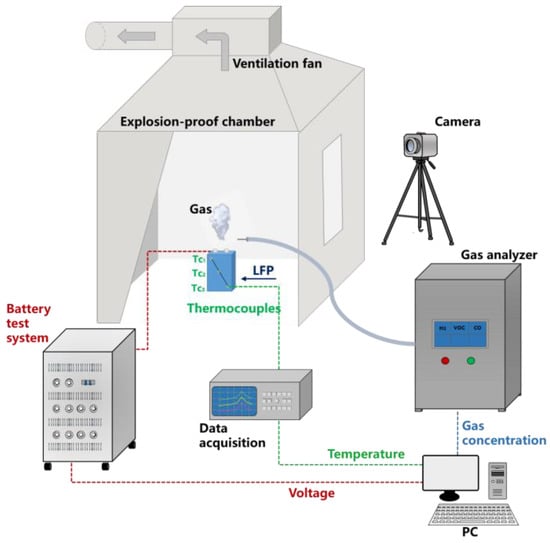
Figure 1.
Setup of the overcharge test platform.
2.2. Experimental Method for TR Test
Before initiating the overcharge tests, the LFP batteries were charged to 100% State of Charge (SOC) using a constant current-constant voltage (CC-CV) protocol with the BTS. Following a resting period, the batteries were placed within an explosion-proof chamber. The BTS was programmed to apply various charge rates for overcharging experiments, including rates of 0.5 C, 0.75 C, and 1 C, as specified in Table 1. The overcharging was continued until the battery voltage experienced a sudden drop to 0, at which point the BTS terminated the overcharging process. During the experiment, the BTS recorded the battery voltage, data acquisition collected the surface temperature data of battery, and the gas analyzer monitored changes in gas concentration. After the cessation of gas emission and a subsequent 4 h stabilization period, data on voltage, temperature, and gas concentrations were gathered to analyze the variations in characteristic parameters throughout the thermal runaway process.

Table 1.
Experimental conditions of the overcharge thermal runaway tests.
2.3. Experimental Results and Discussion
In the TR experiment concerning the overcharge of LIBs, real-time monitoring of key parameters in-cluding voltage, temperature, and gas production was conducted []. As shown in Figure 2, the voltage, temperature, and gas concentration trends under three different overcharge rates (0.5 C, 0.75 C, and 1 C) exhibit similar patterns and the entire process of the LIBs overcharge experiment was segmented into four stages, delineated by specific events such as the emergence of the voltage turning point (VTP), the activation of the safety valve, and the voltage decline.
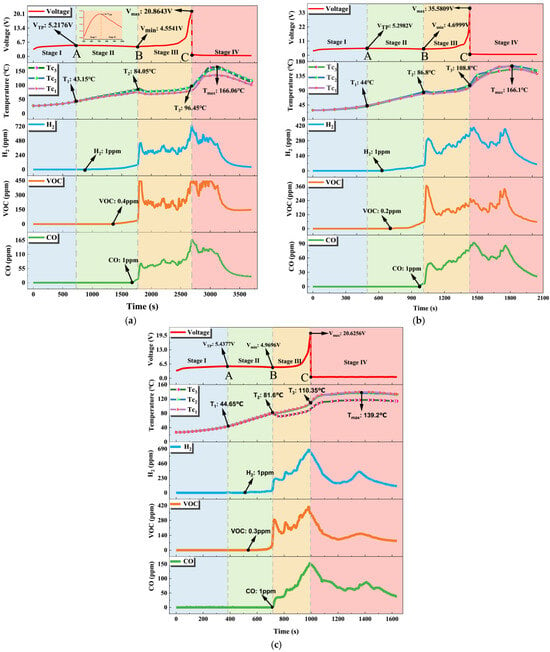
Figure 2.
The segment of the four stages of overcharge TR and the changes in voltage, temperature, and gas concentration in various overcharge C-rate: (a) 0.5 C, (b) 0.75 C, (c) 1 C. [].
During stage 1, the lithium-ion battery begins overcharging, leading to a gradual voltage increase until reaching a voltage turning point (VTP). The surface temperature rises slowly to 50 °C, while the voltage curve shows a brief plateau, indicating active material loss.
As overcharging continues in stage 2, the voltage gradually decreases to the minimum voltage (Vmin). Heat generation accelerates, raising the surface temperature above 80 °C and reaching the first temperature peak (T2). Gas analyzers detect H2, VOC, and CO due to gas generation and battery swelling.
In stage 3, the safety valve opens due to excessive electrolyte decomposition, releasing gas and heat and causing a temporary drop in surface temperature. As internal reactions intensify, the temperature rises, and the voltage increases to the maximum voltage (Vmax) associated with thermal runaway. Temperature differences at measurement points indicate internal instability.
During stage 4, separator damage causes lithium dendrite short-circuiting, leading to rapid heat release and intensified side reactions. The battery experiences a voltage drop and thermal runaway, releasing all gases and reaching a second temperature peak (Tmax). The voltage drop precedes the temperature rise, providing a potential early warning indicator.
3. Warning Method Based on Cloud Model and DS Evidence Theory
3.1. Selection of Evaluation Indicators for TR Risk State
Taking the experimental results under a 0.5 C overcharge rate as an example, Table 2 depicts the voltage, temperature, and gas concentration variations throughout the four stages of TR. Meanwhile, Table 3 presents the gas concentration values at critical nodes.

Table 2.
Changes in voltage, temperature, and gas concentration at each stage.

Table 3.
Gas concentration at nodes where an upward trend occurs and end of stage III.
Based on the experimental results under different operating conditions, thermal runaway can be divided into four stages, leading to the proposal of a three-level early warning strategy for thermal runaway:
1. The first-level warning selects the VTP at the transition between the first and second stages as the characteristic parameter, with a value range of (5.2 V, 5.4 V). Considering a certain margin of error, the voltage threshold is set within the range of (5.1 V, 5.5 V).
2. The second-level warning is determined by the maximum safe temperature of 50 °C for the battery pack. With an error margin, the temperature range is set between (48 °C, 55 °C). Based on this temperature range and the time-varying curves of temperature and hydrogen concentration, the hydrogen concentration range is determined to be (2 ppm, 5 ppm).
3. The third-level warning is based on the critical temperature of 80 °C before the battery enters the third stage of thermal runaway after the safety valve opens. Considering an error margin, the temperature range is set between (78 °C, 85 °C). The carbon monoxide concentration range is then determined to be (2 ppm, 10 ppm) based on this temperature range and the time-varying curves of temperature and carbon monoxide concentration.
In this study, overcharge TR is defined as an overcharge TR incident. Three key parameters—voltage, temperature, and gases (H2, CO)—are selected to form the evaluation indicator system, represented by voltage, temperature, H2 concentration, and CO concentration. Based on the three-level warning strategy for TR of LIBs, the risk level is categorized into three levels: L1 for low risk, L2 for medium risk, and L3 for high risk. Figure 3 illustrates the three-level warning strategy for monitoring and warning overcharge TR of LIBs.
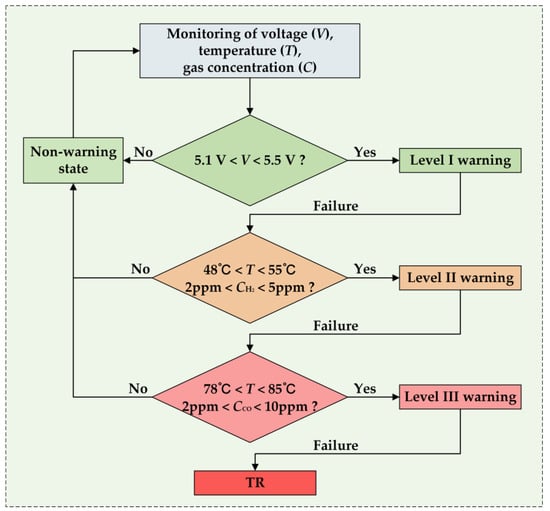
Figure 3.
The three-level warning strategy for TR of LIBs.
3.2. Construction of Multi-Parameter Fusion Model Based on Cloud Model and DS Evidence Theory
In this study, the multi-parameter fusion model was constructed using cloud model and DS evidence theory. Utilizing cloud model facilitates the transformation of qualitative concepts into quantitative descriptions, effectively handling the inherent fuzziness and uncertainty between qualitative and quantitative information. The forward cloud model adeptly converts qualitative concepts into precise quantitative values, while the reverse cloud model transforms quantitative values back into qualitative concepts. The forward cloud model is utilized for safety status of LIB, which is characterized by three characteristic parameters: Ex, En, and He.
where and denote the upper and lower critical values of the threshold interval [,] for LIB under different warning levels.
The membership degree of each sensor measurement value (X1, X2, …, Xn) in the cloud model can be calculated using Equation (4).
The DS evidence theory is a typical approach for fusing and analyzing uncertain information in a same identification framework, without relying on conditional probabilities. represent the decision identification framework, consisting of a finite set of mutually exclusive elements. The basic probabilities , , according to Equation (5):
The variable m represents the basic probability assignment (BPA) function for the recognition framework , also known as the mass function. The mass function is used to calculate the basic probability for each element in the hypothesis space, as shown in Equation (6):
where k denotes the risk level of the evaluated LIB; A is the set of risk levels for the evaluated object; i denotes the sensor index.
According to the BPA, the belief function and plausibility function form a trust interval , representing the degree of confirmation for a specific hypothesis. On the recognition framework , the belief function indicates the possibility of proposition A being true, calculated as the sum of the basic probabilities of all subsets of hypothesis A by Equation (7). The plausibility function on the recognition framework represents the possibility that proposition A is not false, calculated as the sum of the basic probabilities of sets with a non-empty intersection with hypothesis A by Equation (8).
The relationship diagram between the Bel function, Pl function, and the trust interval is shown in Figure 4, where the degree of belief represents the lower bound estimate of the hypothesis credibility, and the degree of plausibility represents the upper bound estimate of the hypothesis credibility.

Figure 4.
The distribution of belief function, plausibility function, and the belief interval.
For n pieces of evidence with n BPAs, the basic probability distribution (BPD) is calculated using Dempster’s rule of combination, as shown in Equation (9). The normalization constant K is calculated by Equation (10).
For the evaluation of TR risk levels of LIBs, three risk levels L1, L2 and L3 are defined, and four evaluation factors, voltage, temperature, H2, and CO concentration, are set for assessment. The distribution set of mass functions for each evaluation factor is given by Equation (11).
where is equivalent to the set , which represents the discernment framework set.
3.3. Decision Procedure for Three-Level TR Early Warning of LIBs
The process for evaluating the TR risk levels of LIBs based on the cloud model and DS evidence theory is illustrated in Figure 5.
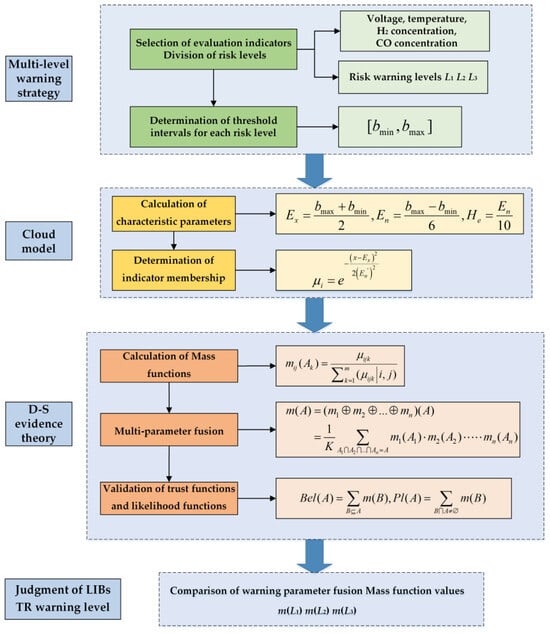
Figure 5.
The process for three-level TR early warning of LIBs.
The process for determining TR risk level of LIBs, combining the cloud model and DS evidence theory, follows this concise procedure:
Step 1: Utilizing actual environmental sensor data at any given moment, determine the cloud characteristic parameters (Ex, En, He) for each evaluation factor under every risk warning level by Equations (1)–(3). Calculate the respective cloud model membership degree based on the measured values and cloud characteristic parameter values for each evaluation factor. This process aims to quantify the degree of attribution of each factor under different conditions, providing foundational data for subsequent risk assessment.
Step 2: Input the membership degrees into DS evidence theory. Construct the BPA function by Equation (6), obtaining the probability distribution of each evaluation factor in the corresponding risk zone. This reflects the possibility of each evaluation factor in different risk areas. Subsequently, use the Dempster combination rule with Equation (9) to obtain the fusion probabilities of each evaluation factor in each risk zone. Combine the information of various evaluation factors, use belief and plausibility functions to validate the credibility of the judgment, improving the accuracy of risk assessment for a more precise determination of the lithium battery’s risk level.
Step 3: Based on different risk levels, determine the corresponding warning levels and take appropriate emergency measures. Develop specific response strategies based on risk assessment to ensure the safe operation of the LIBs system.
4. Empirical Analysis of TR Risk Assessment
To achieve comprehensive monitoring and risk assessment of LIBs during operation, the characteristic parameters—voltage, temperature, and gas—exhibiting patterns during the transition from a normal state to TR are defined as evaluation evidence. Four evaluation factors, including voltage, temperature, H2, and CO concentration, are established. The risk level of thermal runaway is categorized into three levels: L1, L2, and L3.
In Equation (1), the interval represents the evaluation factor threshold range of LIBs under different warning levels, with specific values detailed in Table 4. The calculation of Ex, En, and He for each evaluation factor under each risk warning level is determined by Equations (1)–(3), as shown in Table 5.

Table 4.
The threshold ranges of four evaluation factor at three risk levels.

Table 5.
Cloud characteristic parameters of evaluation factors at three risk levels.
The specific values of battery voltage, temperature, and gas parameters at a certain moment during the overcharge-induced TR experiment are shown in Table 6, serving as an example to validate the multi-parameter fusion early warning method for TR of LIB based on cloud model and DS evidence theory. Subsequently, the membership degrees for each evaluation factor are calculated by Equation (4) and converted into BPAs, as shown in Table 7. Figure 6 shows the marking of this moment on the voltage, temperature, and gas concentration over time curves.

Table 6.
Values of each evaluation factor at a certain moment.

Table 7.
The distribution of BPAs for each evaluation factor at the certain moment.
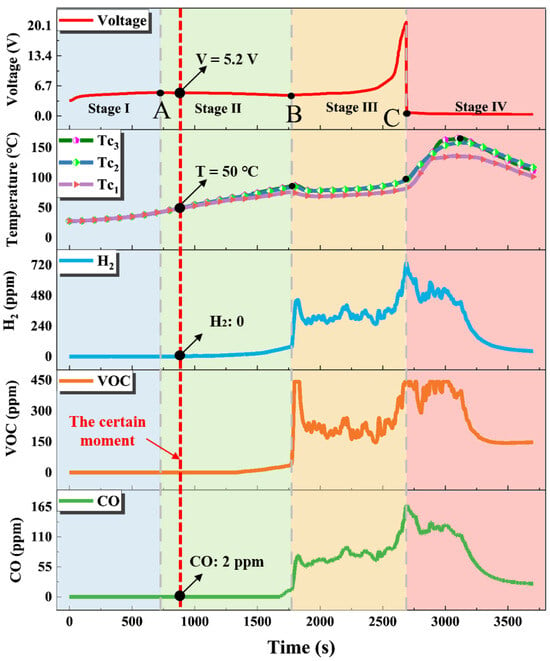
Figure 6.
Voltage, temperature, and gas concentration variation curves with a time marker at the specific moment.
Based on the results from Table 7, the temperature and CO gas concentration indicators have the highest credibility in the middle and high-risk levels. During the TR monitoring and warning process of LIB, it is advisable to enhance real-time monitoring and control of these indicators to improve battery safety management and reduce the probability of TR accidents of LIB. Utilizing the multi-source fusion method, the fusion of evaluation factors is performed by Equations (9) and (10). In Equation (11), the assignment results for the set of mass functions distribution for evaluation factors F1, F2, and F4 are shown in Table 8. The values of K and mass functions for the battery at the three risk levels are derived, as shown in Table 9. Finally, the belief functions and plausibility functions for each risk level are computed by Equations (7) and (8), and the results are displayed in Table 10.

Table 8.
Mass function distribution of sets of evaluation factors at the certain moment.

Table 9.
Values of K and mass function for three risk levels at the certain moment.

Table 10.
Values of belief and plausibility function for three risk levels at the certain moment.
Figure 6 shows that at this time point, the battery is in the second stage of thermal runaway. The voltage of 5.0 V falls within the first-level warning threshold (5.1 V to 5.5 V), the temperature of 50 °C is within the second-level threshold (48 °C to 55 °C), and the CO concentration of 2 ppm is outside the third-level threshold (2 ppm to 10 ppm). Individually, these parameters do not clearly indicate the risk level. However, using the multi-parameter fusion model based on the cloud model and DS evidence theory, the calculated risk levels indicate m(L3) > m(L2) > > m(L1).
Constructing the BPA distribution of different evaluation factors based on actual measurement values, integrating data from multiple sensors, calculating the mass function, and validating by belief functions and plausibility functions, the results indicate the following: at the choosing moment, the LIB is at high risk. Therefore, level III warning is required, and corresponding measures such as cooling the battery, releasing gases, and inspecting and replacing the LIB should be implemented.
5. Conclusions
Based on experiments of overcharge-induced TR of LIB, three warning levels for TR have been established:
- Level I warning: Voltage threshold (5.1 V, 5.5 V);
- Level II warning: Temperature threshold (48 °C, 55 °C) and H2 concentration threshold (2 ppm, 5 ppm);
- Level III warning: Temperature threshold (78 °C, 85 °C) and CO concentration threshold (2 ppm, 10 ppm).
Associating these with low risk (L1), medium risk (L2), and high risk (L3), and using Dempster’s rule of combination along with the voltage, temperature, and gas evaluation factors’ threshold intervals, evidence fusion was executed. Considering the uncertainty of each evaluation factor, actual measured values, and cloud model feature parameters were used to determine the membership degree of each evaluation factor at different risk levels, constructing BPA function for each evaluation factor at various risk levels. This allowed for a comprehensive evaluation of the TR risk level of LIBs.
Using experimental data at a specific moment, including voltage, temperature, and CO gas concentration, we validated the multi-source data fusion method and determined the membership degrees for risk levels L1, L2, and L3 for each evaluation factor. Applying Dempster’s integration rule, we obtained mass function values, with the highest value (m(L3) = 0.455) indicating the high risk of LIB at the moment.
The proposed method, combining cloud model and the DS evidence theory, enhances the accuracy of TR warnings in LIBs. It objectively handles uncertainties in complex environments and sensor measurements, overcoming the limitations of traditional single-parameter threshold models in accounting for the fuzziness of multiple parameters. This approach improves risk evaluation precision and contributes reliable theoretical support for LIB safety evaluation and management.
Author Contributions
Conceptualization, Z.X. and S.L.; methodology, Z.X. and H.W.; validation, H.W.; formal analysis, Z.X.; investigation, H.W. and P.L.; data curation, H.W.; writing—original draft preparation, H.W.; writing—review and editing, P.L. and J.S.; supervision, Y.Z.; funding acquisition, J.S. and X.Z. All authors have read and agreed to the published version of the manuscript.
Funding
This research was supported by the National Key Research and Development Program of China, grant number 2022YFB3803501; the National innovation and entrepreneurship training program for college students, grant number 20230497002; and the Opening Fund of State Key Laboratory of Fire Science (SKLFS), grant number HZ2022-KF08.
Data Availability Statement
The data presented in this study are available on request from the corresponding author.
Acknowledgments
Thanks to the EVE Power Co., Ltd. for their support.
Conflicts of Interest
Authors J.S. and X.Z. were employed by the company EVE Power Co., Ltd. The remaining authors declare that the research was conducted in the absence of any commercial or financial relationships that could be construed as a potential conflict of interest.
References
- Leising, R.A.; Palazzo, M.J.; Takeuchi, E.S.; Takeuchi, K.J. A study of the overcharge reaction of lithium-ion batteries. J. Power Sources 2001, 97–98, 681–683. [Google Scholar] [CrossRef]
- Xia, B.; Mi, C. A fault-tolerant voltage measurement method for series connected battery packs. J. Power Sources 2016, 308, 83–96. [Google Scholar] [CrossRef]
- Jia, T.; Zhang, Y.; Ma, C.; Li, S.; Yu, H.; Liu, G. The early warning for overcharge thermal runaway of lithium-ion batteries based on a composite parameter. J. Power Sources 2023, 555, 232393. [Google Scholar] [CrossRef]
- Nascimento, M.; Ferreira, M.S.; Pinto, J.L. Temperature fiber sensing of Li-ion batteries under different environmental and operating conditions. Appl. Therm. Eng. 2019, 149, 1236–1243. [Google Scholar] [CrossRef]
- Nascimento, M.; Paixão, T.; Ferreira, M.S.; Pinto, J.L. Thermal Mapping of a Lithium Polymer Batteries Pack with FBGs Network. Batteries 2018, 4, 67. [Google Scholar] [CrossRef]
- Hong, J.; Wang, Z.; Yao, Y. Fault prognosis of battery system based on accurate voltage abnormity prognosis using long short-term memory neural networks. Appl. Energy 2019, 251, 113381. [Google Scholar] [CrossRef]
- Peng, J.; Zhou, X.; Jia, S.; Jin, Y.; Xu, S.; Chen, J. High precision strain monitoring for lithium ion batteries based on fiber Bragg grating sensors. J. Power Sources 2019, 433, 226692. [Google Scholar] [CrossRef]
- Chen, S.; Wei, X.; Zhang, G.; Wang, X.; Feng, X.; Dai, H.; Ouyang, M. Mechanical strain signal based early warning for failure of different prismatic lithium-ion batteries. J. Power Sources 2023, 580, 233397. [Google Scholar] [CrossRef]
- Raghavan, A.; Kiesel, P.; Sommer, L.W.; Schwartz, J.; Lochbaum, A.; Hegyi, A.; Schuh, A.; Arakaki, K.; Saha, B.; Ganguli, A.; et al. Embedded fiber-optic sensing for accurate internal monitoring of cell state in advanced battery management systems part 1: Cell embedding method and performance. J. Power Sources 2017, 341, 466–473. [Google Scholar] [CrossRef]
- Lyu, N.; Jin, Y.; Xiong, R.; Miao, S.; Gao, J. Real-Time Overcharge Warning and Early Thermal Runaway Prediction of Li-on Battery by Online Impedance Measurement. IEEE Trans. Ind. Electron. 2022, 69, 1929–1936. [Google Scholar] [CrossRef]
- Mei, W.; Liu, Z.; Wang, C.; Wu, C.; Liu, Y.; Liu, P.; Xia, X.; Xue, X.; Han, X.; Sun, J.; et al. Operando monitoring of thermal runaway in commercial lithium-ion cells via advanced lab-on-fiber technologies. Nat. Commun. 2023, 14, 5251. [Google Scholar] [CrossRef] [PubMed]
- Cai, T.; Valecha, P.; Tran, V.; Engle, B.; Stefanopoulou, A.; Siegel, J. Detection of Li-ion battery failure and venting with Carbon Dioxide sensors. eTransportation 2021, 7, 100100. [Google Scholar] [CrossRef]
- Jin, Y.; Zheng, Z.; Wei, D.; Jiang, X.; Lu, H.; Sun, L.; Tao, F.; Guo, D.; Liu, Y.; Gao, J.; et al. Detection of Micro-Scale Li Dendrite via H2 Gas Capture for Early Safety Warning. Joule 2020, 4, 1714–1729. [Google Scholar] [CrossRef]
- Jiang, Y.; Yu, Y.; Huang, J.; Cai, W.; Marco, J. Li-ion battery temperature estimation based on recurrent neural networks. Sci. China Technol. Sc. 2021, 64, 1335–1344. [Google Scholar] [CrossRef]
- Zhang, W.; Ouyang, N.; Yin, X.; Li, X.; Wu, W.; Huang, L. Data-driven early warning strategy for thermal runaway propagation in Lithium-ion battery modules with variable state of charge. Appl. Energy 2022, 323, 119614. [Google Scholar] [CrossRef]
- Xiang, X.; Li, K.; Huang, B.; Cao, Y. A multi-sensor data-fusion method Based on cloud model and improved evidence theory. Sensors 2022, 22, 5902. [Google Scholar] [CrossRef] [PubMed]
- Zhang, Y.; Li, S.; Mao, B.; Shi, J.; Li, X.; Zhou, L. A multi-level early warning strategy for the LiFePO4 battery thermal runaway induced by overcharge. App. Energy 2023, 347, 121375. [Google Scholar] [CrossRef]
Disclaimer/Publisher’s Note: The statements, opinions and data contained in all publications are solely those of the individual author(s) and contributor(s) and not of MDPI and/or the editor(s). MDPI and/or the editor(s) disclaim responsibility for any injury to people or property resulting from any ideas, methods, instructions or products referred to in the content. |
© 2024 by the authors. Licensee MDPI, Basel, Switzerland. This article is an open access article distributed under the terms and conditions of the Creative Commons Attribution (CC BY) license (https://creativecommons.org/licenses/by/4.0/).