Article

Evaluating a Fe-Based Metallic Glass Powder as a Novel Negative Electrode Material for Applications in Ni-MH Batteries

1
Instituto de Ciencias Físicas, Universidad Nacional Autónoma de México, Av. Universidad s/n, Col. Chamilpa, Cuernavaca 62210, Mexico
2
CONAHCYT-CIATEQ A.C., Av. Manantiales 23-A, Parque Industrial Bernardo Quintana, El Marqués 76246, Mexico
3
CIATEQ A.C., Av. Manantiales 23-A, Parque Industrial Bernardo Quintana, El Marqués 76246, Mexico
4
Facultad de Ciencias Químicas e Ingenierías, Universidad Autónoma del Estado de Morelos, Av. Universidad 1001, Col. Chamilpa, Cuernavaca 62210, Mexico
5
Centro de Investigación en Ingeniería y Ciencias Aplicadas, Universidad Autónoma del Estado de Morelos, Av. Universidad 1001, Col. Chamilpa, Cuernavaca 62209, Mexico
*
Author to whom correspondence should be addressed.
Batteries 2024, 10(9), 312; https://doi.org/10.3390/batteries10090312
Submission received: 17 July 2024 / Revised: 29 August 2024 / Accepted: 29 August 2024 / Published: 1 September 2024

Abstract

:
Metallic glasses (MGs) are a type of multicomponent non-crystalline metallic alloys obtained by rapid cooling, which possess several physical, mechanical, and chemical advantages against their crystalline counterparts. In this work, an Fe-based MG is explored as a hydrogen storage material, especially, due to the evidence in previous studies about the capability of some amorphous metals to store hydrogen. The evaluation of an Fe-based MG as a novel negative electrode material for nickel/metal hydride (Ni-MH) batteries was carried out through cyclic voltammetry and galvanostatic charge–discharge tests. A conventional LaNi5 electrode was also evaluated for comparative purposes. The electrochemical results obtained by cyclic voltammetry showed the formation of three peaks, which are associated with the formation of Fe oxides/oxyhydroxides and hydroxides. Cycling charge/discharge tests revealed activation of the MG electrode. The highest discharge capacity value was 173.88 mAh/g, but a decay in its capacity was observed after 25 cycles, contrary to the LaNi5, which presents an increment of the discharge capacity for all the current density values evaluated, reached its value maximum at 183 mAh/g. Characterization analyses performed by X-ray diffraction, Scanning Electron Microscopy and Raman Spectroscopy revealed the presence of corrosion products and porosity on the surface of the Fe-based MG electrodes. Overall, the Fe-based MG composition is potentially able to work as a negative electrode material, but degradation and little information about storage mechanisms means that it requires further investigation.

1. Introduction

A battery is a device in which chemical energy is converted into electricity and is used to store energy. There are two types of batteries, disposable (primary) and rechargeables (secondary). The advantage of using rechargeable batteries is related to resource conservation and waste mitigation [1]. Nowadays, there are several types of rechargeable batteries, the dominant ones being the Lithium-ion (Li-Ion) and Nickel–Metal Hydride (NiMH) [2,3].
The use of batteries dates back to the 1860s, with the invention of its working principle by George Leclanche, in France, who developed the zinc carbon cell. The NiMH battery was developed in 1960; however, they were not commercially exploited until 1980, when they started to be applied on portables devices and transportation. From 1990 until now, the commercialization of NiMH batteries increased due to several improvements that were reflected in the rise of their energy storage capacity, with respect to the first accumulators, i.e. from 54 Wh/kg to over 100 Wh/kg, being used in recent cylindrical cells. The main requirements that any electrode material must have in NiMH batteries include hydrogen storage ability, suitable metal-to-hydrogen bond strength, both acceptable catalytic activity and discharge kinetics, and sufficient resistance to oxidation/corrosion [4]. To improve the performance of NiMH batteries, several scientific investigations have been carried out in the last decade. For instance, AB5-type metal hydride alloys were the first materials used which reached a capacity of about 310 mAh g−1. AB2 alloys were also an option, due to their high capacity, 390 mAh g−1; nevertheless, these alloys are not widely used, due to their high cost, poor activation, and charge retention [5]. Other materials such as A2B7 alloys have also been tested for battery applications, given that they offer some advantages over AB5 and AB2 such as high capacity, 390 mAh g−1, and high catalytic activity [6].
In the last decade, scientific research has been investigating new materials for different electrochemical accumulators, focusing especially on those materials offering a better compromise among charge density, reduced aging, and fabrication costs. Among several types of materials, MGs have risen as interesting systems. Metallic glasses are amorphous metallic alloys produced via rapid colling of liquid melt (cooling rates of 106 K/s) [7]. Metallic glasses (MGs) are disordered, with the presence of different active sites for electrocatalysis, free from having the structural restrictions in crystals, i.e., grain boundaries, stacking faults, and defects. In the absence of crystalline defects, MGs are corrosion-resistant, while being electrical conductors with favorable properties for electrochemical catalysis [8]. Amorphous metallic materials have been studied since 1960 with a gold–silicon system, followed later by Pd-Si systems; in recent decades, other MG systems such as Zr-, Cu-, Fe-, Co- and Ni-based MGs have also been explored [9]. They exhibit outstanding mechanical, electrochemical and magnetic properties due to their lack of long-range ordered structure, which leads to the absence of dislocations and grain boundaries, i.e., defect-free structure [10,11]. Interestingly, since the late 1960s, magnesium and its alloys have been studied mainly as a store hydrogen, and they are widely known to form metallic hydrides [12]. Amorphization of Mg-based alloys has proved to be an effective way to improve the hydrogen storage properties due to the free volume at atomic scale and interstitial sites available for the hydrogen occupation during charge [13].
It is worth mentioning that some energy storages devices, such as Lithium-ion and zinc–air rechargeable batteries, and some supercapacitors and fuel cells, have already employed MGs as active materials [14]. For example, some lithium-ion rechargeable batteries have used aluminum-based MG alloys as anode material in the past. Al-based MGs can reversibly alloy with lithium without a volume expansion. This fact is an advantage of MGs, since conventional crystalline materials often have very large volume expansion when alloying with Li [10]. Other applications, including MGs, are the electrochemical supercapacitors, which are promising for use in energy storage devices, due to their high-power density and fast charge/discharge rates. Amorphous/nanocrystalline MGs have shown a rise from 3 to 10 times in the capacitance value with respect to what is shown by their crystalline counterparts [15]. On the other hand, bulk MGs have also been explored in fuel cells. For instance, a nickel–molybdenum–niobium MG composition was used as a platinum group metal (PGM)-free option; the optimal Ni52Mo13Nb35 MG composition exhibits an intrinsic exchange current density of 0.35 mA/cm2, outperforming that of a Pt disk catalyst (0.30 mA/cm2). The Ni52Mo13Nb35 composition was also used as an anode that enables power densities of about 390 mW/cm2 in the H2/O2 fuel cell and 253 mW/cm2 in H2/air fuel cells. This composition shows negligible performance degradation over 50 h and 30 h [7,16]. Finally, a study on a rechargeable zinc–air battery explored an AgCu MG alloy as cathode material. The AgCu MG exhibited high electrocatalytic activity and long-term stability after 1000 charge–discharge cycles at 20 mA.cm−2, and the discharge voltages of the Zn-MG battery were shown to be stable at 1.0 V. Currently, this MG composition is considered an alternative to the Pt/C-20% electrode in zinc–air batteries [17].
Fe-based MGs are the most attractive and cost-effective MG compositions in many applications because of their unique combination of excellent physical and chemical properties, ultrahigh strength, and relatively low preparation costs [18]. In addition, Fe-based MG alloys may have intermediate-to-high glass-forming ability, allowing the mass production of powders over different particle size range and elemental compositions [19]. The development and exploitation of Fe-based MGs is still at the stage of basic science in the field of energy storage. Also, it is important to mention that the hydrogen embrittlement in Fe-based metallic glass is a phenomenon underexplored in Ni-MH batteries, which is associated with a corrosion property. So, the aim in this study is to carry out an explorative experimental work on the electrochemical evaluation of a Fe86Si7Cr3B3C1 MG alloy in order to reveal whether this material is able to store hydrogen in KOH in a similar way as LaNi-based alloys do when are they employed in NiMH–electrochemical accumulators.

2. Materials and Methods

A commercial (Fe86Si7Cr3B3C1) Fe-based MG alloy powder (KUAMET 62B, Atmix-Corporation, Japan) and a commercial (La0.8Ce0.2Ni3.5Co0.8Mn0.7) LaNi5-based Mischmetal alloy powder were employed in this work. These powders were mixed with carbon black (10%wt.) and PTFE (5%wt.), which acted as binders. Afterwards, both the Fe-based MG and LaNi5-based Mischmetal alloy were cold-pressed onto a Ni-mesh to obtain the Fe-based MG and LaNi5 negative electrodes, respectively. This mesh often acts as a current collector, and in this work had a thickness of 5 mm and an area of 1 cm2. On the other hand, the positive electrode was prepared by pressing a mixture of Ni(OH)2/PTFE (90/10%wt.) on a Ni mesh of 1.5 cm2. KOH 6M solution was used as electrolyte.

2.1. Electrochemical Techniques

A half-cell was assembled with the negative electrode, positive electrode and a reference electrode (Hg/HgO). The three electrodes were submerged in the electrolyte at room temperature. The electrochemical evaluation was carried out by applying voltammetry cyclic and galvanostatic charge–discharge tests. The parameters used in the voltammetry cyclic tests were recorded between −0.2 V and −1.1 V against the Hg/HgO reference electrode at a scan rate of 1 mV/s. The galvanostatic charge-discharge tests were conducted at different current density values (50, 100 and 125 mA/g). Electrochemical impedance spectroscopy technique was conducted to a frequency range of 10,000 Hz to 0.01 Hz, using a signal amplitude perturbation of 10 mV, and data were obtained to 0, 5 and 10 charge–discharge cycles. Electrochemical measurements were carried out employing a potentiostat/galvanostat GAMRY Interface 1000.

2.2. Characterization Analysis

Characterization of the powders were conducted through a scanning electron microscopy (SEM) model JEOL JSM-IT500 (JEOL, Tokyo, Japan), which was used to reveal their morphology, and X-ray element mapping was obtained and used to determine the degradation of Fe-based metallic glass alloy after cyclic voltammetry. X-ray diffraction analysis (XRD) utilizing a Bruker D2-Phaser diffractometer operating with Cu Kα-1 radiation was carried out on the as-received powder to verify its amorphous nature and any sign of phase transformation after the electrochemical cycling tests.
In addition, Fe86Si7Cr3B3C1 metallic-glasses alloy powder before and after electrochemical evaluation were analyzed by Raman spectroscopy using the software OPUS 7.8 in a Raman SENTERRA II (Bruker) coupled to an Olympus microscope (20X objective). It used a laser of 785 nm, a power of 100 mW, and an acquisition time of 10,000 ms in a range of 100 to 3500 cm−1.

3. Results and Discussion

3.1. Characterization of the Fe-Based MG and LaNi5 Powders

Figure 1a displays the SEM analysis of the Fe-based MG powder. This powder presents a rounded and spherical morphology with the smooth surfaces that are typical of gas-atomized powders. This Fe-based MG powder has a particle size distribution in the range between 5 μm and 100 μm and an average particle size of 30 μm, as it was reported previously [20]. Figure 1b shows the XRD analysis of the Fe-based MG powder. This diffractogram displays a broad halo that is common in amorphous materials. No other peaks associated with crystalline phases are observed. This result has also been reported in previous works [20]. On the other hand, Figure 1c shows the SEM analysis of the LaNi5 alloy. This powder presents an irregular morphology with some acicular particles. These characteristics are often found in fragile powders that are prepared by milling process. The particle size distribution of the LaNi5 powder ranges from 9.26 μm to 44.39 μm and has an average size of 28.29 μm, as was reported previously [21]. In addition, the XRD analysis of the LaNi5 powder shown in Figure 1d presents a characteristic pattern of a crystalline material with the peaks associated with the LaNi5,without other peaks related to secondary phases.

3.2. Electrochemical Results

3.2.1. Cyclic Voltammetry

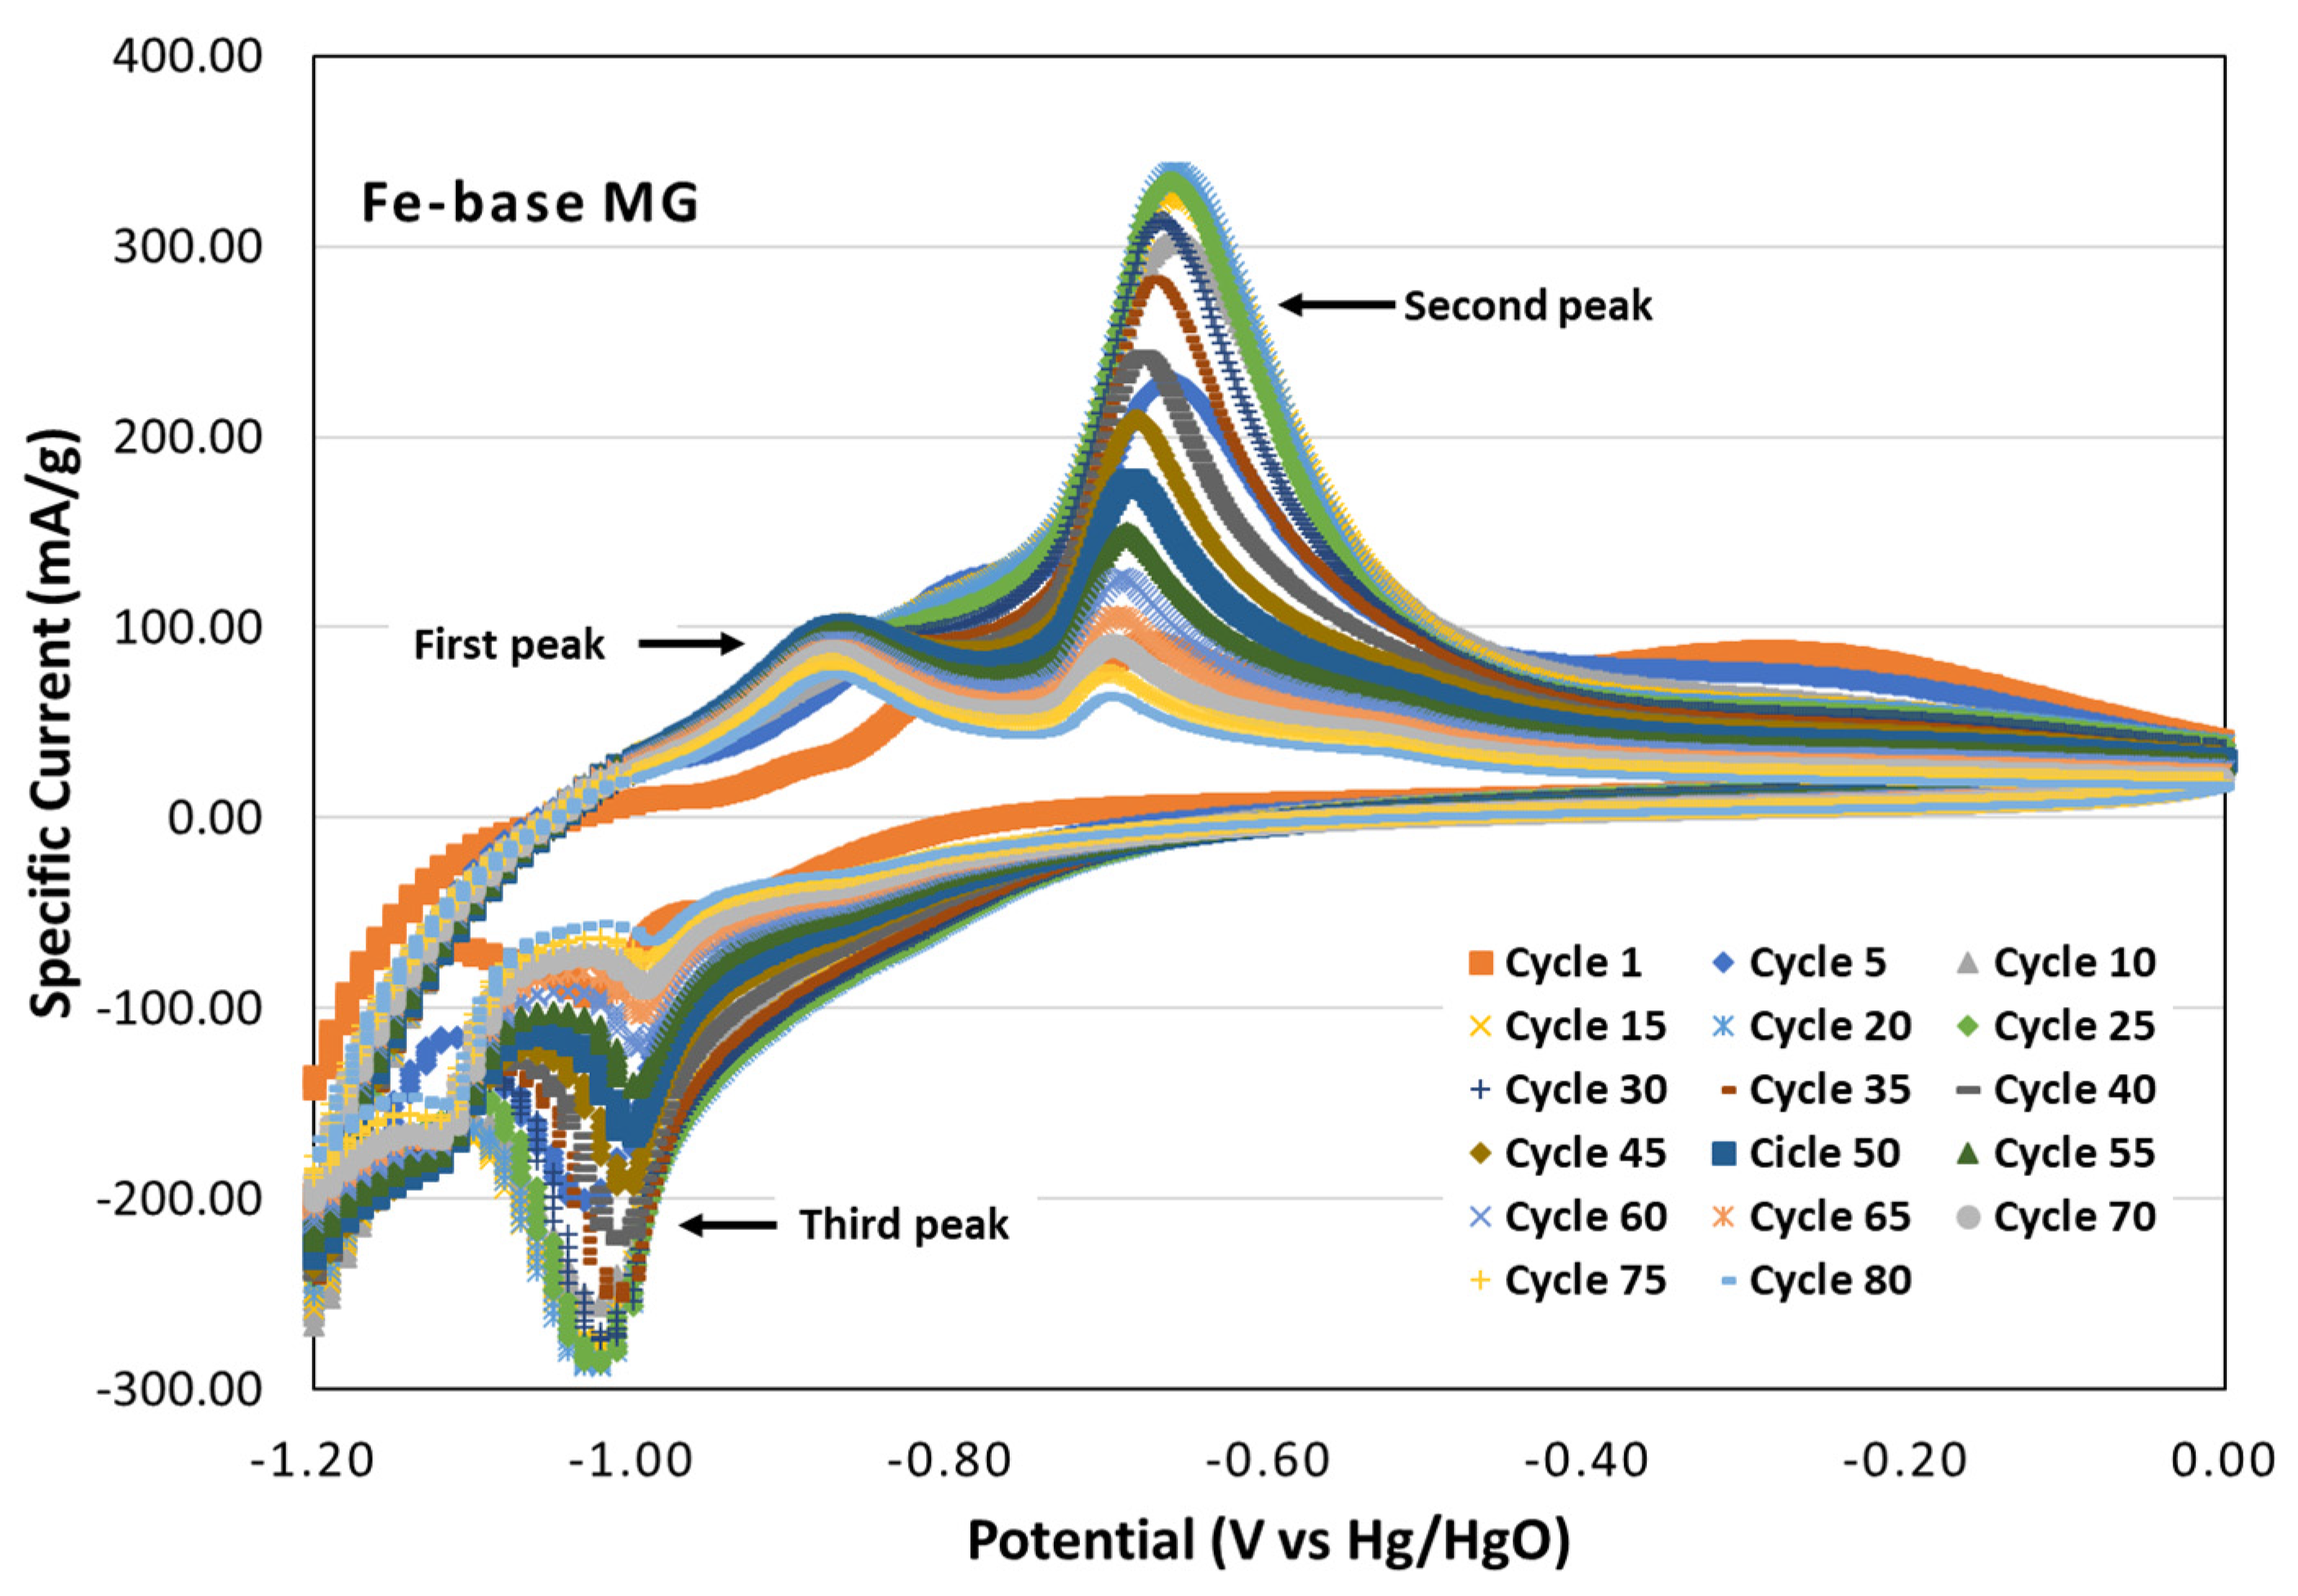
Figure 2 shows the cyclic voltammogram of the Fe-based MG electrode in KOH 6M for 80 cycles. Interestingly, the voltammogram has a cathodic and anodic branch, which confirms the occurrence of reduction and oxidation processes occurring by the interaction of the Fe-based MG and the electrolyte under the experimental condition studied. One of the key points in this investigation is to find out the corresponding process in the Fe-based MG associated with each peak of the voltammogram. Clearly, it is possible to observe three peaks in a potential range between −0.4 and −1.1 V (vs. Hg/HgO), with two peaks in the anodic branch (oxidation zone). The first peak is located at −0.9 V and corresponds to the oxidation of the metallic iron (Fe0) to ferrous ion (Fe2+), that may be associated with the formation of iron (II) hydroxide, as represented by Equation (1). The second sharp peak is located at −0.65 V, corresponding to the formation of δ-FeOOH, iron oxides (Fe3O4 or Fe2O3) or their mixtures, as represented by Equations (2)–(4). The third peak in the cathodic branch (reduction zone) corresponds to the reduction (reverse reaction) of ferrous ion (Fe2+) to metallic iron (Fe0), as suggested by Equation (1) [22,23]. Basically, Equation (1) illustrates the reaction associated with discharging (Fe + 2OH) and charging [Fe(OH)2 + 2e ] for the Fe-based electrode under alkaline conditions [24].
Fe + 2OH ↔ Fe(OH)2 + 2e
Fe(OH)2 + OH ↔ δ-FeOOH + H2O + e
3Fe(OH)2 + 2OH ↔ Fe3O4 + 4H2O + 2e
2Fe3O4 + 2OH ↔ 3Fe2O3 + H2O + 2e
It is worth mentioning that these electrochemical reactions, Equations (1)–(3), have been reported whenever iron is exposed under strong alkaline conditions (KOH or NaOH). On the other hand, at −1.2 V, the beginning of a hydrogen evolution reaction is observed (H2O+e ⇆ OH + Had), and is related to a reduction peak which is associated with the first oxidation peak; this reaction acts as a source of OH [25]. It is well-known that, during the charging of an iron electrode (under alkaline condition), the water is decomposed to yield hydrogen (see Equation (5)). However, such decomposition may affect the overall performance of the battery, due to the occurrence of parasitic currents associated with the evolution of hydrogen.
2H2O + 2e ↔ H2 + 2OH
Therefore, previous studies recommend suppressing hydrogen evolution at the iron electrode during the charge process because it lowers the round-trip energy efficiency and may lead to the promotion of the loss of water from the electrolyte. Thus, suppressing hydrogen evolution at the iron electrode has far-reaching benefits of raising the overall energy efficiency, lowering the cost, and increasing the ease of implementation of iron-based batteries in large-scale energy storage systems [24].
The second sharp peak in the anodic zone, at −0.65 V, is related to the surface oxidation of the Fe-based particles, which shows a displacement to positive values in the oxidation peak potential. The displacement of the peak towards more positive potential values is associated with an increment in the oxidation, due to absorbed hydrogen on the electrode surface, which lead to the formation of Fe(OH)2 followed by further oxidation to form FeOOH at more positive potentials [26,27]. This sharp peak increased and reached its higher value (339 mA/g) around 25 cycles. Afterwards, the specific current decreased and had a value of 62 mA/g at 80 cycles. The increment of the specific current at 25 cycles is associated with a modification of the surface. The surface area increased as a result of etching related to the presence of KOH as a strong base solution. This fact likely promoted the formation of micro-cracks and fragmentation of iron particles, leading to an increase in the anodic peak current and improvement in the capacity and electrocatalytic activity of the electrode [28]. However, the current decreased after 25 cycles, maybe attributed to an increment in the oxidation of the material, resulting in the formation of a thin and anhydrous passivated-oxide layer. This fact reduces the hydrogen storage capacity of the material and restricts the hydrogen diffusion from the surface to the bulk of the alloy, i.e., decreasing the electrocatalytic activity [8,25,29]. However, an oxidation peak with sharp form indicates that oxidation reaction of the absorbed hydrogen (Hab + OH → H2O + e) at the Fe-based MG electrode can be lead smoothly [30].
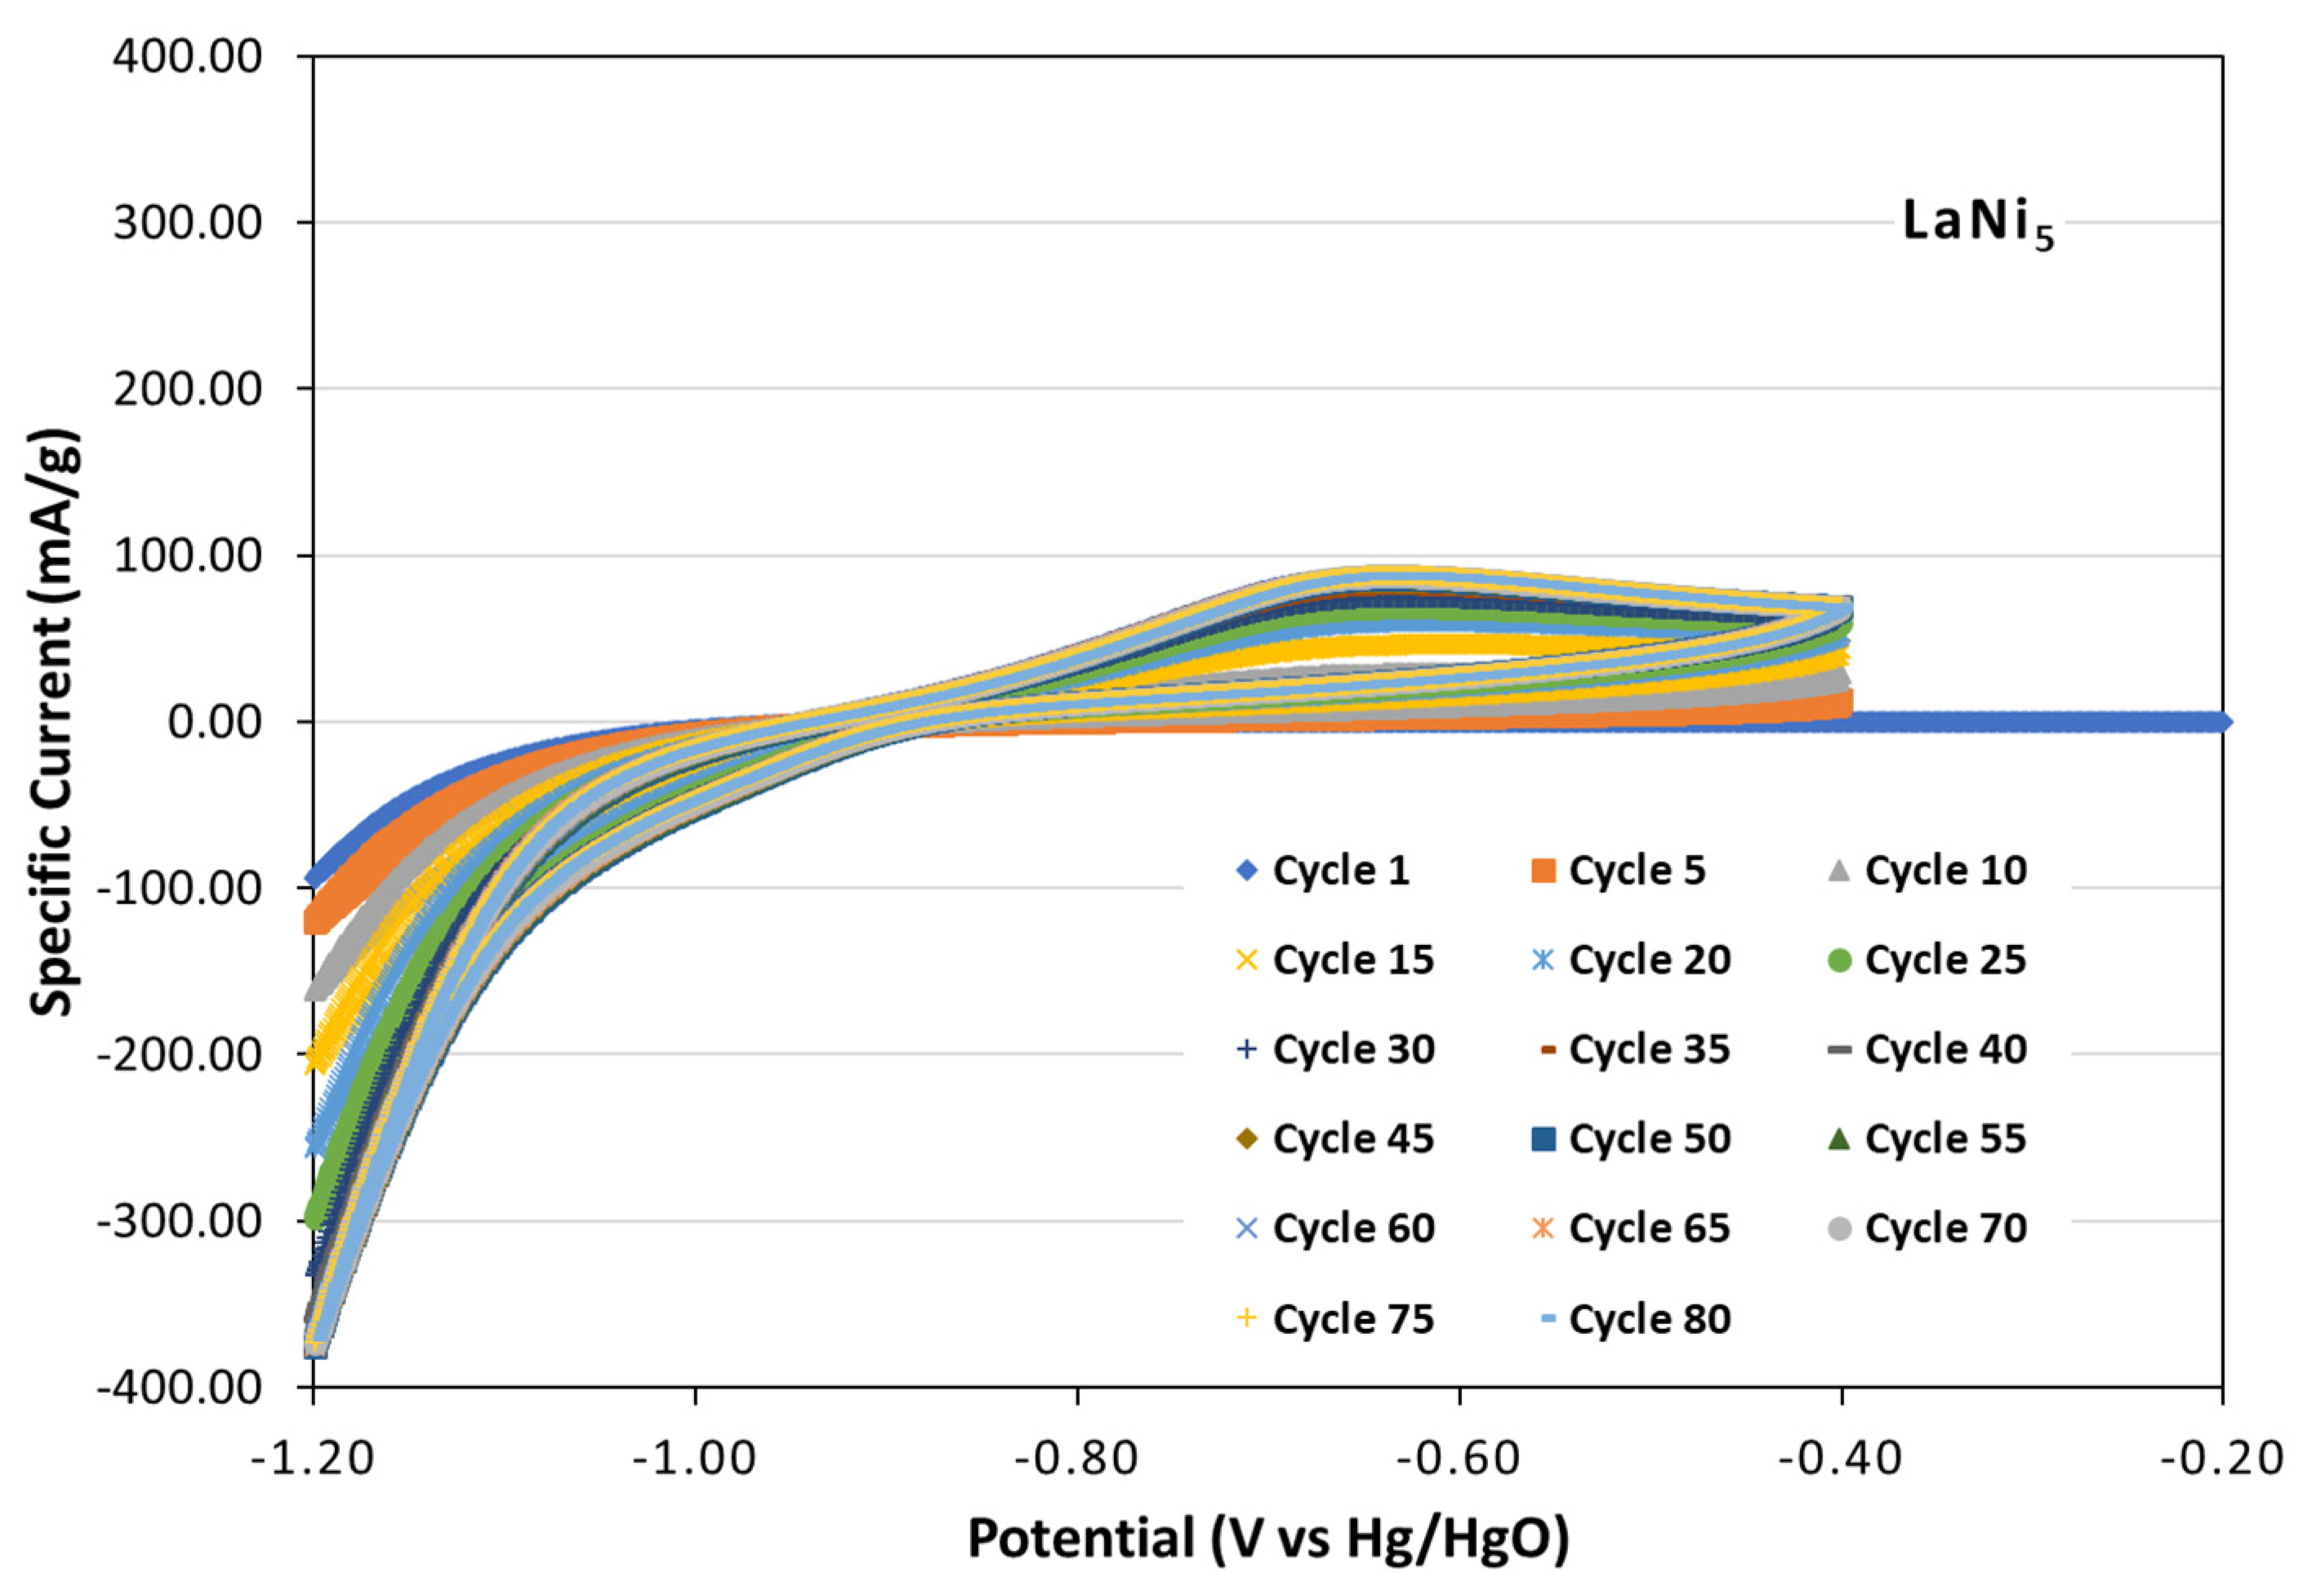
Figure 3 shows a typical cyclic voltammogram of a LaNi5-type electrode in 6M KOH. In metal hydride alloys, oxidation and reduction peaks are often associated with an electrochemical hydrogen desorption/absorption process, respectively. For example, in Figure 3, a broad anodic peak that is located around –0.65 V is often related to the oxidation of absorbed hydrogen. This peak continuously increases from cycle 1 until cycle 80, reaching a specific current of about 90 mA/g. This fact is associated with the rise in the amount of absorbed hydrogen. One can note the width of the anodic peak, which indicates an oxidation process owing to the absorbed hydrogen, Hab + OH → H2O + e [28,30]. Overall, cyclic voltammograms may be interpreted as a measure of the discharge capacity of hydrogen storage materials via electrochemistry. Some authors associate the area under the curve in the positive side of the voltammogram with the discharge capacity of these materials [21]. In this manner, the LaNi5 electrode displays an increase of its capacity with the rise in the cycles. This result may indicate the electrochemical activation of the material associated with the insertion of the hydrogen within the interstitial sites of the intermetallic phase, as reported elsewhere [31]. Comparing both the Fe-based MG and LaNi5 voltammograms, the activation processes seem to be alike. However, the Fe-based MG does not have a crystalline structure, and it is very interesting how this activation occurs; it might be related to the free-volume concept in MGs that has been responsible for hydrogen absorption in Al-based MGs [10]. Further electrochemical, morphological and structural characterization will be presented in the following sections, to gain a better understanding of what happens in the electrochemical cycling of the Fe-based MG electrode.

3.2.2. Galvanostatic Charge/Discharge Tests

Figure 4 shows the galvanostatic discharge capacity as a function of cycle number for the Fe-based MG and LaNi5 electrodes, respectively, at current density values of 50, 100 and 125 mAh/g. The results reveal, for the Fe-based MG, a low discharge capacity value that increased with the rise of the cycles, in a similar way to that observed in the voltammograms. This behavior was also similar to that obtained for the LaNi5 electrode. Despite the amorphous nature of the Fe-based MG, no activation was needed for this material. This behavior displays an initial electrochemical activity of the amorphous electrode, which has also been observed in another MG alloy [32].
In Ni-MH batteries, the electrochemical reaction mechanism of metal hydride electrodes is carried out in two steps, starting with a charge-transfer reaction at the surface of the electrode and followed by a mass-transfer reaction that involves hydrogen diffusion within the intermetallic alloy. In general, hydrogen absorption involves a cooperative effect of many microscopic processes, such as the dissociation of the molecular H2 on the metal surfaces into atomic H species. The hydrogen atoms are adsorbed at the surfaces of the alloy in the charging process to form the adsorbed hydrogen atoms (Hads); afterwards, the adsorbed hydrogen atoms diffuse within the alloy to become absorbed hydrogen atoms (Habs), and then the nucleation and growth process of the hydride phase in the metal is completed. The hydrogen desorption process involves a reverse process in the hydride phase [33]. The hydrogen diffusion reaction dominates the electrode high-rate charge/discharge capability; in other words, the diffusion reaction is the rate-determining reaction [34]. Both reactions in the MH electrode are carried out in a solid-phase reaction taking place at the interface between the MH alloy powder and electrolyte [35].
Nowadays, there are still no universal rules for hydrogen occupation in multi-element amorphous alloys because of the difficulty of determining their hydrogenated amorphous structure. It is well-known that alloys like LaNi5 (AB5 type) can form metallic hydride, but amorphous alloys may or may not form metallic hydride, and this can be determined by the pressure-composition isotherm (PCI) curve. Hydrogenation of amorphous alloys depend on the composition and hydrogenation conditions. The hydrogen-storage amorphous alloy can be classified into three types: the solid solution of hydrogen, amorphous hydrides with phase separation, and the crystalline hydride. The solid solution is the classical type, in which the hydrogen inserts into interstitial sites, gradually modifying the atomic distance but not the original site configuration, and hence the PCI curve is a straight oblique line; i.e., this indicates no formation of metallic hydride. The second type is hydrogen-induced amorphous–amorphous phase transformation (HIAAPT), which occurs in the amorphous hydride; and the newly formed amorphous phase produces a structural and composition fluctuation, and so the PCI curve shows a more or less plateau feature, depending on the level of the fluctuation. It is worth mentioning that there are two levels of fluctuation, “slight” and “severe”; the first indicates that the HIAAPT leads to atomic rearrangement in a small range, and the modification is so small that the element aggregation can hardly be observed in a characterization like XRD and TEM, and therefore the plateau in the PCI curve tends towards a line with a large slope, i.e., similar to the solid-solution type. Conversely, “severe” means the HIAAPT produces evidently visible atomic rearrangement. The amorphous hydride has a very different atomic configuration from the original amorphous phase, and therefore the PCI curve tends to show a plateau-like feature; i.e., this behavior indicates the metallic hydride formation. It is worth remarking that the atomic reorganization is based on two conditions: (a) there is no atomic position restriction in the amorphous structure and (b) the configuration of the amorphous alloy has elements keeping a distinct hydrogen affinity. Then, when atomic reorganization occurs, other amorphous phases can be established without any crystallization. These amorphous phases can develop an amorphous metallic hydride, which involves H-rich and H-poor amorphous regions, i.e., regions with distinct hydrogen content. This leads to a concept identified as hydrogen-induced amorphous–amorphous phase separation (HIAAPS), which is a typical type of HIAAPT. HIAAPS can happen in amorphous alloys holding a large amount of strong hydrogen-affined elements. Thus, after hydrogenation there is a phase transformation where the original single amorphous phase is transformed into other amorphous phases (with different hydrogen content) with distinct atomic organization in the amorphous metallic hydrides. Another kind of HIAAPT is correlated to the limited hydrogen occupation sites, which lead to the establishment of amorphous regions due to a different hydrogen content.
Finally, type three is associated with hydrogen-induced crystallization (HIC), which arises during de/hydrogenation, and the PCI curve undoubtedly has a plateau-like region due to the distinct structures of the crystalline and amorphous structures [36]. On the other hand, in a study which carried out measurements on the weight of hydrogen in a metal amorphous Fe-Si-B alloy (Fe40Ni40B20), no weight increase was detected following hydrogenation, which is due to the low solubility (9.91 × 10⁻⁶ to 1.84 × 10⁻⁵ H/M) of hydrogen in the amorphous alloy. The authors mentioned that hydrogen solubility in amorphous alloys that do not contain hydride-forming elements is relatively low and difficult to measure; for example, a hydrogen content as high as 1.0 H/M (hydrogen-to-metal ratio) could be detected by weight measurements in amorphous Zr-based alloys, which in effect are alloys that form metallic hydrides [37]. However, another study evaluated an Fe-Ni-based MG alloy (Fe40Ni38Mo4B18) by the electrochemical permeation method, and determined the weight percent of hydrogen and the corresponding hydrogen-to-metal ratio to be 1.16% and 0.56, respectively [8]. This means that the electrochemical permeation (electrochemical-sorption) method can be more effective than the measurements using the conventional gas permeation (gas-solid reaction) method in Fe-based MGs. This is due to the very low diffusivity of hydrogen in Fe-based amorphous alloys (D = 6 × 10⁻¹⁵ m2/s) at room temperature and the low accuracy (down to 0.05 wt%) of the Sievert-type apparatus [8]. Therefore, based on the aforementioned points, the Fe-based MGs do not show formation of metallic hydrides; however, this fact does not mean that they are not able to absorb hydrogen. Hydrogen adsorption is probably happening, and associates with the formation of a solid solution. Hydrogen presents low solubility in this material. The low hydrogen-to-metal ratio and low diffusivity of hydrogen is followed by the formation of passive films, such as oxides and/or iron (II) hydroxide (electrically non-conductive), leading to a reduction in the number of sites with high affinity to hydrogen in the bulk of the alloy [35]. Thus, the hydrogen storage is decreased, due to slower hydrogen adsorption/desorption rates [8].
Figure 4a shows the rise in the discharge capacity for all current densities evaluated. The highest discharge capacity value (173.88 mAh/g) was obtained at a current density of 100 mAh/g at 25 cycles (see Table 1); afterwards, the discharge capacity decreased. This drop may be associated with an oxidation process on the alloy during the hydrogen absorption/desorption cycles. Previous studies suggest that this process may lead to the breaking up of the particles with the rise in the charge/discharge cycles, and thus the smallest particles are easily oxidized, affecting their hydrogen absorption capacity [38]. Oxidation and corrosion of the negative electrode are reported to be detrimental for battery life expectancy [39]. On the other hand, for the Fe-based MG, applying a current density of 125 mA/g resulted in it reaching a maximum capacity (83.79 mAh/g) up to 50 cycles (see Table 1); it shows a different behavior at a current density of 50 and 100 mA/g, i.e., showing an almost stable behavior after 25 cycles. This behavior is associated with an accelerated oxidation phenomenon, leading to the formation of a denser oxide film (Fe2O3 and Fe3O4, mainly) on the surface of MG-Fe in comparison with 100 and 50 mA/g, and thus reducing the surface electrochemical activity of the electrode alloy [40]. This is because an increment in the current density leads to an acceleration of the electrochemical reactions, which increases the corrosion process. A study carried out for an iron electrode in alkaline solution divided the cycling process into four stages: development, retention, fading and failure. The development stage is responsible for the fragmentation of iron particles, which results in the increase in specific capacity. The retention, fading and failure stages are associated with the formation, accumulation, and final aggregation of irreversible monocrystalline Fe2O3, which provokes capacity fading and, finally, failure. These stages are considered as processes which lead to passivation behaviors of the Fe-based MG electrode. The passivity is detrimental to the active surface of the iron electrode, because it blocks reversible reactions due to the formation of oxides. On the other hand, the corrosion caused by the hydrogen evolution reaction affects the iron electrode in the charged state, leading to the adverse self-discharge process. In this study, it was also observed that, during charge process, the parasitic hydrogen evolution reaction led to the waste of energy in the alkaline iron electrode, which results in the overall Coulombic efficiency being limited to a very low level, between 50% and 70%.
Table 2 shows the discharge-capacity percentage as a function of maximum capacity of different cycles of Fe-based metallic glass. It is possible to observe that for cycles between 20 and 30 with 50 mA/g and 100 mA/g, respectively, the highest percentages of discharge capacity were obtained; however, at 125 mA/g, the highest percentage of discharge capacity was obtained between 40 and 50 cycles, which is related to the higher hydrogen storage capacity. These percentage values were obtained using Equation (6).
For LaNi5, Figure 4b shows an increment in the discharge capacity for all the current density values evaluated. However, the increase in the discharge capacity does not reach a point from which the capacity values start to show stable values, which indicates that the discharge capacity can reach a higher value. Some fluctuations can be observed during the test in the LaNi5-type electrode, and this behavior is often associated with corrosion suffered by the active material in contact with the electrolyte [41]. Clearly, the degradation obtained for MG-Fe particles is higher in comparison with the LaNi5 alloy, given that a continuous increment in discharge capacity is observed, indicating better electrochemical activity.
%   D i s c h a r g e   c a p a c i t y = c a p a c i t y   a t   e a c h   c y c l e m a x i m u m   c a p a c i t y × 100

3.2.3. Coulombic Efficiency

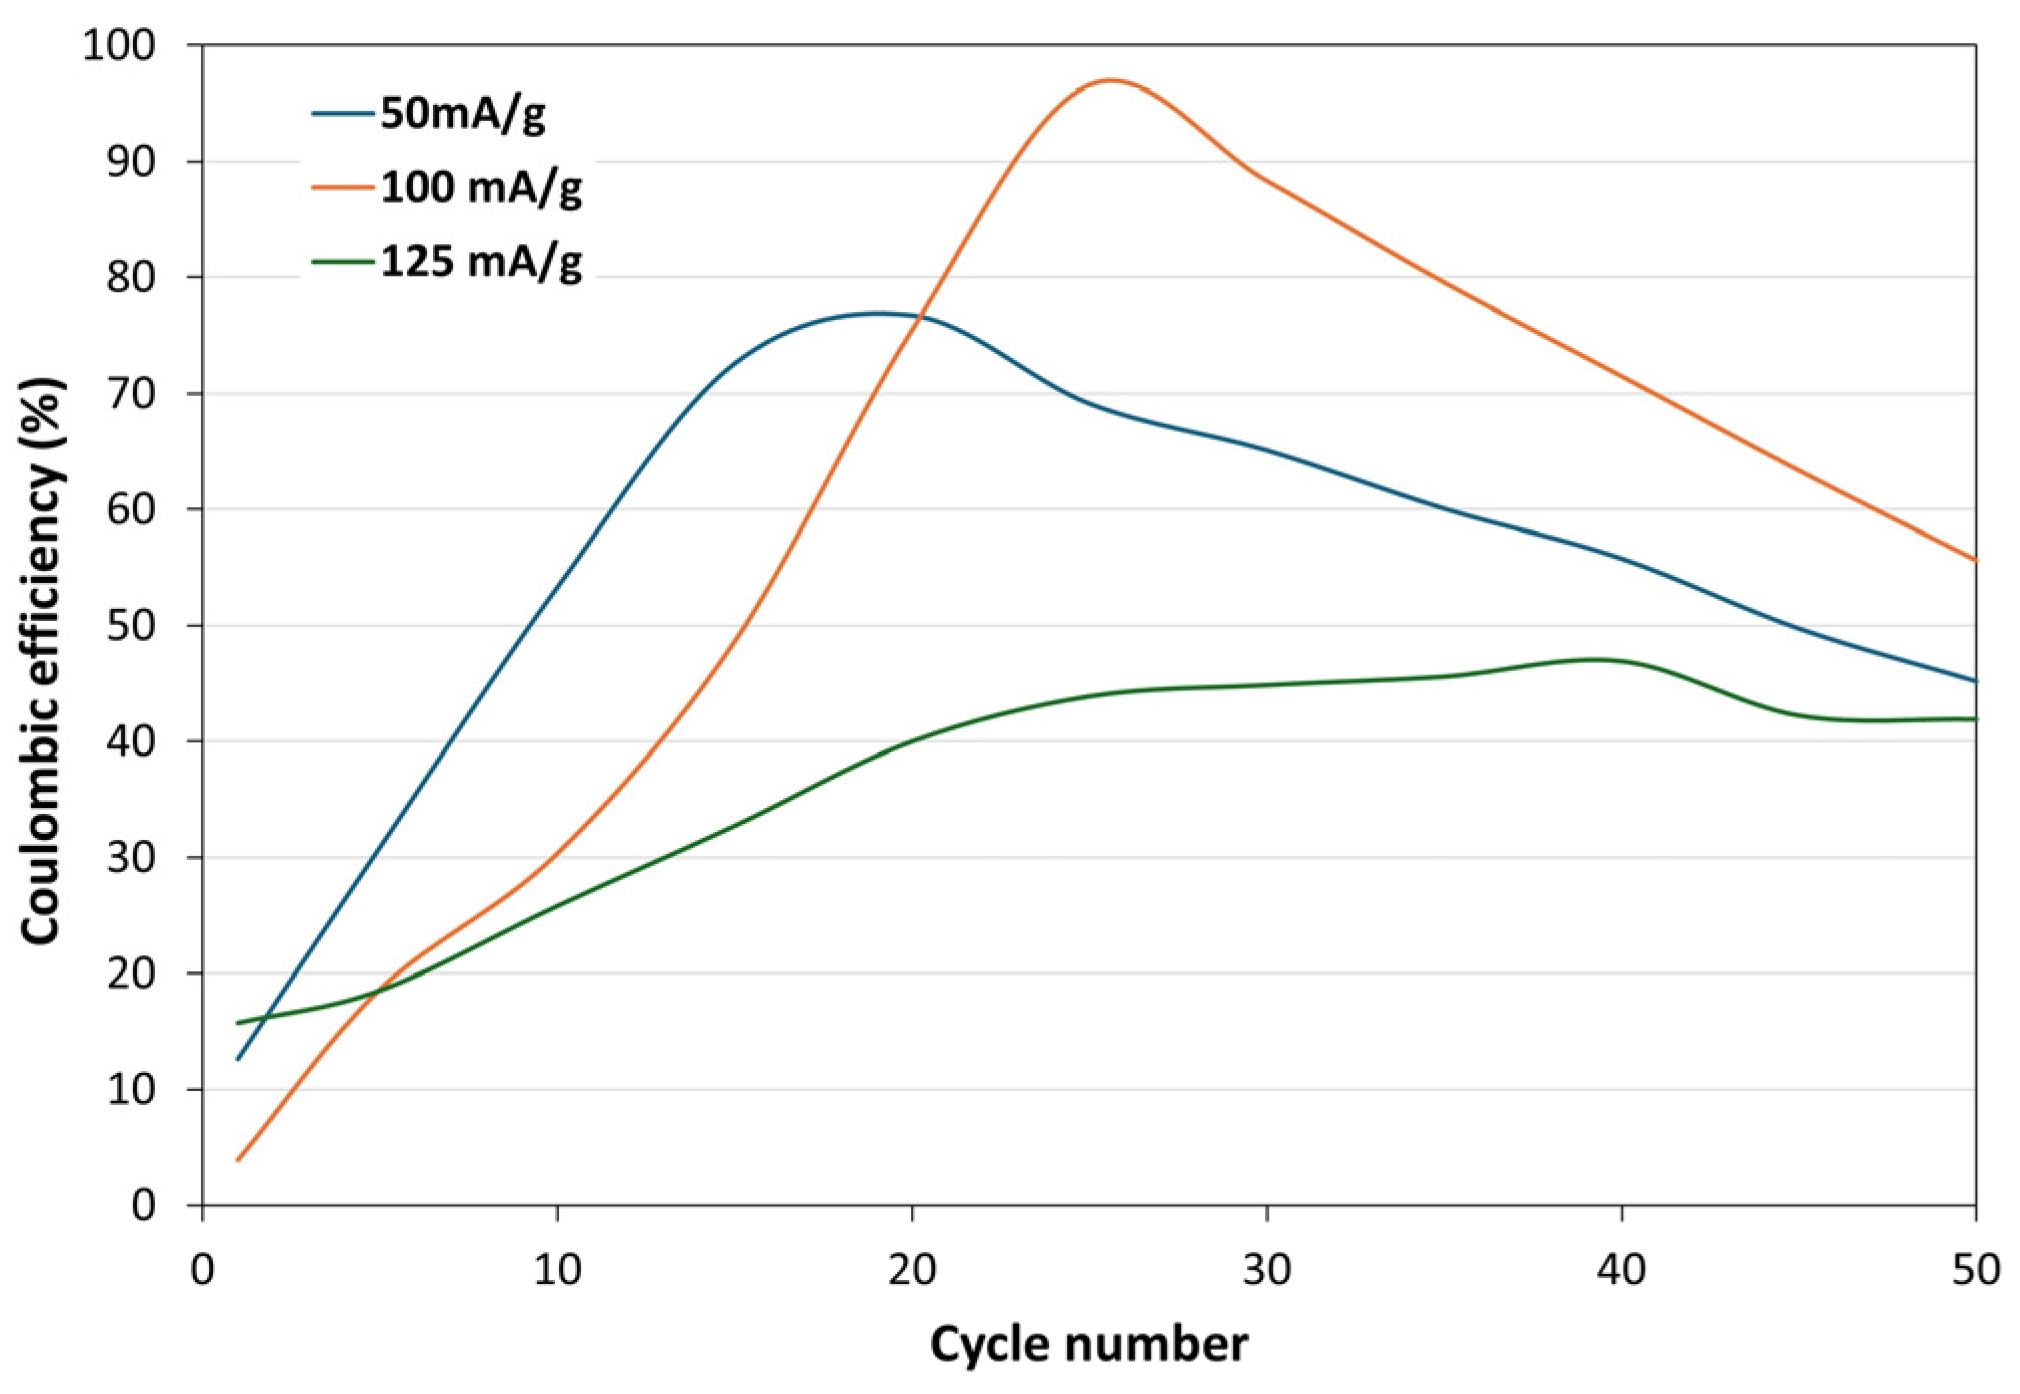
Figure 5 shows the Coulombic efficiency plot for the beginning of the charge- and discharge-cycle increases, and achieves the maximum in the range between 20 and 40 cycles. Depending on the applied charge/discharge specific current, the maximum Coulombic efficiency varies as a function of the cycle number. The larger the specific current, the larger the cycle number to achieve the maximum efficiency. The maximum efficiency is about 75%, 95%, and 47%, for 50, 100, and 125 mA/g, respectively. Moreover, efficiency starts to decline above the maximum peak of efficiency for each current, as a function of the cycles. Overall, the low values of efficiency at the beginning of the test suggest a large internal resistance, which gradually decreases as a function of the test cycles. This suggests the activation of the electrode material. Nevertheless, the efficiency also decreases after the maximum peak of efficiency for each current, which suggests a further increase in the internal resistance. This last observation is often related to material aging and/or electrolyte decomposition, as a result of charging and discharging [42]. As discussed in CVs (Section 3.2.1), the occurrence of the hydrogen evolution reaction at potentials close to the 1.2 V may favor the variation in the concentration of the electrolyte by the loss of hydrogen gas in the parasitic reaction, contributing to the electrolyte decomposition and increasing the internal resistance of the system.

3.2.4. Electrochemical Impedance Spectroscopy (EIS)

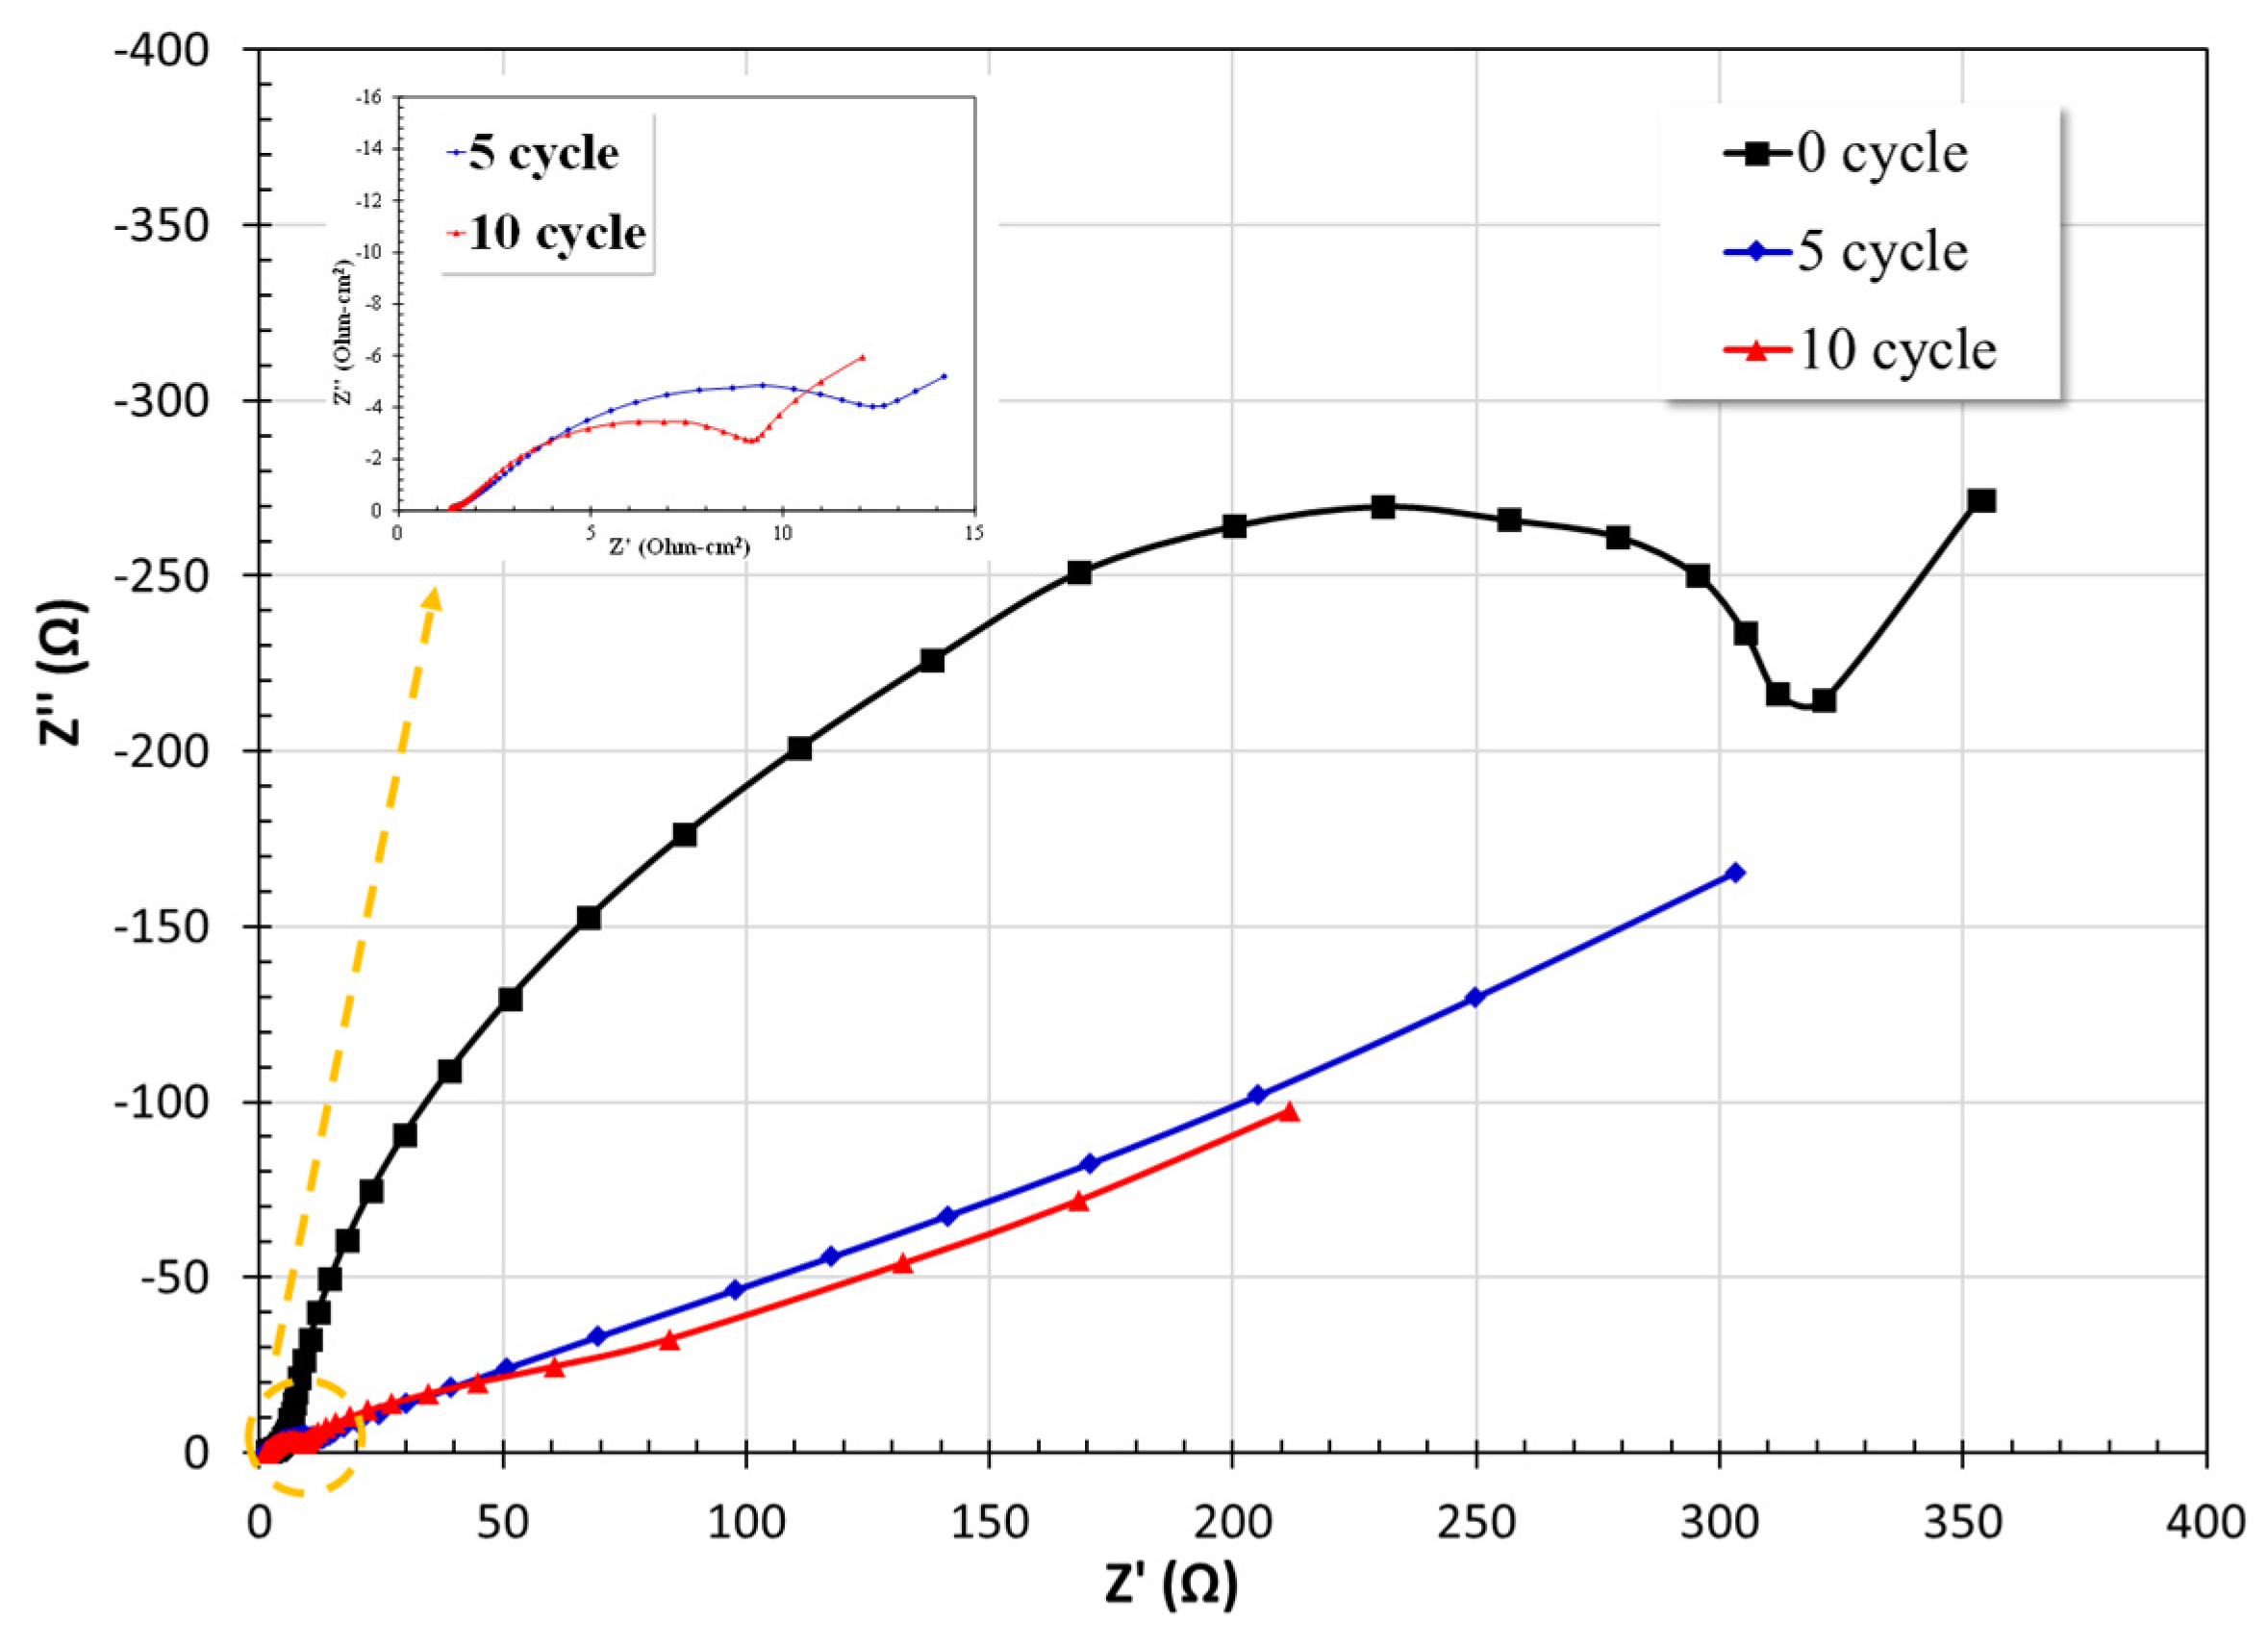
The EIS test was carried out to observe the electrochemical activation of the electrode. The Nyquist plot for 0, 5 and 10 electrochemical charge–discharge cycles is shown in Figure 6. The number of cycles was based on those observed for hydride materials, where 10 charge–discharge cycles are necessary for activation of the electrode, which leads to the highest capacity and the best electrode kinetics [43]. A charge-transfer resistance process at the 0 cycle is observed. However, after 5 and 10 cycles it is possible to observe two typical Nyquist plots of the Ni-MH battery, which are related to a diffusion process, both showing a semicircle at high frequencies and a straight line with an angle of 45° at low frequencies. Cheng et al. mentioned that the semicircle reflects the impedance of the electrochemical reaction of the battery; on the other hand, the straight line indicates the diffusion of the electroactive species (protons in the electrode) [44]. During activation, the diameter of the semicircle located in the high-frequency region decreases, and when the cycle number was increased from 5 to 10 cycle, a smaller diameter of semicircles was obtained, as shown in the insert figure. This behavior indicates a decrease in the charge-transfer resistance of the electrode, i.e., an increase in the electro-catalytic activity of the electrode [45].

3.3. XRD Analysis after Cyclic Voltammetry Test

Figure 7 shows the XRD analysis of the Fe-based MG after 80 cycles in cyclic voltammetry. These tests were carried out between −1.2 V and −0.2 V. It is observed that at this potential range there was the formation of iron oxides, Fe2O3 and Fe3O4, which is related to the formation of a second peak (around −0.65 V) on the oxidation branch (see Figure 2). The formation of hematite and magnetite are the more stable phases in iron oxides, which agrees with the results previously obtained [46]. Clearly, it is observed that there was no evidence of the formation of iron oxyhydroxide on the sample. Gil and Hall [22] observed that under an alkaline solution with an iron electrode, Fe (III) could transform from β-FeOOH and then to α-Fe2O3; and, moreover, either goethite (α-FeOOH) or akageneite (β-FeOOH) can transform into α-Fe2O3. On the other hand, the formation of Fe3O4 can be related to Fe(OH)2, which can be further oxidized into either magnetite (cubic spinel Fe3O4), goethite, akageneite or lepidocrocite (γ-FeOOH), to finally transform into α-Fe2O3. Magnetite can also undergo transformation into γ-Fe2O3 and then into α-Fe2O3.

3.4. Raman Analysis

Raman spectroscopy in Figure 8 is presented as a complementary characterization technique to gain more understanding about the behavior of the Fe-based MG as a negative electrode in KOH. At first glance, Figure 8 corroborates the amorphous nature of the as-received Fe-based MG powder, due to the band located at 2320 cm−1, which has a very broad peak [47]. However, a band at 328 cm−1 is observed, which is associated with magnetite or hematite; given that the first recognizable feature of hematite appeared at about 300 and 410 cm−1, the oxidation can be due to either the laser beam during the Raman experiment or to prolonged exposure to the environmental conditions prior to the experiment. In this case, it is very probable that the oxidation was provoked by the temperature of the laser beam, since it results from its adsorption by a sample. For example, optical studies have reported a strong adsorption of light on iron oxides (magnetite and hematite), with an absorptivity of 85–95% in the range of wavelengths typical of the laser used in Raman experiments [48]. On the other hand, another study has mentioned that a band at 720 cm−1 is also related to iron oxides FeO, Fe2O3 and Fe3O4, given that Raman-scattered radiation can be observed in the spectral range between 600 and 750 cm−1 [49]. The low intensity of these peaks is associated with the lowest concentration or quantity of Fe oxides, which may indicate the beginning of the oxidation. However, a band at 1321 cm−1 with a considerable intensity in the peak is assigned to a phonon overtone (second order), on the basis of light scattering resulting from the solid solution of Fe2O3 and Cr2O3; in other words, this phonon overtone is observed only in a mixed-metal solid solution, such as Fe2O3-Cr2O3 solid solution [50].
Alternatively, Raman spectroscopy was also used to identify the formation of film/corrosion products like oxides or hydroxides formed on metallic glass-based Fe after electrochemical evaluation by cyclic voltammetry test in a potential range of −1.2 V to −0.2 V. Bands observed in a range from 298 to 403 cm−1 were associated with film oxides of Fe3O4 and/or γ-Fe2O3 or inclusive Fe(OH)2, in alkaline solution [51]. It is worth mentioning that it has been reported that the first recognizable feature of hematite appeared at about 300 cm−1 and 410 cm−1 [44]. However, this range of bands between 200 cm−1 and 403 cm−1 can also be characteristic of the Fe2-xCrxO3 bulk phase. In addition, two bands at 840 cm−1 and 1027 cm−1 were assigned to the vibration from bridging Fe-O-Cr6+ and dioxo (0=)2Cr6+O2, respectively [52].
Finally, two bands are observed at 113 cm−1 and 158 cm−1; the first is associated with Si2O5 and the second band can be related to halloysite [Al2Si2O5(OH)4], indicating possibly that the band at 156 cm−1 is associated with the stretching vibration of the inner-surface OH [53]. The formation of oxides and hydroxide is associated with the exposure to the environmental conditions of the material immersed in KOH, and results are consistent with those obtained by XRD.

3.5. SEM Analysis

Figure 9 shows a comparison of the Fe-based MG particles on a Ni-mesh before and after the electrochemical evaluation. Figure 9a shows smooth particles. However, after the electrochemical evaluation, some porosity is observed, which is associated with the corrosion process in the KOH solution.
Figure 10 shows the Fe-based MG particles after the cyclic voltametric tests. Higher concentrations of Fe and Cr are observed on the particle, with Si in a lower concentration, and porosity in some areas of particle is observed. As mentioned before, the formation of porosity is associated with the degradation of the material in contact with the KOH solution; in these porous areas there is a higher oxygen concentration, which is related to the formation of oxides of Fe y Cr, mainly. It is known that amorphous alloys have high corrosion resistance when compared with crystalline alloys, which has been ascribed to the selective dissolution of the less-noble metal in the active range, leading to an enrichment of the outer part of the passive layer. For example, iron–chromium amorphous alloys showed an increase in chromium content on the passive layer, which is consistent with that observed in the mapping element of Figure 10. Therefore, in this study, Cr and Fe oxide can be responsible for the formation of a passive layer [54]. As mentioned above, the Fe oxides principally formed are Fe3O4 and Fe2O3; however, some of SiO2-like crystals can be seen from element mapping [55]. Even though the Fe amorphous alloy has boron, this element cannot be detected by XRD or EDS analysis, due to the low-energy X-ray emission of this element. The solubility of B in a α-Fe is known to be very small [55].
A study reported by J. Crousier suggested an increment in catalytic activity exhibited by an Fe-based MG after anodic oxidation treatment, due to the formation of crystalline Fe3O4 (oxide layer) on the top of the amorphous surface. The cathodic reduction is able to produce an active porous Fe layer on which the hydrogen evolution reactions occur, as observed in this work [54]. On the other hand, during hydrogenation (charge process) voids and cracks are formed in the Fe-based MG, which promotes embrittlement [37]. In Figure 10 it is possible to observe the formation of small voids, which coalesce to form bigger pores. The chromium contents in Fe-based MG are also a factor to consider in the performance of the electrode. For example, a chromium-enriched surface film is often obtained with the presence of Cr. However, Cr content below 8.3at% may lead to the formation of unstable passive layers, which might be easily dissolved and/or undergo severe corrosion attack [56]. Probably, the formation of phases in the amorphous matrix increased the corrosion attack. The Fe-based MG may have primary precipitates of α-Fe, Fe carbides, Fe boride, Fe silicates, or their mixture, which can induce local galvanic cells and increase the dissolution rate. The in situ precipitated secondary phases have different electrochemical potential from that of the amorphous matrix, easily inducing the formation the local galvanic cells, and so would increase the dissolution rate [56].
Nevertheless, a degradation mechanism is proposed. During the discharge process there is the formation of ferrite ion, which is dissolved in the solution. After that, an hydrolyzed anion is formed (HFeO2), which precipitates as ferrous hydroxide. The reactions (7) and (8) shows this corrosion process.
Fe + 3OH ↔ HFeO2 + H2O + 2e
HFeO2 + H2O ↔ Fe(OH)2 + OH
The mechanism of reaction in the electrode involves the diffusion of protons inserted into the solid-state lattices of Fe(OH)2 and δ-FeOOH, and thus there is a constant change in the composition of the active material between Fe(OH)2 and δ-FeOOH. On the other hand, a study carried out by open-circuit potential measurement of the charged alkaline iron electrode showed that the potential value was more negative with respect to a standard hydrogen electrode in the same solution. Therefore, the iron electrode is thermodynamically unstable and undergoes corrosion through local cells with hydrogen evolution through reactions (1) and (5). In addition, the dissolved oxygen in the alkaline solution can lead to the reaction O2 + 2H2O + 4e → 4OH, so this reaction facilitates the corrosion of Fe-based metallic glass. As mentioned before, the hydrogen evolution reaction can cause spontaneous corrosion of the Fe-based MG electrode in the charged state, which leads to an adverse self-discharge process [57,58].

4. Conclusions

In this study, an explorative work was performed on the evaluation of a Fe-based MG composition as negative electrode material in KOH for potential applications in Ni-MH batteries. The Fe-based MG electrode presented electrochemical hydrogen storage ability. However, its cycle life is far too short, and its capacity is low, which might restrict its use as a potential material for replacing conventional LaNi5 alloys in Ni-MH batteries. Cycle voltammetry shows well-defined and invariant anodic and cathodic peaks, which correspond to the formation and reduction of hydroxides and oxyhydroxides/oxides of the Fe-based MG formed by Equations (1)–(3). On the other hand, the charge–discharge test showed a drop in capacity after 25 cycles at a current density of 50 and 100 mA/h, which is associated with the material degradation and the formation of passive film on the metal surface. It is likely that the formation of metallic hydride does not occur; instead, XRD and RAMAN analyses confirmed the formation of Fe oxides or hydroxides on the metal surface, while SEM analyses showed the formation of porous particles associated with the corrosion promoted by the interaction between the Fe-based MG surface and the KOH solution. Further electrochemical studies should be performed to determine the absorption mechanisms of hydrogen in Fe-based MGs, which may open new opportunities to tailor MG composition as a function of maximizing absorption.
As a next investigation, electrolyte modification can be performed to study a lower KOH concentration of approximately of 3M or 1M, which could decrease the pH, to mitigate the material degradation. Also, the authors propose the modification of the particle size, since a small particle size led to a higher reaction area between the surface of the material and the electrolyte, impacting directly to mitigate the degradation of the material.

Author Contributions

Conceptualization, O.S., J.H. and H.M.; methodology, O.S., E.C., N.F., A.M. and B.C.; formal analysis, O.S., J.H., C.P. and H.M; investigation, O.S. and H.M.; writing—original draft preparation, O.S., J.H. and H.M.; writing—review and editing, O.S., J.H., C.P., A.M. and H.M.; supervision, H.M.; funding acquisition, H.M. All authors have read and agreed to the published version of the manuscript.

Funding

This work was sponsored by CONAHCyT, Postdoctoral scholarship [Estancias Posdoctorales por Mexico 2022(3)].

Data Availability Statement

The raw data supporting the conclusions of this article will be made available by the authors on request.

Acknowledgments

Oscar Sotelo Mazon thanks CONAHCYT for a postdoctoral scholarship. John Henao thanks CONAHCYT through the “Investigadores por Mexico program”—project 848. The authors give grateful thanks to Edna Vazquez Velez from the Instituto de Ciencias Fisicas (UNAM) for the Raman spectra, Rafel Ivan Puente Lee from the Facultad de Quimica (UNAM) for SEM analysis used in the discussion of this work, and Eng. Hector Hugo Hinojosa and Eng. Juana Romero for their technical support.

Conflicts of Interest

The authors declare no conflicts of interest.

References

  1. Yu, Y.; Chen, B.; Huang, K.; Wang, X.; Wang, D. Environmental Impact Assessment and End-of-Life Treatment Policy Analysis for Li-Ion Batteries and Ni-MH Batteries. Int. J. Environ. Res. Public Health 2014, 11, 3185–3198. [Google Scholar] [CrossRef] [PubMed]
  2. Pistoia, G. Battery Categories and Types. In Battery Operated Devices and Systems: From Portable Electronics to Industrial Products, 1st ed.; Elsevier B.V.: Amsterdam, The Netherlands, 2009; pp. 17–73. [Google Scholar]
  3. Vishnumurthy, K.A.; Girish, K.H. A comprehensive review of battery technology for E-mobility. J. Indian Chem. Soc. 2021, 98, 100173. [Google Scholar] [CrossRef]
  4. Fetcenko, M.A.; Ovshinsky, S.R.; Reichman, B.; Young, K.; Fierro, C.; Koch, J.; Zallen, A.; Mays, W.; Ouchi, T. Recent advances in NiMH battery technology. J. Power Sources 2007, 165, 544–551. [Google Scholar] [CrossRef]
  5. Ying, T.K.; Gao, X.P.; Hu, W.-K.; Wu, F.; Noréus, D. Studies on rechargeable NiMH batteries. Int. J. Hydrogen Energy 2006, 31, 525–530. [Google Scholar] [CrossRef]
  6. Wang, L.; Young, K.; Nei, J.; Pawlik, D.; Ng, K.Y.S. Hydrogenation of AB5 and AB2 metal hydride alloys studied by in situ X-ray diffraction. J. Alloys Compd. 2014, 616, 300–305. [Google Scholar] [CrossRef]
  7. Khan, M.M.; Nemati, A.; Rahman, Z.U.; Shah, U.H.; Asgar, H.; Haider, W. Recent Advancements in Bulk Metallic Glasses and Their Applications: A Review. Crit. Rev. Solid State Mater. Sci. 2018, 43, 233–268. [Google Scholar] [CrossRef]
  8. Sarac, B.; Zadorozhnyy, V.; Ivanov, Y.P.; Kvaratskheliya, A.; Ketov, S.; Karazehir, T.; Gumrukcu, S.; Berdonosova, E.; Zadorozhnyy, M.; Micusik, M.; et al. Surface-Governed electrochemical hydrogenation in FeNi-Based metallic glass. J. Power Sources 2020, 475, 228700. [Google Scholar] [CrossRef]
  9. Schroers, J. Bulk Metallic Glasses. Phys. Today 2013, 66, 32–37. [Google Scholar] [CrossRef]
  10. Ying, M.; Yi, L.; Arroyo, E.M.; Ceder, G. Amorphous Metallic Glass as New High Power and Energy Density Anodes For Lithium Ion Rechargeable Batteries. Adv. Mater. Micro Nano-Syst. 2003. [Google Scholar]
  11. Jabed, A.; Bhuiyan, M.N.; Haider, W.; Shabib, I. Distinctive Features and Fabrication Routes of Metallic-Glass Systems Designed for Different Engineering Applications: A Review. Coatings 2023, 13, 1689. [Google Scholar] [CrossRef]
  12. Yartys, V.A.; Lototskyy, M.V.; Akiba, E.; Albert, R.; Antonov, V.E.; Ares, J.R.; Baricco, M.; Bourgeois, N.; Buckley, C.E.; Bellosta von Colbe, J.M.; et al. Magnesium based materials for hydrogen based energy storage: Past, present and future. Int. J. Hydrogen Energy 2019, 44, 7809–7859. [Google Scholar] [CrossRef]
  13. Du, Y.; Xu, L.; Shen, Y.; Zhuang, W.; Zhang, S.; Chen, G. Hydrogen absorption/desorption behavior of Mg50La20Ni30 bulk metallic glass. Int. J. Hydrogen Energy 2013, 38, 4670–4674. [Google Scholar] [CrossRef]
  14. Jiang, R.; Da, Y.; Chen, Z.; Cui, X.; Han, X.; Ke, H.; Liu, Y.; Chen, Y.; Deng, Y.; Hu, W. Progress and Perspective of Metallic Glasses for Energy Conversion and Storage. Adv. Energy Mater. 2022, 12, 2101092. [Google Scholar] [CrossRef]
  15. Yao, A.; Yang, H.; Wang, J.Q.; Xu, W.; Huo, J.; Li, R.W.; Qiu, H.; Chen, M. Flexible supercapacitor electrodes fabricated by dealloying nanocrystallized Al-Ni-Co-Y-Cu metallic glasses. J. Alloys Compd. 2019, 772, 164–172. [Google Scholar] [CrossRef]
  16. Gao, F.Y.; Liu, S.N.; Ge, J.C.; Zhang, X.L.; Zhu, L.; Zheng, Y.R.; Duan, Y.; Qin, S.; Dong, W.; Yu, X.; et al. Nickel–Molybdenum–Niobium metallic glass for efficient hydrogen oxidation in hydroxide exchange membrane fuel cells. Nat. Catal. 2022, 5, 993–1005. [Google Scholar] [CrossRef]
  17. Wu, X.; Chen, F.; Zhang, N.; Qaseem, A.; Johnston, R.L. A silver–copper metallic glass electrocatalyst with high activity and stability comparable to Pt/C for zinc–air batteries. J. Mater. Chem. A 2016, 4, 3527–3537. [Google Scholar] [CrossRef]
  18. Al-Harbi, A.K.; Emran, K.M. Effect of immersion time on electrochemical and morphology of new Fe-Co metal-metal glassy alloys in acid rain. Arab. J. Chem. 2019, 12, 134–141. [Google Scholar] [CrossRef]
  19. Inoue, A. Bulk glassy alloys: Historical development and current research. Engineering 2015, 1, 185–191. [Google Scholar] [CrossRef]
  20. Henao, J.; Concustell, A.; Cano, I.G.; Cinca, N.; Dosta, S.; Guilemany, J.M. Influence of Cold Gas Spray process conditions on the microstructure of Fe-Based amorphous coatings. J. Alloys Compd. 2015, 622, 995–999. [Google Scholar] [CrossRef]
  21. Poblano-Salas, C.A.; Sotelo-Mazon, O.; Henao, J.; Corona-Castuera, J.; Martinez, G.; Casales-Diaz, M.; Porcayo-Calderon, J.; Tathagata, K.; Navarro, M.; Kumar-Kesarla, M. Flame Sprayed LaNi5-Based Mischmetal Alloy: Building-up Negative Electrodes for Potential Application in Ni-Based Batteries. J. Therm. Spray Technol. 2021, 30, 1940–1956. [Google Scholar] [CrossRef]
  22. Gil-Posada, J.O.; Hall, P.J. Controlling hydrogen evolution on iron electrodes. Int. J. Hydrogen Energy 2016, 41, 20807–20817. [Google Scholar] [CrossRef]
  23. Gil-Posada, J.O.; Hall, P.J. Towards the development of safe and commercially viable nickel–iron batteries: Improvements to Coulombic efficiency at high iron sulphide electrode formulations. J. Appl. Electrochem. 2016, 46, 451–458. [Google Scholar] [CrossRef]
  24. Manohar, A.K.; Malkhandi, S.; Yang, B.; Yang, C.; Prakash, G.K.S.; Narayanan, S.R. A High-Performance Rechargeable Iron Electrode for Large-Scale Battery-Based Energy Storage. J. Electrochem. Soc. 2012, 159, 1209–1214. [Google Scholar] [CrossRef]
  25. Khaldi, C.; Mathlouthi, H.; Lamloumi, J. A comparative study, of 1 M and 8 M KOH electrolyte concentrations, used in Ni–MH batteries. J. Alloys Compd. 2009, 469, 464–471. [Google Scholar] [CrossRef]
  26. Kim, H.S.; Nishizawa, M.; Uchida, I. Single particle electrochemistry for hydrogen storage alloys, MmNi3.55Co0.75Mn0.4Al0.3. Electrochim. Acta 1999, 45, 483–488. [Google Scholar] [CrossRef]
  27. Mohamedi, M.; Sato, T.; Itoh, T.; Umeda, M.; Uchida, I. Cyclic Voltammetry and AC Impedance of MmNi3.55Co0.75Mn0.4Al0.3 Alloy Single-Particle Electrode for Rechargeable Ni/MH Battery. J. Electrochem. Soc. 2002, 149, 983–987. [Google Scholar] [CrossRef]
  28. Weixiang, C. Cyclic voltammetry and electrochemical impedance of MmNi3.6Co0.7Mn0.4Al0.3 alloy electrode before and after treatment with a hot alkaline solution containing reducing agent. J. Power Sources 2000, 90, 201–205. [Google Scholar] [CrossRef]
  29. Geng, M.; Feng, F.; Gamboa, S.A.; Sebastian, P.J.; Matchett, A.J.; Northwood, D.O. Electrocatalytic characteristics of the metal hydride electrode for advanced Ni/MH batteries. J. Power Sources 2001, 96, 90–93. [Google Scholar] [CrossRef]
  30. Kitamura, T.; Iwakura, C.; Tamura, H. Comparative study of LaNi5,-type alloy electrodes with and without Pd-Plated layer by means of cyclic voltammetry. Electrochim. Acta 1982, 27, 1729–1731. [Google Scholar] [CrossRef]
  31. Liu, Y.; Pan, H.; Gao, M.; Wang, Q. Advanced hydrogen storage alloys for Ni/MH rechargeable batteries. J. Mater. Chem. 2011, 21, 4743–4755. [Google Scholar] [CrossRef]
  32. Liu, W.; Wu, H.; Lei, Y.; Wang, Q.; Wu, J. Effects of substitution of other elements for nickel in mechanically alloyed Mg50Ni50 amorphous alloys used for nickel-metal hydride batteries. J. Alloys Compd. 1997, 261, 289–294. [Google Scholar] [CrossRef]
  33. Chourashiya, M.G.; Kim, Y.H.; Park, C.N.; Park, C.J. Hydrogenation and microstructural properties of hydriding combustion synthesized Mg-Ni-C composite ball-milled with NbF5 catalyst. J. Alloys Compd. 2014, 584, 47–55. [Google Scholar] [CrossRef]
  34. Geng, M.; Northwood, D.O. Development of advanced rechargeable Ni/MH and Ni/Zn batteries. Int. J. Hydrogen Energy 2003, 28, 633–636. [Google Scholar] [CrossRef]
  35. Ismail, N.; Uhlemann, M.; Gebert, A.; Eckert, J.; Schultz, L. The electrochemical hydrogen sorption behaviour of Zr–Cu–Al–Ni metallic glasses. Mater. Trans. 2002, 43, 1133–1137. [Google Scholar] [CrossRef]
  36. Huang, L.J.; Lin, H.J.; Wang, H.; Ouyang, L.Z.; Zhu, M. Amorphous alloys for hydrogen storage. J. Alloys Compd. 2023, 941, 168945. [Google Scholar] [CrossRef]
  37. Eliaz, N.; Eliezer, D. Hydrogen Effects on an Amorphous Fe-Si-B Alloy. Metall. Mater. Trans. A 2000, 31, 2517–2526. [Google Scholar] [CrossRef]
  38. Geng, M.; Han, J.; Feng, F.; Northwood, D.O. Characteristics of the high-rate discharge capability of a nickel/metal hydride battery electrode. J. Electrochem. Soc. 1999, 146, 3591–3595. [Google Scholar] [CrossRef]
  39. Shen, Y.; Noreus, D.; Starborg, S. Increasing NiMH battery cycle life with oxygen. Int. J. Hydrogen Energy 2018, 43, 18626–18631. [Google Scholar] [CrossRef]
  40. Zhu, Y.F.; Pan, H.G.; Gao, M.X.; Ma, J.X.; Li, S.Q.; Wang, Q.D. The effect of Zr substitution for Ti on the microstructures and electrochemical properties of electrode alloys Ti1−xZrxV1.6Mn0.32Cr0.48Ni0.6. Int. J. Hydrogen Energy 2002, 27, 287–293. [Google Scholar] [CrossRef]
  41. Ren, K.; Miao, J.; Shen, W.; Su, H.; Pan, Y.; Zhao, J.; Pan, X.; Li, Y.; Fu, Y.; Zhang, L.; et al. High temperature electrochemical discharge performance of LaFeO3 coated with C/Ni as anode material for NiMH batteries. Prog. Nat. Sci. Mater. Int. 2002, 32, 684–692. [Google Scholar] [CrossRef]
  42. Wang, S.; Fernandez, C.; Chunmei, Y.; Fan, Y.; Wen, C.; Stroe, D.I.; Chen, Z. Battery System Modeling, 1st ed.; Elsevier: Bengaluru, India, 2021; pp. 1–349. [Google Scholar]
  43. Zhang, W.; Sridhar, M.P.; Srinivasane, S. AC Impedance Studies on Metal Hydrid Electrodes. J. Electrochem. Soc. 1995, 142, 2935–2942. [Google Scholar] [CrossRef]
  44. Cheng, S.; Zhang, J.; Liu, H.; Leng, Y.; Yuan, A.; Cao, C. Study of early cycling deterioration of a Ni/MH battery by electrochemical impedance spectroscopy. J. Power Sources 1998, 74, 155–157. [Google Scholar] [CrossRef]
  45. Cheng, S.; Zhang, J.; Zhao, M.; Cao, C. Electrochemical impedance spectroscopy study of Ni/MH batteries. J. Alloys Compd. 1999, 293, 814–820. [Google Scholar] [CrossRef]
  46. Lu, J.F.; Tsai, C.J. Hydrothermal phase transformation of hematite to magnetite. Nanoscale Res. Lett. 2014, 9, 230. [Google Scholar] [CrossRef] [PubMed]
  47. Boucherit, N.; Goff, H.L.A.; Joiret, S. Raman studies of corrosion films grown on Fe and Fe-6Mo in pitting conditions. Corros. Sci. 1991, 32, 497–507. [Google Scholar] [CrossRef]
  48. Shebanova, O.N.; Lazor, P. Raman study of magnetite (Fe3O4): Laser-Induced thermal effects and oxidation. J. Raman Spectrosc. 2003, 34, 845–852. [Google Scholar] [CrossRef]
  49. Shatarah, I.S.M.; Imiela, A.; Surmacki, J.; Olbrycht, R.; Wittchen, W.; Borecki, M.; Abramczyk, H.; Wiecek, B. FeO content estimation in steel slag using Raman spectroscopy in NIR range. In Proceedings of the 14th Quantitative InfraRed Thermographic Conference, Berlin, Germani, 25–29 June 2018; Available online: https://www.ndt.net/article/qirt2018/papers/p31.pdf (accessed on 28 August 2024).
  50. McCarty, K.F. Inelastic light scattering in α-Fe2O3: Phonon vs magnon scattering. Solid State Commun. 1988, 68, 799–802. [Google Scholar] [CrossRef]
  51. Gui, J.; Devine, T.M. A SERS investigation of the passive of the passive films formed on iron in mildly alkaline solution of carbonate/bicarbonate and nitrate. Corros. Sci. 1995, 37, 1177–1189. [Google Scholar] [CrossRef]
  52. Zhu, M.; Chen, J.; Shen, L.; Ford, M.E.; Gao, J.; Xu, J.; Wachs, I.E.; Han, Y.F. Probing the surface of promoted CuO-Cr2O3-Fe2O3 catalysts during CO2 activation. Appl. Catal. B 2020, 271, 118943. [Google Scholar] [CrossRef]
  53. Kloprogge, J.T. Raman spectroscopy of clay minerals. In Book Developments in Clay Science; Gates, W.P., Kloprogge, J.T., Madejová, J., Bergaya, F., Eds.; Elsevier: Amsterdam, The Netherlands, 2017; pp. 150–199. [Google Scholar] [CrossRef]
  54. Crousier, J.; Crousier, J.P.; Bellucci, F. Electrochemical and electrocatalytic behaviour of iron-base amorphous alloys in 1M KOH at 25 °C. Electrochim. Acta 1993, 38, 821–825. [Google Scholar] [CrossRef]
  55. Trudeau, M.L.; Huot, J.Y.; Schulz, R. The crystallization of amorphous Fe60Co20Si10B10 and its effect on the electrocatalytic activity for H2 evolution. J. Appl. Phys. 1990, 67, 2333–2342. [Google Scholar] [CrossRef]
  56. Li, H.X.; Lu, Z.C.; Wang, S.L.; Wua, Y.; Lu, Z.P. Fe-Based bulk metallic glasses: Glass formation, fabrication, properties and applications. Prog. Mater. Sci. 2019, 103, 235–318. [Google Scholar] [CrossRef]
  57. He, Z.; Xiong, F.; Tan, S.; Yao, X.; Zhang, C.; An, Q. Iron metal anode for aqueous rechargeable batteries. Mater. Today Adv. 2021, 11, 100156. [Google Scholar] [CrossRef]
  58. Shukla, A.K.; Ravikumar, M.K.; Balasubramanian, T.S. Nickel/iron batteries. J. Power Sources 1995, 51, 29–36. [Google Scholar] [CrossRef]
Figure 1. SEM and XRD analysis of powder of Fe-based metallic glass (a,b) and LaNi5 (c,d) as feedstock powder.
Batteries 10 00312 g001
Figure 2. Cyclic voltammogram of the Fe-based MG negative electrode in KOH 6M at room temperature.
Batteries 10 00312 g002
Figure 3. Cyclic voltammogram of the LaNi5 negative electrode in KOH 6M at room temperature.
Batteries 10 00312 g003
Figure 4. Discharge capacity vs. cycle number for the Fe-based MG electrode (a) and LaNi5 electrode (b). These curves were obtained at current density values of 50, 100 and 125 mA/g in KOH 6M.
Batteries 10 00312 g004
Figure 5. Coulombic efficiency vs. cycle number for the Fe-based MG electrode at current density values of 50, 100 and 125 mA/g.
Batteries 10 00312 g005
Figure 6. Nyquist plot obtained from the EIS technique at 0, 5 and 10 charge–discharge cycles.
Batteries 10 00312 g006
Figure 7. XRD analysis after electrochemical evaluation by cyclic voltammetry in a potential range of −1.2 V to −0.2 V.
Batteries 10 00312 g007
Figure 8. Raman analysis of the Fe-based MG as received, and Fe-based MG tested after cyclic voltammetry in a potential range of −1.2 V to −0.2 V.
Batteries 10 00312 g008
Figure 9. SEM analysis of Fe-based MG negative electrode (cold-pressed) before (a) and after (b) cyclic voltammetry tests.
Batteries 10 00312 g009
Figure 10. Element mapping analysis of Fe-based MG particles after electrochemical evaluation by cyclic voltammetry.
Batteries 10 00312 g010
Table 1. Maximum discharge capacity, as a function of the current and considering the cycle number, for Fe-based metallic glass.
Current (mA/g)Cycle NumberMaximum Discharge Capacity (mAh/g)
5020135.86
10025173.88
1254583.79
Table 2. Discharge capacity percentage as a function of maximum capacity for different cycles for Fe-based metallic glass.
% Discharge Capacity
Cycles50 mA/g100 mA/g125 mA/g
116.74433.84
1070.6231.3855.46
2010078.1385.92
3086.2791.4496.34
4073.9274.0299.23
5059.8757.57100
Disclaimer/Publisher’s Note: The statements, opinions and data contained in all publications are solely those of the individual author(s) and contributor(s) and not of MDPI and/or the editor(s). MDPI and/or the editor(s) disclaim responsibility for any injury to people or property resulting from any ideas, methods, instructions or products referred to in the content.