Abstract
Eco-driving aims to enhance vehicle efficiency by optimizing speed profiles and driving patterns. However, ensuring safe following distances during eco-driving can lead to excessive use of lithium-ion batteries (LIBs), causing accelerated battery wear and potential safety concerns. This study addresses this issue by proposing a novel, multi-physics-constrained cruise control strategy for intelligently connected electric vehicles (EVs) using deep reinforcement learning (DRL). Integrating a DRL framework with an electrothermal model to estimate unmeasurable states, this strategy simultaneously manages battery degradation and thermal safety while maintaining safe following distances. Results from hardware-in-the-loop simulation testing demonstrated that this approach reduced overall driving costs by 18.72%, decreased battery temperatures by 4 °C to 8 °C in high-temperature environments, and reduced state-of-health (SOH) degradation by up to 46.43%. These findings highlight the strategy’s superiority in convergence efficiency, battery thermal safety, and cost reduction compared to existing methods. This research contributes to the advancement of eco-driving practices, ensuring both vehicle efficiency and battery longevity.
1. Introduction
Extensive research has been conducted in the field of eco-driving, encompassing various methodologies, including dynamic programming [], Pontryagin’s minimum principle [,], and model predictive control [,,,]. For example, Machacek et al. proposed a hybrid EV energy management method based on model predictive control and Pontryagin’s minimum principle, mainly utilizing the allocation of hybrid power systems and driving mode selection to minimize energy consumption. Although this method achieves near-optimal performance, its computational complexity is high, posing challenges in real-time applications. To address this issue, Hamednia et al. introduced a computationally efficient eco-driving algorithm [], achieving long-range energy savings through dual-layer optimization and Pontryagin’s maximum principle. This method achieved up to 11.6% energy savings between standard cruise control and the proposed algorithm. However, this method relies on precise traffic information and prediction and may have limitations in uncertain and dynamically changing traffic environments. Overall, the problems with the aforementioned eco-driving optimization methods include high computational complexity, strong dependence on real-time data, and potentially poor performance in complex traffic environments.
Recently, with the continuous development of artificial intelligence and machine learning technologies, reinforcement learning (RL) has been used to address the energy efficiency problem in eco-driving [,,,,]. Compared to traditional methods, RL offers greater adaptability and flexibility, allowing real-time, strategic adjustments in constantly changing traffic environments, thereby achieving higher energy efficiency without the need for extensive computation and comprehensive road information. Therefore, RL has become an effective method for solving energy efficiency and driving strategy problems. Huang et al. devised an energy optimization technique through RL for vehicular speed control [], taking into account factors like road gradients and the requisite safe following distance. However, only the discrete state scenarios are considered in this study, thereby hampering its decision-making capacity in continuous state spaces and restricting its effectiveness in real-world driving conditions. Regarding this, Wu et al. proposed a hybrid RL algorithm within a mixed modeling framework [], which combines a continuous deep deterministic policy gradient (DDPG) for longitudinal control and discrete deep Q-learning (DQN) [,,] for lateral control. On this basis, a novel decision-making strategy was also proposed by integrating visual state variables into the RL decision-making process, thereby enhancing energy efficiency in complex traffic scenarios []. Moreover, a human-guided RL framework was proposed to enhance RL performance, which greatly enables human intervention in RL control, thereby improving RL capabilities []. The objective of this hybrid method was to diminish fuel consumption while preserving acceptable travel times. However, the scope of their research was confined to optimizing driving strategies and energy usage without considering car-following scenarios. Similarly, Hu et al. designed a scheme to minimize fuel consumption for hybrid EVs in the driving cycle without prior knowledge []. However, this approach not only encountered challenges related to singular optimization objectives but was also confined to planning within discrete spaces.
As mentioned above, the limitations of the existing studies can be summarized as follows. Firstly, although many studies have considered one of the three factors of following distance [,], energy loss [], and whether the prediction space is continuous or not [], few studies have considered all three, failing to fully meet the complex driving environment and diversified optimization needs. Furthermore, previous research has predominantly focused on methods using RL with discrete action planning, while RL algorithms in continuous action spaces have rarely been applied to the cruise control of intelligently connected EVs. Regarding this, this paper proposes a DDPG-based framework with multiple optimization objectives considered in this research [,,]. Specifically, a joint, electrochemical and aging battery model was established in the established DDPG framework to estimate a battery’s internal state in real-time and thereby guide the training process of the networks in DDPG. By integrating the developed DRL architecture with an electrothermal model for perceiving unmeasurable states, the proposed strategy enables online, model-free cruise control scheduling using the DRL model, efficiently managing the output power of EVs to maintain stable car-following distances, while jointly evaluating and constraining battery degradation impacts and ensuring the thermal safety of onboard LIBs []. In summary, this study contributes to related knowledge fields in the following aspects:
- A novel adaptive cruise control framework which actively incorporates the DRL algorithm and an electrothermal and aging battery model is proposed for autonomous EVs, by which accurate, battery model-assisted, DRL training as well as model-free online control can be realized, thereby greatly improving optimal output power comprehensively while ensuring real-time control performance.
- An advanced continuous DRL strategy based on DDPG was creatively adopted to intelligently optimize power allocation in autonomous EVs in this study, which offers accelerated convergence and improved optimization performance.
- The battery’s thermal safety and degradation considering thermal effects were creatively involved in the proposed framework through the establishment of a joint electrothermal and aging model, which realizes the accurate evaluation of a battery’s aging and the heating effectiveness of agent actors so as to provide effective guidance for DRL training.
The structure of this manuscript is organized as follows. Section 2 details the system modeling, which includes the dynamic modeling of the electric vehicle, modeling of the onboard power battery, and construction of energy consumption and electrothermal and aging models for lithium-ion batteries (LIBs). Section 3 describes the thermal- and health-constrained velocity optimization problem formulation, alongside the fundamentals of the DDPG algorithm. Section 4 presents the results and discussion, where the validity of the training process, speed and safety distance, and temperature and degradation control were substantiated. Finally, Section 5 concludes the paper.
2. System Modeling
2.1. Dynamic Modeling of an Electric Vehicle
During the vehicular propulsion process, the motive force delivered by the power system must counteract driving resistances. The overall vehicle modeling diagram can be seen in Figure 1. The driving force provided by the power system needs to overcome the driving resistance, and the power conversion efficiency and driving resistance of the vehicle’s driving state determine its energy consumption. Equation (1) represents the balance of these forces.
where , , , and are the aerodynamic drag, rolling resistance, climbing resistance, and acceleration resistance, respectively.
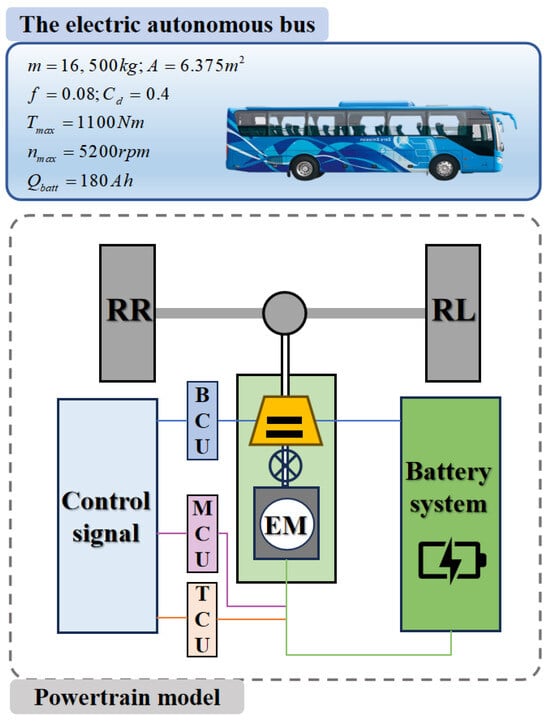
Figure 1.
The overall vehicle modeling with key components.
The motor provides the tractive effort, , and the force correspondingly exerted on the tire is represented by
where is the conversion ratio of the final gears, is the mechanical efficiency of the driveline, is the motor torque, and is the wheel effective radius.
Additionally, the motor model was established using an experimental modeling approach. The operational efficiency of the motor is represented as an interpolation equation involving both speed and torque as Equation (3):
where is the speed of the motor. can be determined based on the gear ratio and the speed of the controlled EV, and can be obtained by Equation (2) above on the basis of the needed propulsive force.
Figure 2 illustrates the relationship between engine torque and speed, which was derived through experimentation.
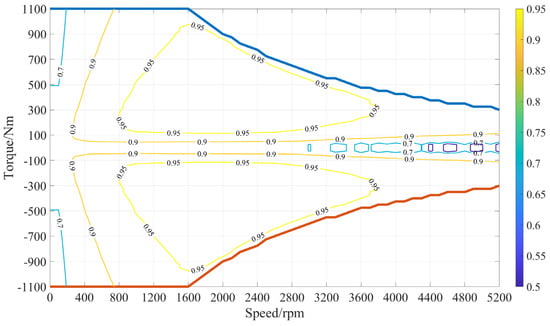
Figure 2.
The relationship between engine torque and speed.
2.2. Modeling of the Onboard Power Battery
- (1)
- Battery Energy Consumption Modeling
The power output of a motor can be articulated as Equation (4):
Furthermore, the aforementioned power is directly sourced from a battery, leading to , where , which is the required output power for the onboard battery, and where denotes the voltage of the battery.
A battery, serving as a pivotal component of electric buses, provides essential power to the motor and possesses the capability to storing energy harvested from regenerative braking systems. To understand battery dynamics comprehensively, it is crucial to adopt an appropriate model that captures its characteristics. Here is a simplified resistance model, which is tailored for scenarios where higher computational efficiency is sought without substantially compromising on accuracy.
The open-circuit voltage of a battery is inherently tied to its state of charge (SOC) []. This relationship can be represented by Equation (5):
where represents the open-circuit voltage of the battery.
Furthermore, the internal resistance of a battery varies depending on its SoC and whether it is in a charging or discharging state. This can be depicted as Equation (6):
where represents the resistance of the battery.
A crucial parameter, a battery current, is determined by a battery’s voltage, power, and internal resistance. It can be estimated using Equation (7):
The voltage of a battery can be ascertained in Equation (8) through the open-circuit voltage, battery current, and resistance:
In such circumstances, the SOC of a battery undergoes the following transformation, which can be represented by Equation (9).
Figure 3 presents a schematic of a battery’s thermal management system, introducing the electrothermal model and the electric model, as well as the relationship between them.
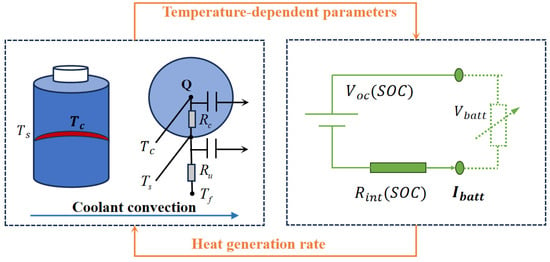
Figure 3.
Schematic of a battery’s thermal management system.
- (2)
- Electrothermal Modeling for LIBs
In the proposed strategies, the precise control and prediction of battery temperature are paramount. A mathematical model detailing the temperature response of batteries is introduced in this section, and more details are shown in []. The parameters of this electric model are dependent on the temperature, SOC, and current direction. As a result, model parameterization can be computationally expensive and time-consuming, requiring a large dataset and advanced optimization methods. Specifically, this model examines the time-based variation in surface temperature and ambient temperature . Explicitly, the rate of change of a battery’s surface temperature is described by Equation (10):
Meanwhile, the rate of change for ambient temperature is given by Equation (11):
Herein, and represent the internal and external thermal resistances of a battery, respectively. denotes the thermal capacity of the battery surface, while signifies the thermal capacity of the battery core. This model enables the incorporation of electrothermal objectives into optimization goals, enhancing multitasking optimization. Consequently, it provides precise guidance for eco-driving decision-making.
Particularly, the thermal generation in a battery arises from a combination of sources, primarily being the ohmic heat and the non-reversible entropic heat []. The rate at which this heat is produced can be expressed by Equation (12):
where characterizes the entropy variation throughout the electrochemical processes. Following this, the internal temperature is represented by Equation (13):
For a comprehensive list of parameter values specific to the A123 26650 LIB, readers are directed to reference [], which is not reiterated here to maintain conciseness. This proposed model underwent rigorous validation, showcasing its precision. The RMSE for terminal voltage remained under 20 mV, and the RMSE for both the internal and external temperatures stayed below 1 °C during standard driving scenarios. This refined electro-thermal model serves as an effective representation of true battery pack dynamics.
- (3)
- Aging Model of LIBs
A model centered on energy throughput was employed to measure the decline in capacity of LIBs.
This model suggests that an LIB can handle a specific amount of electric flow, tantamount to multiple charging and discharging cycles, before reaching its end of life (EOL).
Equation (14) indicates that the degradation in a battery’s state of health (SOH) is due to various stresses. Here, symbolizes the cumulative cycle count before EOL is attained. When considering the equation in discrete terms, the immediate variation in SOH is reflected in Equation (15).
In this context, denotes the duration of current. Both the C-rate (c) and the internal temperature of a battery play pivotal roles in influencing N. The capacity loss, based on the Arrhenius equation, is depicted as Equation (16):
Here, represents the proportionate capacity loss. B is the C-rate-dependent pre-exponential factor which is referred to in Table 1, while R is the standard gas constant. The coefficient z has a value of 0.55. Furthermore, Ah signifies the aggregate ampere-hour throughput. The activation energy (J/mol) is given by Equation (17):

Table 1.
The pre-exponential factors corresponding to different C-rates.
It is pertinent to note that an LIB is deemed to have reached its EOL when its reduces by 20%. Based on this understanding and the above equation, both the Ah and N can be defined as Equation (18):
Equation (19) helps in comprehending the SOH dynamics based on factors such as the current, temperature, and usage history.
3. Thermal- and Health-Constrained Velocity Optimization
3.1. Problem Formulation
The energy efficiency of EVs is intrinsically linked to their control strategies. To facilitate energy-efficient driving, it is imperative to systematically consider a plethora of influencing factors and to optimize them in a coherent manner. In this context, we formulated an objective function to succinctly capture and enhance these determinants. Equation (20) describes this objective function.
where , , and are the weight factors, and denotes the battery degradation cost which is determined by ΔSoH and the battery purchase cost.
The aim of this study is to improve the method of maintaining a safe distance between a controlled EV and the vehicle in front. In addition, the retention of a LIB’s SoC is crucial for maintaining the range of an EV. Meanwhile, another aim is to control the temperature below a certain value to avoid accidental battery inconsistency or thermal runaway triggering. However, due to estimation errors and uncertainty caused by external interference, these limitations may be violated in practice. Therefore, penalty terms were introduced to address these constraints. Especially, the excessive deviation and overtemperature of the SoC can be accounted for in Equations (21)–(23):
where and are the target safety distance and the target . is the upper limit temperature.
During the optimization process, the following constraints must be adhered to as Equation (24):
In these constraints, the current is subject to maximum and minimum limits, ensuring operation within the specified parameters of a battery, thereby safeguarding the battery’s health and enhancing its energy efficiency. The speed and torque limits are shown in Figure 2, where the limit on the maximum speed is 5200, which is determined by the motor, and the limit on the maximum and minimum torque is indicated by the “ line” and “ line” in Figure 2. Additionally, the constraint maintains a positive vehicle distance, which is aimed to be optimized close to an ideal value of 100 m through control strategies.
3.2. Fundamentals of the DDPG Algorithm
To solve the optimization problem presented in Equation (20), within the RL framework, the reward function can be reformulated as Equation (25):
where is a bias term utilized to adjust the range of the reward function. The state space is defined as Equation (26):
These include the lead vehicle’s speed , lead vehicle’s acceleration , current vehicle speed , vehicle gap , average battery temperature , and battery core temperature .
Building on this foundation, the DDPG network was employed for practical task execution. As an RL algorithm tailored for continuous control scenarios, the DDPG provides the necessary architecture for effectively leveraging a defined reward function for system optimization. Essentially, it is an adaptation and extension of the DQN algorithm to continuous action spaces. With its standalone action network, the DDPG can map states to a deterministic sequence of continuous actions, making it suitable for problems with continuous states and action spaces.
The DDPG network structure is shown in Figure 4, which shows how a state and action are input into the network and how the network iterates in RL. Structurally, the DDPG framework primarily introduces two neural networks: an actor and a critic. Both the actor and critic are represented by deep neural networks. The actor network is responsible for determining the optimal action under a given state, while the critic network evaluates the expected return of the action recommended by the actor under a given state. The procedure of the DDPG algorithm is shown in Algorithm 1.
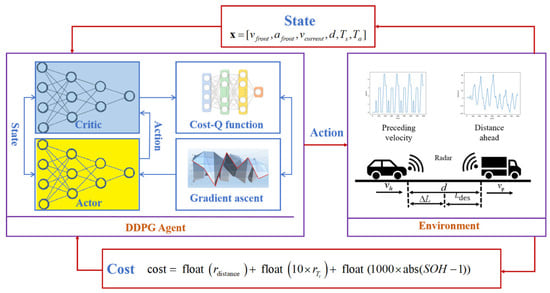
Figure 4.
The DDPG network structure.
The actor and critic are represented by deep neural networks, which means that the DDPG uses multilayered perceptron to learn in large state and action spaces. The critic network is learned by the Bellman equation as follows, and the actor network is updated by using the sampled policy gradient [].
Equation (27) delineates an advanced reinforcement learning framework focusing on policy optimization and value function estimation. The first equation introduces the update target for the value function as a combination of the immediate reward and the discounted future rewards, where is the discount factor and represents the target policy parameters.
The second equation presents a loss function for the Q-value function parameter optimization, which calculates the expected squared difference between the Q-value function and the update target .
The third equation derives the gradient of the loss function with respect to the Q-function parameters, indicating the direction for parameter updates.
The fourth equation approximates the gradient of the objective function with respect to the policy parameters , employing a policy gradient method. It is based on the expectation of the product of the gradient of the Q-function with respect to actions and the gradient of the policy function with respect to its parameters.
| Algorithm 1. Procedures of the DDPG Algorithm |
| 1: Initialization: critic network and actor network with weights and , target network and with weights , , memory pool R, a random process N for action exploration |
| 2: for episode = 1:M do |
| 3: get initial states: |
| 4: for t = 1, T do |
| 5: Select action according to the current policy and exploration noise |
| 6: Execute action , observe reward and new states |
| 7: Store transition in R |
| 8: Sample a minibatch of transitions from R with priority experience replay |
| 9: Set |
| 10: Update critic by minimizing the loss: |
| 11: Update the actor policy using the sampled policy gradient: |
| 12: Update the target networks: |
| 13: end for |
| 14: end for |
4. Results and Discussion
4.1. Conditions for Validation
In this study, the hardware-in-the-loop (HIL) platform shown in Figure 5 was used for scheduling testing to verify the comprehensive performance of the proposed strategy. To this end, IPG TruckMaker software was used to build and analyze the performance of the automatic electric vehicle following scenarios. TruckMaker is a simulation software for testing and developing commercial vehicles, which models vehicle dynamics, supports ADAS development, and allows real-time testing with hardware-in-the-loop (HIL) setups. By simulating various driving scenarios, TruckMaker helps evaluate performance and safety, reducing the need for physical prototypes. This leads to optimized vehicle parameters, improved performance, and faster time-to-market, making it essential for modern commercial vehicle engineering. This software is a high-fidelity simulation environment with a SIMULINK interface. In addition, a workstation (Intel Xeon Sliver, 32 GB RAM, Tesla T4) was used as the cloud server to update and store vehicle and battery models and train intelligent control strategies. At the same time, the HIL platform using an embedded controller (RapidECU-U4B, 32-bit, 64KbEEPROM) achieved battery charging and discharging control at the physical layer. Wireless networks were used for communication between clouds and controllers. In this prototype, an auxiliary upper computer was used to bridge the signal channel between two devices, which could communicate with the server through a wireless network and automatically configure the controller based on its communication content. It is worth noting that in practical applications, an auxiliary upper computer in a prototype system can be replaced by a pair of commercial 5G transceiver modules, thereby achieving point-to-point communication with longer distances and lower latency. In addition, the trained strategy was downloaded to the vehicle controller on the HIL platform for real-time scheduling. The interaction process between the vehicle controller and the environmental simulator was coordinated by a real-time PC. In the experimental environment setup, the computational efficiency of the trained DDPG algorithm could be well guaranteed; thus, this paper presents the algorithm’s convergence performance during training, while placing a greater emphasis on demonstrating the impact of the algorithm’s real-time decision-making process on the overall control effectiveness.
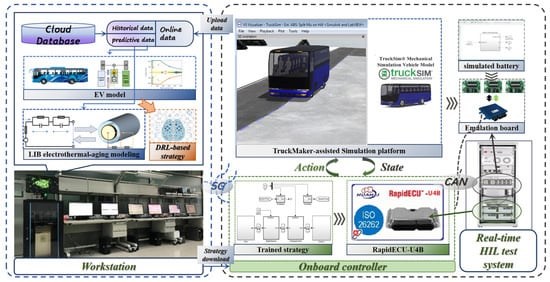
Figure 5.
Diagram of the prototyping system.
4.2. Validation of the Training Process
Five metrics were employed to assess the convergence process of the DDPG network, as depicted in Figure 6.
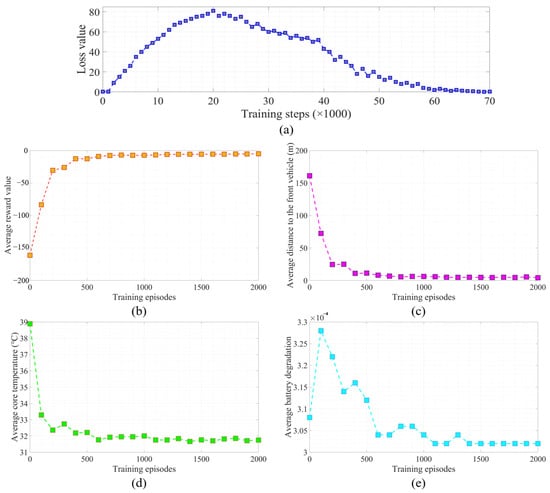
Figure 6.
Indicators of the training process. (a) Residual of action selecting the network. (b) Reward value. (c) Distance to the front vehicle. (d) Internal temperature of the battery. (e) Battery degradation.
From Figure 6a, it can be observed that the loss value increased during the initial 20,000 steps. This increase can be attributed to the electric vehicle’s unfamiliarity with the benefits of the newly explored eco-driving strategy. However, following this, the loss value exhibited a distinct monotonically decreasing trend and approached zero after approximately 60,000 steps, signifying the successful convergence of the strategy.
Observing Figure 6b, an initial fluctuation in the reward value stands out. These fluctuations stem from the agent being in its learning stage, attempting to pinpoint the optimal strategy. Nevertheless, by the 400th epoch, the reward value began to stabilize and maintain a high level, indicating that the agent adeptly adjusted its objectives to the anticipated levels.
In Figure 6c, the term “Distance to the front vehicle” does not refer to the actual distance but rather the difference between the actual distance and the predefined minimum safety distance. The stipulated minimum safety distance was 100 m. At 0 epochs, the initial distance difference was 160 m. Subsequently, as iterations progressed, the distance difference monotonically decreased. The actual distance to the vehicle in front progressively approached the minimum safety distance and converged to 0 after 400 epochs, remaining at the minimum safety distance. Notably, post the 400 epochs, the distance difference did not fall below the minimum standard distance. Thus, it can be ascertained that the RL-based DDPG strategy, through its learning, ensures the maintenance of a safe distance between vehicles.
Figure 6d reveals a monotonic decline in the internal temperature of the battery with increasing iterations, converging to 31.8 °C after about 200 epochs. This trend resulted from the battery’s internal temperature being set as a training objective, which through DDPG training, progressively optimized to its best.
From Figure 6e, battery degradation initially increased with the number of iterations up to 100 epochs. However, between 100 and 1100 epochs, a declining trend was evident, eventually converging to 3.02 × 10⁻⁴ post the 1100 epochs. This behavior can be linked to the increased training iterations, where the DDPG strategy refined the battery usage pattern, thereby mitigating its degradation.
In conclusion, after thorough training, the DDPG network successfully converged, providing a solid foundation for subsequent optimization tasks.
4.3. Validation of Speed and Safety Distance
To verify the performance of the DDPG network for the given task, the vehicle speed, torque, and average following distance were selected as performance evaluation metrics. Additionally, a comparison was made with the performance of the DQN for the same task to demonstrate the superiority of the DDPG network. To ensure the comprehensiveness of the evaluation, validation was conducted under various operating conditions.
Regarding the method introduced in this paper, as can be seen from Figure 7a,b, these figures illustrate the rear vehicle’s response to the periodic changes in speed of the lead vehicle. The results indicate that the speed output by our method was more stable, and it was also capable of following the lead vehicle through periodic changes in speed. As further evidenced by Figure 7c, the introduced method achieved better fitting of the lead vehicle’s speed at both the peak and trough points compared to the DQN. The DQN exhibited significant fluctuations at these extreme value points. Furthermore, in Figure 7c at the 100 s and 650 s marks, it is evident that the vehicle speed fitted by the DQN network showed severe fluctuations over certain intervals. This is believed to be due to the DQN’s provision of only discrete torque values, causing non-continuous acceleration of the vehicle, reflected as consecutive speed fluctuations. Such fluctuations not only alter the gap between vehicles but also waste energy, potentially harming a battery’s lifespan. The method using the DDPG network did not exhibit such issues, fitting the lead vehicle’s speed smoothly and accurately across all intervals. In Figure 7d, the DQN performed better than in Figure 7c. This performance is speculated to have been a result of the DQN’s training being more aligned with the conditions represented in Figure 7d. Nonetheless, fluctuations were still observed at extreme points with the DQN, whereas the method in this study achieved the task more effectively.
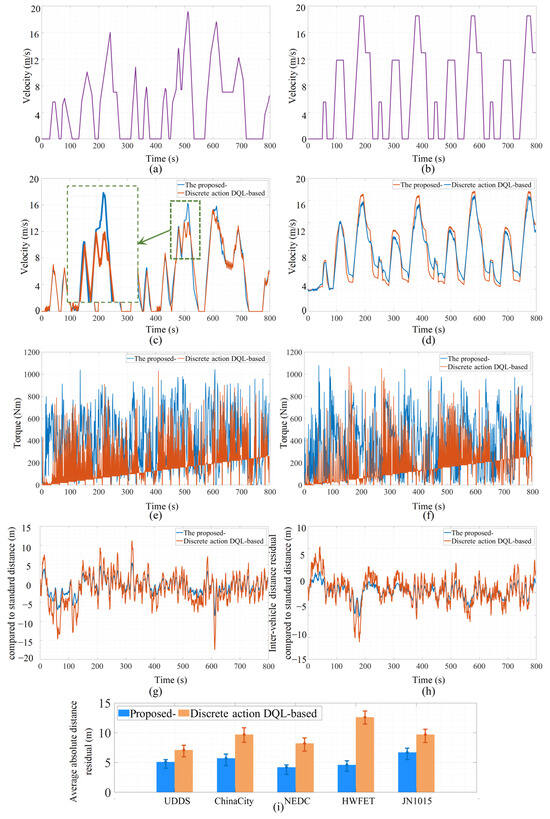
Figure 7.
Driving cycle used for the velocity simulation of a front vehicle: (a) China City Driving Cycle; (b) New European Driving Cycle (NEDC). (c,d) Comparison of the velocity profile. (e,f) Comparison of the torque profile. (g,h) Comparison of the inter-vehicle distance residual compared to the standard distance. (i) Average distance residual under different driving cycles.
Figure 7e,f shed light on the issues observed with the DQN network in Figure 7c,d. It is evident that the torque output by the DQN fluctuated around a straight line, while the DDPG network provided continuous control values, indicating the DQN’s provision of only discrete torque, making it ill-suited for addressing real-world continuous scenarios.
Vehicle gap and average gap offer a more direct comparison between the two methods. Notably, in both Figure 7g,h, the method introduced in this paper resulted in smaller gap fluctuations, with the vehicle gap fluctuation of the DQN method was approximately twice that of the method presented in this study. In Figure 7g, the inter-vehicle distance residual compared to the standard distance for the DQN fluctuated between −17 m and 12 m, while the introduced method exhibited minor fluctuations between −5 m and 5 m. Similarly, in Figure 7h, the DQN method showed fluctuations between −11 m and 6 m, and the introduced method, only between −5 m and 3 m. It was also observed that the vehicle gap for the DQN frequently exhibited significant deviations in short time spans, such as at the 600 s mark in Figure 7g, which can be attributed to the sudden acceleration or deceleration resulting from the discrete torque outputs. In real-world driving, such large gap differences often indicate a high risk of major traffic accidents. The method in this study avoids sudden sharp accelerations or decelerations and is adaptable to the majority of traffic scenarios. Regarding the metric of the average vehicle gap, Figure 7i showcases a comparison of the average absolute distance residual under five different operating conditions, where the method in this study demonstrated a reduction in the inter-vehicle distance residual by 25% to 60% compared to the DQN method. It is evident that the method introduced in this paper consistently resulted in a better distance retention performance compared to the DQN approach. In conclusion, the DDPG’s capability to handle continuous tasks ensured that the method introduced in this paper outperformed the DQN in all three evaluation metrics, providing higher safety and more effective task completion.
4.4. Validation of Temperature and Degradation Control
In order to validate the performance of the multi-objective optimization method, battery temperature and SOH were selected as key metrics for performance evaluation in this study. Moreover, to provide a comprehensive assessment, evaluations were conducted under two distinct driving conditions: China City and NEDC.
From Figure 8a,b, at an ambient temperature of 25 °C, under both the China City and NEDC driving conditions, the proposed method exhibited superior control over the internal temperature of the battery. Compared to the thermal- and health-neglecting method, the proposed approach managed to maintain the battery temperature lower by 0.5 °C to 2 °C for most of the time, thereby keeping it within a narrower temperature range.
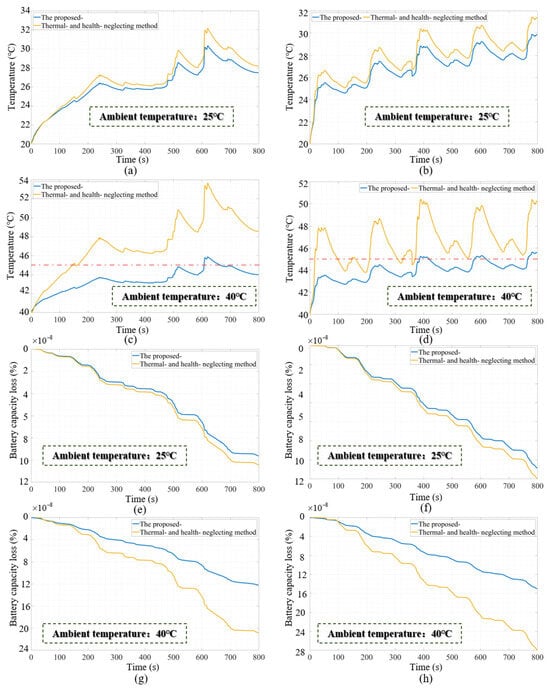
Figure 8.
Control performances with/without temperature and degradation augmented in the reward (under the China City and NEDC driving cycles). (a,b) Internal temperature when ambient temperature was 25 °C. (c,d) Internal temperature when ambient temperature was 40 °C. (e,f) Battery degradation when ambient temperature was 25 °C. (g,h) Battery degradation when ambient temperature was 40 °C.
Additionally, in Figure 8c,d, at an ambient temperature of 40 °C, the proposed method outperformed the thermal- and health-neglecting method in terms of internal battery temperature control under both driving conditions, achieving a reduction of 4 °C to 8 °C for the majority of the time. The method consistently maintained the battery temperature around 45 °C, effectively mitigating potential risks associated with battery overheating and reducing the wasteful conversion of electric energy into heat.
Regarding the battery’s SOH, Figure 8e,f present the situation at an ambient temperature of 25 °C. Evidently, under both the China City and NEDC driving conditions, the proposed method offered enhanced protection to the battery. Specifically, the method resulted in a 7.69% smaller decline in battery degradation compared to the thermal- and health-neglecting method, ensuring a more gradual decline in its SOH. Similarly, at an ambient temperature of 40 °C, as observed from Figure 8g,h, the proposed method showed a 46.43% smaller decline in its SOH compared to the thermal- and health-neglecting method, marking a significantly superior protection under both temperature conditions.
In conclusion, by examining battery temperature and SOH under different driving conditions, the multi-objective optimization method demonstrated considerable advantages in both battery heat and lifespan control. Furthermore, a comparative analysis indicated that the method is especially effective under higher ambient temperatures. This approach not only ensures optimal vehicle spacing but also provides enhanced protection to the battery, thereby prolonging its lifespan and augmenting its safety.
For a holistic evaluation, tests were conducted across various ambient temperatures, specifically 10 °C, 25 °C, 30 °C, 35 °C, and 40 °C. The results clearly delineated the disparity between the proposed method and the thermal- and health-neglecting method across these critical metrics. As depicted in Figure 9a, with the rise in ambient temperature, both methods exhibited a trend of increasing the average battery temperature. However, across all temperatures, the temperature rise observed in the proposed method was consistently lower than in the thermal- and health-neglecting method. At an ambient temperature of 10 °C, the temperature increase in the proposed method was 6.25% less than that of the thermal- and health-neglecting method, and at 40 °C, it was 57.14% less. This difference became even more salient with the ascent in ambient temperature, underscoring the method’s proficiency in maintaining battery temperature stability.

Figure 9.
(a) Average temperature rises under different ambient temperatures. (b) SOH drops per 10,000 km under different ambient temperatures.
As shown in Figure 9b, in terms of the percentage degradation in the battery’s SOH, the proposed method consistently outperformed the thermal- and health-neglecting method across the spectrum of ambient temperatures. The difference was pronounced even at the lower end of the temperature scale and amplified at elevated temperatures. At an ambient temperature of 10 °C, the SOH degradation percentage in the proposed method was 6.25% less than that of the thermal- and health-neglecting method, and at the higher temperature of 40 °C, it was 54.23% less, reinforcing the superior performance of the method in preserving battery health.
4.5. Validation of Overall Driving Cost Optimization
The cost of battery degradation cannot be reflected in the driving economy of EVs. Therefore, the overall driving cost was adopted in this study for measuring the performance of energy management from the perspective of users. The cost of battery degradation can be quantified using a battery replacement price of CNY 69,800, and in addition, the charging price for EVs is CNY 0.96/kW·h. Table 2 provides a comparison of the overall driving costs using different strategies. As shown in the table, although the proposed strategy is not optimal from the perspective of electricity consumption, it contributes to a lesser battery degradation cost of CNY 2722.2 and actually enjoys the lowest overall driving cost of CNY 5248.92. Compared with the strategy based on the thermal- and health-neglecting method, the overall driving cost was reduced by 18.72%, which clearly demonstrates the superiority of the proposed strategy compared to the existing RL strategy.

Table 2.
Cost per 10,000 km by using different strategies (surrounding temperature: 30 °C; driving cycle: NEDC).
5. Conclusions
This study introduced an innovative, multi-physics-constrained, cruise control strategy for intelligently connected EVs, addressing a critical issue of safeguarding onboard LIBs from overutilization and rapid degradation while ensuring travel efficiency. A DRL strategy based on DDPG was employed. Compared to the thermal- and health-neglecting method, this strategy reduced the overall driving cost by 18.72%. To further validate this approach, DDPG was compared with DQN in an environment with a continuous action space. The DDPG network exhibited significant advantages in car-following aspects compared to the DQN. It not only maintained a better vehicle distance but also showed greater similarity with the leading vehicle in terms of torque and speed. Additionally, this research undertook multi-objective optimization. The experimental results indicated that, compared to the thermal- and health-neglecting method, this method significantly reduced battery temperature by 4 °C to 8 °C in high ambient temperatures, while also reducing the SOH degradation by up to 46.43%, demonstrating significant insights into the cruise control strategy that traded off between an LIB’s thermal safety and the overall driving cost.
Author Contributions
Conceptualization, X.C. (Xiangheng Cheng) and X.C.(Xin Chen); methodology, X.C. (Xin Chen).; software, X.C. (Xiangheng Cheng); validation, X.C. (Xiangheng Cheng), X.C. (Xin Chen); formal analysis, X.C. (Xiangheng Cheng); investigation, X.C. (Xiangheng Cheng); resources, X.C. (Xin Chen); data curation, X.C. (Xiangheng Cheng); writing—original draft preparation, X.C. (Xin Chen); writing—review and editing, X.C. (Xiangheng Cheng); visualization, X.C. (Xiangheng Cheng); supervision, X.C. (Xiangheng Cheng); project administration, X.C. (Xin Chen); funding acquisition, X.C. (Xin Chen). All authors have read and agreed to the published version of the manuscript.
Funding
This research received no external funding.
Data Availability Statement
All relevant data are included in this paper.
Conflicts of Interest
The authors declare no conflicts of interest.
References
- Li, L.; Yang, C.; Zhang, Y.H.; Zhang, L.P.; Song, J. Correctional DP-Based Energy Management Strategy of Plug-In Hybrid Electric Bus for City-Bus Route. IEEE Trans. Veh. Technol. 2015, 64, 2792–2803. [Google Scholar] [CrossRef]
- Kim, N.; Cha, S.; Peng, H. Optimal Control of Hybrid Electric Vehicles Based on Pontryagin’s Minimum Principle. IEEE Trans. Control Syst. Technol. 2011, 19, 1279–1287. [Google Scholar]
- Hou, C.; Ouyang, M.G.; Xu, L.F.; Wang, H.W. Approximate Pontryagin’s minimum principle applied to the energy management of plug-in hybrid electric vehicles. Appl. Energy 2014, 115, 174–189. [Google Scholar] [CrossRef]
- Wang, H.; Huang, Y.J.; Khajepour, A.; He, H.W.; Cao, D.P. A novel energy management for hybrid off-road vehicles without future driving cycles as a priori. Energy 2017, 133, 929–940. [Google Scholar] [CrossRef]
- Xie, S.B.; Hu, X.S.; Xin, Z.K.; Li, L. Time-Efficient Stochastic Model Predictive Energy Management for a Plug-In Hybrid Electric Bus With an Adaptive Reference State-of-Charge Advisory. IEEE Trans. Veh. Technol. 2018, 67, 5671–5682. [Google Scholar] [CrossRef]
- Amin; Trilaksono, B.R.; Rohman, A.S.; Dronkers, C.J.; Ortega, R.; Sasongko, A. Energy Management of Fuel Cell/Battery/Supercapacitor Hybrid Power Sources Using Model Predictive Control. IEEE Trans. Ind. Inform. 2014, 10, 1992–2002. [Google Scholar] [CrossRef]
- Zhang, Q.; Deng, W.W.; Li, G. Stochastic Control of Predictive Power Management for Battery/Supercapacitor Hybrid Energy Storage Systems of Electric Vehicles. IEEE Trans. Ind. Inform. 2018, 14, 3023–3030. [Google Scholar] [CrossRef]
- Hamednia, A.; Sharma, N.K.; Murgovski, N.; Fredriksson, J. Computationally Efficient Algorithm for Eco-Driving Over Long Look-Ahead Horizons. IEEE Trans. Intell. Transp. Syst. 2022, 23, 6556–6570. [Google Scholar] [CrossRef]
- Mnih, V.; Kavukcuoglu, K.; Silver, D.; Graves, A.; Antonoglou, I.; Wierstra, D.; Riedmiller, M. Playing atari with deep reinforcement learning. arXiv 2013, arXiv:1312.5602. [Google Scholar]
- Lillicrap, T.P.; Hunt, J.J.; Pritzel, A.; Heess, N.; Erez, T.; Tassa, Y.; Silver, D.; Wierstra, D. Continuous control with deep reinforcement learning. arXiv 2015, arXiv:1509.02971. [Google Scholar]
- Oh, J.; Chockalingam, V.; Lee, H. Control of memory, active perception, and action in minecraft. In Proceedings of the International Conference on Machine Learning, New York, NY, USA, 19–24 June 2016; pp. 2790–2799. [Google Scholar]
- Schulman, J.; Levine, S.; Abbeel, P.; Jordan, M.; Moritz, P. Trust region policy optimization. In Proceedings of the International Conference on Machine Learning, Lille, France, 6–11 July 2015; pp. 1889–1897. [Google Scholar]
- Kendall, A.; Hawke, J.; Janz, D.; Mazur, P.; Reda, D.; Allen, J.-M.; Lam, V.-D.; Bewley, A.; Shah, A. Learning to drive in a day. In Proceedings of the 2019 International Conference on Robotics and Automation (ICRA), Montreal, QC, Canada, 20–24 May 2019; pp. 8248–8254. [Google Scholar]
- Lee, H.; Kim, K.; Kim, N.; Cha, S.W. Energy efficient speed planning of electric vehicles for car-following scenario using model-based reinforcement learning. Appl. Energy 2022, 313, 118460. [Google Scholar] [CrossRef]
- Guo, Q.Q.; Angah, O.; Liu, Z.J.; Ban, X.G. Hybrid deep reinforcement learning based eco-driving for low-level connected and automated vehicles along signalized corridors. Transp. Res. Part C Emerg. Technol. 2021, 124, 102980. [Google Scholar] [CrossRef]
- Shi, J.; Qiao, F.; Li, Q.; Yu, L.; Hu, Y. Application and evaluation of the reinforcement learning approach to eco-driving at intersections under infrastructure-to-vehicle communications. Transp. Res. Rec. 2018, 2672, 89–98. [Google Scholar] [CrossRef]
- Mnih, V.; Kavukcuoglu, K.; Silver, D.; Rusu, A.A.; Veness, J.; Bellemare, M.G.; Graves, A.; Riedmiller, M.; Fidjeland, A.K.; Ostrovski, G.; et al. Human-level control through deep reinforcement learning. Nature 2015, 518, 529–533. [Google Scholar] [CrossRef] [PubMed]
- Hao, P.; Wei, Z.; Bai, Z.; Barth, M.J. Developing an Adaptive Strategy for Connected Eco-Driving under Uncertain Traffic and Signal Conditions; National Center for Sustainable Transportation: Davis, CA, USA, 2020. [Google Scholar]
- Wu, J.; Song, Z.; Lv, C. Deep Reinforcement Learning based Energy-efficient Decision-making for Autonomous Electric Vehicle in Dynamic Traffic Environments. IEEE Trans. Transp. Electrif. 2023, 10, 875–887. [Google Scholar] [CrossRef]
- Wu, J.; Zhou, Y.; Yang, H.; Huang, Z.; Lv, C. Human-guided reinforcement learning with sim-to-real transfer for autonomous navigation. IEEE Trans. Pattern Anal. Mach. Intell. 2023, 45, 14745–14759. [Google Scholar] [CrossRef] [PubMed]
- Lin, X.; Wang, Y.Z.; Bogdan, P.; Chang, N.; Pedram, M. Reinforcement Learning Based Power Management for Hybrid Electric Vehicles. In Proceedings of the 33rd IEEE/ACM International Conference on Computer-Aided Design (ICCAD), San Jose, CA, USA, 2–6 November 2014; pp. 32–38. [Google Scholar]
- Liu, X.; Liu, Y.W.; Chen, Y.; Hanzo, L. Enhancing the Fuel-Economy of V2I-Assisted Autonomous Driving: A Reinforcement Learning Approach. IEEE Trans. Veh. Technol. 2020, 69, 8329–8342. [Google Scholar] [CrossRef]
- Li, G.Q.; Gorges, D. Ecological Adaptive Cruise Control for Vehicles With Step-Gear Transmission Based on Reinforcement Learning. IEEE Trans. Intell. Transp. Syst. 2020, 21, 4895–4905. [Google Scholar] [CrossRef]
- Xu, S.B.; Peng, H. Design and Comparison of Fuel-Saving Speed Planning Algorithms for Automated Vehicles. IEEE Access 2018, 6, 9070–9080. [Google Scholar] [CrossRef]
- Sutton, R.S.; Barto, A.G. Reinforcement Learning: An Introduction; MIT Press: Cambridge, MA, USA, 2018. [Google Scholar]
- Tan, H.; Zhang, H.; Peng, J.; Jiang, Z.; Wu, Y. Energy management of hybrid electric bus based on deep reinforcement learning in continuous state and action space. Energy Convers. Manag. 2019, 195, 548–560. [Google Scholar] [CrossRef]
- Wu, Y.; Tan, H.; Peng, J.; Zhang, H.; He, H. Deep reinforcement learning of energy management with continuous control strategy and traffic information for a series-parallel plug-in hybrid electric bus. Appl. Energy 2019, 247, 454–466. [Google Scholar] [CrossRef]
- Liu, L.; Guan, P. Phase-Field Modeling of Solid Electrolyte Interphase (SEI) Evolution: Considering Cracking and Dissolution during Battery Cycling. ECS Trans. 2019, 89, 101. [Google Scholar] [CrossRef]
- Shi, M.; He, H.W.; Li, J.W.; Han, M.; Jia, C.C. Multi-objective tradeoff optimization of predictive adaptive cruising control for autonomous electric buses: A cyber-physical-energy system approach. Appl. Energy 2021, 300, 117385. [Google Scholar] [CrossRef]
- Lin, X.F.; Perez, H.E.; Mohan, S.; Siegel, J.B.; Stefanopoulou, A.G.; Ding, Y.; Castanier, M.P. A lumped-parameter electro-thermal model for cylindrical batteries. J. Power Sources 2014, 257, 1–11. [Google Scholar] [CrossRef]
- Wu, J.D.; Wei, Z.B.; Li, W.H.; Wang, Y.; Li, Y.W.; Sauer, D.U. Battery Thermal- and Health-Constrained Energy Management for Hybrid Electric Bus Based on Soft Actor-Critic DRL Algorithm. IEEE Trans. Ind. Inform. 2021, 17, 3751–3761. [Google Scholar] [CrossRef]
Disclaimer/Publisher’s Note: The statements, opinions and data contained in all publications are solely those of the individual author(s) and contributor(s) and not of MDPI and/or the editor(s). MDPI and/or the editor(s) disclaim responsibility for any injury to people or property resulting from any ideas, methods, instructions or products referred to in the content. |
© 2024 by the authors. Licensee MDPI, Basel, Switzerland. This article is an open access article distributed under the terms and conditions of the Creative Commons Attribution (CC BY) license (https://creativecommons.org/licenses/by/4.0/).