Article

Quantitative Analysis of Lithium-Ion Battery Eruption Behavior in Thermal Runaway

1
DaLian CRRC Diesel Engine Co., Ltd., Dalian 116028, China
2
College of Locomotive and Rolling Stock Engineering, Dalian Jiaotong University, Dalian 116028, China
*
Author to whom correspondence should be addressed.
Batteries 2024, 10(6), 182; https://doi.org/10.3390/batteries10060182
Submission received: 11 April 2024 / Revised: 17 May 2024 / Accepted: 24 May 2024 / Published: 26 May 2024
(This article belongs to the Special Issue Battery Thermal Performance and Management: Advances and Challenges)

Abstract

:
With the widespread adoption of battery technology in electric vehicles, there has been significant attention drawn to the increasing frequency of battery fire incidents. However, the jetting behavior and expansion force during the thermal runaway (TR) of batteries represent highly dynamic phenomena, which lack comprehensive quantitative description. This study addresses this gap by employing an enhanced experimental setup that synchronizes the video timing of cameras with a signal acquisition system, enabling the multidimensional quantification of signals, such as images, temperature, voltage, and pressure. It also provides a detailed description of the jetting behavior and expansion force characteristics over time for Li(Ni0.8Co0.1Mn0.1)O2 batteries undergoing thermal runaway in an open environment. The results from three experiments effectively identify key temporal features, including the timing of the initial jetting spark, maximum jetting velocity, jetting duration, explosion duration, and patterns of flame volume variation. This quantitative analytical approach proves effective across various battery types and conditions. The findings could offer scientific foundations and experimental strategies for parameter identification in fire prevention and thermal runaway model development.

1. Introduction

The ubiquitous presence of lithium-ion batteries in various open environments, including renewable energy storage systems, electric vehicles, and portable electronics, underscores the critical need to comprehend and mitigate the risks associated with thermal runaway events [1,2,3]. In open environments, characterized by diverse ambient conditions and exposure to external factors, the dynamics of battery thermal runaway are subject to unique complexities that warrant thorough investigation [4,5].
Of particular interest in this context is the study of ejection behavior and expansion force characteristics during battery thermal runaway [6,7]. Ejection behavior refers to the expulsion of internal battery components, electrolytes, and gases from the cell, while expansion force characterizes the pressure exerted on the cell enclosure due to gas generation and cell expansion [8]. Understanding these phenomena is pivotal for devising effective safety measures and risk mitigation strategies tailored to open environmental conditions. In open environments, where batteries are subjected to fluctuating ambient conditions, exposure to external elements, and dynamic operational scenarios, the risk of thermal runaway is further compounded. Therefore, comprehensive research efforts are essential to unravel the complexities of thermal runaway and develop effective strategies for mitigating its adverse effects in open environments [9].
Cai et al. [10] investigated the expansion force of batteries under internal short-circuit (ISC) conditions and developed a gas model based on the secondary reaction of SEI decomposition, which accurately captures the early rise in the expansion force. The study also concluded that, compared to voltage and temperature, the expansion force can be used to diagnose ISC more rapidly and with higher confidence [10,11]. Research [12] suggests that the gas produced from the decomposition of the SEI layer is the fundamental cause of significant expansion force. These characteristics of high sensitivity and reliability hold enormous potential for enhancing battery safety. However, current research primarily focuses on batteries during normal charging, neglecting detailed mechanical properties during overcharging.
The gas generated within the battery is considered the primary cause of battery expansion under abusive conditions [13]. Golubkov et al. [14] established a gas model based on side reactions and measured the gas volume and composition at different states of charge (SOC) during thermal runaway (TR); it was found that higher SOC correlates with increased levels of O2 and CO2. Ostanek et al. [15] observed that the gas generation rate of each side reaction correlates with the heat release rate. Utilizing these findings, a thermal-gas coupling model was devised to simulate both heat and gas generation under overheating conditions, providing a foundation for investigating gas production from side reactions. While these researchers provided profound insights into the gas generation mechanisms of typical chemical reactions within batteries, little attention has been devoted to investigating the correlation between mechanical reactions and gas emissions.
This study employs experimental techniques, such as high-speed imaging, pressure sensing, and temperature detection, to elucidate the temporal evolution, spatial distribution, and magnitude of eruption behavior and expansion forces during the thermal runaway of Li(Ni0.8Co0.1Mn0.1)O2 batteries. Insights gained from simulating real-world scenarios encountered in open environments hold significant implications for enhancing the safety, reliability, and sustainability of lithium-ion batteries in such settings. By deepening our understanding of eruption behavior and expansion force characteristics under actual conditions, we aim to provide insights for the development of robust safety protocols, resilient battery enclosures, and proactive risk management strategies tailored to open environments.

2. Materials and Methods

2.1. Battery Samples

The LIBs utilized for thermal abuse testing in this study are commercial prismatic lithium-ion batteries with a rated capacity of 58 Ah, designed for electric vehicle applications. According to the manufacturer’s recommendations, the safety valve ruptures and vents when the pressure differential between the internal and external regions of the battery reaches 5 MPa. For detailed battery specifications, please refer to Table 1.
Prior to thermal abuse testing, battery cells underwent charge–discharge cycling tests using a CT-4008-5V20A-A cycling instrument under constant-temperature conditions of 25 °C, the device is manufactured by Shenzhen Neware Electronics Co., Ltd. in Shenzhen, China. During the cycling tests, the batteries were initially discharged to 2.75 V at a constant current of 5 A and then held for 5 h. Subsequently, the batteries were charged at a constant current of 5 A until the voltage reached 4.35 V, followed by a 5-h rest period. This discharge and charge cycle was repeated three times. Following the cycling tests, batteries exhibiting satisfactory cycling performance were discharged to 2.75 V at a constant current of 5 A and then held for 5 h. They were then charged in CC–CV mode until reaching 4.35 V to achieve 100% state of charge (SOC). After a 48-h rest period, thermal abuse experiments were conducted in a thermodynamic chamber.
The analysis of the mechanism of battery thermal runaway expansion factors in the Results and Discussion section was supported by the GPT-3.5 language model developed by OpenAI. Heat release, material expansion, and structural damage were also generated with assistance from the GPT-3.5 language model developed by OpenAI.

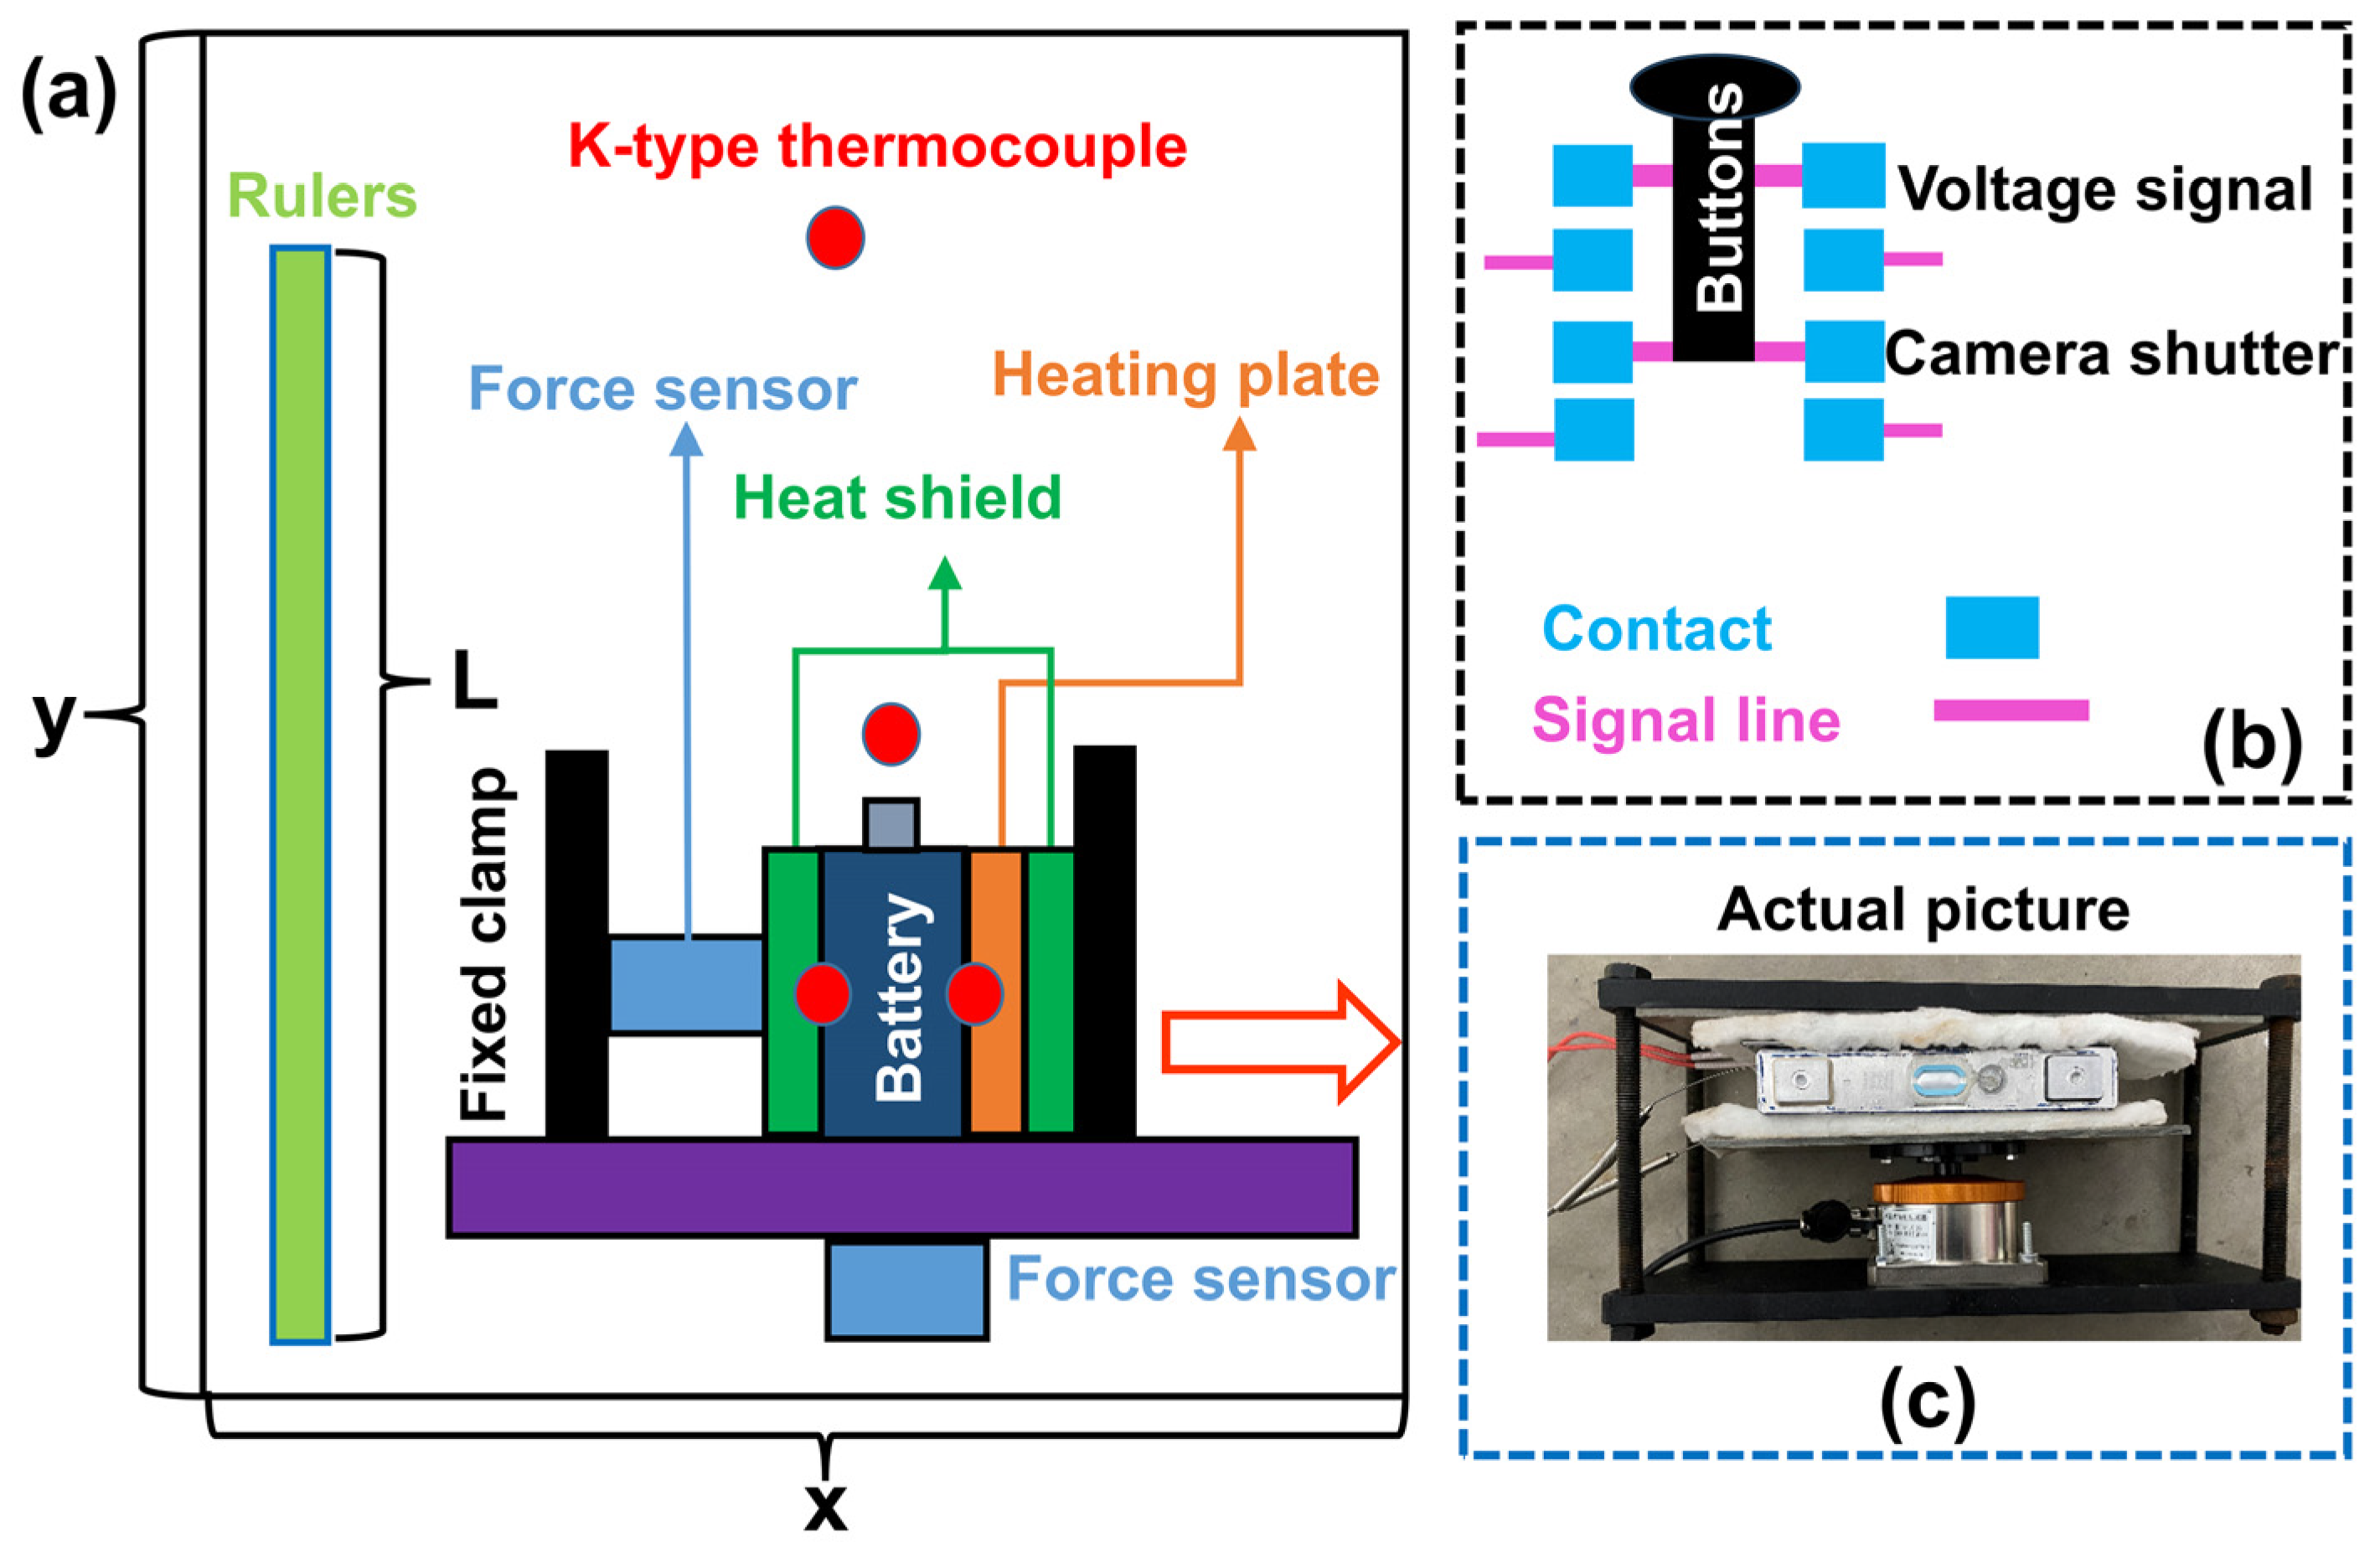
2.2. Experimental Setup

In this investigation, experimental methodologies were meticulously applied to delve into the intricate features associated with safety valve eruption and expansion force dynamics amidst battery thermal runaway scenarios. Under carefully controlled experimental settings, the intricate morphology of eruption flames was meticulously monitored and instantaneously recorded through the adept utilization of high-speed photography techniques. Concurrently, an in-depth analysis of the flame propagation behavior was meticulously conducted. Moreover, this study concurrently focused on quantifying the expansion force (EF) through the meticulous deployment of pressure sensor measurement equipment, ensuring a comprehensive understanding of the multifaceted phenomena under scrutiny.
In this experimental configuration, as depicted in Figure 1, mechanical clamps were utilized to impose mechanical constraints on the front and rear walls of the battery enclosure. In accordance with guidelines provided by the battery manufacturer, a pre-defined pre-tightening force of 50 N was applied prior to thermal abuse testing. Temperature measurements from three distinct locations were meticulously gathered using K-type thermocouples; specifically, the surface temperature of the battery is denoted as T S , the temperature recorded 1 cm above the safety release valve is denoted as T E , and the temperature measured at the heating plate is denoted as T H . Furthermore, the experimental setup encompassed a dedicated pressure sensor tasked with capturing variations in lateral forces exerted on the battery casing throughout the thermal runaway process. Additionally, a mass sensor was employed to track alterations in mass (m), subsequently convertible to changes in vertical forces, in accordance with Equation (1). Enhancements in the signal lines facilitated synchronization between video timestamps and sensor data. Specifically, as illustrated in Figure 1b, an auxiliary voltage signal line was introduced. Upon depression of a designated button, the contacts of the camera shutter and the voltage signal were concurrently connected, enabling the signal acquisition system to effectively identify the commencement of camera recording based on the precise initiation point of the voltage signal received via this channel. It is pertinent to note that throughout the entirety of the experimental process, all sensors operated consistently at a sampling frequency of 10 Hz.
The procedure for conducting the thermal runaway tests involved three repetitions and is delineated as follows: The initial temperature of both the battery and the ambient environment was maintained at 25 °C. Thermal runaway in the battery was induced by applying lateral heating using a 400 W constant power heating plate (with dimensions of 148.24 mm × 102.8 mm). When the battery voltage first reached zero, the power supply to the heating plate was promptly disconnected. Subsequently, photographs were captured of the battery and any residual materials post-thermal runaway.
G = mg
In this context, G denotes the gravitational force (unit: N), while g represents gravitational acceleration (9.80 N·kg).

2.3. Experimental Setup Calculation of Flame Area and Velocity

In order to perform a quantitative assessment of the flame region, as the boundaries of the flame are dynamic and indistinct, it is necessary to process the flame images captured by the camera. The binarization of images is a process wherein grayscale images are converted into binary images. The principle involves establishing a threshold based on the pixel grayscale values, wherein pixels below this threshold are set to black (0) and those above it are set to white (255). The threshold can be manually adjusted or automatically determined based on the image characteristics and intended application. Binarization facilitates subsequent image processing and analysis by rendering the image in a straightforward black-and-white format.
In Figure 1a, the length L of the ruler is a predetermined parameter, while x and y denote the actual dimensions of the photograph. Leveraging the ‘Matplotlib’ library within Python alongside the ‘imshow’ function and the ‘LineSelector’ functionality encapsulated within the ‘matplotlib.widgets’ module enables the estimation of x and y values in Figure 1, thus facilitating the computation of the photograph’s true area. Subsequently, flame images captured during experimental procedures are transformed into binary representations. Within the Python environment, the ‘area’ attribute of the ‘skimage.measure.regionprops’ function facilitates the computation of pixel points within white regions of the binary image. By determining the ratio between the area of the white region and the total image area, inference regarding the extent of the flame can be derived. Treating the flame’s extent as that of a circle yields an estimated radius. Furthermore, by considering the camera’s frame rate, the temporal interval between any two consecutive images can be calculated, allowing for the computation of flame propagation velocity based on the radius of the flame’s equivalent circle.

3. Results and Discussion

Within the domain of thermal runaway experiments pertaining to batteries, a plethora of experimental conditions and battery configurations are evident in the literature [2,9,16,17]. Despite this diversity, the temporal evolution characteristics of average temperature and pressure obtained from each experiment consistently portray the behavior of gas emissions. The quantity of gas expelled, determined through the interaction of the aforementioned thermodynamic parameters, emerges as an optimal variable for characterizing the entire gas venting process. Leveraging the principles articulated in Equation (2) [18] regarding the ideal gas law, the quantity of gas discharged (denoted as n) can be deduced from the tested battery using the following expression:
n ( t ) = ( P avg ( t ) V ) / ( R T avg   ( t ) ) - n 0
In this context, n represents the quantity of gas expelled from the tested battery during the thermal runaway process (unit: mol); P(t) denotes the average pressure recorded within the sealed chamber at time t (unit: Pa); V signifies the volume of the experimental chamber; and R stands for the ideal gas constant, with a value of 8.314 J·K−1·mol−1.
Based on Figure 2 [18], it is evident that, prior to the eruption, the interior of the battery chamber is considered to be in equilibrium; hence, the initial gas quantity n_0 derived from the ideal gas law is approximately accurate and convincing. Similarly, at the conclusion of the eruption event, the rate of gas release from within the battery gradually diminishes; thus, assuming a quasi-equilibrium for the internal gas is reasonable, justifying the introduction of the ideal gas law. However, due to the highly uneven temperature field induced by the vigorous eruption, a non-equilibrium stage emerges, as depicted in Figure 2. During this stage, the ideal gas law is inapplicable due to the complex variations in eruption. This phase remains unpredictable due to the intricate dynamics of the eruption process. Typically, the values of ( t 0 , n 0 ) can be determined by the ideal gas law during the quasi-equilibrium phase [19], while n total can be readily obtained from Equation (2). During the non-equilibrium phase, however, discrepancies arise between the gas quantity determined by the ideal gas law and the actual curve due to inaccuracies in temperature and pressure measurements.

3.1. Temperature and Force Dynamics during TR

Three repeated experiments were conducted. Figure 3a illustrates the results of the first experimental trial. To facilitate a more detailed analysis of the experimental data, a local magnification was applied to the first trial within the time range of −20 s to 20 s, as depicted in Figure 3b. Figure A1a displays the results of the second experiment, while Figure A1b shows the results of the third experiment. These three experiments demonstrate good repeatability, indicating a certain degree of reliability and stability in the experimental results. The points where the voltage drops to zero in both Figure 3 and Figure A1 are considered the zero time points. The heating plate was powered on at the time point of −(355 ± 5) s for all three repeated experiments.
Analysis of Figure 3 reveals the following significant moments:
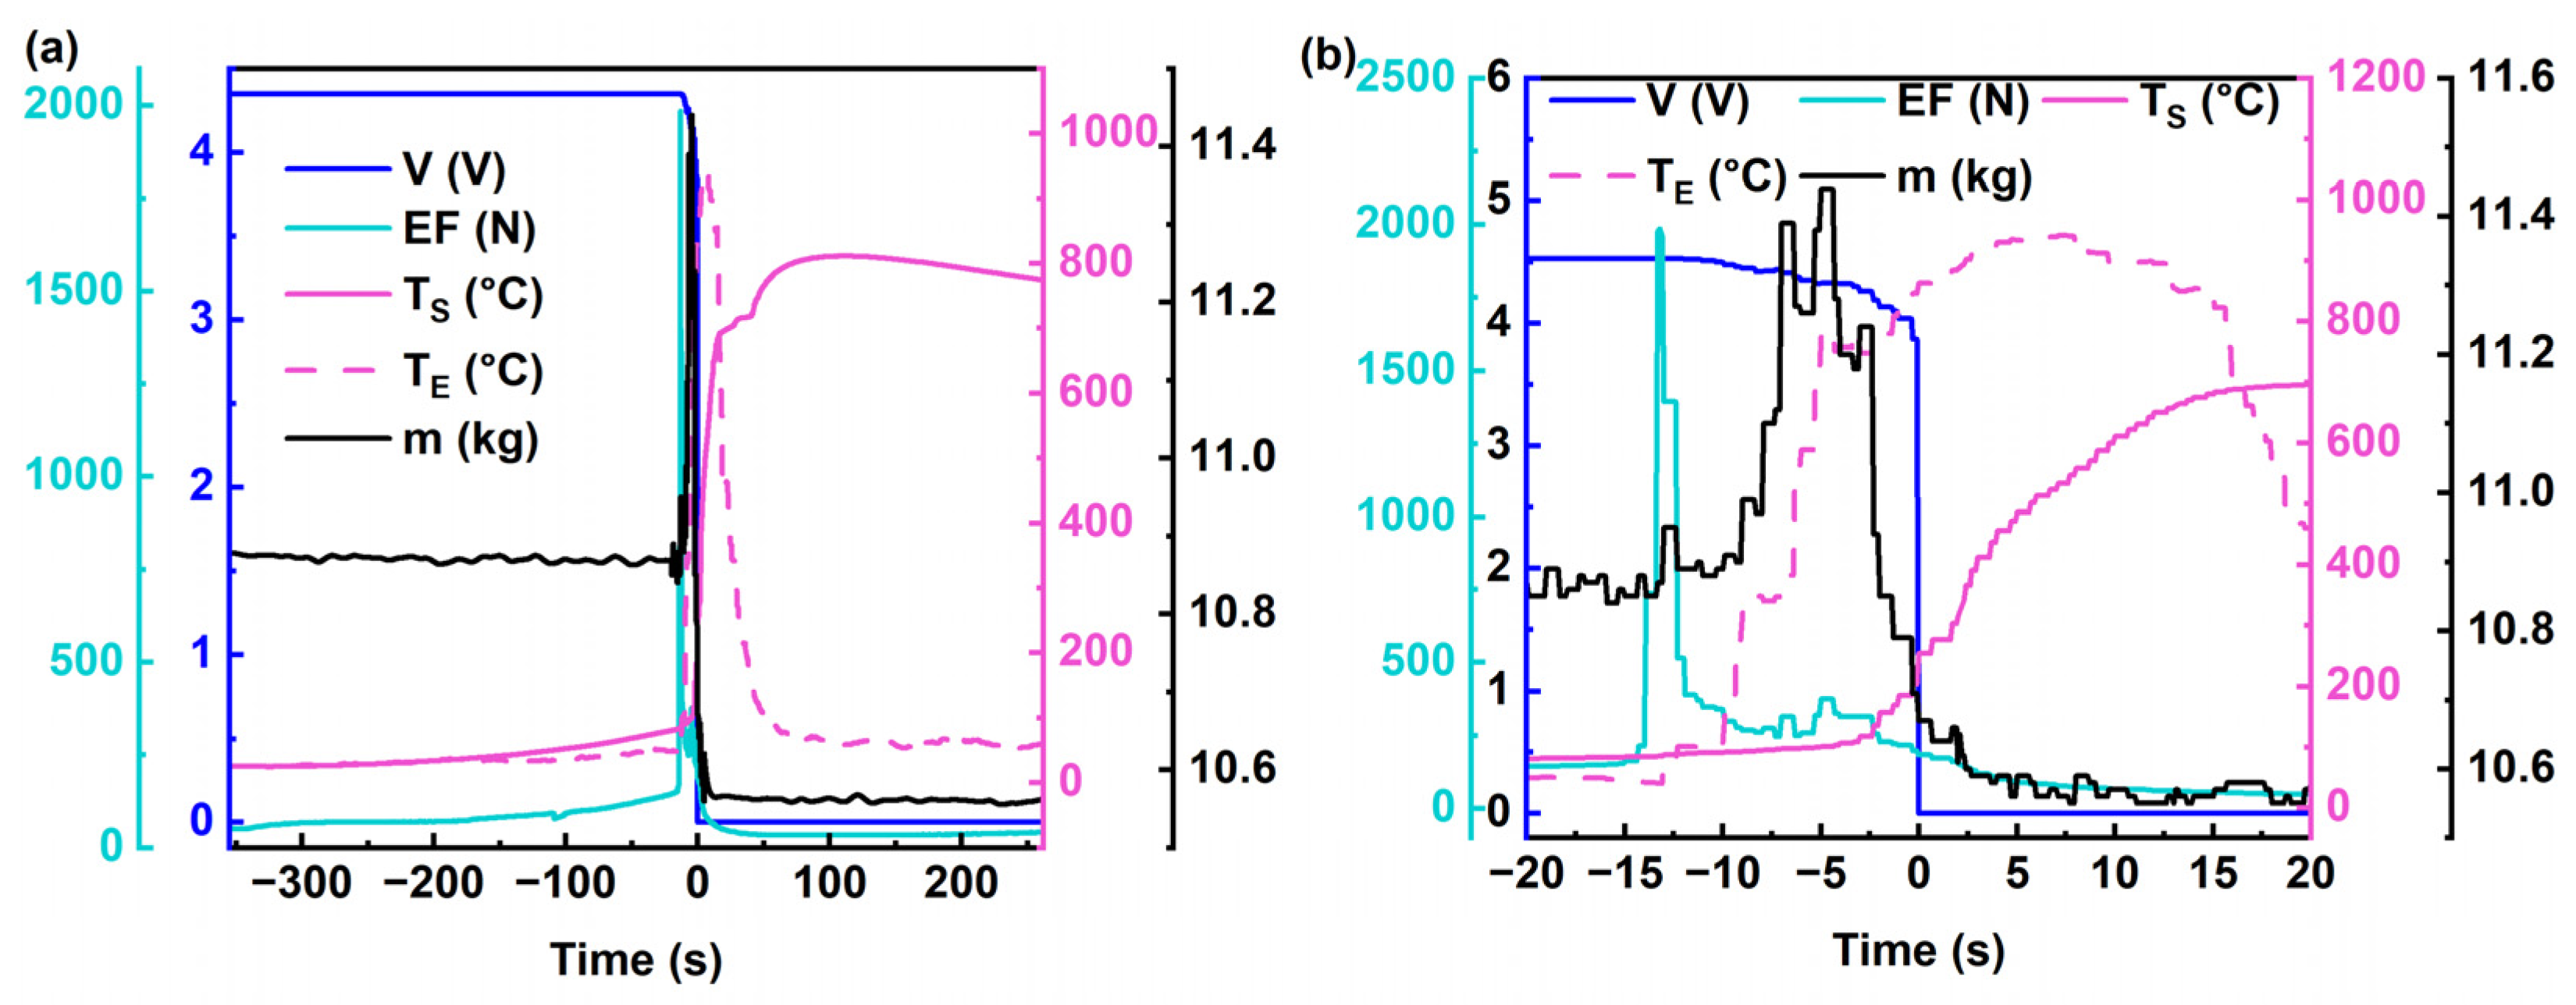
  • At the −110 s mark: Fluctuations in expansion force are observed, decreasing from 92 N to 77 N;
  • At the −15 s mark: Expansion force initiates a sharp ascent, reaching a peak value of 1980 N at −13.5 s, representing a 12-fold increase within a duration of 2.5 s. Figure A1 shows the rate of change in the expansion force;
  • At the −13 s mark: Expansion force peaks and begins a rapid decline, registering at 1395 N, accompanied by a rapid rise in T E values and a slight increase in mass;
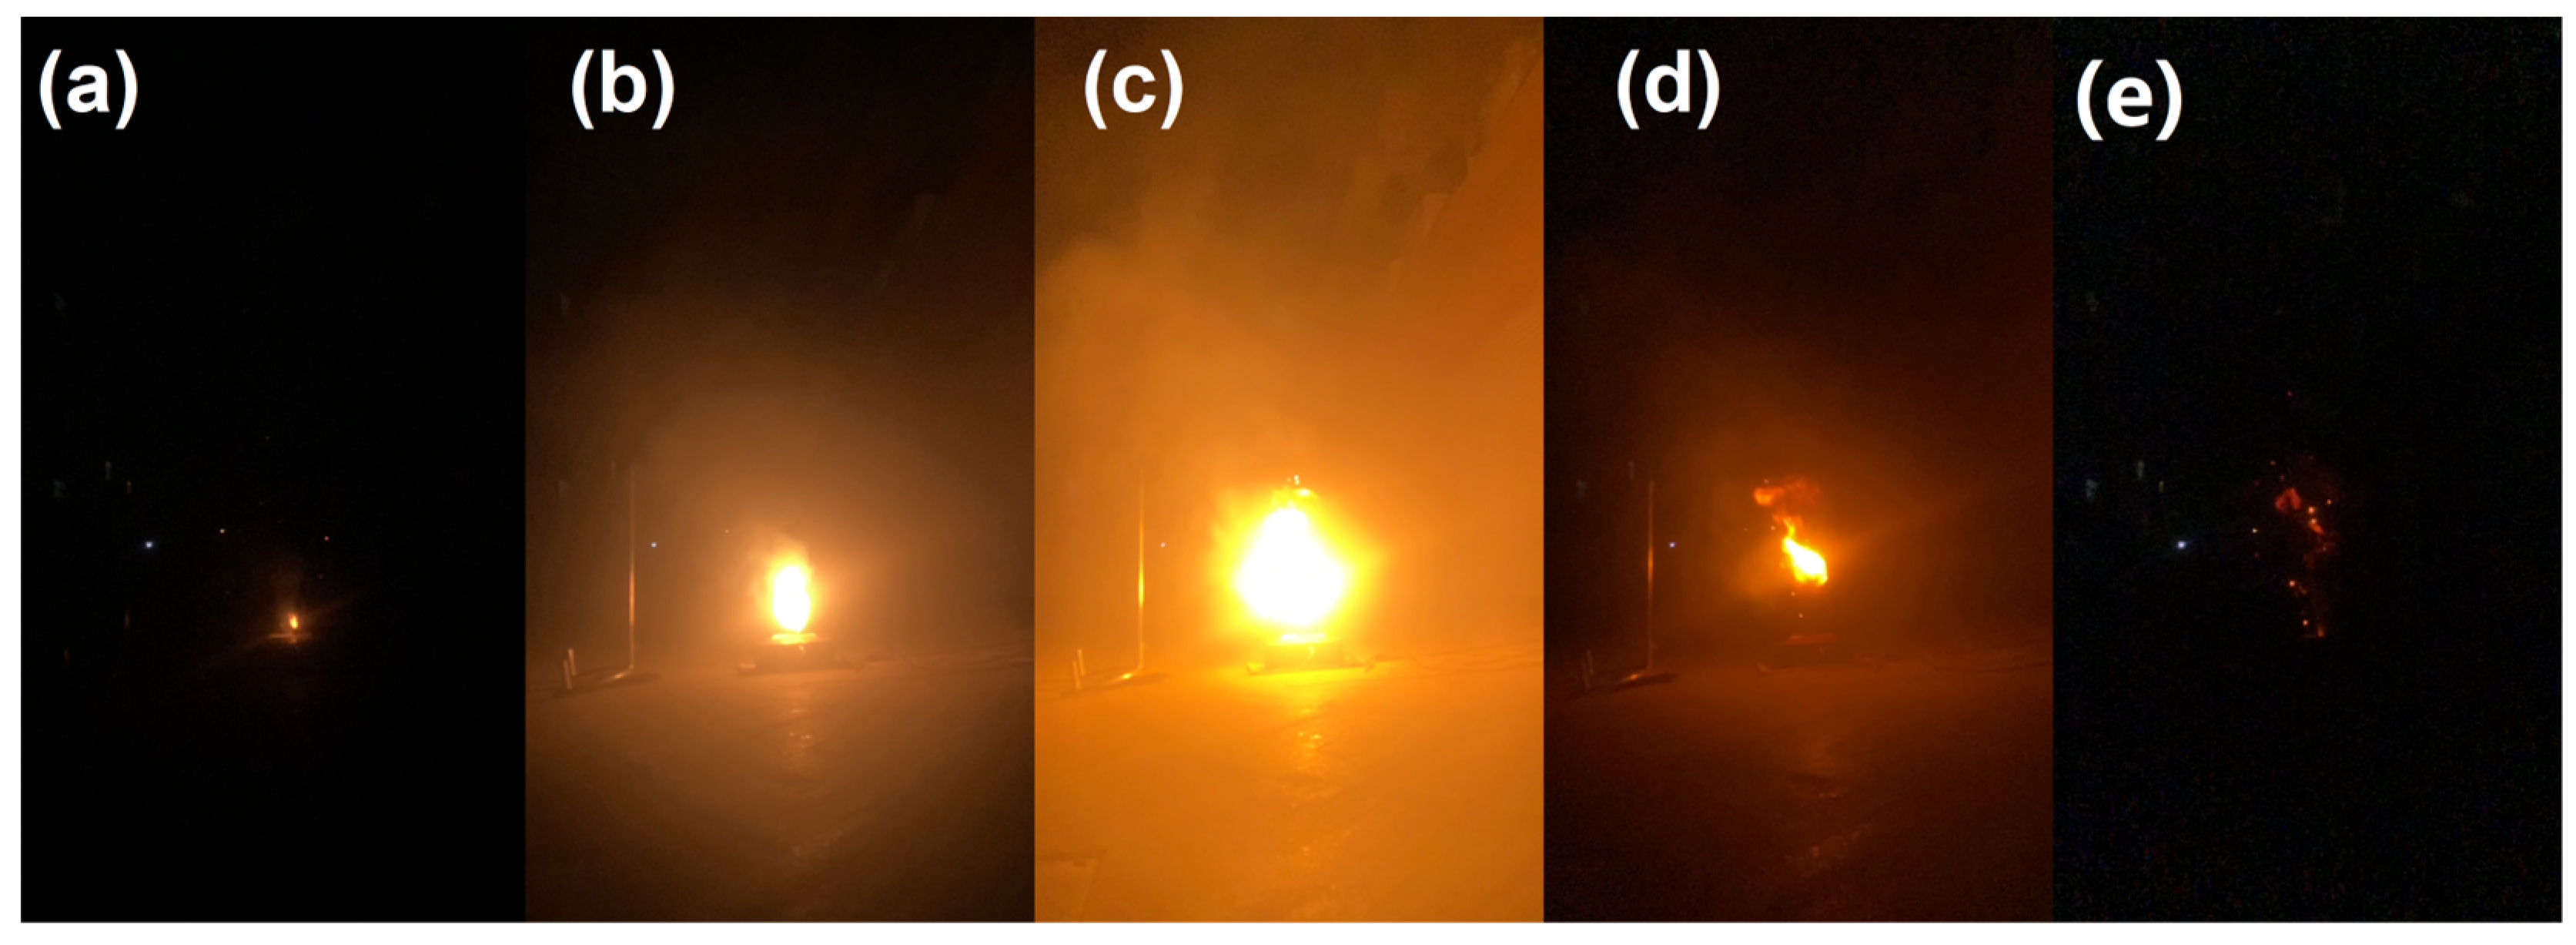
  • At the −12 s mark: Voltage begins to decline, coinciding with the first appearance of sparks resembling those depicted in Figure 4a;
  • At the −5 s mark: Mass (m) reaches its maximum value of 11.44 kg; within the −13 s to −5 s timeframe, T E exhibits the highest rate of temperature rise, reaching 93 °C/s;
  • At the 0 s mark: Voltage reaches zero;
  • At the 1.5 s mark: Intense eruption sparks are observed, as depicted in Figure 4a;
  • At the 7 s mark: T E attains its maximum value of 941.2 °C, as depicted in Figure 3b;
  • At the 11 s mark: Mass (m) reaches its minimum value of 10.55 kg;
  • At the 100 s mark: T S reaches its maximum value of 810 °C;
  • Subsequently, the temperatures T E , T S , and T H gradually decrease, marking the cessation of thermal runaway.
The mechanistic analysis of factors contributing to battery thermal runaway expansion involves several pivotal aspects, encompassing internal chemical reactions, heat release, and material characteristics. Below is an examination of these aspects:
1.
Internal Chemical Reactions
Thermal runaway typically stems from uncontrolled chemical reactions within the battery, generating numerous gases. During thermal runaway, internal chemical reactions in the battery yield a substantial volume of gases, including hydrogen, oxygen, and organic solvent vapors. The generation of these gases leads to a rapid increase in internal battery pressure, exacerbating the severity of thermal runaway.
During the thermal runaway (TR) process of batteries, the gas primarily undergoes reactions such as, notably, the decomposition of the solid electrolyte interphase (SEI) film; this reaction is expressed as follows [20]:
(CH2OCO2Li)2 → LiCO3 + C2H4 + CO2 + 1/2O2
As the heat generated by the reactions increases, the temperature rises, leading to a reaction between the intercalated lithium and the organic solvent in the electrolyte. The reaction can be described as follows [20]:
2Li + C3H4O3(EC) → Li2CO3 + C2H4
2Li + C4H6O3(PC) → Li2CO3 + C3H6
2Li + C3H6O3(DMC) → Li2CO3 + C2H6
Concurrently, the electrolyte within the battery can also decompose at high temperatures, generating gas. The reaction can be represented as follows [20]:
C2H5OCOOC2H5 + PF5 → C2H5OCOOPF4 + HF + C2H4
C2H4 + HF → C2H5F
C2H5OCOOPF4 → PF3O + CO2 + C2H4 + HF
C2H5OCOOCPF4 → PF3O + CO2 + C2H5F
C2H5OCOOCPF4 + HF → PF4OH + CO2 + C2H5F
2.
Heat Release
Chemical reactions within the battery generate a significant amount of heat, accelerating the rise in battery temperature. Upon exceeding a certain threshold, the elevated battery temperature triggers self-sustaining combustion reactions, further releasing additional heat, thus establishing a vicious cycle.
3.
Material Expansion
During thermal runaway, materials within the battery assembly may undergo expansion, particularly due to the heating and evaporation of the electrolyte, further increasing the internal pressure. This expansion may arise from factors, such as the material’s coefficient of thermal expansion, phase transitions, or chemical reactions.
4.
Structural Damage
During thermal runaway, the expansion of materials and increased pressure within the battery may lead to structural damage to components, such as membrane rupture or electrode separation. These structural impairments further exacerbate the severity of thermal runaway.
In summary, the mechanism underlying the expansion factors during battery thermal runaway is a complex and diverse process, encompassing various disciplines, such as chemical reactions, thermodynamics, and materials science.

3.2. Characteristics of Eruption Flames

The total duration of eruption spanned 18 ± 3 s. Figure 5 depicts a comprehensive explosion process. Two distinct eruption modes are illustrated in Figure 4: (a) in the first mode, incomplete combustion results in gradual upward movement and the sustained combustion of solid particles; (b) in the second mode, a combustible gas explosion occurs. In the first mode, due to incomplete combustion, the generated solid particles can jet to heights of up to 3.4 m. The most intense occurrence of the first mode transpires at the 1.5-s mark, with a momentary eruption velocity of 90 m/s upon the opening of the safety valve, as depicted in Figure 4a. The most intense event in the second mode transpires at the 1.4-s mark, with a maximum flame propagation velocity of 17.24 m/s. The specific calculation method is illustrated in Figure 6. Upon observing each explosion event, it becomes apparent that the explosion is initiated by the spark depicted in Figure 4a, with a rough estimation indicating the explosion center to be within a range of 0.1 to 0.4 m from the safety valve.
Figure 4. The morphology of eruption phenomena, (a) Jetting sparks, (b) Gas explosion.
Batteries 10 00182 g004
Figure 5 provides a detailed portrayal of the entire explosion sequence, delineating distinct stages as follows: (a) the inception phase characterized by faint sparks; (b) swift expansion coinciding with the onset of the explosion; (c) culmination of the explosion with maximum expansion; (d) subsequent gradual diminution in flame size accompanied by attenuation of the combustion process; (e) ultimate extinction of the flame, marking the termination of the event. This figure serves as an exemplary reference for calculating the duration of a single explosion cycle. With imagery captured at a rate of 240 frames per second, there exists a span of 66 frames between Figure 5a,e, resulting in an explosion cycle duration of 0.275 s. Similarly, employing the same method of calculation enables the determination of a time interval of 0.179 s between Figure 5a,c.
Based on the theoretical framework outlined in references [21,22], the coloration of the flames exhibits a close correlation with their temperatures, commonly enabling temperature inference through a visual assessment of flame chromaticity. Generally, the flame color is contingent upon both the substances undergoing combustion and the temperature of the combustion process. Two primary mechanisms contribute to flame coloration: The first mechanism, blackbody radiation emission, becomes particularly pronounced in the presence of solid particulates, as seen in scenarios of incomplete combustion generating soot. In the second mechanism, organic compounds containing carbon (C), such as methane (CH4), propane (C3H8), butane (C4H8), and acetylene (C2H2), undergo numerous free radical reactions during combustion, yielding species like CH or C2. The emission spectrum of these radicals predominantly falls within the blue and green spectral regions, resulting in an overall blue hue, particularly conspicuous in gaseous or plasma states, as observed during the thorough combustion of low-molecular-weight alkanes.
According to publicly available studies [2,8,17,23,24,25], the main components of combustible gases emitted during battery thermal runaway include hydrogen (H2), methane (CH4), propane (C3H8), butane (C4H8), and acetylene (C2H2), among other organic compounds containing carbon. Flames resulting from the combustion of hydrogen typically exhibit a pale-blue color. As per the second mechanism elucidated, flames produced during thermal runaway eruptions are expected to emit a spectral light predominantly in the blue and green regions, thus appearing blue overall. However, the flames observed during actual thermal runaway processes do not manifest a blue hue. This discrepancy arises because incompletely combusted solid particles gradually ascend and continue to burn. During this stage, the dominance of the first mechanism becomes apparent, wherein solid particles emit yellow light due to blackbody radiation, resulting in the upper portion of the flame appearing yellow [21,22].
The temperature range typically associated with yellow flames falls between 800 °C and 1000 °C. Yellow flames, characterized by relatively lower temperatures, primarily result from the incomplete combustion of carbon atoms during the burning process. Consequently, the photons emitted predominantly originate from impurity radiation, thus imparting a yellow hue to the flame. The typical temperature range of red flames is relatively low, generally below 500 °C. These low-temperature flames are typically generated by low-temperature solid fuels. In such cases, carbon atoms in the flame are incompletely oxidized, resulting in photons being primarily emitted by unburned impurities, thus exhibiting red coloration [21,22].
The color image in Figure 5c was converted into a grayscale representation, followed by the application of binarization techniques, resulting in the binary image depicted in Figure 6b. This process results in an image with only two colors, black and white, effectively simplifying the image [26]. This process delineated boundaries for the flame, albeit with some degree of error, thereby aiding in our comprehension of the extent of thermal runaway flames.
Based on the methodology in Section 2.3, we ascertained the area of the flame to be approximately 0.213 m2. Treating the flame area as equivalent to a circle, as illustrated in Figure 6, yields an estimated radius (r) of approximately 0.26 m. With a time interval of 0.179 s between Figure 5a,c, the velocity of flame propagation can be computed as 1.45 m/s.
Figure 7 provides visual documentation of the battery’s condition, both prior to and after the occurrence of thermal runaway. Figure 7b shows the partial liquefaction of the battery’s aluminum casing, revealing the interior jellyroll structure. Figure 7c depicts the post-thermal runaway scenario, illustrating the liquefied aluminum alongside the expelled materials, which include granules and fractured segments of the jellyroll. Lastly, Figure 7d captures the presence of ejected particles dispersed on the ground, approximately 1 m away from the safety valve nozzle of the battery. The mass loss rate was computed utilizing Equation (12) [27]. Table 2 presents a compilation of the principal experimental findings.
k = ( 1 m residual / m initial ) × 100 %
In this context, k represents the mass loss rate during the thermal runaway process; m initial represents the mass before thermal runaway (unit: g); m residual represents the mass after thermal runaway (unit: g).

4. Conclusions

This study experimentally investigated the characteristics of jetting flames and expansion forces during the thermal runaway of a 58 Ah commercial prismatic battery (with (Ni0.8Mn0.1Co0.1)O2 as its cathode), revealing their morphology and behavioral patterns. Taking the time when the voltage becomes zero as the reference point (t = 0), the main conclusions from three repetitions of experiments are summarized as follows:
  • From the onset of heating by the heating plate to −20 s, the rate of change in the expansion force remained below 0.3 N/s. At −110 s, a sudden decrease in the expansion force was observed, with a rate of change falling below −70 N/s. The maximum rate of change in the expansion force reached approximately 6100 N/s.
  • The point at which the expansion force reached its maximum value and sharply declined, corresponding to the occurrence of the first jetting of sparks (as depicted in behavior shown in Figure 4a), was at the time point −(11.5 ± 1.5) s, concurrent with a 0.01 V decrease in voltage.
  • The most intense jetting of sparks occurred at the time point of 1.4 ± 0.3 s, followed by the time period of 0.02 to 0.05 s, where the explosion flame reached its maximum radius, with an average rate of change exceeding 17 m/s. The distance of the explosion center from the safety valve height varied randomly in each explosion, yet it typically fell within a range of 0.1 to 0.5 m.
  • From the onset of the first occurrence of spark jetting to the cessation of the jetting behavior, the phenomena depicted in Figure 4a,b manifested in multiple alternating sequences. The ejected sparks, which represent the combustion of solid particulates, persisted throughout the entire ejection process. Hence, when calculating the flammability limits of battery ejecta, the presence of solid particulates cannot be disregarded. Observations from video footage indicate that explosive phenomena are initiated by the ignition of the ejected sparks, which ignite the combustible gases expelled during the jetting process.
This study presents a methodology for parameter identification in experimental trials. In the future, further refinement of this approach could lead to the development of more precise fire detection systems, thereby enhancing the safety and reliability of battery systems.

Author Contributions

Conceptualization, N.W.; methodology, N.W.; software, N.W.; validation, N.W.; formal analysis, N.W.; investigation, N.W.; resources, N.W.; data curation, Y.X.; writing—original draft preparation, N.W.; writing—review and editing, Y.X.; visualization, M.L.; supervision, Y.X.; project administration, Y.X.; funding acquisition, M.L. All authors have read and agreed to the published version of the manuscript.

Funding

This research received no external funding.

Data Availability Statement

The original contributions presented in the study are included in the article, further inquiries can be directed to the corresponding author.

Acknowledgments

We acknowledge the use of the GPT-3.5 language model developed by OpenAI for the translation of this paper from its original language to English.

Conflicts of Interest

Author Yu Xing was employed by the company DaLian CRRC Diesel Engine Co., Ltd. The remaining authors declare that the research was conducted in the absence of any commercial or financial relationships that could be construed as a potential conflict of interest.

Nomenclature

mMass, kg
T S Cell side surface center temperature, °C
T E Cell jet zone temperatures near the cell safety valve, °C
T H Heating plate temperature, °C
DMCDimethyl carbonate, C3H6O3
EMCMethyl ethyl carbonate, C4H8O3
EVElectric vehicle
SOCState of charge
LIBLithium-ion battery
BMSBattery management system
BTMSBattery thermal management system
EFExpansion force, N
CC–CVConstant current–constant voltage
SEISolid electrolyte interphase

Appendix A

Figure A1. (a) The results of the second repeated experiments, (b) the results of the third repeated experiments.
Batteries 10 00182 g0a1
Figure A2. Expansive force changing rate.
Batteries 10 00182 g0a2

References

  1. Feng, X.; Ouyang, M.; Liu, X.; Lu, L.; Xia, Y.; He, X. Thermal Runaway Mechanism of Lithium Ion Battery for Electric Vehicles: A Review. Energy Storage Mater. 2018, 10, 246–267. [Google Scholar] [CrossRef]
  2. Wang, H.; Liu, B.; Xu, C.; Jin, C.; Li, K.; Du, Z.; Wang, Q.; Ouyang, M.; Feng, X. Dynamic Thermophysical Modeling of Thermal Runaway Propagation and Parametric Sensitivity Analysis for Large Format Lithium-Ion Battery Modules. J. Power Sources 2022, 520, 230724. [Google Scholar] [CrossRef]
  3. Wei, N.; Li, M. Experimental Study of Thermal Runaway Process of 50 Ah Prismatic Nickel-Rich Battery. Energies 2023, 16, 5967. [Google Scholar] [CrossRef]
  4. Wang, Y.; Gao, Q.; Wang, G.; Lu, P.; Zhao, M.; Bao, W. A Review on Research Status and Key Technologies of Battery Thermal Management and Its Enhanced Safety. Int. J. Energy Res. 2018, 42, 4008–4033. [Google Scholar] [CrossRef]
  5. Ding, S.; Dong, C.; Zhao, T.; Koh, L.; Bai, X.; Luo, J. A Meta-Learning Based Multimodal Neural Network for Multistep Ahead Battery Thermal Runaway Forecasting. IEEE Trans. Ind. Inform. 2021, 17, 4503–4511. [Google Scholar] [CrossRef]
  6. Feng, X.; Lu, L.; Ouyang, M.; Li, J.; He, X. A 3D Thermal Runaway Propagation Model for a Large Format Lithium Ion Battery Module. Energy 2016, 115, 194–208. [Google Scholar] [CrossRef]
  7. Li, H.; Gao, Q.; Wang, Y. Experimental Investigation of the Thermal Runaway Propagation Characteristics and Thermal Failure Prediction Parameters of Six-Cell Lithium-Ion Battery Modules. Energies 2023, 16, 5172. [Google Scholar] [CrossRef]
  8. Wang, H.; Zhang, Y.; Li, W.; Gao, Z.; Zhang, B.; Ouyang, M. Experimental Study on the Cell-Jet Temperatures of Abused Prismatic Ni-Rich Automotive Batteries under Medium and High States of Charge. Appl. Therm. Eng. 2022, 202, 117859. [Google Scholar] [CrossRef]
  9. Shen, H.; Wang, H.; Li, M.; Li, C.; Zhang, Y.; Li, Y.; Yang, X.; Feng, X.; Ouyang, M. Thermal Runaway Characteristics and Gas Composition Analysis of Lithium-Ion Batteries with Different LFP and NCM Cathode Materials under Inert Atmosphere. Electronics 2023, 12, 1603. [Google Scholar] [CrossRef]
  10. Cai, T.; Stefanopoulou, A.G.; Siegel, J.B. Modeling Li-Ion Battery Temperature and Expansion Force during the Early Stages of Thermal Runaway Triggered by Internal Shorts. J. Electrochem. Soc. 2019, 166, A2431–A2443. [Google Scholar] [CrossRef]
  11. Wang, Y.; Wang, H.; Zhang, Y.; Cheng, L.; Wu, Y.; Feng, X.; Lu, L.; Ouyang, M. Thermal Oxidation Characteristics for Smoke Particles from an Abused Prismatic Li(Ni0.6Co0.2Mn0.2)O2 Battery. J. Energy Storage 2021, 39, 102639. [Google Scholar] [CrossRef]
  12. Xu, P.; Li, J.; Lei, N.; Zhou, F.; Sun, C. An Experimental Study on the Mechanical Characteristics of Li-ion Battery during Overcharge-induced Thermal Runaway. Int. J. Energy Res. 2021, 45, 19985–20000. [Google Scholar] [CrossRef]
  13. Self, J.; Aiken, C.P.; Petibon, R.; Dahn, J.R. Survey of Gas Expansion in Li-Ion NMC Pouch Cells. J. Electrochem. Soc. 2015, 162, A796–A802. [Google Scholar] [CrossRef]
  14. Golubkov, A.W.; Scheikl, S.; Planteu, R.; Voitic, G.; Wiltsche, H.; Stangl, C.; Fauler, G.; Thaler, A.; Hacker, V. Thermal Runaway of Commercial 18650 Li-Ion Batteries with LFP and NCA Cathodes—Impact of State of Charge and Overcharge. RSC Adv. 2015, 5, 57171–57186. [Google Scholar] [CrossRef]
  15. Ostanek, J.K.; Li, W.; Mukherjee, P.P.; Crompton, K.R.; Hacker, C. Simulating Onset and Evolution of Thermal Runaway in Li-Ion Cells Using a Coupled Thermal and Venting Model. Appl. Energy 2020, 268, 114972. [Google Scholar] [CrossRef]
  16. Feng, X.; He, X.; Ouyang, M.; Wang, L.; Lu, L.; Ren, D.; Santhanagopalan, S. A Coupled Electrochemical-Thermal Failure Model for Predicting the Thermal Runaway Behavior of Lithium-Ion Batteries. J. Electrochem. Soc. 2018, 165, A3748–A3765. [Google Scholar] [CrossRef]
  17. Yang, X.; Wang, H.; Li, M.; Li, Y.; Li, C.; Zhang, Y.; Chen, S.; Shen, H.; Qian, F.; Feng, X.; et al. Experimental Study on Thermal Runaway Behavior of Lithium-Ion Battery and Analysis of Combustible Limit of Gas Production. Batteries 2022, 8, 250. [Google Scholar] [CrossRef]
  18. Li, C.; Wang, H.; Shi, C.; Wang, Y.; Li, Y.; Ouyang, M. A Fitting Method to Characterize the Gaseous Venting Behavior of Lithium–Ion Batteries in a Sealed Chamber during Thermal Runaway. Energies 2023, 16, 7874. [Google Scholar] [CrossRef]
  19. Coman, P.T.; Mátéfi-Tempfli, S.; Veje, C.T.; White, R.E. Modeling Vaporization, Gas Generation and Venting in Li-Ion Battery Cells with a Dimethyl Carbonate Electrolyte. J. Electrochem. Soc. 2017, 164, A1858–A1865. [Google Scholar] [CrossRef]
  20. Wang, Z.; Yin, B.; Zhao, Q.; Wang, J.; An, W.; Zhai, H. External Heating-Induced Thermal Runaway and Gas Venting Characteristics of Polymer Lithium-Ion Cells with LiNixCoyMnzO2 Cathode. Process Saf. Environ. Prot. 2023, 174, 745–755. [Google Scholar] [CrossRef]
  21. Wang, Y.; Zheng, L.; Woolley, R.; Zhang, Y. Investigation of Ignition Process from Visible to Infrared by a High Speed Colour Camera. Fuel 2016, 185, 500–507. [Google Scholar] [CrossRef]
  22. Huang, H.W.; Zhang, Y. Digital Colour Image Processing Based Measurement of Premixed CH4+air and C2H4+air Flame Chemiluminescence. Fuel 2011, 90, 48–53. [Google Scholar] [CrossRef]
  23. Qian, F.; Wang, H.; Li, M.; Li, C.; Shen, H.; Wang, J.; Li, Y.; Ouyang, M. Thermal Runaway Vent Gases from High-Capacity Energy Storage LiFePO4 Lithium Iron. Energies 2023, 16, 3485. [Google Scholar] [CrossRef]
  24. Li, W.; Wang, H.; Zhang, Y.; Ouyang, M. Flammability Characteristics of the Battery Vent Gas: A Case of NCA and LFP Lithium-Ion Batteries during External Heating Abuse. J. Energy Storage 2019, 24, 100775. [Google Scholar] [CrossRef]
  25. Golubkov, A.W.; Planteu, R.; Krohn, P.; Rasch, B.; Brunnsteiner, B.; Thaler, A.; Hacker, V. Thermal Runaway of Large Automotive Li-Ion Batteries. RSC Adv. 2018, 8, 40172–40186. [Google Scholar] [CrossRef] [PubMed]
  26. Zhao, J.; Lv, Y.; Zhou, Z.; Cao, F. A Novel Deep Learning Algorithm for Incomplete Face Recognition: Low-Rank-Recovery Network. Neural Netw. 2017, 94, 115–124. [Google Scholar] [CrossRef]
  27. Wei, N.; Li, M. Experimental Study of Thermal Runaway Process of 256 Ah Prismatic Nickel-Rich Battery. Front. Energy Res. 2023, 11, 1230429. [Google Scholar] [CrossRef]
Figure 1. Illustration of equipment configuration. (a) schematic diagram of the experimental setup, (b) schematic diagram of the composite button and its wiring, (c) actual picture.
Batteries 10 00182 g001
Figure 2. Characteristics of thermal runaway ejection [18].
Batteries 10 00182 g002
Figure 3. Temperature and force evolution in time: (a) results of the first experiments; (b) magnified view of the first experiment.
Batteries 10 00182 g003
Figure 5. One full explosion time.
Batteries 10 00182 g005
Figure 6. Illustration for calculating flame area, (a) Schematic diagram for calculating the equivalent area circle of the flame (b) Binarized image of the gas explosion.
Batteries 10 00182 g006
Figure 7. Battery photos. (a) Before thermal runaway, (b) after thermal runaway, (c) residual material, (d) solid granules.
Batteries 10 00182 g007
Table 1. Battery samples.
ItemsParameterRemarks
Cell mass (g)926 ± 15/
Width (mm) × Thickness (mm) × Height (mm)148.24 × 26.66 × 102.8/
Rated Capacity (Ah)58Standard Discharge *
581/3C Discharge
Rated Voltage (V)3.67Standard Discharge
3.731/3C Discharge
Rated Energy (Wh)212.86Standard Discharge
216.341/3C Discharge
Mass Energy Density (Wh/kg)2331/3C Discharge
Voltage Range (V)2.75~4.350 °C ≤ T ≤ 55 °C
2.20~4.35−30 °C ≤ T < 0 °C
Main components of electrolyteDMC, EMC/
Cathode active materialLi(Ni0.8Co0.1Mn0.1)O2/
Anode active materialGraphite/
Cathode current collectorAluminum foil/
Anode current collectorCopper foil/
Shell materialAluminum alloy/
* Standard Discharging: At room temperature, discharged to 2.75 V at a constant current of 1C.
Table 2. Compilation of results from three thermal runaway experiments.
ParametersValue
EF max (N)1900~2000
Temporal range of explosion (s)0.054~0.179
Maximum ejection velocity (m/s)≥90
The mass loss rate (%)32.4 ± 2
The maximum flame propagation velocity (m/s)>17
The maximum flame area (m2)0.79
The distance from the explosion center to the safety valve (m)0.1~0.5
Disclaimer/Publisher’s Note: The statements, opinions and data contained in all publications are solely those of the individual author(s) and contributor(s) and not of MDPI and/or the editor(s). MDPI and/or the editor(s) disclaim responsibility for any injury to people or property resulting from any ideas, methods, instructions or products referred to in the content.

