Abstract
Vanadium redox flow batteries are promising energy storage devices and are already ahead of lead–acid batteries in terms of installed capacity in energy systems due to their long service life and possibility of recycling. One of the crucial tasks today is the development of models for assessing battery performance and its residual resource based on the battery’s present state. A promising method for estimating battery capacity is based on analyzing present voltage and current values under various load conditions. This paper analyzes the discharge characteristics of a 10 kW all-vanadium redox flow battery at fixed load powers from 6 to 12 kW. A linear dependence of operating voltage and initial discharge voltage on load power is established. It is also determined that the slope of the discharge curve linear section does not increase linearly in absolute value, and the Box–Lucas model can be used to describe it. Models for predicting current VRFB capacity based on different curve fitting functions are proposed. These models can be used to roughly estimate battery capacity at different load powers.
1. Introduction
Flow batteries are actively developing as electrical energy storage media to be used in power systems with distributed generation [], as well as batteries in uninterruptible power supply (UPS) systems []. Nowadays, vanadium redox flow batteries (VRFB) are the most commercially mature technology [], despite the fact that other types of flow batteries are the subject of widespread interest [], for example, zinc–bromine flow batteries or organic flow batteries, which are already underway []. VRFB remain the most widespread because they have one distinct advantage, namely, the use of a vanadium electrolyte in both the cathode and anode circuits. The following reactions occur at the electrodes []:
at the positive: VO2+ + H2O ⇄ VO2+ + 2H+ + e−;
at the negative: V3+ + e− ⇄ V2+.
This simplifies the solution for one of the key problems with flow batteries that affects their efficiency and service life, namely electrolyte crossover through the membrane. Thus, if electrolyte crossover occurs from one circuit to another, the vanadium ions are simply recharged in accordance with the circuit properties [].
There are several areas of VRFB research. When developing new electrolytes, researchers are trying to increase the concentration of electrolyte by increasing vanadium concentration, for example by adding acids to the electrolyte []. A separate area is the development of new electrode materials []. There are studies focusing on changing the surface chemical composition or morphology; for example, nitrogen-doped graphite felt is proposed in [] and KOH-etched graphite felt is presented in [], while [] deals with the deposition of metal oxide nanoparticles on the electrode surface, such as bismuth []. Metal oxides improve catalytic processes of electron transfer from vanadium ions to felt electrodes.
The development of methods for battery monitoring and control to reduce losses during pump operation or to determine the current battery state is of particular interest []. It is important to know the current battery state in order to inform the operator about the remaining capacity and to perform rebalance on time.
VRFB maximum capacity is achieved if both electrolytes have the same capacity, i.e., both electrolytes have the same volume, concentration of vanadium species and average oxidation state of vanadium species []. In real operation, battery capacity differs from its theoretical one, which is associated with voltage drop through the battery’s internal resistance, electrolyte crossover through the membrane [] and energy consumption for pump operation []. It is not enough just to know the volume of electrolyte in the tanks in order to estimate the capacity; it is also important to determine the current valence of the vanadium ions [,]. The potentiometric titration method was proposed in [] to determine vanadium ion concentration, but this method is not suitable for determining ions during battery operation due to the complexity and duration of analysis. Therefore, the change in vanadium ion concentration in positive and negative electrolytes is estimated by measuring the change in half-cell potential using the Nernst equation or through electrolyte properties such as conductivity, viscosity and electrolyte density. However, this method also has disadvantages due to the fact that the ion ratio in the electrolyte changes when the electrolyte is unbalanced. Another, more unpleasant, process takes place in the battery, namely hydrogen formation at the negative electrode []. The current is spent on hydrogen evolution and V2+ ion concentration decreases relative to VO2+ ions. Thus, an imbalance appears, which does not allow for determination of the capacity using the Nernst equation when the volume of electrolyte changes.
A different approach is used in []. A model of the system is created based on its technical parameters and current load, which helps to predict the need for system maintenance. However, this approach does not take into account system degradation over time. A VRFB capacity and state-of-charge (SOC) estimation method based on the amount of cathode electrolyte and cumulative charge is proposed in []. This method considers electrolyte rebalancing, but it was verified only for a single 10 W VRFB cell, which does not allow the problem of parasitic loss of power and energy due to shunt current to be taken into account.
Another, more attractive, method seems to be the use of algorithms that can determine the battery’s present state based on charge and discharge characteristics. Thus, a model was proposed in [] to estimate the VRFB SOC and equivalent circuit model parameters in real time using a multi-timescale assessment. The 100 cm2 single VRFB cell tests confirmed the proposed model performance at different battery aging states and electrolyte flow rates. A Matlab Simulink model of a megawatt-sized VRFB, based on the measurements of a 10 kW CellCube FB 10/100, was developed in []. It used real data obtained from hourly charging and discharging cycles for different SOC and power values from 2 to 10 kW. Some studies proposed more complex models; for example, an electrochemical model describing VFRB behavior was used in []. The results obtained were compared with experimental data from charge and discharge cycles at a constant current, the worst error being around 8.3%. Bhattacharjee et al. [] found that the internal parameters of the VRFB’s electrical equivalent circuit depend not only on flow rate and battery current, but also on SOC and the number of operating cycles. The dynamic equivalent circuit parameters of a 1 kW, 6 h VRFB were obtained from the real charge/discharge characteristics. As a result, it was shown that applying dynamic parameters can reduce the error in estimating actual battery voltage during discharge to 14% compared to using static parameters. All these attempts to simulate a real VRFB are aimed at adapting the model to experimental data in order to determine the current state of the system and, most importantly, the present battery capacity from the model.
The issue of estimating the residual battery capacity has been acute since VRFB appeared. This is due to imbalances in the battery during electrolyte crossover and partial oxidation of vanadium ions []. Different methods of battery capacity estimation are used, but the most promising may be that based on analysis of the present state of voltage and current under various load conditions []. The battery load constantly changes during energy storage system operation, making it difficult to determine the remaining battery life. In order to be able to determine the capacity, it is necessary to know how the battery behaves under different loads and whether this process can be described by any models and dependences. This paper presents analysis results of 10 kW VRFB performance at various load powers. The main contribution of the article is developing an approach to assess the VRFB state and residual resource based on the current performance, as Peukert’s law is used for lead batteries or supercapacitors []. This approach can also help to predict the present battery capacity and can be used in battery management systems (BMS).
The rest of the article is structured as follows. Section 2 presents a description of the test setup and the initial data for the experiments. The results of studying discharge characteristics and the functions obtained are given in Section 3. Section 4 proposes models for battery capacity estimation and simulation results. Section 5 presents the main conclusions.
2. Materials and Methods
The tests were carried out on a 10 kW VRFB with two 5 kW stacks manufactured by Technokomplekt LLC (Russia) []. The battery’s appearance is shown in Figure 1.
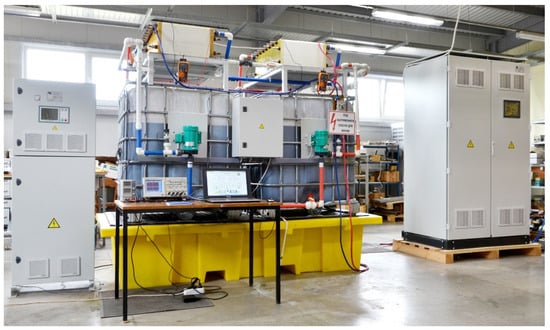
Figure 1.
The tested VRFB.
A vanadium sulfate electrolyte with vanadium content of 1.6 mol/L and sulfuric acid concentration of 3 mol/L was used. Phosphoric acid 0.4 wt% was also added to the electrolyte to stabilize vanadium ions [].
Spectrophotometric studies were carried out on a SF-2000 (OKB Spectr LLC, Saint Petersburg, Russia) spectrophotometer within a 190–1100 nm wavelength range with a step of 0.1 nm. The standard for testing was 3 M sulfuric acid solution. Aliquots of the original electrolyte were removed from the tanks with a glass pipette and diluted with 3 M sulfuric acid solution at a 1:20 ratio for electrolyte and sulfuric acid solution, respectively. The measurements were carried out using 10 × 10 mm cuvettes. The spectrophotometric data are presented in Figure 2.
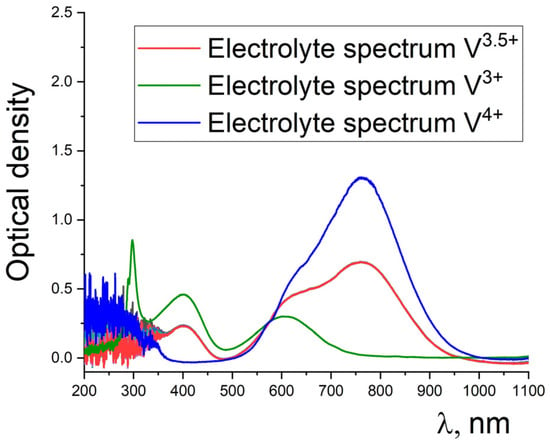
Figure 2.
Optical density spectra for vanadium electrolyte before charging. Reprinted with permission from Ref. [].
The starting electrolyte has a vanadium V3+ and VO2+ ion ratio very close to 50:50. The concentration of V3+ and VO2+ ions was determined by comparing the intensity of the line at 400 nm and 760 nm, respectively. Thus, it was established that the electrolyte has a composition of 0.8 mol/L V3+ and 0.8 mol/L VO2+, as demonstrated in []. The figure shows lines for V3+ and VO2+ ions, which were obtained from calibration solutions with a vanadium ion concentration of 1.6 mol/L.
Vanadium ion concentration was calculated relative to the lines of the calibration solutions:
where CV is the concentration of vanadium ions of a certain type (mol/L); I1 and I2 are signal intensity at the corresponding wavelength for calibration and original electrolytes, respectively.
The experimental conditions were the same for all tests. The electrolyte in the tanks was mixed each time before a new charge to return to a V3.5+ state in order to eliminate the impact of imbalance on the obtained results. The battery was charged using IU mode, first with a constant 100 A current up to 116 V, and then recharging at 116 V voltage until current of 5 A was reached. The discharge was carried out with a fixed power in the range of 6 to 12 kW up to a voltage of 65 V. Measurements were carried out using an uninterruptible power supply system developed by Technokomplekt LLC (Dubna, Russia) []. The voltage measurement error was 0.1 V, and the current measurement error was 0.05 A.
The system capacity was calculated using the equation:
where U(t) and I(t) are voltage and current instantaneous values, respectively; t is the discharge time.
The discharge time is determined from the moment the discharge begins (when the discharge current becomes more than 50 A) until the moment the discharge ends (when the voltage becomes less than 65 V). The approximate time to enter discharge mode is 2 s.
3. Results
Figure 3a shows the 10 kW VRFB discharge curves for various load powers. One can see that the discharge time decreases with increasing load power and the slope of the discharge curves increases as well. The slope rise is associated with a faster increase in internal resistance. A load increase leads to an increase in current, which results in the electrochemical system resistance going up because diffusion restrictions associated with ion transport to the electrode surface increase [].
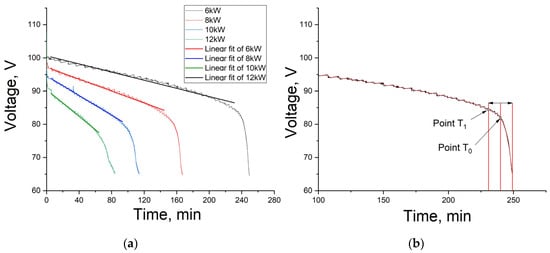
Figure 3.
VRFB discharge curves at load power of 6, 8, 10 and 12 kW and their linear trend line (a); determining the discharge curve inflection point (b).
Figure 3 shows that the discharge curves have linear sections. It can also be observed that the voltage drops sharply after a certain value (the inflection area on the curve); the greater the load power, the lower this value.
Linear approximation of the discharge curves was performed for subsequent processing of experimental data. The time of five minutes after the start of the discharge was chosen as the first point of the approximation area, because the electrode depolarization processes had already passed by this moment, and an excessive concentration of trivalent and pentavalent vanadium ions, the so-called Helmholtz layer, was present on their surface. The approximate end point was one marking the beginning of the inflection (point T1 in Figure 3b). It was determined as follows: first, the peak inflection point T0 was fixed; then, the time from this point to the end of the discharge was determined; next, the time was counted from peak point T0 to the left. This new point T1 was determined to be the one marking the beginning of the inflection. The curve was smoothed by 100 points to remove noise and only then was used to determine the points. In the case of BMS implementation, it is best to determine the inflection point using the time derivative of voltage, but this approach still requires defining the criteria by which this point should be determined. The method presented in this paper allows one to determine these criteria.
Slope coefficients of linear sections of the discharge curves are presented in Figure 4. These values are approximated using the Box–Lucas model [], because this model satisfies the condition of zeroing at zero discharge power (the discharge curve should ideally be a straight line parallel to the x-axis at zero load power). This function also shows a reduced chi-squared value of about 0.9. It is worth clarifying that in real batteries, voltage will still decrease at zero load power due to the self-discharge effect, which in VRFB is caused by two factors: shunt currents and crossover of vanadium ions through the membrane [,]. Therefore, this approach has limitations and this approximation will not be correct if the battery is idle for a long time. However, within the framework of this study where the battery operates in continuous mode, as well as taking into account the boundary conditions, this model seems to be acceptable.
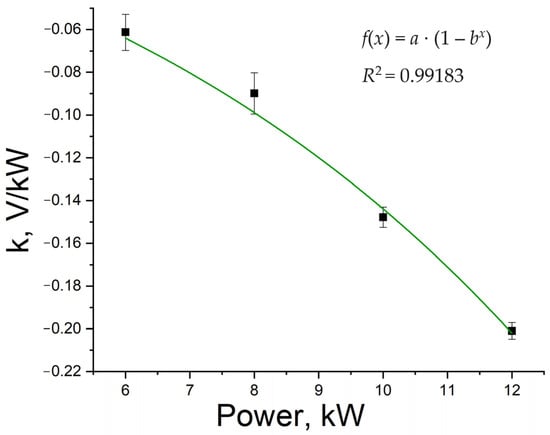
Figure 4.
Dependence of linear section slope coefficient of the discharge curve on the load power.
The Box–Lucas model also demonstrates a reversal of the slope coefficient to minus infinity at infinitely high power, which is also different from reality. A real battery has internal resistance and cannot be discharged with infinite power, only through a short circuit mode. In this case, the battery will provide greater, but not infinite, power.
The maximum battery power can be determined based on resistance value. The internal resistance is experimentally determined using the standard method []:
where U1 and U2 are the average voltage values at different times t1 and t2, respectively; I1 and I2 are the average current values at time t1 and t2, respectively.
This equation requires measuring voltage and current only at two different loads. In this paper, the internal resistance is determined at discharge current I1 = 60 A at 100 min. Voltage U1 = 100.8 V was defined as average voltage from 99 to 100 min and from 101 to 102 min. When discharge time reached 100 min, the discharge current increased sharply to I2 = 120 A for 1 min, while voltage U2 = 93.1 V was determined to be the average voltage value during this minute.
The battery’s internal resistance is equal to 0.13 ohm according to Equation (5). The battery power corresponding to this resistance is:
where Urated = 96 V is the battery’s rated voltage.
The calculated battery power is equal to 70.9 kW, and is significantly higher than the load values at which the discharge is carried out. Therefore, it can be assumed that the Box–Lucas model can be used, since 12 kW is significantly less than 70 kW. We believe that this model can be used to describe battery operation up to double overload.
As can be seen from Figure 4, the Box–Lucas model fits the experimental data well. The coefficients obtained from the model are a = 0.05529, b = 1.13672.
Figure 5 shows the curves of the maximum (starting) and average discharge voltages. Average voltage is defined as the voltage in the middle of the interval of linear approximation. The average voltage value is necessary for the model to predict battery discharge time at various load powers. It is enough to determine two voltage values and the curve slope coefficient to calculate the battery operating time. It should be noted that linear approximation does not take into account the initial 5 min and the final section, which vary for different load powers. These constitute the so-called diffuse restrictions area [,], where the transport of ions to the electrode surface is hindered due to the fact that their concentration in the electrolyte decreases. As noted in [], the decrease in voltage efficiency is linear in nature, both for charge and discharge. However, it is worth noting that charge and discharge in [] were carried out at a constant current, while in this study the discharge was carried out at constant power, so perhaps we observed a slight deviation from linearity, but nevertheless the dependence was close to linear. However, in our opinion, the logarithmic dependence could also be correct, since the voltage is determined by the Nernst equation [] taking into account the number of cells.
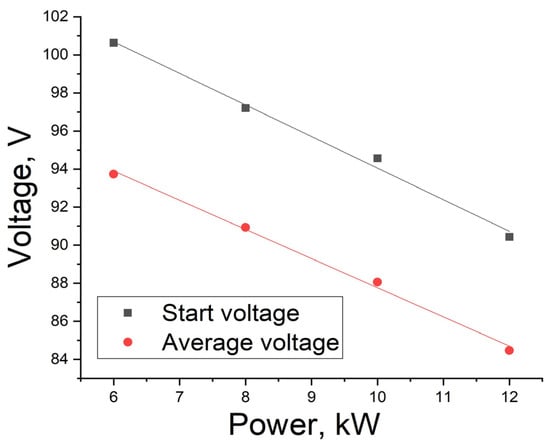
Figure 5.
Dependence of starting and average discharge voltage on power.
Therefore, the operating time is estimated based on the linear section, taking into account the fraction of energy after the discharge curve inflection. Figure 6a–c shows the dependence of energy share on load power, which is defined as the ratio of energy from the inflection point to the total discharge energy for various load powers.
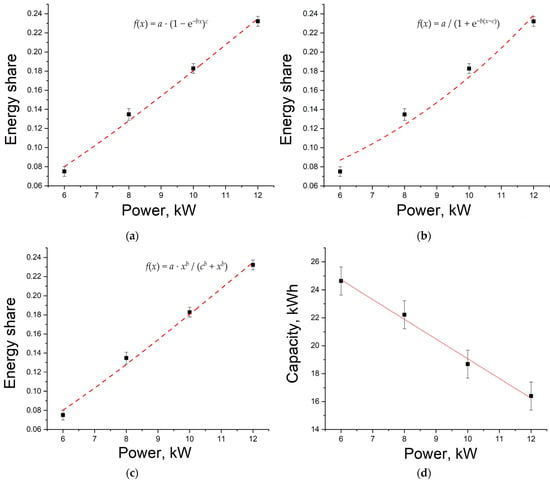
Figure 6.
Dependence of energy share after the discharge curve inflection on load power during approximation: Chapman (a); SLogistic1 (b); Hill (c); dependence of battery capacity during discharge on load power (d).
It is difficult to estimate the correct curve fitting function that describes the dependence of energy share after the discharge curve inflection on load power based on Figure 6a–c. Another problem is subjectivity when trying to determine the inflection point. Linear approximation does not satisfy the condition of zeroing at zero discharge power, because in an ideal system, when the power tends to zero, energy after the discharge curve inflection should tend to zero. As the power tends to infinity, contrarily, the energy share after inflection will tend to 100%. Thus, the function that describes this dependence must have the conditions of tending to zero and 100% when the load power tends to zero and infinity, respectively. It is impossible to consider all possible functions in one paper; therefore, it was decided to limit ourselves to three functions that satisfy the conditions defined above. Table 1 shows the selected curve fitting functions that can satisfy these conditions.

Table 1.
Curve fitting functions.
Figure 6a–c and coefficient of determination R2 in Table 1 show that the SLogistic1 function does not fit the experimental data very well. It is also worth noting that coefficient a was taken to be equal to 1 during approximation, because only in this case did the fitting functions satisfy the condition of equality to 1 at infinitely large power.
It is also worth noting that voltage decreases are directly related to the transport of ions to the electrode surface, while increases in discharge power boost discharge current density, which increases the local current density in the membrane region []. At the same time, decreases in capacity, and therefore decreases in voltage, should most likely obey an exponential law, as noted in []. Therefore, in our opinion, the dependence based on the Chapman function would be most correct.
The dependence of the battery discharge capacity on the load power is shown in Figure 6d. There is an almost linear dependence. However, this dependence must be nonlinear in order to describe the system under the proposed approach.
The obtained results can be used to develop a model to predict the battery capacity.
4. Discussion
It is worth noting that, nowadays, complex physical and mathematical models are used to simulate flow batteries. They comprehensively describe their operation and have good predictability, but require significant computing power []. This paper presents a simple approximation of discharge curves to roughly predict system parameters.
Based on data for slope coefficient (Figure 4) and voltage (Figure 5) dependence on the load power, a model for estimating battery capacity (kWh) by discharge characteristic linear section depending on load power is proposed:
where Pi is the load power present value (kW); Us and Ua are the starting and average voltage values (V); k is the discharge curve coefficient (determined in accordance with the selected fitting function) (V/h); η is the energy share after the discharge curve inflection (determined in accordance with the selected fitting function). The criterion for determining the voltage inflection point is the voltage at a time that is twice the time corresponding to the average voltage. In this case, the cut-off point is considered to be 65 V.
Figure 7 shows simulation curves of output battery capacity depending on the discharge power obtained from Equation (7). The presented curves differ in curve fitting functions for energy after inflection on the load power.
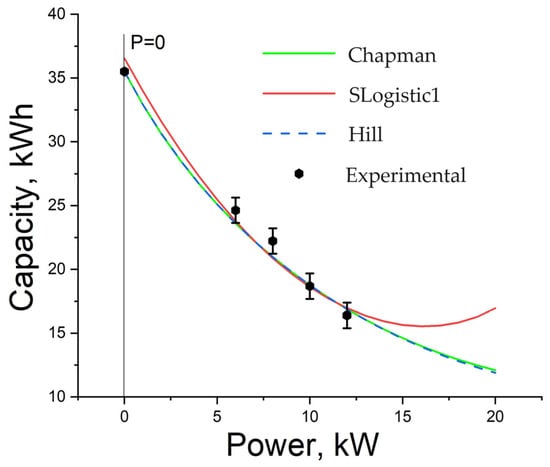
Figure 7.
Dependence of battery capacity on load power: simulation results.
It can be seen that the SLogistic1 function describes capacity dependence on power worse than the others; moreover, it does not adequately describe the dependence because the capacity increases after the power reaches 16 kW, which is impossible in a real battery. Therefore, the SLogistic1 function is not suitable for this task. The Chapman and Hill functions, by contrast, are the most suitable ones for this task and show very similar results that coincide with experimental data. They can also be used to build a predictive model.
The prediction capabilities were tested according to the electrolyte theoretical capacity (kWh) value, which was calculated by the electrolyte parameters:
where U0 = 1.25 V is the standard electrode potential []; e and NA are the electron charge (C) and the Avogadro number (mol−1), respectively; c = 1.6 mol/L is the vanadium ion concentration; V = 1325 L is the volume of electrolyte in tanks.
Theoretical capacity is equal to 35.5 kWh. The Chapman and Hill functions showed almost complete agreement with the independent theoretically predicted value, while SLogistic1 diverged in this prediction by 3%. Models based on the Chapman and Hill functions show values of 32.91 kWh and 32.92 kWh, respectively, at 0.1 kW power, and both models produce a value of 35.49 kWh at 0.01 kW power. The error is less than 0.01%.
The difference between the models based on the Chapman and Hill functions is that the Chapman-based model shows higher capacity values as the power increases. Therefore, it is necessary to conduct studies of VRFB discharge characteristics at high load powers to determine which model more accurately describes the results.
5. Conclusions
This paper presents research on the discharge curves of a 10 kW VRFB at different load powers. It is shown that the discharge curve’s linear section has a different slope at different load powers and the slope coefficient of these curves can be described using the Box–Lucas model with a reduced chi-squared value of about 0.9. In general, the obtained function agrees well with the theoretical capacity and is in good agreement with the actual battery capacity at a load power of 6 to 12 kW.
The model developed for predicting current VRFB capacity allows for the rough estimation of the battery energy capacity at different load powers. The models are based on three different curve fitting functions—Chapman, SLogistic1 and Hill. These fitting functions were used to represent energy share dependence after discharge curve inflection. The results show that the Chapman and Hill functions have high predictor capabilities with less than 0.01% error relative to the independent theoretically predicted value of battery capacity, while the SLogistic1 function does not give a correct prediction and diverges by more than 3%.
The developed models can be used to analyze and simulate industrial VRFB-based energy storage systems. The resulting algorithm can be realized. When the system is discharged, even at non-constant power, the algorithm determines, in accordance with the selected fitting function, the current constants to be the average between prior determined reference values. Then, based on the obtained constants, the present state of the battery is determined by subtracting the consumed energy from the full battery capacity. This determines the present state of the electrolyte. If the algorithm is wrong and the predicted capacity is higher than the real one, this difference is taken as a basis to assess how unbalanced the electrolyte is. In this way, it can help the operator make the right decision based on the battery’s present state.
Further research is to focus on testing this approach and the obtained models on a wider array of data on battery capacity dependence on load power, and on checking the model performance.
Author Contributions
Conceptualization, I.R., A.L. and A.K.; methodology, A.V., G.T. and E.O.; validation, A.V., G.T., I.K. and E.O.; formal analysis, A.L. and I.L.; investigation, I.R., A.V., G.T., I.K, A.K. and E.O.; resources, A.K.; data curation, I.K.; writing—original draft preparation, A.V., A.L., A.K. and E.O.; writing—review and editing, A.K., A.L. and I.L.; visualization, I.R.; supervision, A.K.; project administration, A.L. All authors have read and agreed to the published version of the manuscript.
Funding
This research was funded by Ministry of Science and Higher Education of the Russian Federation, state task for the provision of public services number FSWE-2022-0005.
Data Availability Statement
Data are contained within the article.
Conflicts of Interest
Authors Ilia Rashitov, Aleksandr Voropay, Grigoriy Tsepilov and Evgeny Osetrov were employed by the company Technocomplekt LLC. The remaining authors declare that the research was conducted in the absence of any commercial or financial relationships that could be construed as a potential conflict of interest. The funders had no role in the design of the study; in the collection, analyses, or interpretation of data; in the writing of the manuscript; or in the decision to publish the results.
References
- Price, A. The need for stationary energy storage. In Flow Batteries: From Fundamentals to Applications; Roth, C., Noack, J., Skyllas-Kazacos, M., Eds.; Wiley-VCH GmbH: Weinheim, Germany, 2023; Volume 2, pp. 1–27. [Google Scholar] [CrossRef]
- Olabi, A.G.; Allam, M.A.; Abdelkareem, M.A.; Deepa, T.D.; Alami, A.H.; Abbas, Q.; Alkhalidi, A.; Sayed, E.T. Redox flow batteries: Recent development in main components, emerging technologies, diagnostic techniques, large-scale applications, and challenges and barriers. Batteries 2023, 9, 409. [Google Scholar] [CrossRef]
- Iwakiri, I.; Antunes, T.; Almeida, H.; Sousa, J.P.; Figueira, R.B.; Mendes, A. Redox flow batteries: Materials, design and prospects. Energies 2021, 14, 5643. [Google Scholar] [CrossRef]
- Tolmachev, Y.V. Review—Flow batteries from 1879 to 2022 and beyond. J. Electrochem. Soc. 2023, 170, 030505. [Google Scholar] [CrossRef]
- Ramar, A.; Wang, F.-M.; Foeng, R.; Hsing, R. Organic redox flow battery: Are organic redox materials suited to aqueous solvents or organic solvents? J. Power Sources 2023, 558, 232611. [Google Scholar] [CrossRef]
- Stimming, U.; Wang, J.; Bund, A. The vanadium redox reactions—Electrocatalysis versus non-electrocatalysis. Chemphyschem 2019, 20, 3004–3009. [Google Scholar] [CrossRef] [PubMed]
- Sreenath, S.; Pawar, C.M.; Bavdane, P.; Nikumbe, D.Y.; Nagarale, R.K. A sulfonated polyethylene–styrene cation exchange membrane: A potential separator material in vanadium redox flow battery applications. Energy Adv. 2022, 1, 87–98. [Google Scholar] [CrossRef]
- Guo, Y.; Huang, J.; Feng, J.-K. Research progress in preparation of electrolyte for all-vanadium redox flow battery. J. Ind. Eng. Chem. 2023, 118, 33–43. [Google Scholar] [CrossRef]
- Komarov, V.A.; Voropay, A.N.; Il’ina, M.N.; Goryacheva, T.V. Research of nanostructured carbon felt materials as electrodes of vanadium flow batteries. Russ. J. Electrochem. 2021, 57, 892–897. [Google Scholar] [CrossRef]
- Lee, H.J.; Kil, D.; Kim, H. Synthesis of activated graphite felt using consecutive post-treatments for vanadium redox flow batteries. J. Electeochem. Soc. 2016, 163, A2586–A2591. [Google Scholar] [CrossRef]
- Zhang, Z.; Xi, J.; Zhou, H.; Qiu, X. KOH etched graphite felt with improved wettability and activity for vanadium flow batteries. Electrochim. Acta 2016, 218, 15–23. [Google Scholar] [CrossRef]
- Wei, L.; Zhao, T.S.; Zeng, L.; Zeng, Y.K.; Jiang, H.R. Highly catalytic and stabilized titanium nitride nanowire array-decorated graphite felt electrodes for all vanadium redox flow batteries. J. Power Sources 2017, 341, 318–326. [Google Scholar] [CrossRef]
- Lv, Y.; Zhang, J.; Lv, Z.; Wu, C.; Liu, Y.; Wang, H.; Lu, S.; Xiang, Y. Enhanced electrochemical activity of carbon felt for V /V redox reaction via combining KOH-etched pretreatment with uniform deposition of Bi nanoparticles. Electrochim. Acta 2017, 253, 78–84. [Google Scholar] [CrossRef]
- Xiao, W.; Tan, L. Control strategy optimization of electrolyte flow rate for all vanadium redox flow battery with consideration of pump. Renew. Energy 2019, 133, 1445–1454. [Google Scholar] [CrossRef]
- Beyer, K.; Austing, J.G.; Satola, B.; Di Nardo, T.; Zobel, M.; Agert, C. Electrolyte imbalance determination of a vanadium redox flow battery by potential-step analysis of the initial charging. ChemSusChem 2020, 13, 2066. [Google Scholar] [CrossRef] [PubMed]
- Puleston, T.; Serra, M.; Costa-Castello, R. Vanadium redox flow battery capacity loss mitigation strategy based on a comprehensive analysis of electrolyte imbalance effects. Appl. Energy 2024, 355, 122271. [Google Scholar] [CrossRef]
- Tang, A.; Bao, J.; Skyllas-Kazacos, M. Dynamic modelling of the effects of ion diffusion and side reactions on the capacity loss for vanadium redox flow battery. J. Power Sources 2011, 196, 10737–10747. [Google Scholar] [CrossRef]
- Kim, S.; Thomsen, E.; Xia, G.; Nie, Z.; Bao, J.; Recknagle, K.; Wang, W.; Viswanathan, V.; Luo, Q.; Wei, X.; et al. 1 kW/1 kWh advanced vanadium redox flow battery utilizing mixed acid electrolytes. J. Power Sources 2013, 237, 300–309. [Google Scholar] [CrossRef]
- Kapoor, M.; Gautam, R.K.; Ramani, V.K.; Verma, A. Predicting operational capacity of redox flow battery using a generalized empirical correlation derived from dimensional analysis. Chem. Eng. J. 2020, 379, 122300. [Google Scholar] [CrossRef]
- Wi, J.; Jon, S.; Pae, G.; Kim, Y.; Jon, S. Analysis of vanadium species(V(IV)/V(III) in the electrolyte manufacturing process for vanadium redox flow battery using digital image. J. Electroanal. Chem. 2023, 949, 117766. [Google Scholar] [CrossRef]
- Sun, C.-N.; Delnick, F.M.; Baggetto, L.; Veith, G.M.; Zawodzinski, T.A., Jr. Hydrogen evolution at the negative electrode of the all-vanadium redox flow batteries. J. Power Sources 2014, 248, 560–564. [Google Scholar] [CrossRef]
- Cremoncini, D.; Frate, G.F.; Bischi, A.; Ferrari, L. Mixed Integer Linear Program model for optimized scheduling of a vanadium redox flow battery with variable efficiencies, capacity fade, and electrolyte maintenance. J. Energy Storage 2023, 59, 106500. [Google Scholar] [CrossRef]
- Jung, H.; Lee, S. A study on capacity and state of charge estimation of VRFB systems using cumulated charge and electrolyte volume under rebalancing conditions. Energies 2023, 16, 2478. [Google Scholar] [CrossRef]
- Wei, Z.; Lim, T.M.; Skyllas-Kazacos, M.; Wai, N.; Tseng, K.J. Online state of charge and model parameter co-estimation based on a novel multi-timescale estimator for vanadium redox flow battery. Appl. Energy 2016, 172, 169–179. [Google Scholar] [CrossRef]
- Turker, B.; Klein, S.A.; Hammer, E.-M.; Lenz, B.; Komsiyska, L. Modeling a vanadium redox flow battery system for large scale applications. Energy Convers. Manag. 2013, 66, 26–32. [Google Scholar] [CrossRef]
- Blanc, C.; Rufer, A. Understanding the vanadium redox flow batteries. In Paths to Sustainable Energy; Nathwani, J., Ng, A., Eds.; InTech: London, UK, 2010; pp. 333–358. [Google Scholar] [CrossRef][Green Version]
- Bhattacharjee, A.; Roy, A.; Banerjee, N.; Patra, S.; Saha, H. Precision dynamic equivalent circuit model of a vanadium redox flow battery and determination of circuit parameters for its optimal performance in renewable energy applications. J. Power Sources 2018, 396, 506–518. [Google Scholar] [CrossRef]
- Jirabovornwisut, T.; Arpornwichanop, A. A review on the electrolyte imbalance in vanadium redox flow batteries. Int. J. Hydrog. Energy 2019, 44, 24485–24509. [Google Scholar] [CrossRef]
- Parsegov, S.; Pugach, M.; Polyakov, A.; Ibáñez, F. Analysis of flow factor control strategy in vanadium redox flow batteries. IFAC-PapersOnLine 2022, 55, 187–192. [Google Scholar] [CrossRef]
- Yang, H. Application of Peukert’s law in supercapacitor discharge time prediction. J. Energy Storage 2019, 22, 98–105. [Google Scholar] [CrossRef] [PubMed]
- Voropay, A.N.; Kuzmin, I.N.; Loskutov, A.B.; Osetrov, E.S. A flow battery based source for autonomous power supply systems. Electricity 2022, 9, 45–52. [Google Scholar] [CrossRef]
- Rashitov, I.; Voropay, A.; Tsepilov, G.; Kuzmin, I.; Loskutov, A.; Kurkin, A.; Osetrov, E.; Lipuzhin, I. Vanadium redox flow battery stack balancing to increase depth of discharge using forced flow attenuation. Batteries 2023, 9, 464. [Google Scholar] [CrossRef]
- Loktionov, P.; Pichugov, R.; Konev, D.; Petrov, M.; Pustovalova, A.; Antipov, A. Operando UV/Vis spectra deconvolution for comprehensive electrolytes analysis of vanadium redox flow battery. J. Electroanal. Chem. 2022, 925, 116912. [Google Scholar] [CrossRef]
- Kuzmin, I.; Loskutov, A.; Osetrov, E.; Kurkin, A. Source for autonomous power supply system based on flow battery. Energies 2022, 15, 3027. [Google Scholar] [CrossRef]
- Yang, W.W.; Yan, F.Y.; Qu, Z.G.; He, Y.L. Effect of various strategies of soc-dependent operating current on performance of a vanadium redox flow battery. Electrochim. Acta 2018, 259, 772–782. [Google Scholar] [CrossRef]
- Kumari, S.; Manglam, M.K.; Pradhan, L.K.; Kumar, L.; Borah, J.P.; Kar, M. Modification in crystal structure of copper ferrite fiber by annealing and its hyperthermia application. Appl. Phys. A 2021, 127, 273. [Google Scholar] [CrossRef]
- IEC 60896-11:2002; Stationary Lead-Acid Batteries—Part 11: Vented Types—General Requirements and Methods of Tests. IEC: Geneva, Switzerland, 2002.
- Wu, L.; Wang, J.; Shen, Y.; Liu, L.; Xi, J. Electrochemical evaluation methods of vanadium flow battery electrodes. Phys. Chem. Chem. Phys. 2017, 19, 14708–14717. [Google Scholar] [CrossRef] [PubMed]
- Pugach, M.; Vyshinsky, V.; Bischi, A. Energy efficiency analysis for a kilo-watt class vanadium redox flow battery system. Appl. Energy 2019, 253, 113533. [Google Scholar] [CrossRef]
- Li, Y.; Skyllas-Kazacos, M.; Bao, J. A dynamic plug flow reactor model for a vanadium redox flow battery cell. J. Power Sources 2016, 311, 57–67. [Google Scholar] [CrossRef]
- Gurevich, I.G.; Vol’fkovich, Y.M.; Bagotsky, V.S. Liquid Porous Electrodes; Nauka i Tekhnika: Minsk, Russia, 1974. (In Russian) [Google Scholar]
- Dai, P.; Zhang, S.; Liu, H.; Yan, L.; Gu, X.; Li, L.; Liu, D.; Zhao, X. Cotton fabrics-derived flexible nitrogen-doped activated carbon cloth for high-performance supercapacitors in organic electrolyte. Electrochim. Acta 2020, 354, 136717. [Google Scholar] [CrossRef]
- Xu, Q.; Zhao, T.S. Fundamental models for flow batteries. Prog. Energy Combust. Sci. 2015, 49, 40–58. [Google Scholar] [CrossRef]
Disclaimer/Publisher’s Note: The statements, opinions and data contained in all publications are solely those of the individual author(s) and contributor(s) and not of MDPI and/or the editor(s). MDPI and/or the editor(s) disclaim responsibility for any injury to people or property resulting from any ideas, methods, instructions or products referred to in the content. |
© 2024 by the authors. Licensee MDPI, Basel, Switzerland. This article is an open access article distributed under the terms and conditions of the Creative Commons Attribution (CC BY) license (https://creativecommons.org/licenses/by/4.0/).