
Modeling and Simulation of a Gas-Exhaust Design for Battery Thermal Runaway Propagation in a LiFePO4 Module


Abstract
1. Introduction
2. Battery Thermal Runaway Propagation Model
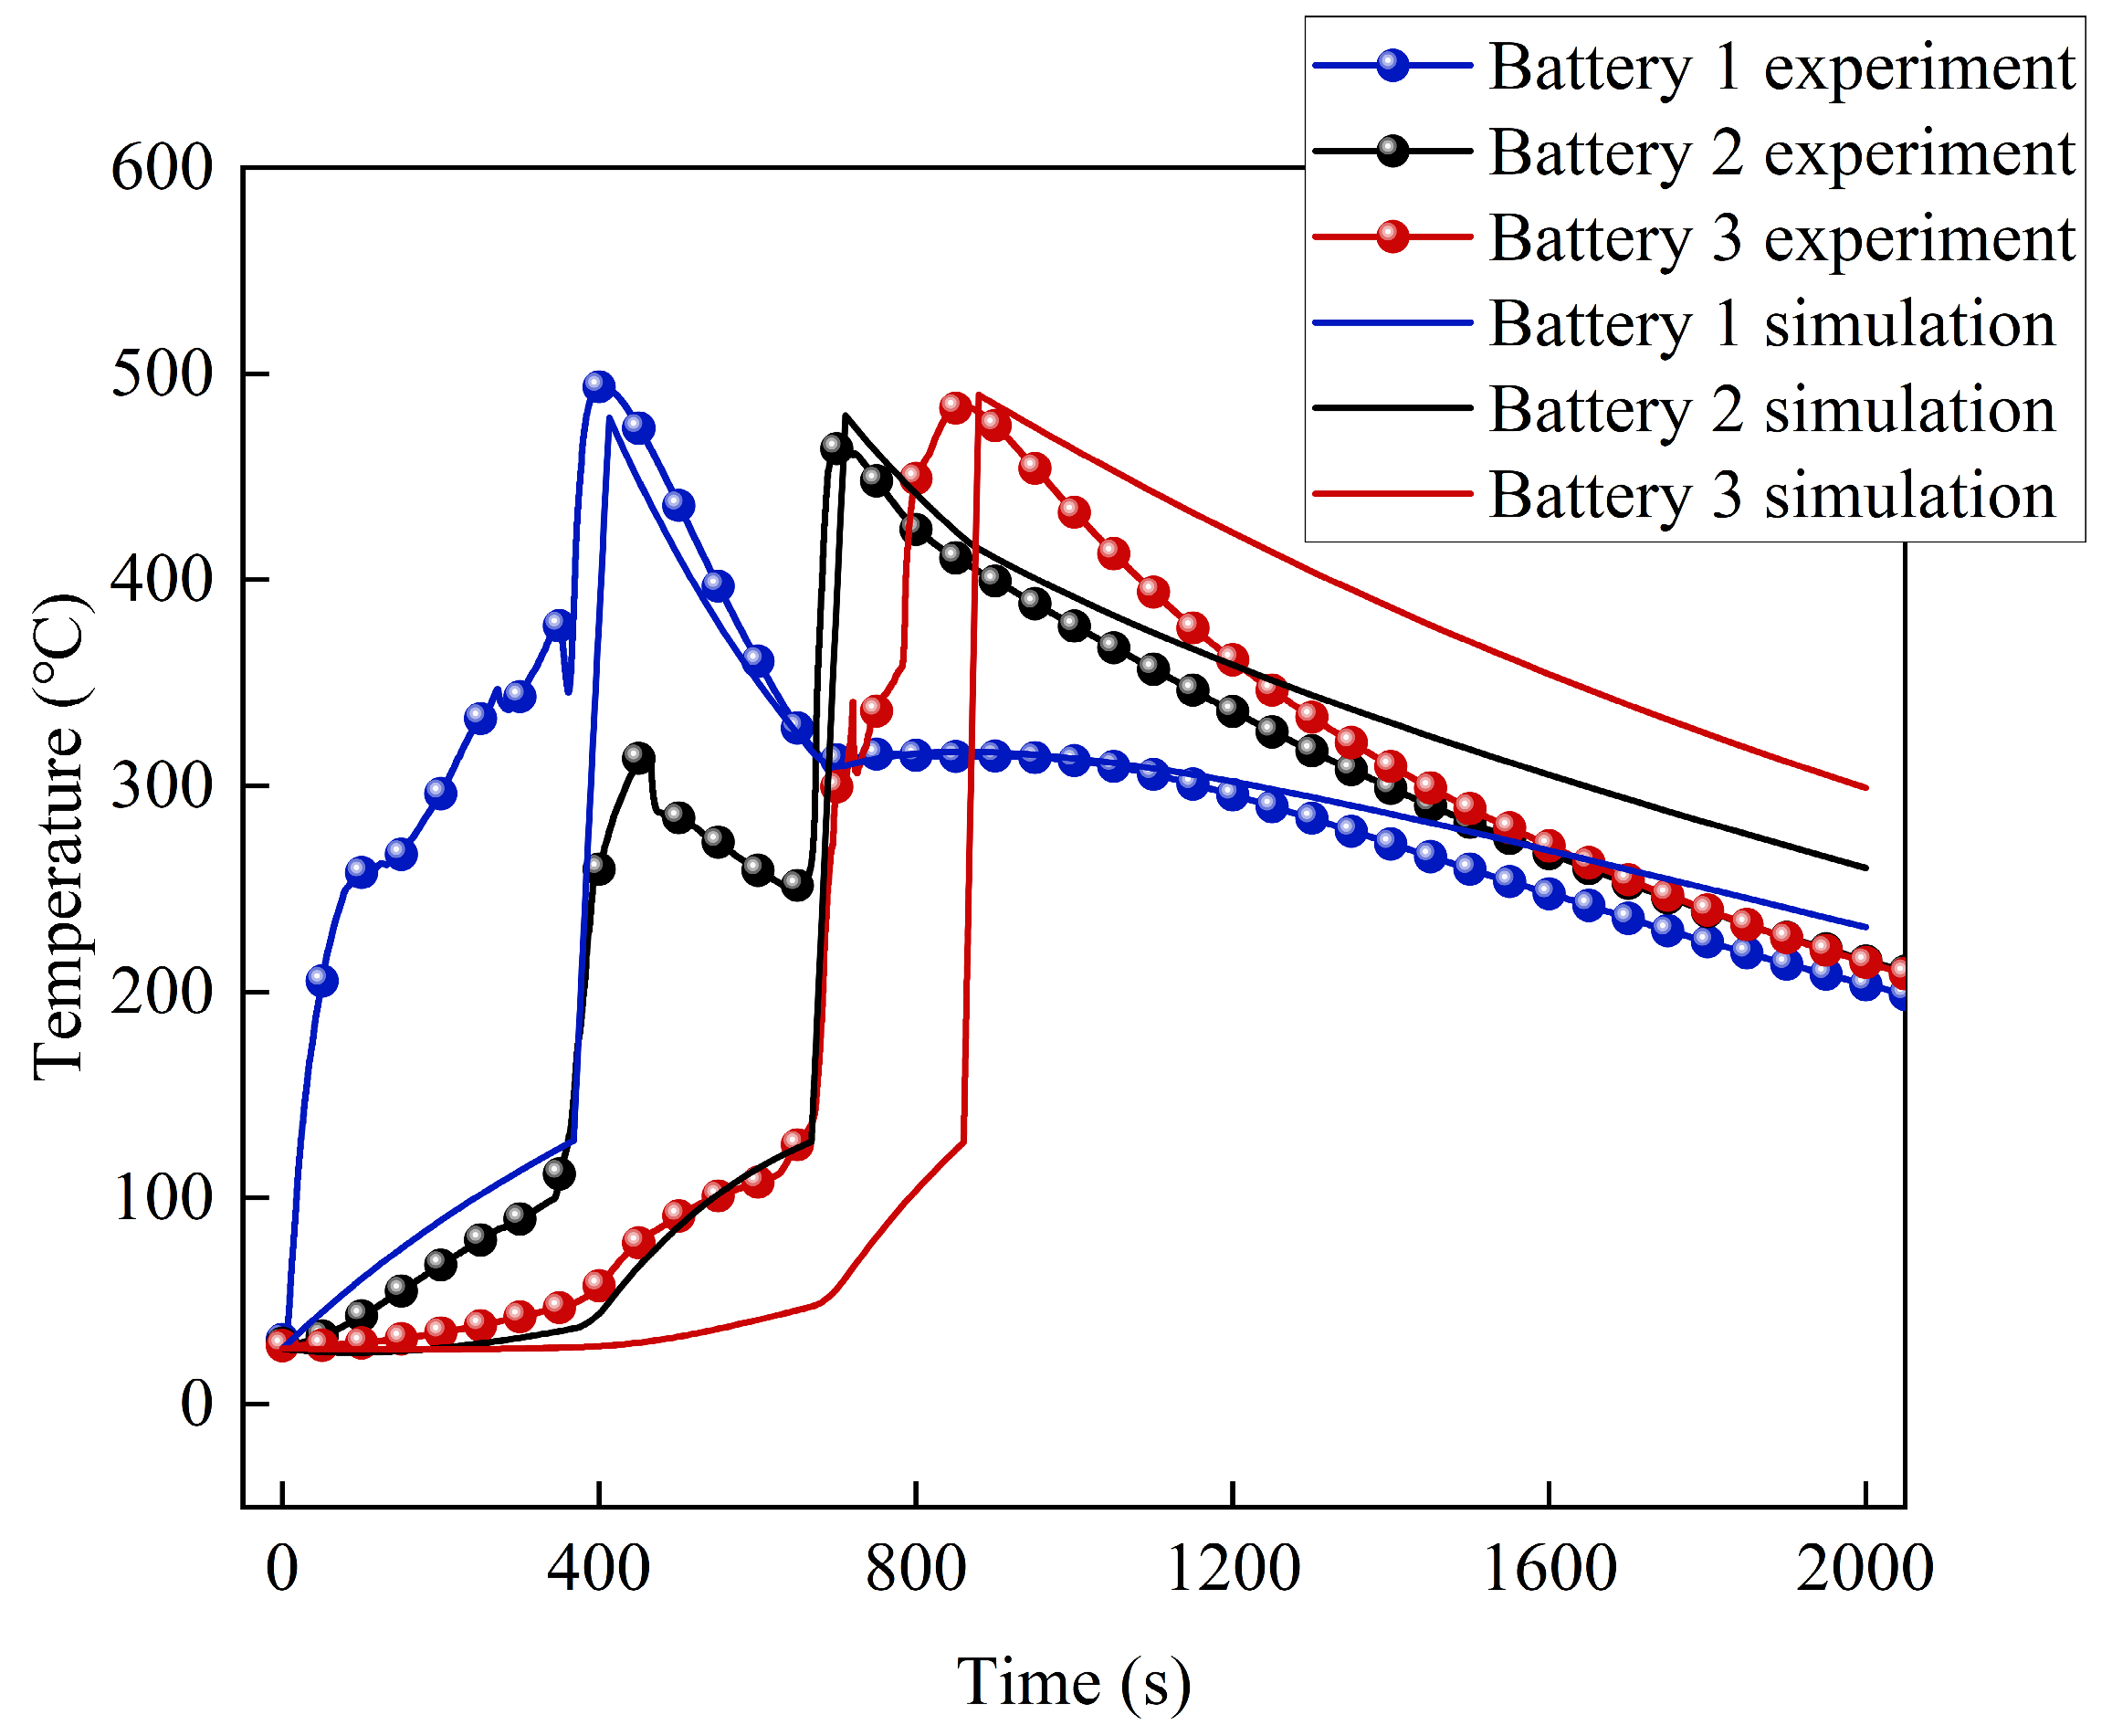
3. Thermal Runaway Experiment
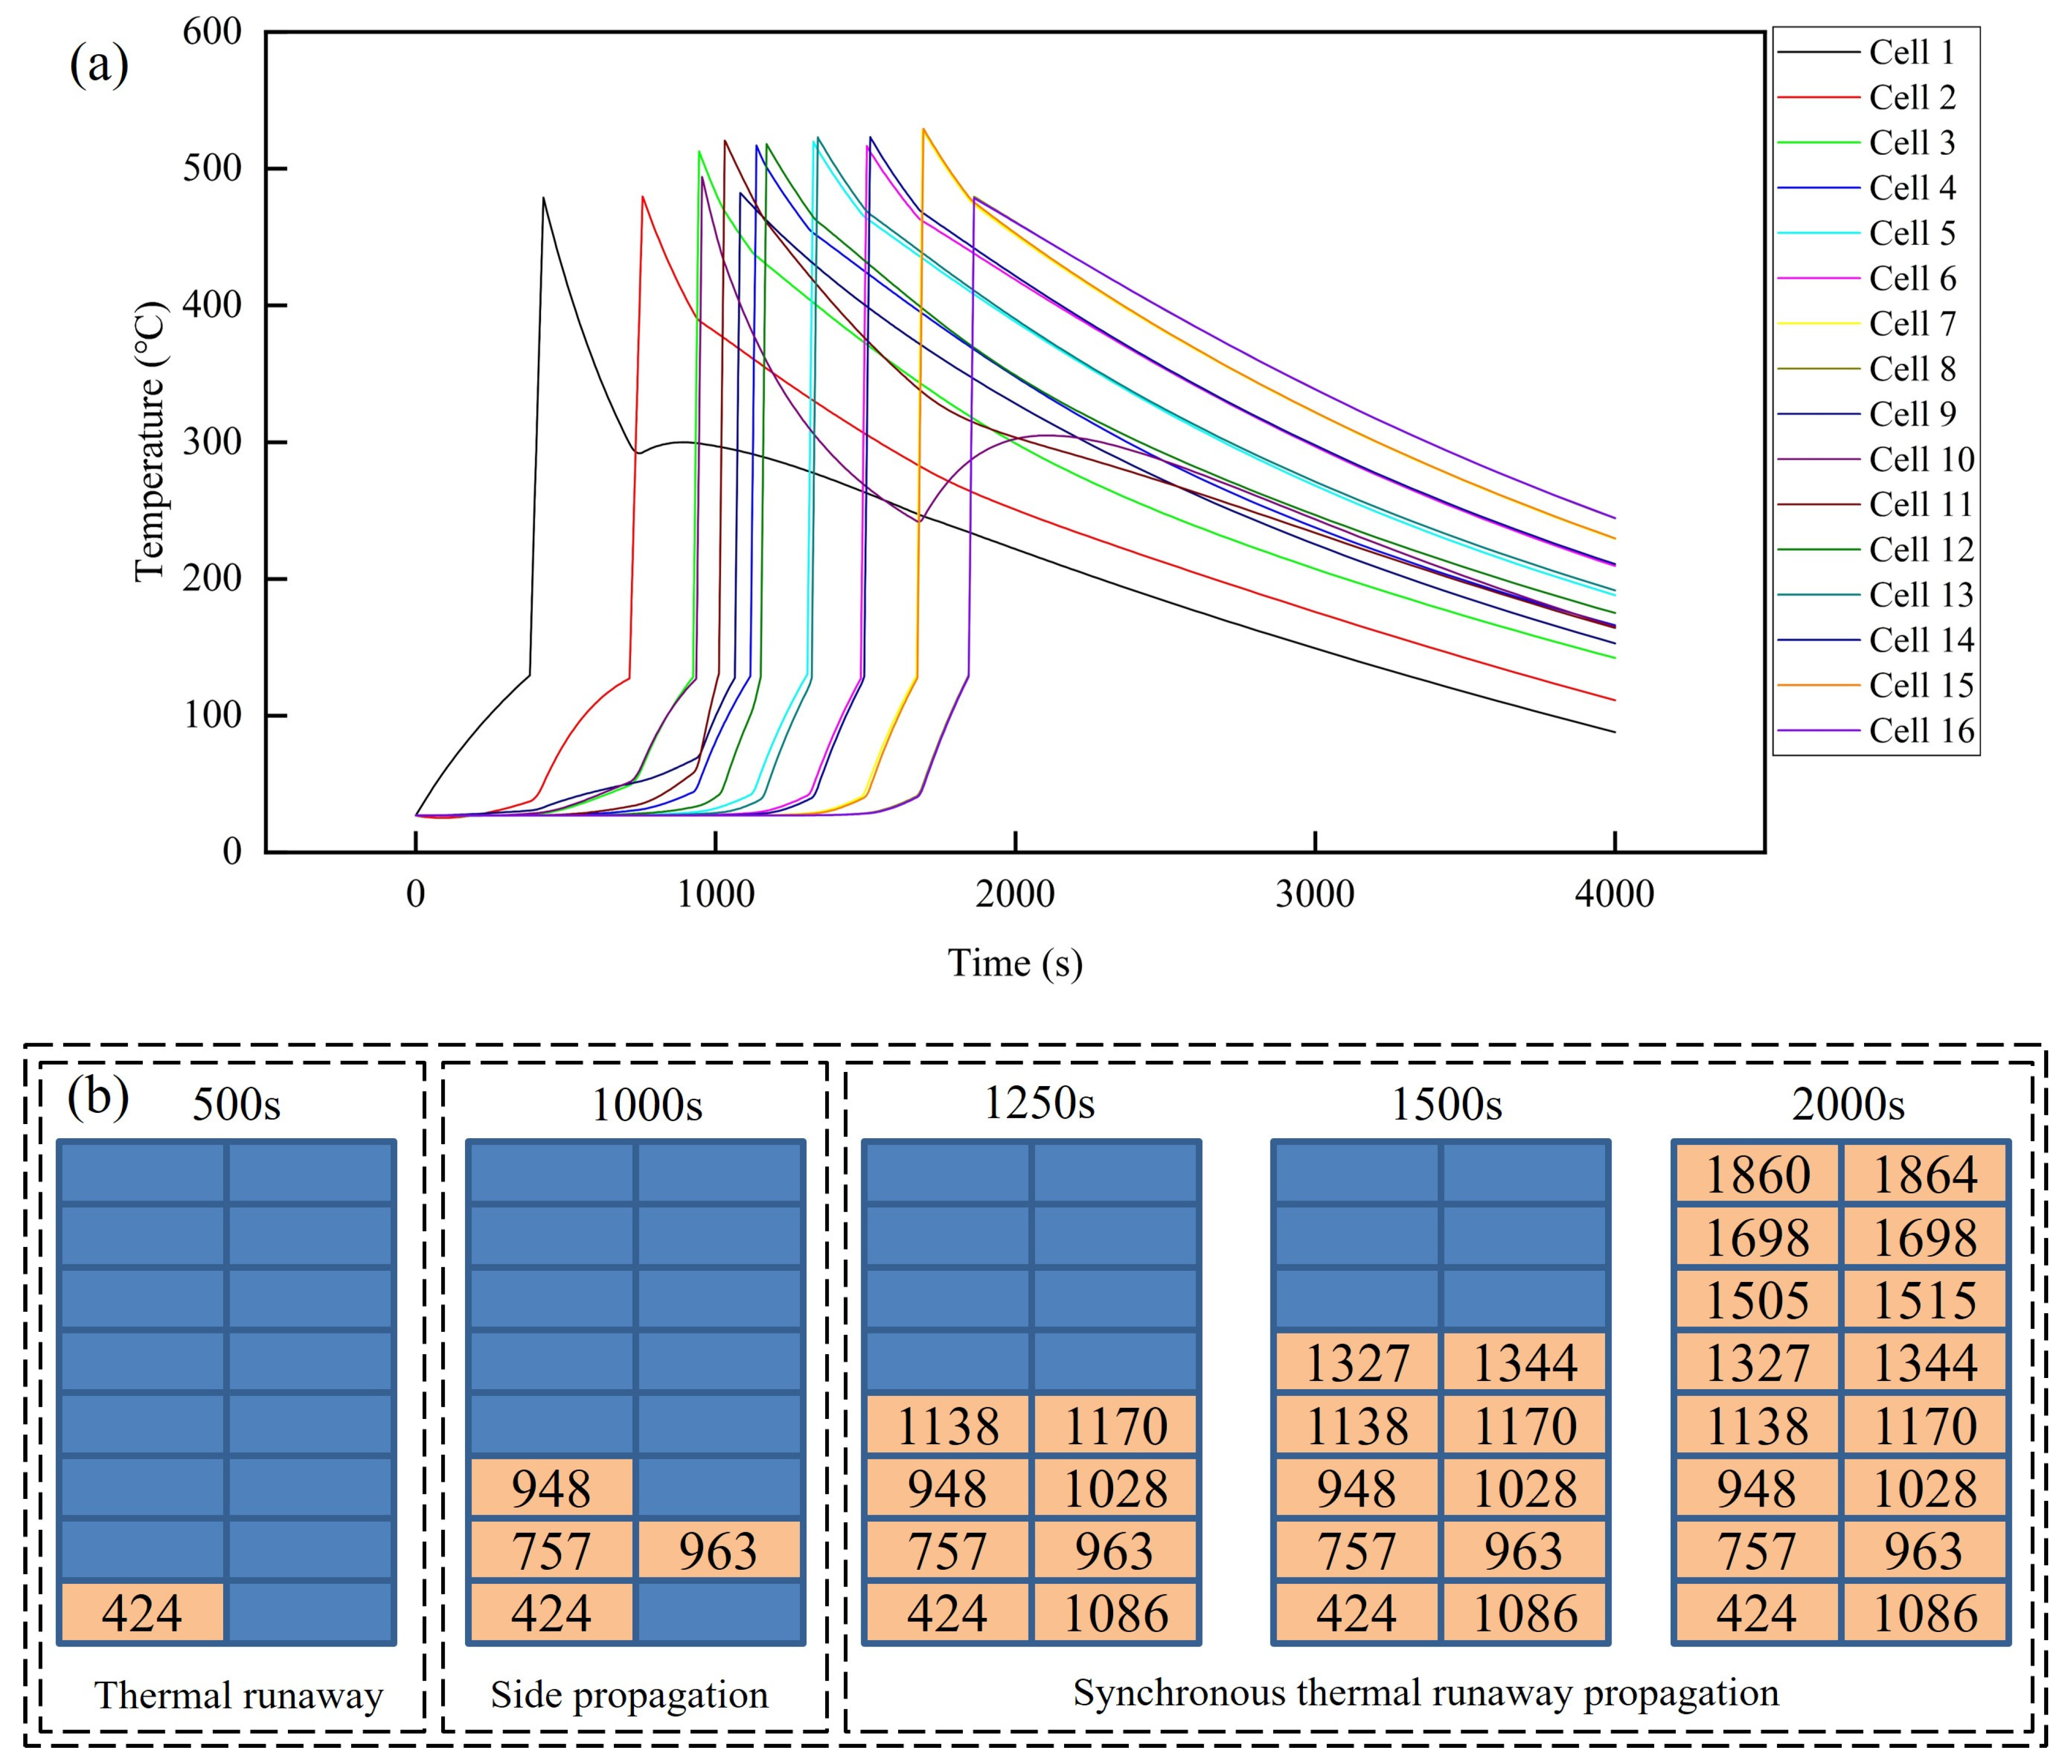
4. Results and Discussion
5. Conclusions
Author Contributions
Funding
Data Availability Statement
Conflicts of Interest
List of Symbols
| Density | |
| Heat capacity at constant pressure | |
| Temperature | |
| Heat source item | |
| Conduction heat transfer | |
| Convection heat transfer | |
| Radiative heat transfer | |
| Volume | |
| Energy fraction | |
| Thermal conductivity | |
| Area | |
| Convective heat transfer coefficient | |
| Surface emissivity | |
| Stefan-Boltzmann constant | |
| Turbulent dissipation rate source term | |
| General scalar source term | |
| Source term for the ith species | |
| Turbulent kinetic energy source term | |
| Mass source term | |
| time | |
| Velocity vector | |
| Mass fraction of the ith species | |
| Turbulence dissipation from fluctuating dilatation | |
| Turbulent dissipation rate | |
| Molecular viscosity | |
| Turbulent viscosity | |
| Dynamic viscosity | |
| Turbulent Prandtl number for turbulent kinetic energy | |
| Turbulent Prandtl number for turbulent dissipation rate | |
| Stress tensor | |
| Turbulent stress tensor |
References
- Xu, C.; Fan, Z.; Zhang, M.; Wang, P.; Wang, H.; Jin, C.; Peng, Y.; Jiang, F.; Feng, X.; Ouyang, M. A Comparative Study of the Venting Gas of Lithium-Ion Batteries during Thermal Runaway Triggered by Various Methods. Cell Rep. Phys. Sci. 2023, 4, 101705. [Google Scholar] [CrossRef]
- Li, J.; Wang, P.; Gao, Y.; Guan, D.; Li, S. Quantitative Power Flow Characterization of Energy Harvesting Shock Absorbers by Considering Motion Bifurcation. Energies 2022, 15, 6887. [Google Scholar] [CrossRef]
- Li, J.; Wang, P.; Guan, D.; Gao, Y. Damping Characterization of Electromagnetic Shock Absorbers by Considering Engagement and Disengagement. Iran. J. Sci. Technol.-Trans. Mech. Eng. 2022, 47, 1215–1264. [Google Scholar] [CrossRef]
- Huang, W.; Feng, X.; Han, X.; Zhang, W.; Jiang, F. Questions and Answers Relating to Lithium-Ion Battery Safety Issues. Cell Rep. Phys. Sci. 2021, 2, 100285. [Google Scholar] [CrossRef]
- Xu, J.; Mei, W.; Zhao, C.; Liu, Y.; Zhang, L.; Wang, Q. Study on Thermal Runaway Mechanism of 1000 MAh Lithium Ion Pouch Cell during Nail Penetration. J. Therm. Anal. Calorim. 2021, 144, 273–284. [Google Scholar] [CrossRef]
- Jin, C.; Sun, Y.; Wang, H.; Zheng, Y.; Wang, S.; Rui, X.; Xu, C.; Feng, X.; Wang, H.; Ouyang, M. Heating Power and Heating Energy Effect on the Thermal Runaway Propagation Characteristics of Lithium-Ion Battery Module: Experiments and Modeling. Appl. Energy 2022, 312, 118760. [Google Scholar] [CrossRef]
- Ren, D.; Feng, X.; Lu, L.; He, X.; Ouyang, M. Overcharge Behaviors and Failure Mechanism of Lithium-Ion Batteries under Different Test Conditions. Appl. Energy 2019, 250, 323–332. [Google Scholar] [CrossRef]
- Fernandes, Y.; Bry, A.; de Persis, S. Identification and Quantification of Gases Emitted during Abuse Tests by Overcharge of a Commercial Li-Ion Battery. J. Power Sources 2018, 389, 106–119. [Google Scholar] [CrossRef]
- Wang, Q.; Ping, P.; Zhao, X.; Chu, G.; Sun, J.; Chen, C. Thermal Runaway Caused Fire and Explosion of Lithium Ion Battery. J. Power Sources 2012, 208, 210–224. [Google Scholar] [CrossRef]
- Finegan, D.P.; Darcy, E.; Keyser, M.; Tjaden, B.; Heenan, T.M.M.; Jervis, R.; Bailey, J.J.; Vo, N.T.; Magdysyuk, O.V.; Drakopoulos, M.; et al. Identifying the Cause of Rupture of Li-Ion Batteries during Thermal Runaway. Adv. Sci. 2017, 5, 1700369. [Google Scholar] [CrossRef]
- Liu, P.; Li, Y.; Mao, B.; Chen, M.; Huang, Z.; Wang, Q. Experimental Study on Thermal Runaway and Fire Behaviors of Large Format Lithium Iron Phosphate Battery. Appl. Therm. Eng. 2021, 192, 116949. [Google Scholar] [CrossRef]
- Kim, J.; Mallarapu, A.; Finegan, D.P.; Santhanagopalan, S. Modeling Cell Venting and Gas-Phase Reactions in 18650 Lithium Ion Batteries during Thermal Runaway. J. Power Sources 2021, 489, 229496. [Google Scholar] [CrossRef]
- Zlochower, I.A.; Green, G.M. The Limiting Oxygen Concentration and Flammability Limits of Gases and Gas Mixtures. J. Loss Prev. Process. Ind. 2009, 22, 499–505. [Google Scholar] [CrossRef]
- Li, W.; Rao, S.; Xiao, Y.; Gao, Z.; Chen, Y.; Wang, H.; Ouyang, M. Fire Boundaries of Lithium-Ion Cell Eruption Gases Caused by Thermal Runaway. iScience 2021, 24, 102401. [Google Scholar] [CrossRef]
- Wang, H.; Wang, Q.; Zhao, Z.; Jin, C.; Xu, C.; Huang, W.; Yuan, Z.; Wang, S.; Li, Y.; Zhao, Y.; et al. Thermal Runaway Propagation Behavior of the Cell-to-Pack Battery System. J. Energy Chem. 2023, 84, 162–172. [Google Scholar] [CrossRef]
- Srinivasan, R.; Thomas, M.E.; Airola, M.B.; Carkhuff, B.G.; Frizzell-Makowski, L.J.; Alkandry, H.; Reuster, J.G.; Oguz, H.N.; Green, P.W.; La Favors, J.; et al. Preventing Cell-to-Cell Propagation of Thermal Runaway in Lithium-Ion Batteries. J. Electrochem. Soc. 2020, 167, 020559. [Google Scholar] [CrossRef]
- Jin, C.; Sun, Y.; Yao, J.; Feng, X.; Lai, X.; Shen, K.; Wang, H.; Rui, X.; Xu, C.; Zheng, Y.; et al. No Thermal Runaway Propagation Optimization Design of Battery Arrangement for Cell-to-Chassis Technology. eTransportation 2022, 14, 100199. [Google Scholar] [CrossRef]
- Jin, C.; Sun, Y.; Wang, H.; Lai, X.; Wang, S.; Chen, S.; Rui, X.; Zheng, Y.; Feng, X.; Wang, H.; et al. Model and Experiments to Investigate Thermal Runaway Characterization of Lithium-Ion Batteries Induced by External Heating Method. J Power Sources 2021, 504, 230065. [Google Scholar] [CrossRef]
- Huang, Z.; Yu, Y.; Duan, Q.; Qin, P.; Sun, J.; Wang, Q. Heating Position Effect on Internal Thermal Runaway Propagation in Large-Format Lithium Iron Phosphate Battery. Appl. Energy 2022, 325, 119778. [Google Scholar] [CrossRef]
- Jia, Z.; Song, L.; Mei, W.; Yu, Y.; Meng, X.; Jin, K.; Sun, J.; Wang, Q. The Preload Force Effect on the Thermal Runaway and Venting Behaviors of Large-Format Prismatic LiFePO4 Batteries. Appl. Energy 2022, 327, 120100. [Google Scholar] [CrossRef]
- Zhang, W.; Liang, Z.; Yin, X.; Ling, G. Avoiding Thermal Runaway Propagation of Lithium-Ion Battery Modules by Using Hybrid Phase Change Material and Liquid Cooling. Appl. Therm. Eng. 2021, 184, 116380. [Google Scholar] [CrossRef]
- Song, L.; Huang, Z.; Mei, W.; Jia, Z.; Yu, Y.; Wang, Q.; Jin, K. Thermal Runaway Propagation Behavior and Energy Flow Distribution Analysis of 280 Ah LiFePO4 Battery. Process Saf. Environ. Prot. 2023, 170, 1066–1078. [Google Scholar] [CrossRef]
- Meng, L.; See, K.W.; Wang, G.; Wang, Y.; Zhang, Y.; Zang, C.; Xie, B. Explosion-Proof Lithium-Ion Battery Pack—In-Depth Investigation and Experimental Study on the Design Criteria. Energy 2022, 249, 123715. [Google Scholar] [CrossRef]
- Wang, H.; Xu, H.; Zhang, Z.; Wang, Q.; Jin, C.; Wu, C.; Xu, C.; Hao, J.; Sun, L.; Du, Z.; et al. Fire and Explosion Characteristics of Vent Gas from Lithium-Ion Batteries after Thermal Runaway: A Comparative Study. eTransportation 2022, 13, 100190. [Google Scholar] [CrossRef]
- Wei, G.; Huang, R.; Zhang, G.; Jiang, B.; Zhu, J.; Guo, Y.; Han, G.; Wei, X.; Dai, H. A Comprehensive Insight into the Thermal Runaway Issues in the View of Lithium-Ion Battery Intrinsic Safety Performance and Venting Gas Explosion Hazards. Appl. Energy 2023, 349, 121651. [Google Scholar] [CrossRef]
- Huang, W.; Feng, X.; Pan, Y.; Jin, C.; Sun, J.; Yao, J.; Wang, H.; Xu, C.; Jiang, F.; Ouyang, M. Early Warning of Battery Failure Based on Venting Signal. J. Energy Storage 2023, 59, 106536. [Google Scholar] [CrossRef]
- He, C.X.; Yue, Q.L.; Chen, Q.; Zhao, T.S. Modeling Thermal Runaway of Lithium-Ion Batteries with a Venting Process. Appl. Energy 2022, 327, 120110. [Google Scholar] [CrossRef]
- Cai, T.; Valecha, P.; Tran, V.; Engle, B.; Stefanopoulou, A.; Siegel, J. Detection of Li-Ion Battery Failure and Venting with Carbon Dioxide Sensors. eTransportation 2021, 7, 100100. [Google Scholar] [CrossRef]
- Coman, P.T.; Mátéfi-Tempfli, S.; Veje, C.T.; White, R.E. Modeling Vaporization, Gas Generation and Venting in Li-Ion Battery Cells with a Dimethyl Carbonate Electrolyte. J. Electrochem. Soc. 2017, 164, A1858–A1865. [Google Scholar] [CrossRef]
- Kong, D.; Wang, G.; Ping, P.; Wen, J. A Coupled Conjugate Heat Transfer and CFD Model for the Thermal Runaway Evolution and Jet Fire of 18650 Lithium-Ion Battery under Thermal Abuse. eTransportation 2022, 12, 100157. [Google Scholar] [CrossRef]
- Feng, X.; Lu, L.; Ouyang, M.; Li, J.; He, X. A 3D Thermal Runaway Propagation Model for a Large Format Lithium Ion Battery Module. Energy 2016, 115, 194–208. [Google Scholar] [CrossRef]
- Zhang, F.; Wang, P.; Yi, M. Design Optimization of Forced Air-Cooled Lithium-Ion Battery Module Based on Multi-Vents. J. Energy Storage 2021, 40, 102781. [Google Scholar] [CrossRef]


| Cell and air | Conductive heat transfer | area = 0.00767 m2; thickness = 0.001 m; = 500 W m−1K−1 |
| Convective heat transfer | area = 0.007678 m2; h = 5 W m−2K−1 | |
| Radiative heat transfer | area = 0.007678 m2; = 0.04 W m−2K−4 | |
| Cell front face | Conductive heat transfer | area = 0.00923 m2; thickness = 5.8 mm; = 0.29 W m−1K−1 |
| Cell side face | Conductive heat transfer | area = 0.00143 m2; thickness = 5.8 mm; = 0.29 W m−1K−1 |
| Heater to cell | Conductive heat transfer | area = 0.00923 m2; thickness = 5.8 mm; = 0.29 W m−1K−1 |
| Density | 2132.86 kg m−3 | |
| Specific heat | 1089.35 J kg−1 K−1 | |
| Mass | 433.10 g | |
| Volume | 142 mm × 65 mm × 22 mm | |
| Emissivity | 0.58 | |
| Boltzmann constant | 5.67 × 10⁻⁸ W m−2 K−4 | |
| Self-generated heat temperature | 166.92 °C | |
| TR onset temperature | 274.00 °C | |
| TR maximum temperature | 607.00 °C | |
| TR total energy | 207,628.64 J |
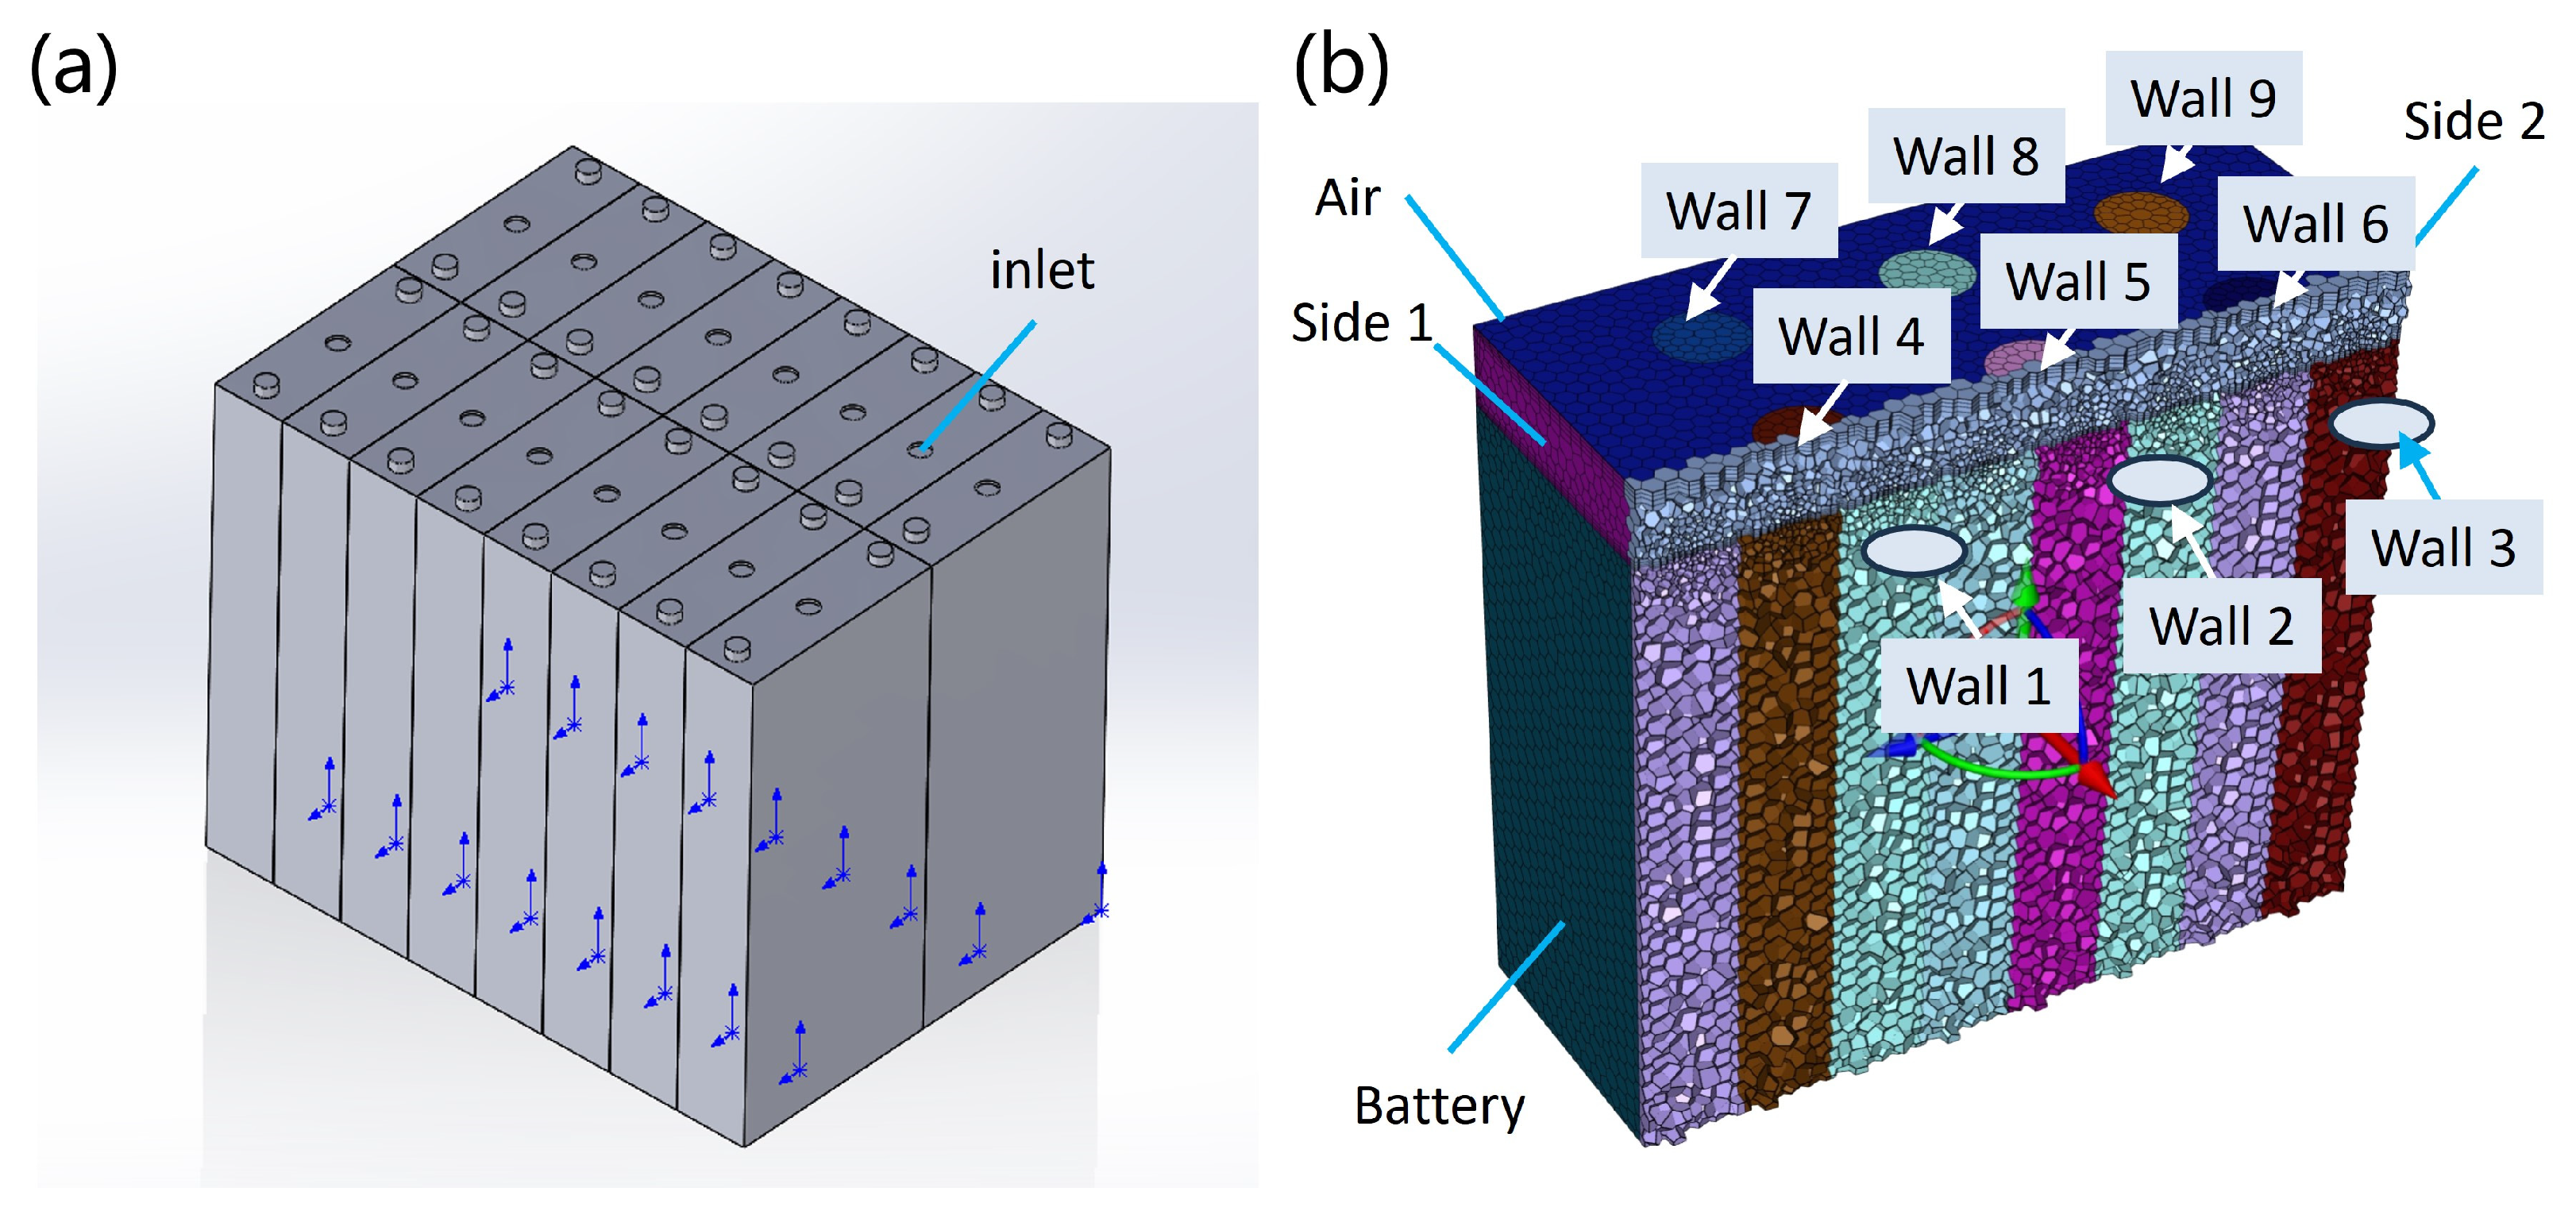
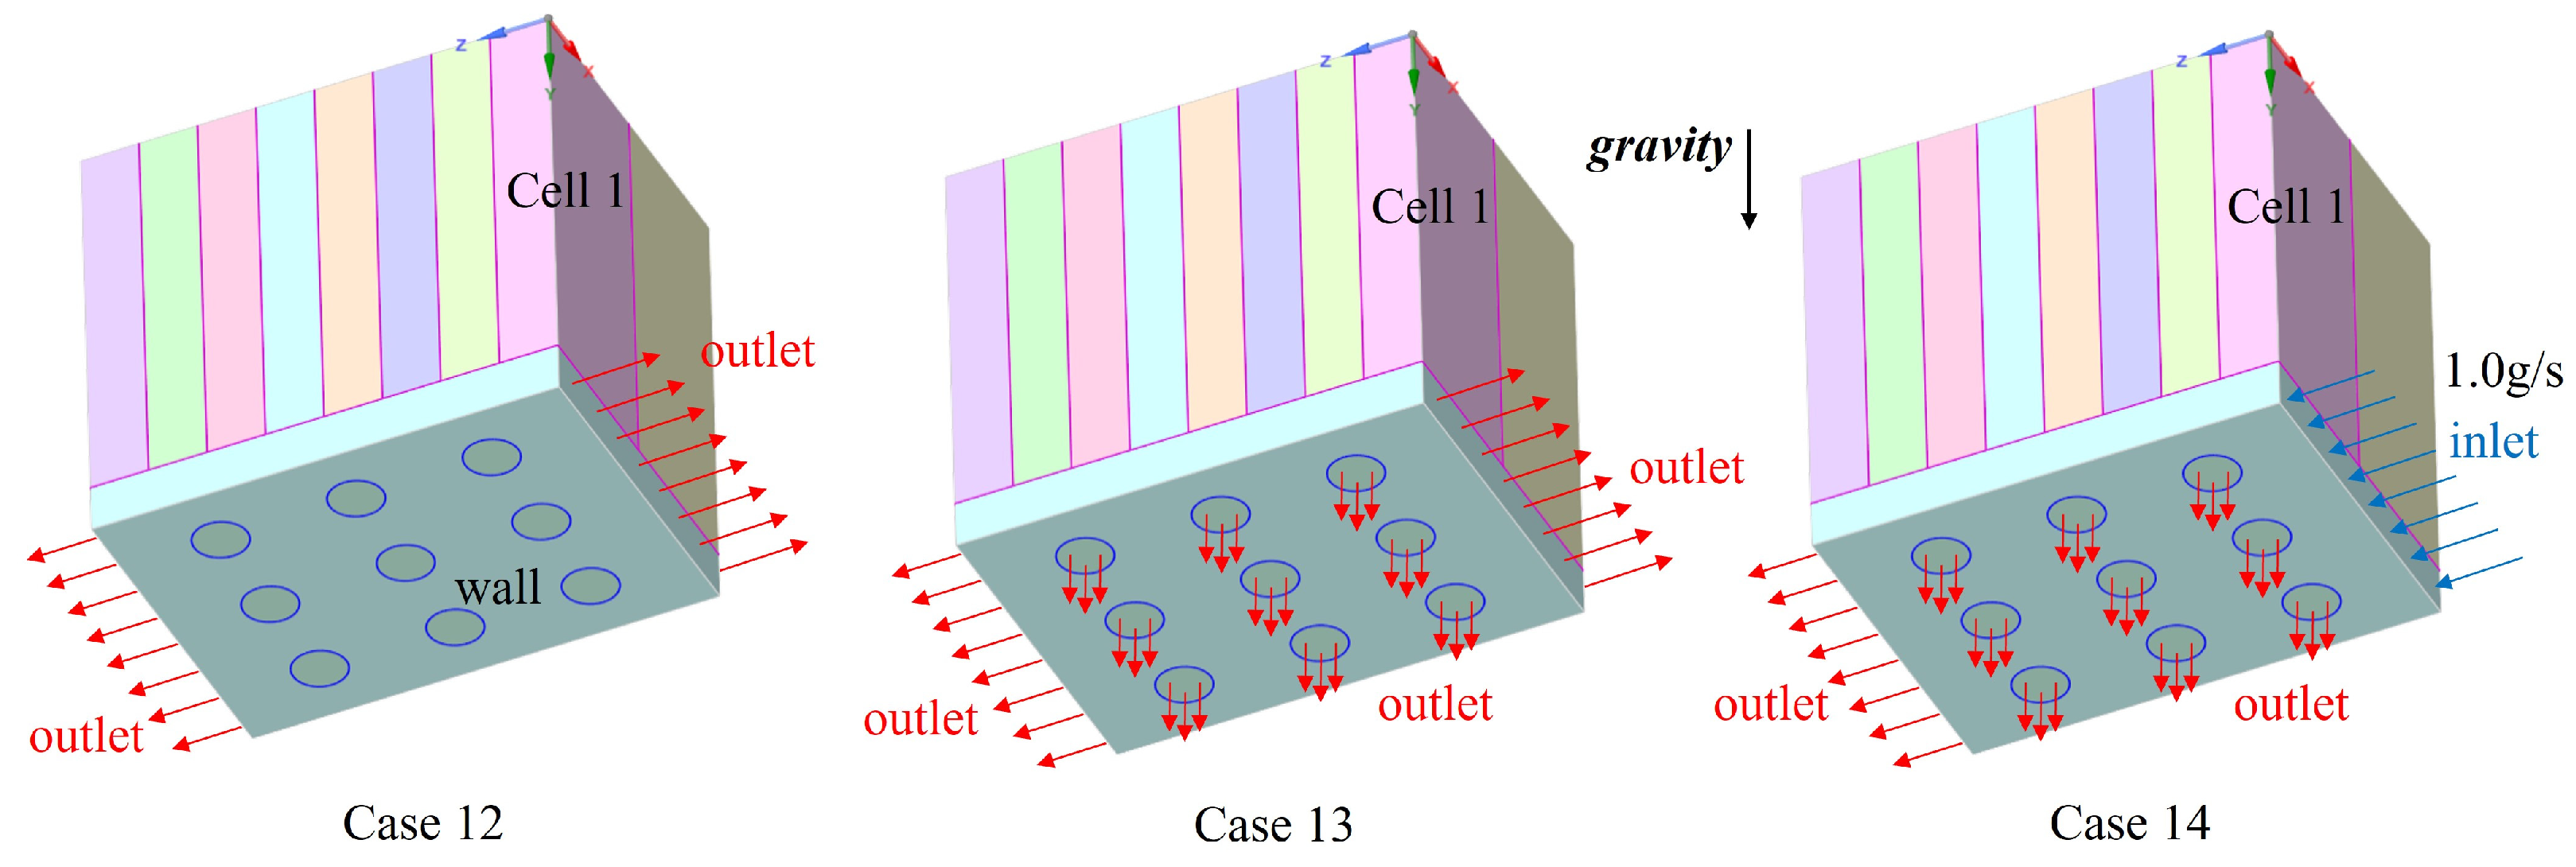
| Case | State | Side 1 | Side 2 | Wall 1 | Wall 2 | Wall 3 | Wall 4 | Wall 5 | Wall 6 | Wall 7 | Wall 8 | Wall 9 |
|---|---|---|---|---|---|---|---|---|---|---|---|---|
| Upright | Outlet | Outlet | Wall | Wall | Wall | Wall | Wall | Wall | Wall | Wall | Wall | |
| Upright | Outlet | Outlet | Wall | Wall | Wall | Wall | Inlet 1.5 g/s | Wall | Wall | Wall | Wall | |
| Upright | Outlet | Outlet | Wall | Wall | Wall | Inlet 1.5 g/s | Wall | Wall | Wall | Wall | Wall | |
| Upright | Outlet | Outlet | Inlet 1.5 g/s | Wall | Wall | Wall | Wall | Wall | Wall | Wall | Wall | |
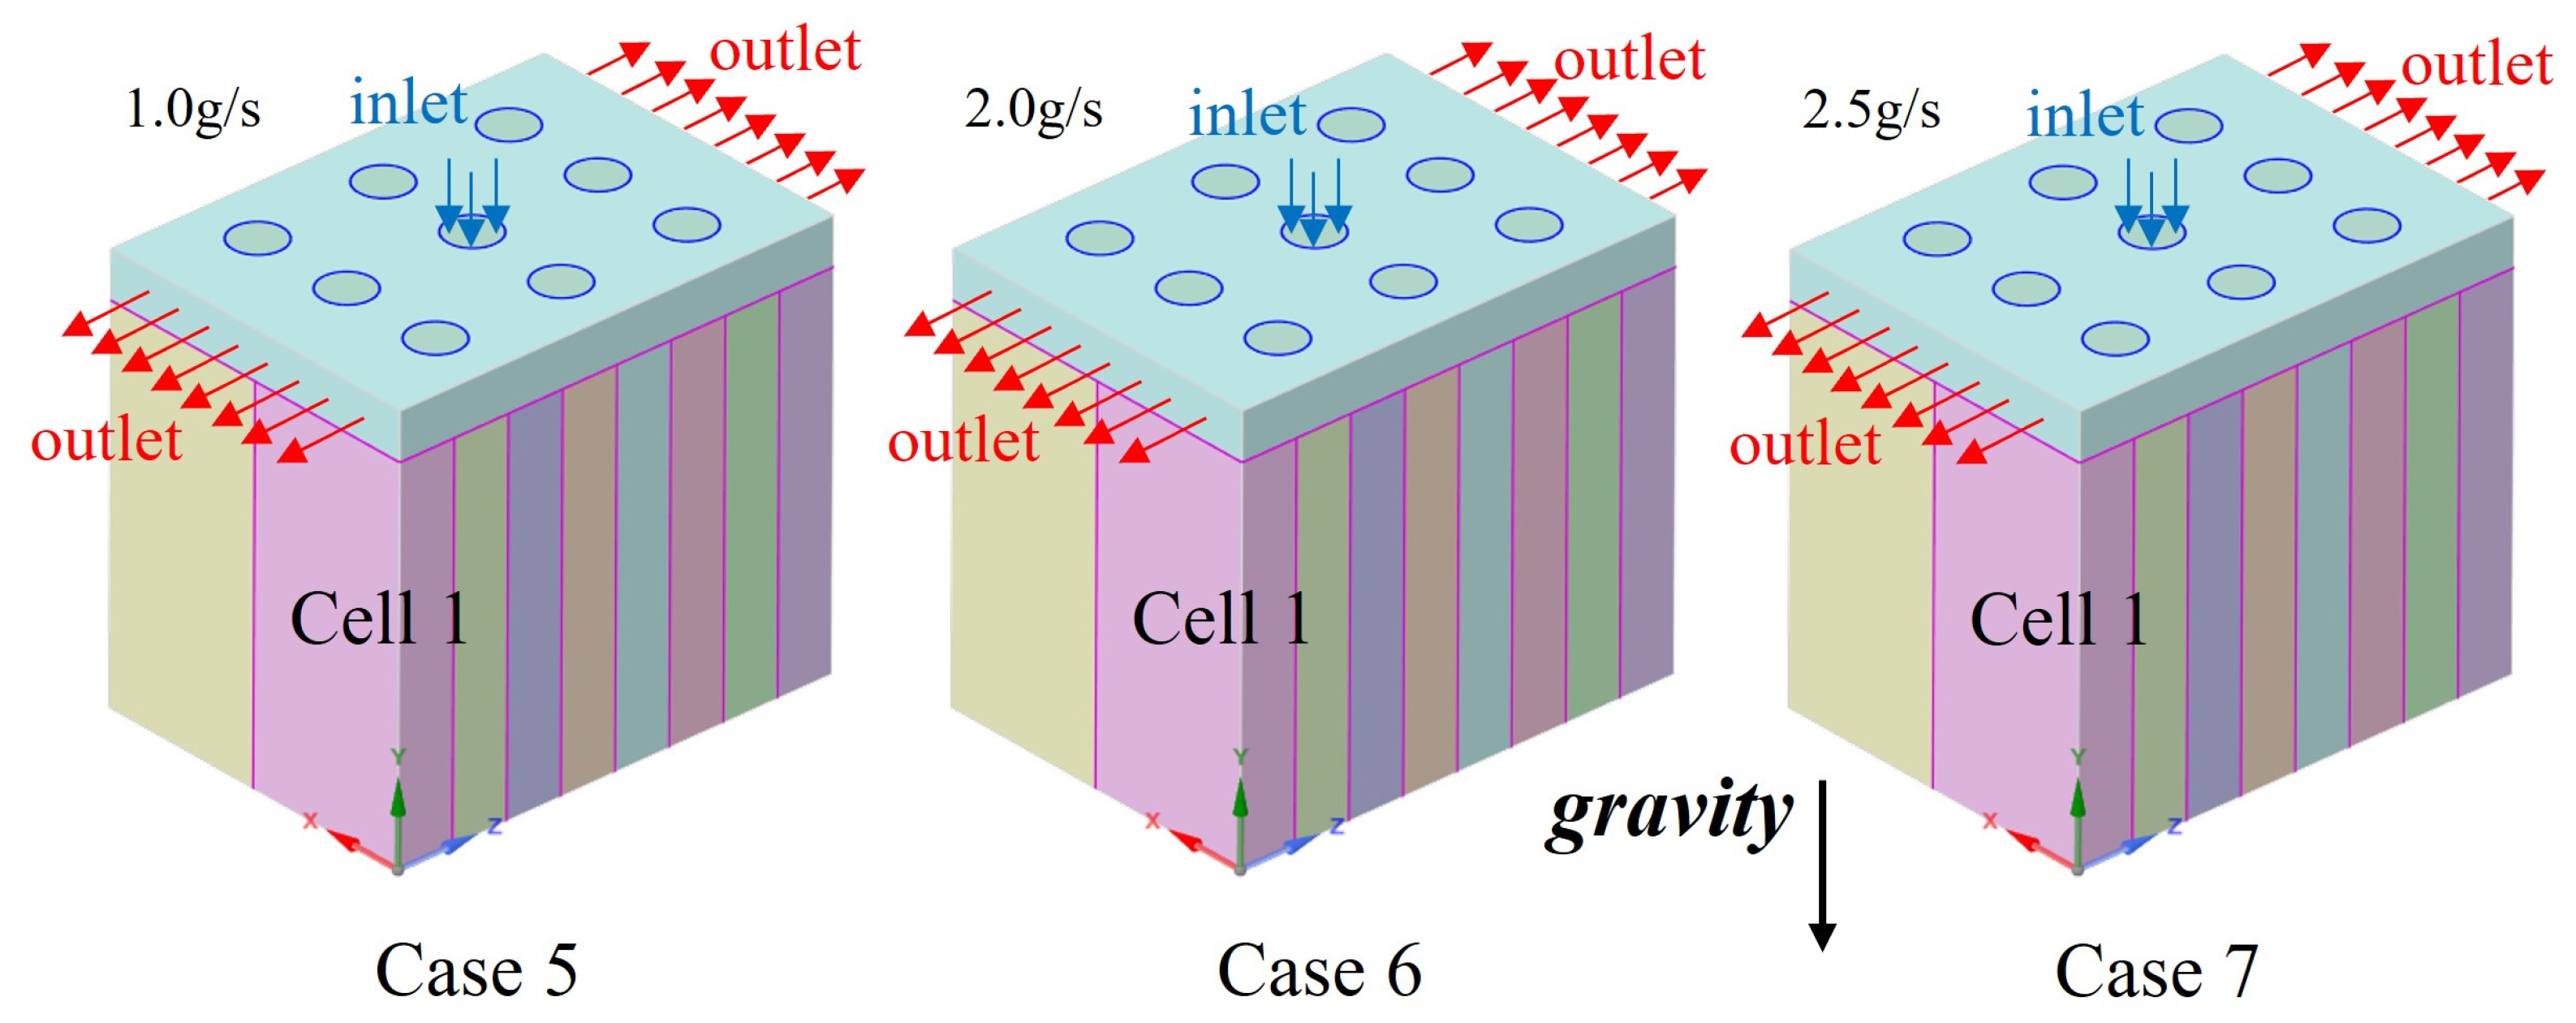
| Upright | Outlet | Outlet | Wall | Wall | Wall | Wall | Inlet 1.0 g/s | Wall | Wall | Wall | Wall | |
| Upright | Outlet | Outlet | Wall | Wall | Wall | Wall | Inlet 2.0 g/s | Wall | Wall | Wall | Wall | |
| Upright | Outlet | Outlet | Wall | Wall | Wall | Wall | Inlet 2.5 g/s | Wall | Wall | Wall | Wall | |
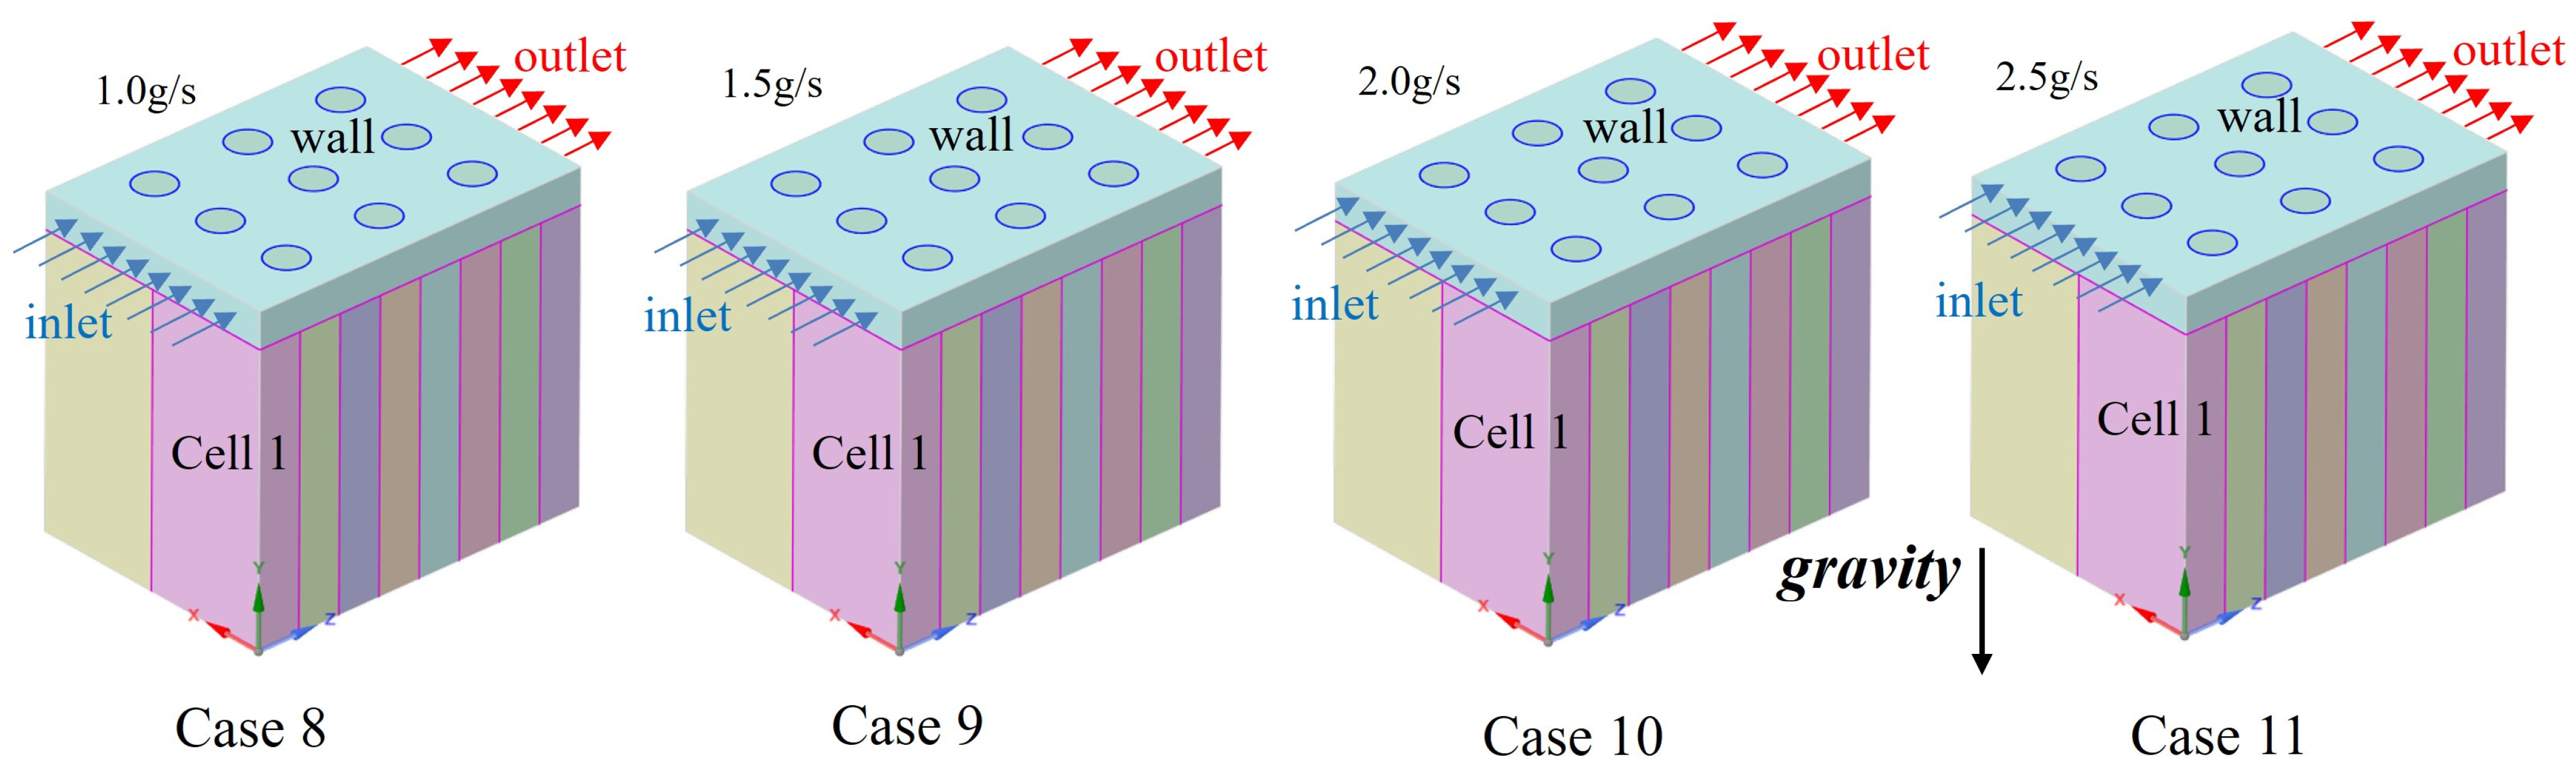
| Upright | Inlet 1.0 g/s | Outlet | Wall | Wall | Wall | Wall | Wall | Wall | Wall | Wall | Wall | |
| Upright | Inlet 1.5 g/s | Outlet | Wall | Wall | Wall | Wall | Wall | Wall | Wall | Wall | Wall | |
| Upright | Inlet 2.0 g/s | Outlet | Wall | Wall | Wall | Wall | Wall | Wall | Wall | Wall | Wall | |
| Upright | Inlet 2.5 g/s | Outlet | Wall | Wall | Wall | Wall | Wall | Wall | Wall | Wall | Wall | |
| Invert | Outlet | Outlet | Wall | Wall | Wall | Wall | Wall | Wall | Wall | Wall | Wall | |
| Invert | Outlet | Outlet | Outlet | Outlet | Outlet | Outlet | Outlet | Outlet | Outlet | Outlet | Outlet | |
| Invert | Inlet 1.0 g/s | Outlet | Outlet | Outlet | Outlet | Outlet | Outlet | Outlet | Outlet | Outlet | Outlet |
Disclaimer/Publisher’s Note: The statements, opinions and data contained in all publications are solely those of the individual author(s) and contributor(s) and not of MDPI and/or the editor(s). MDPI and/or the editor(s) disclaim responsibility for any injury to people or property resulting from any ideas, methods, instructions or products referred to in the content. |
© 2024 by the authors. Licensee MDPI, Basel, Switzerland. This article is an open access article distributed under the terms and conditions of the Creative Commons Attribution (CC BY) license (https://creativecommons.org/licenses/by/4.0/).
Share and Cite
Zhang, S.; Zhu, X.; Qiu, J.; Xu, C.; Wang, Y.; Feng, X. Modeling and Simulation of a Gas-Exhaust Design for Battery Thermal Runaway Propagation in a LiFePO4 Module. Batteries 2024, 10, 176. https://doi.org/10.3390/batteries10060176
Zhang S, Zhu X, Qiu J, Xu C, Wang Y, Feng X. Modeling and Simulation of a Gas-Exhaust Design for Battery Thermal Runaway Propagation in a LiFePO4 Module. Batteries. 2024; 10(6):176. https://doi.org/10.3390/batteries10060176
Chicago/Turabian StyleZhang, Songtong, Xiayu Zhu, Jingyi Qiu, Chengshan Xu, Yan Wang, and Xuning Feng. 2024. "Modeling and Simulation of a Gas-Exhaust Design for Battery Thermal Runaway Propagation in a LiFePO4 Module" Batteries 10, no. 6: 176. https://doi.org/10.3390/batteries10060176
APA StyleZhang, S., Zhu, X., Qiu, J., Xu, C., Wang, Y., & Feng, X. (2024). Modeling and Simulation of a Gas-Exhaust Design for Battery Thermal Runaway Propagation in a LiFePO4 Module. Batteries, 10(6), 176. https://doi.org/10.3390/batteries10060176