Abstract
This study explores the feasibility of integrating battery technology into electric buses, addressing the imperative to reduce carbon emissions within the transport sector. A comprehensive review and analysis of diverse literature sources establish the present and prospective landscape of battery electric buses within the public transportation domain. Existing battery technology and infrastructure constraints hinder the comprehensive deployment of electric buses across all routes currently served by internal combustion engine counterparts. However, forward-looking insights indicate a promising trajectory with the potential for substantial advancements in battery technology coupled with significant investments in charging infrastructure. Such developments hold promise for electric buses to fulfill a considerable portion of a nation’s public transit requirements. Significant findings emphasize that electric buses showcase considerably lower emissions than fossil-fuel-driven counterparts, especially when operated with zero-carbon electricity sources, thereby significantly mitigating the perils of climate change.
1. Introduction
Integrating advanced technological solutions into everyday life is becoming increasingly crucial amid the escalating threat of climate change. In 2019, transportation accounted for 27% of greenhouse gas emissions in the United Kingdom (UK) [1], signifying the most significant share among sectors. Addressing the urgent need to mitigate climate change requires a pivotal shift toward electrifying transportation [2]. While privately owned electric vehicles (EVs) are gradually supplanting traditional fossil fuel vehicles [3], one area that needs to reach the same level in this electrification endeavor is the realm of buses. Currently, public buses in the UK contribute 4.3 million tons of CO2 [4]. Fossil-fuel-powered buses, especially in urban environments, are major sources of NOx emissions. They are known for their association with respiratory disorders and other health complications [5], particularly affecting vulnerable demographics like children. As urban populations surge [6], the demand for public transport escalates, particularly considering the declining convenience of privately owned vehicles in urban settings [7]. As we can see from the discussion above, addressing these challenges necessitates an urgent mitigation of direct emissions and pollutants from transportation.
One way to reduce these emissions and pollutants is to electrify public transport. This transition has already succeeded in underground and overground railway systems within cities. However, buses have specific issues to overcome—for example, range limitations and charging times. Despite these challenges, electrifying buses have significant promise for eliminating direct pollutants, as mentioned earlier. Buses are ideal for electrification; they follow predictable routes, can be regularly interchanged with other units, carry consistent loads, and enjoy priority lanes and roads in the UK. These factors delineate a distinct use case for buses that would allow for the seamless integration of electrification. Moreover, buses can transport many passengers daily, minimizing emissions per passenger compared to privately owned vehicles [8].
This paper explores the viability of electrifying buses without fundamentally hindering their operational efficiency. It will analyze various contemporary battery materials [9] and technologies [10] to examine the potential implementation of modern-day battery technology in buses [11]. Additionally, forthcoming technologies will be reviewed to assess the veracity of claims made by companies regarding battery densities, capacities, charge times, and their feasibility for implementation based on a comprehensive cost–benefit analysis. Furthermore, various approaches and technologies will be explored to gauge the problem comprehensively and reach a holistic conclusion that yields the most efficient solution. Beyond addressing technological hurdles, cost is one of this sector’s foremost issues [12]. This paper will also attempt to compare and contrast solutions, seeking alternative methods to circumvent this issue by devising novel solutions and leveraging existing technologies.
2. Literature Review
2.1. Batteries
Batteries are utilized across almost every industry as a convenient way to supply energy [13]. Operating on the fundamental principle of converting chemical energy into electrical energy on demand [14], batteries consist of four essential components: the anode, cathode, electrolyte, and separator [15]. The chemical reactions within a battery lead to the accumulation of electrons on the anode, thus creating a potential difference. Upon completing the circuit, electrons find a path to the anode, generating a current [14]. Batteries are categorized as primary (single-use, requiring disposal after depletion) and secondary (rechargeable, allowing for multiple usage cycles) [16,17].
The heart of any battery lies in its active materials, which dictate its efficiency and performance [18]. Cathode active materials (CAMs) and anode active materials (AAMs) are responsible for the efficiency, reliability, costs, cycle, calendar life, and size of batteries. Together, these materials account for 60–70% of total cell costs with today’s raw material prices [19]. Recent advancements have led to a surge in research focusing on developing and optimizing active materials such as lithium (Li)-ion, sodium (Na)-ion, and others [18]. Understanding the nuances of these materials is pivotal for achieving higher energy density, longer cycle life, and improved overall battery performance [20].
The electrochemical reactions within a battery are responsible for its functionality [14]. Understanding the complexity and multifaceted nature of these reactions within a battery is crucial for predicting its behavior and degradation [21]. Sophisticated battery management systems (BMSs) are essential for optimizing the safety and performance of battery systems. Breakthrough technologies are being developed to address fast charging [22], material optimization [23], and recycling issues [24]. Innovative solutions ranging from novel electrolyte formulations to advanced thermal management techniques are being explored, showcasing the dynamism of contemporary battery research.
Moreover, researchers are striving to improve battery performance, safety, and durability with minimal environmental impact [23]. Key research areas involve the advanced characterization of cell components like electrodes and electrolytes to improve overall battery design [25], conducting fundamental studies on ion storage [26] and modifying surface or coating properties [27]. Also, data-driven approaches have been proposed for the rational design of battery materials based on resource and performance considerations [28,29].
This paper will focus on secondary batteries, particularly Li-ion batteries, which are more appropriate for transport and comprise most of the battery and automotive market. Without delving extensively into Li-ion battery research, this paper will discuss key considerations such as material choices, cost benefits, and performance analysis, aligning with electric bus battery technologies in the UK.
2.2. Public Bus Use Case
To comprehend the implementation of electrification in local public buses, understanding the current design prerequisites and operational demands of these buses is essential. Notably, during the 2019/2020 fiscal year, the average distance covered by a bus on a London route was around 130 miles [30]. Therefore, any electric powertrain introduced should match or improve this range.
The existing UK bus fleet encompasses various engines, predominantly diesel engines from manufacturers like Volvo and Daimler [31]. However, for this analysis, we will focus on the Cummins diesel powertrain, particularly the ISB6.7 Euro6 Cummins engine, a significant component of the local TFL bus fleet [32]. These engines offer power ranging from 164 to 239 kW (220 to 320 HP) and torque between 900 to 1200 Nm (664 to 885 lb-ft), varying based on their application. Furthermore, the Cummins diesel powertrain can carry a payload of 1800–3300 kg [33], necessitating any proposed to adhere to these performance criteria.
A critical aspect of the design of any public infrastructure is cost. Currently, the cost of internal combustion engine (ICE) buses is around GBP 250,000, with specific configurations reaching up to GBP 500,000 [34]. Bus operating expenses currently range between 419 and 449 pence per vehicle mile [30]. Therefore, any prospective electric system must compete with or surpass current pricing structures. Expenditure in the public sector undergoes stringent scrutiny compared to the private sector, requiring substantial incentives to sway councils and private bus operators from proven, existing technologies toward newer, untested ones. Consequently, proposed electric solutions should promise tangible short- or long-term savings—ideally both.
3. Cost Analysis
For the analysis, we will primarily compare two buses currently in use across cities in the UK: the Mercedes-Benz Citario and the Yutong TCe12. These models are extensively utilized throughout the UK and exhibit notable comparability.
3.1. Purchase Cost
Economic feasibility is the primary determinant for the viability of electrified bus transport. This factor fundamentally influences the adoption of new technology by both private companies and local governments. Notably, significant discrepancies exist between the components constituting ICE and electric drivelines [35]. Understanding these disparities is pivotal, as they engender distinct operational behaviors and functionalities in vehicles, which will be elaborated upon later. Moreover, these differences give rise to varying benefits and drawbacks. Comparatively, the cost of purchasing a brand-new electric bus significantly surpasses that of a traditional ICE bus. For instance, a single-decker Yutong Tce12 electric bus costs GBP 295,000, positioning it approximately GBP 100,000 higher than its diesel-powered equivalent [36].
3.2. Fuel Cost
Electric vehicles are often presented as having lower operating costs than ICE vehicles [37]. However, it is important to note that this price is susceptible to market factors, as illustrated in Figure 1, which showcases the prices of red diesel and crude oil in red and blue colors, respectively. It also demonstrates how fuel prices, though correlated with fluctuations in the crude oil price, can exhibit relative stability over long periods, with price increments aligning with inflation rates [38]. Typically, traditional ICU buses consume approximately 24 L of fuel per 100 km, traveling at an average speed of 60 km/h [39]. This means a diesel bus will consume an average of 150 L of fuel (assuming three round trips on an average route within a 9–10 h shift) with current wholesale diesel prices (131.88 pence per liter), which costs GBP 197.82 per bus per shift for fuel alone [40].
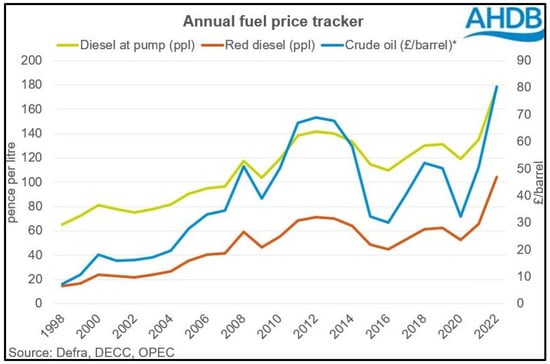
Figure 1.
Wholesale fuel prices over time. Reproduced with permission from [41].
One advantage of using fossil fuels lies in the government’s capability to temporarily reduce or completely alleviate any fuel duty imposed on wholesale fuel sales [42]. This measure aims to ensure public transport’s affordability during crises, especially when the fuel cost per liter significantly surpasses historical averages due to shortages and supply chain disruptions. Before this increase (using prices from January 2019, 96.85 pence [40]), the daily cost per shift would have been GBP 145.89 per bus. This results in the saving of GBP 51.93, translating to substantial savings when extended across an entire fleet of buses.
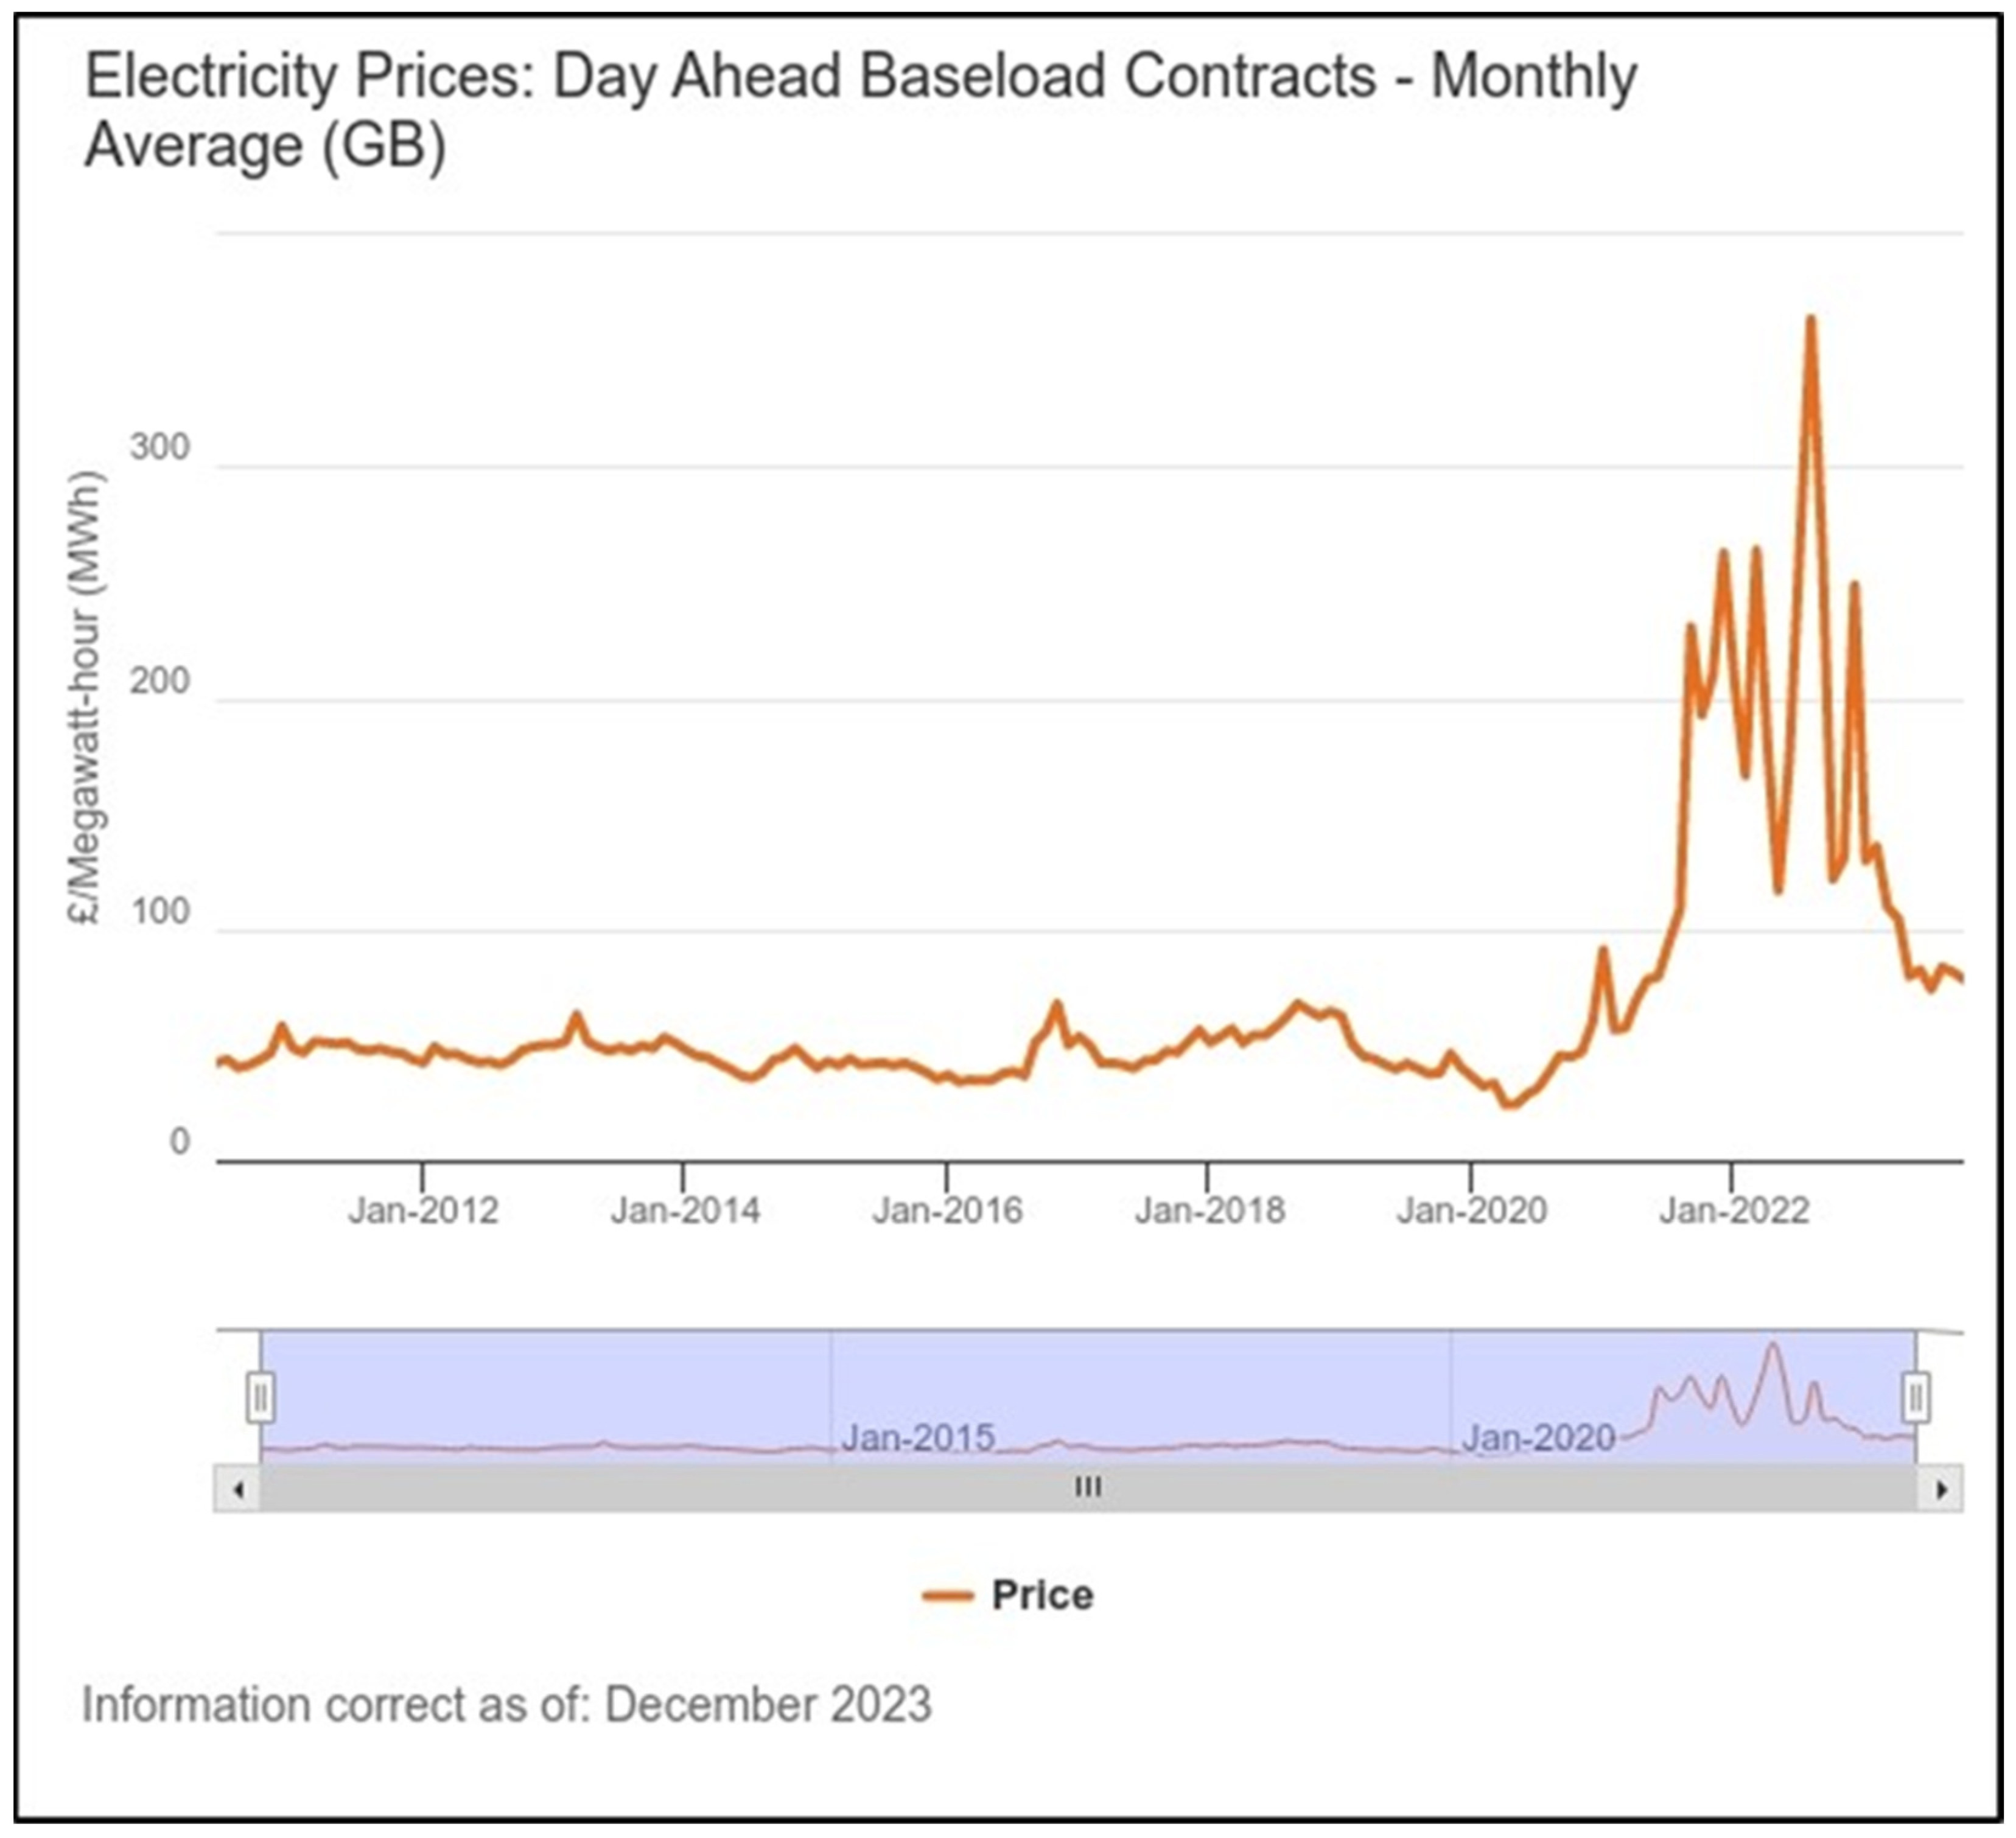
Figure 2 shows the relative stability of electricity prices over the past decade, except for the last two years, during which they more than doubled rapidly. This substantial increase has significantly impacted the operational costs of running a fleet of electrified buses. To cover the same distance as an equivalent diesel bus at current prices (28 pence per kWh [43]) along a 130-mile route, making 3 round trips within 9–10 h, the estimated cost would be around GBP 236.33. This cost far exceeds the current expense for the same trip using diesel. Before the steep increase in electricity costs per kWh, the journey would have cost GBP 165.42, using 2019 prices [43]. This shows the vast range of possible operational costs that could harm bus operators. It is important to note that the quoted content for the Yutong TCe12 is 370 km, which might necessitate a mid-journey charge, impacting route planning and driver shift schedules.
Comparing the two costs, it is evident that, using both 2019 and current figures, running diesel buses is considerably cheaper in terms of fuel cost. In the ‘normal’ scenario, operating an ICU bus per shift is GBP 19.53, which is less expensive. Scaling this up to an entire fleet of buses (around 400 buses for a mid-sized city) results in an increased cost of GBP 7812 per day, totaling over GBP 2.85 million annually. Unless government subsidies or a significant increase in inexpensive electricity occurs, bus operators will likely continue using ICU buses due to these financial incentives.
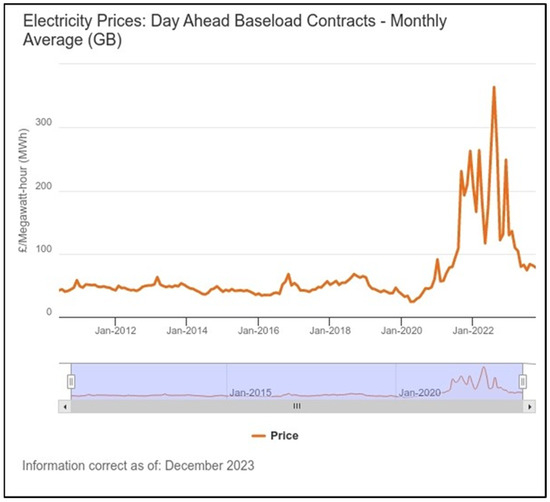
Figure 2.
Electricity prices, monthly average. Reproduced with permission from [44].
Figure 2.
Electricity prices, monthly average. Reproduced with permission from [44].
3.3. Maintenance Costs
Maintenance adds a significant cost to bus operators. Only maintenance costs associated with the drivetrain will be considered for this part of the analysis. For comparative purposes, labor costs have been assumed to be USD 50 (GBP 42) per hour, acknowledging their considerable variability based on the service provider [45].
In the case of a traditional diesel bus, maintenance primarily involves oil, oil filters, air filter replacements, and considerations for any fuel system maintenance costs [46]. The average price of these parts comes to USD 3273.25 (GBP 2753.75), involving an average labor time of 42.75 h [45]. These calculations are based on an assumed distance of approximately 100,000 miles driven over 24 months, costing USD 0.54 per mile, as detailed in Table 1 [45].

Table 1.
Analysis of four similar bus maintenance costs. Reproduced with permission from [45].
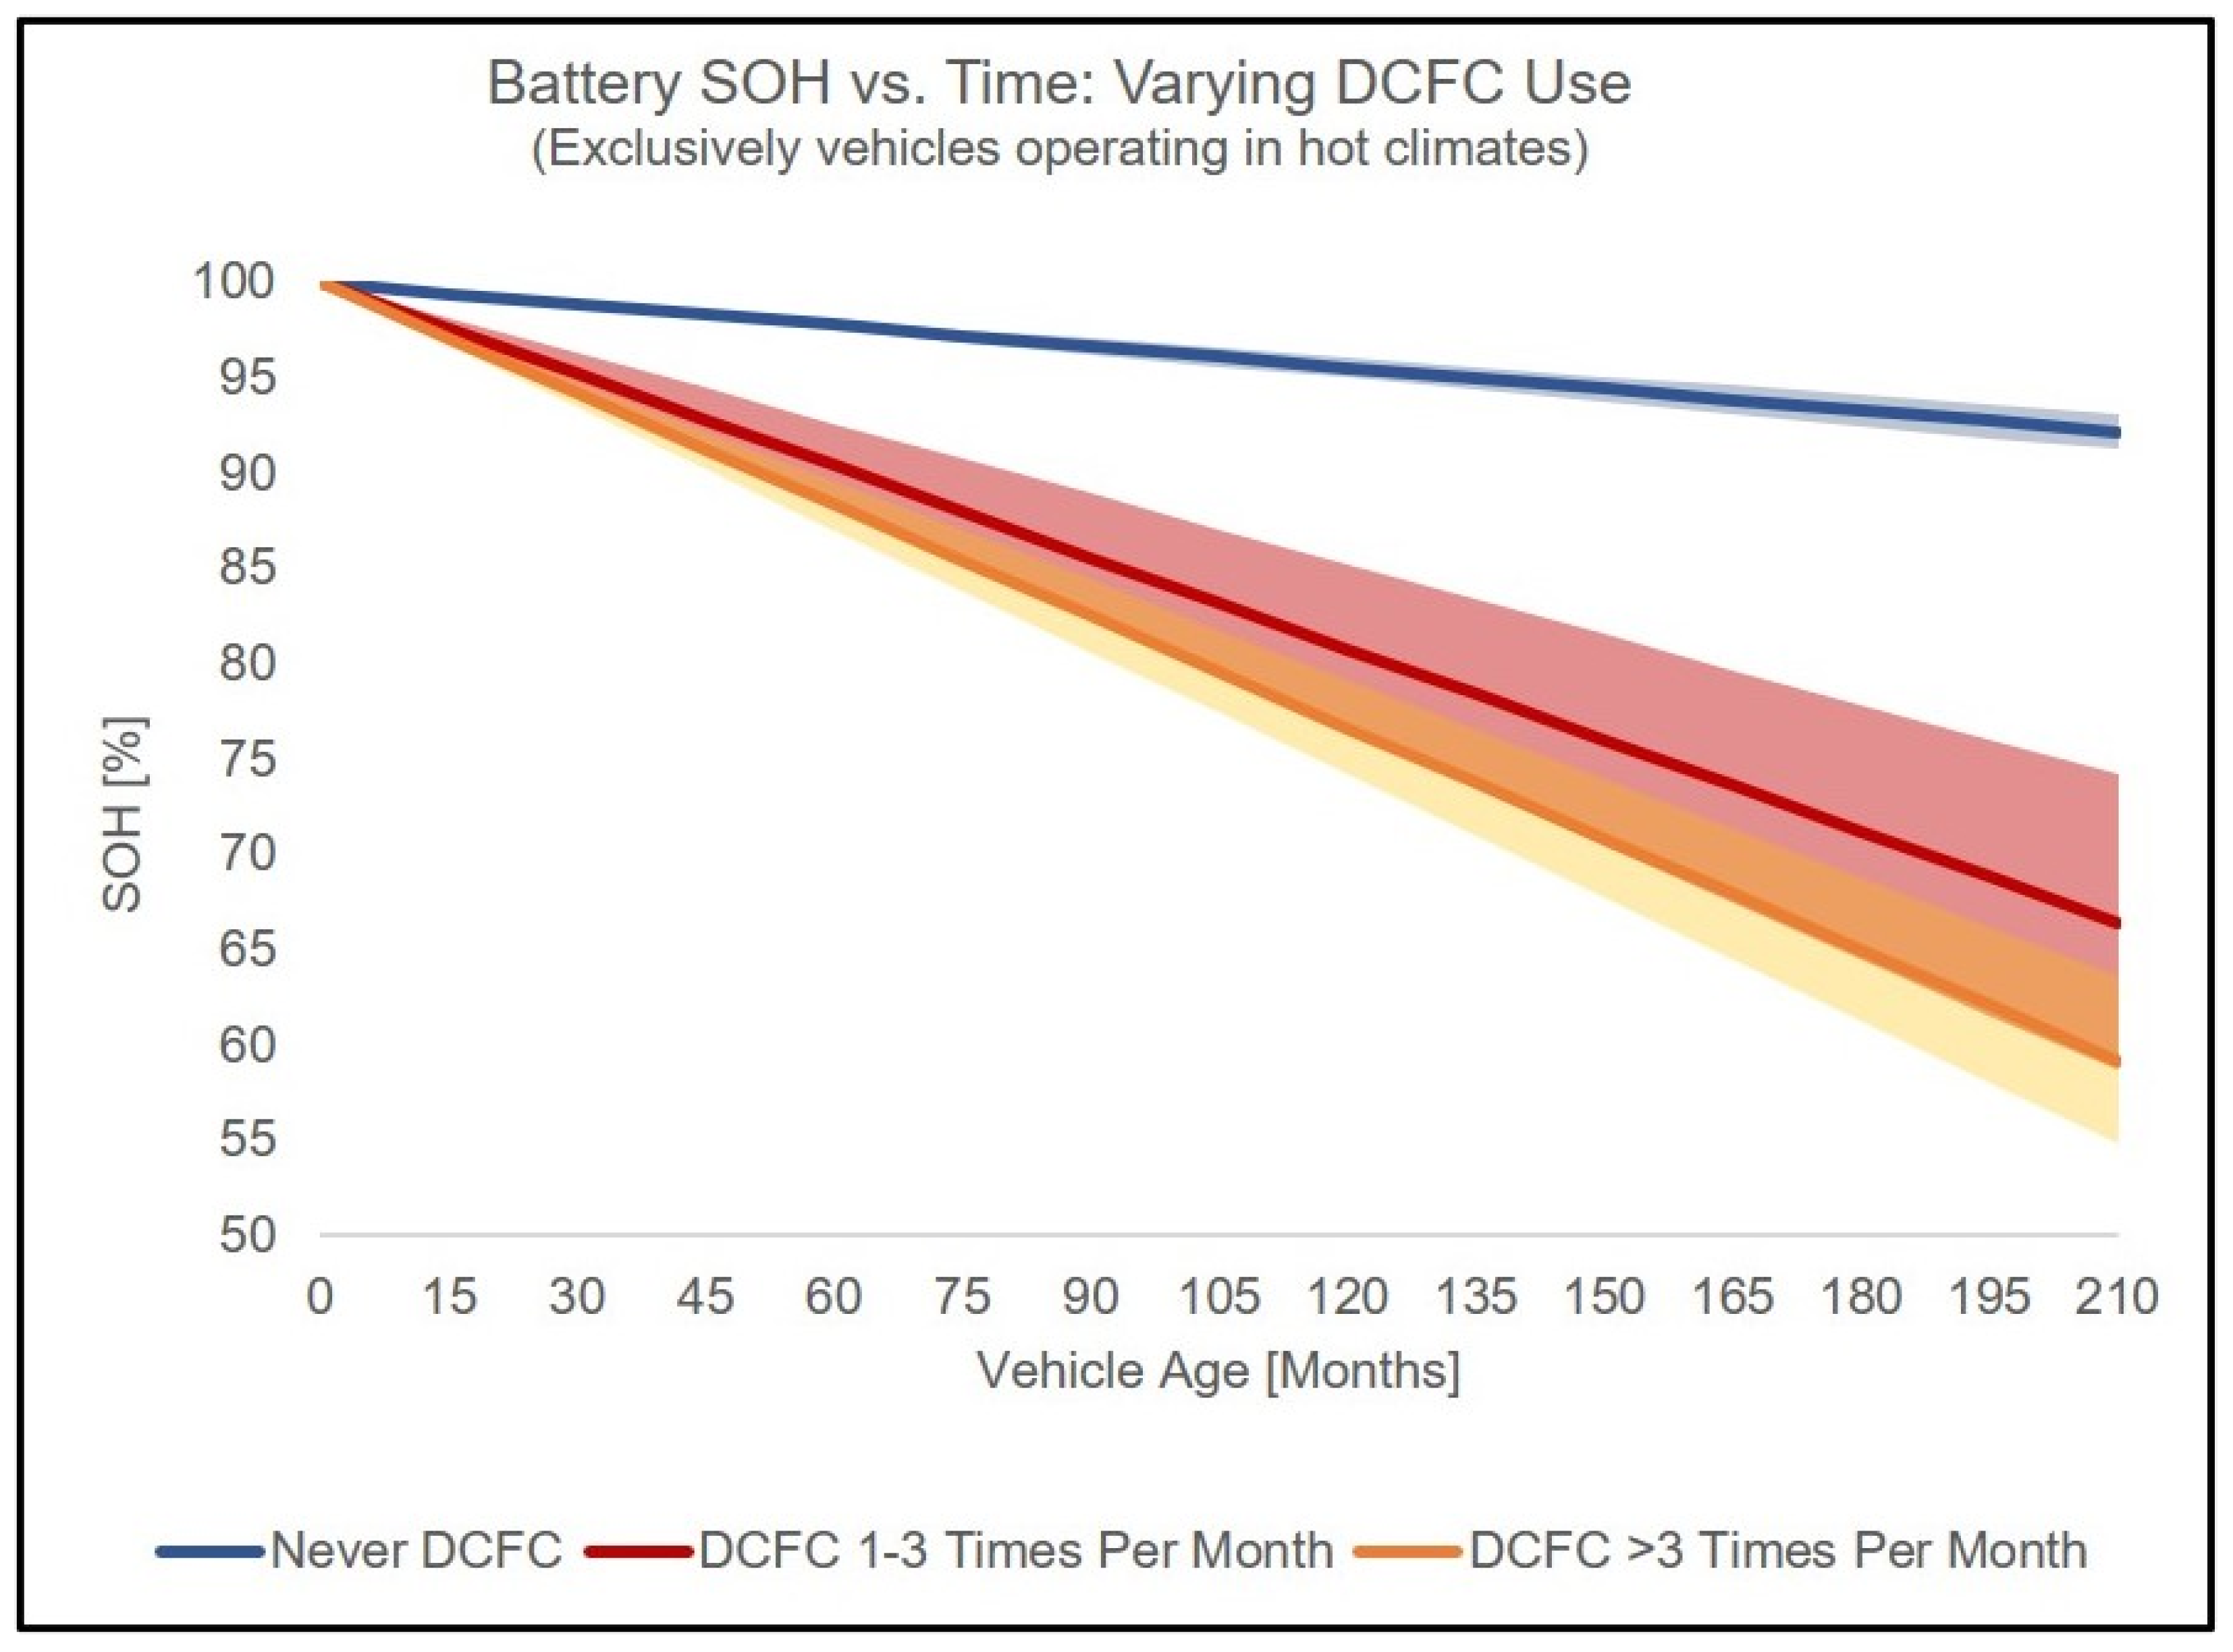
The maintenance for an electric powertrain is notably more straightforward owing to the reduced number of parts, fostering the potential for increased reliability through enhanced robustness in each component [47]. However, one form of maintenance that must be considered is the replacement of the battery, which degrades and reduces capacity over time. The frequency of these replacements depends on many variables, such as the manufacturer of the battery, the charge and discharge cycles, the composition of the battery’s materials, etc. Li-ion batteries, subject to extensive real-world usage, can take between 2000–4000 charging cycles, depending on how often DC fast charging is used [48]. This equates to approximately 5 to 10 years before requiring replacement, as illustrated in Figure 3.

Figure 3.
Lithium-ion battery degradation. Reproduced with permission from [49,50].
The Yutong TCe12 has a projected battery life of 6 years, requiring a replacement cost of USD 195,900 [51]. This replacement cost equals a per-mile equivalent of USD 0.653, assuming a similar mileage to the diesel bus. This estimation only considers the inevitable degradation of the batteries and does not include any possible failures of other driveline components, such as the motors.
Figure 3 also highlights the fact that battery degradation can accelerate significantly when utilizing DC fast charging, a common practice in electrified bus networks. Therefore, fast charging a bus multiple times a day is a popular strategy to maintain operational bus services, given the limited range of a battery electric bus [52]. However, this practice can substantially impact the lifetime of battery packs, leading to operator costs.
The cost of replacing Li-ion batteries, predominantly used in all EVs today, is predicted to decrease over time [53].
Figure 4 shows the declining trend in battery price per kWh. This indicates a substantial future decrease in the cost of battery replacements, suggesting that if an electrified bus network is established, the expense of replacing batteries in 6–10 years will witness nearly a 50% reduction. This can also have cascading effects on purchasing electric buses in the near future, making them far more cost-effective. Furthermore, early adopters of the technology will drive down prices, thereby increasing overall demand and further reducing costs.
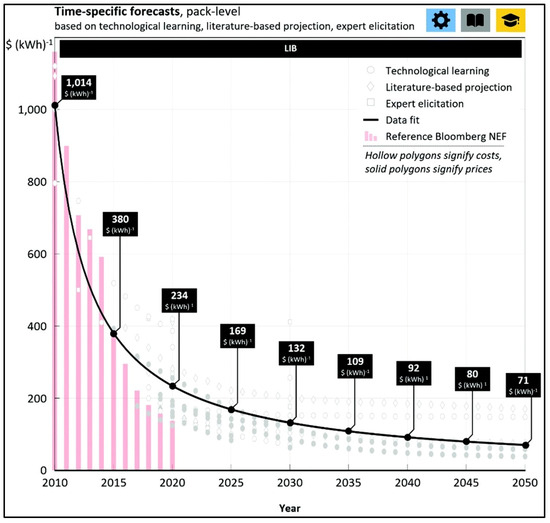
Figure 4.
Prediction of battery prices over time [53]. Copyright 2021, Energy & Environmental Science.
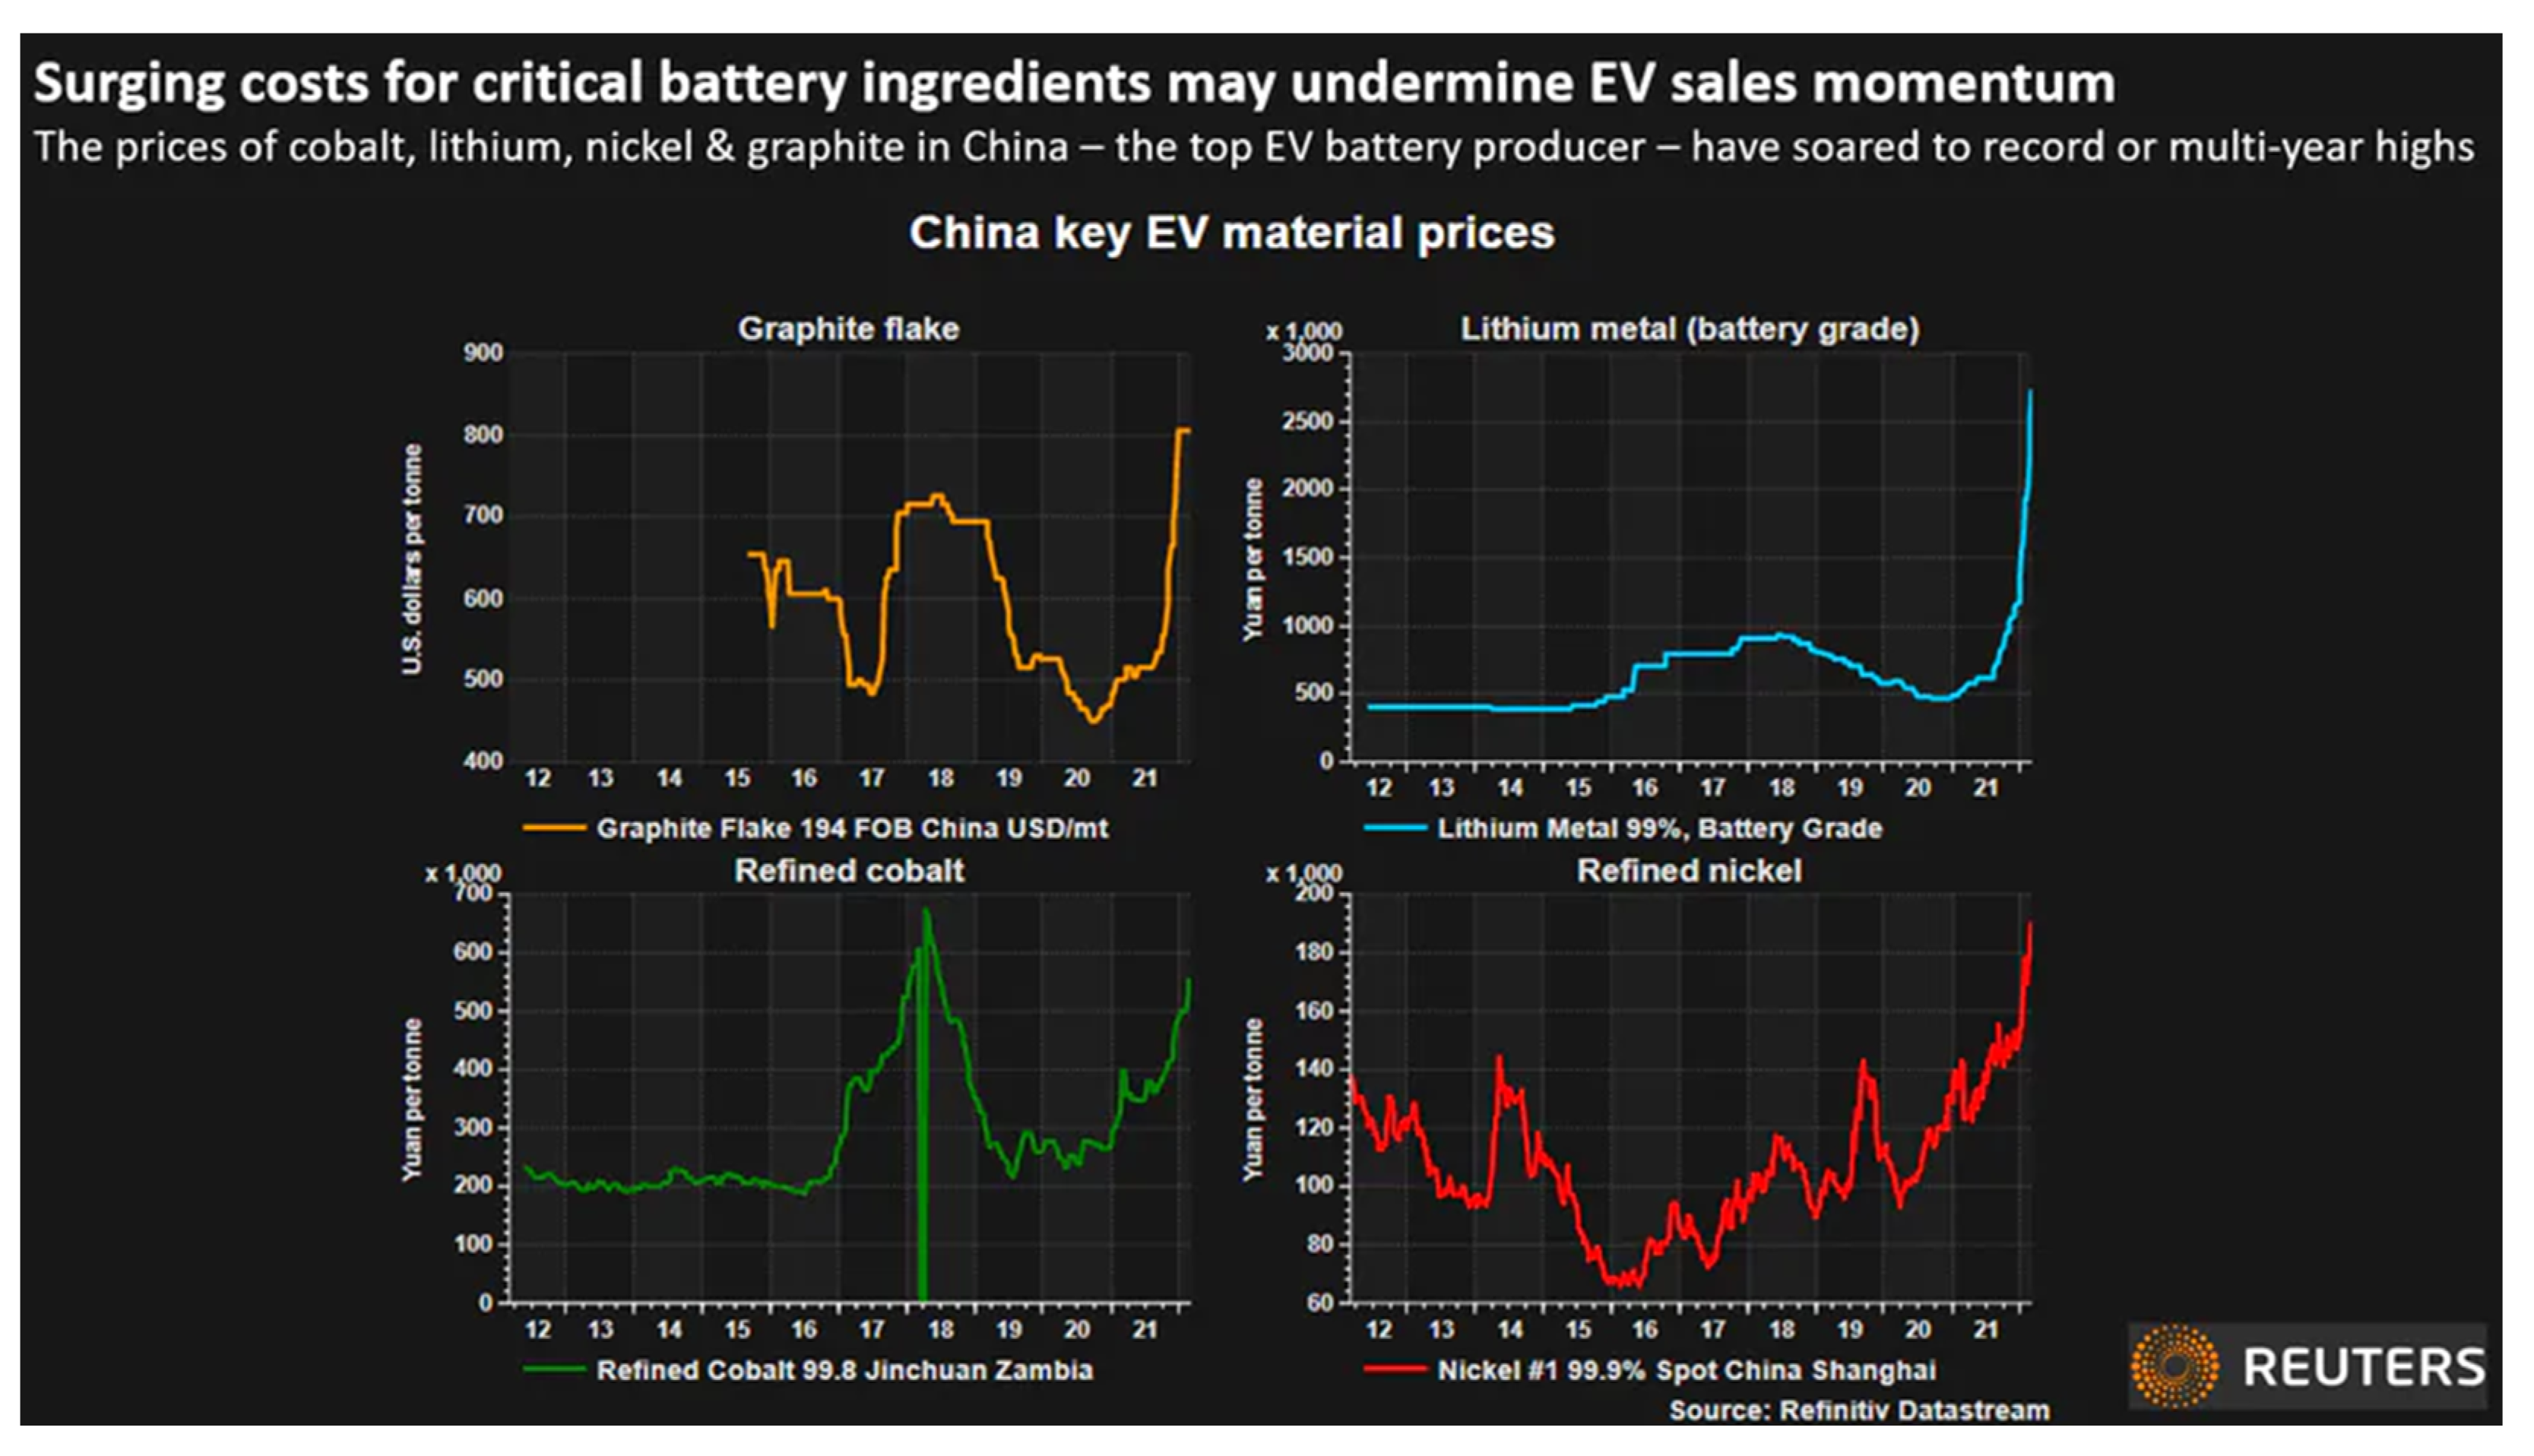
Although battery prices per kWh are forecasted to decrease, recent global events highlight the EV industry’s sensitivity to global raw material prices [54]. Lithium is an essential material in the production of batteries for EVs. This means that any scarcity in the raw material can devastate battery prices, potentially rendering a battery electric transport network economically unfeasible [55].
Figure 5 illustrates how the volatility in material cost can dissuade bus operators from choosing battery electric buses when upgrading their fleet. In addition to lithium prices, it is evident that the other materials required to make batteries are also subject to similar market fluctuations.
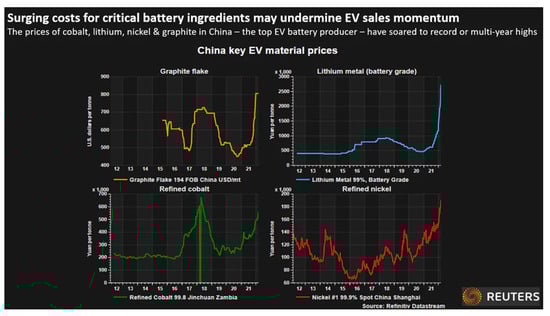
Figure 5.
Battery raw material price over time. Reproduced with permission from [56].
3.4. Infrastructure Costs
Another significant cost of adopting battery electric buses is the infrastructure required to keep a fleet operational. Charging infrastructure must be retrofitted into bus depots and potentially along routes to support an electrified bus fleet [57]. Three types of charging infrastructure can keep a fleet running: pantograph, plug-in, and ground-based charging (as in Figure 6) [58].
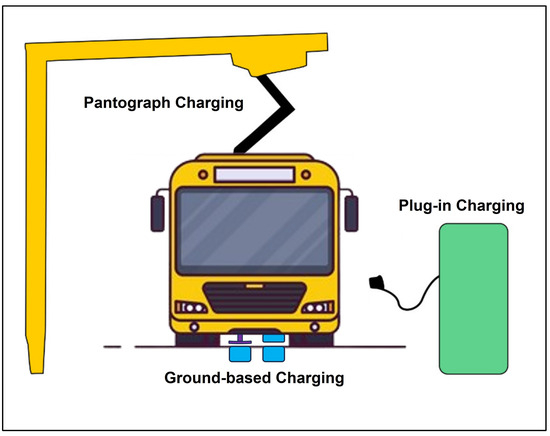
Figure 6.
Illustration showing the three primary forms of charging.
The most common form of charging is plug-in charging, which involves manually plugging a physical charger into the bus. However, this method can pose challenges for large-scale fleets. Despite this, plug-in charging offers relative affordability and minimal road and foot traffic disruption. Furthermore, using a standardized charging plug, commissioned by the European Union (EU) [59], promotes interoperability among bus manufacturers and operators. Meanwhile, DC fast charging can significantly boost charging speeds, which proves beneficial for daytime charging. As previously discussed, it can substantially diminish battery pack longevity, necessitating earlier replacements. To mitigate this issue, one approach involves integrating DC fast charging as a supplementary method to overnight ‘slow’ charging, enabling mid-route battery recharging for an extended range. However, this can still have detrimental effects on battery longevity, depending on use. The primary advantage of plug-in charging lies in its widespread usage and established technology. This paves the way for rapid advancements in innovation, aligning with the automotive industry’s improvements in plug-in charging for personal EVs. The costs associated with installing a plug-in fast charger for a single bus can range between USD 123,750 and USD 303,300 [60].
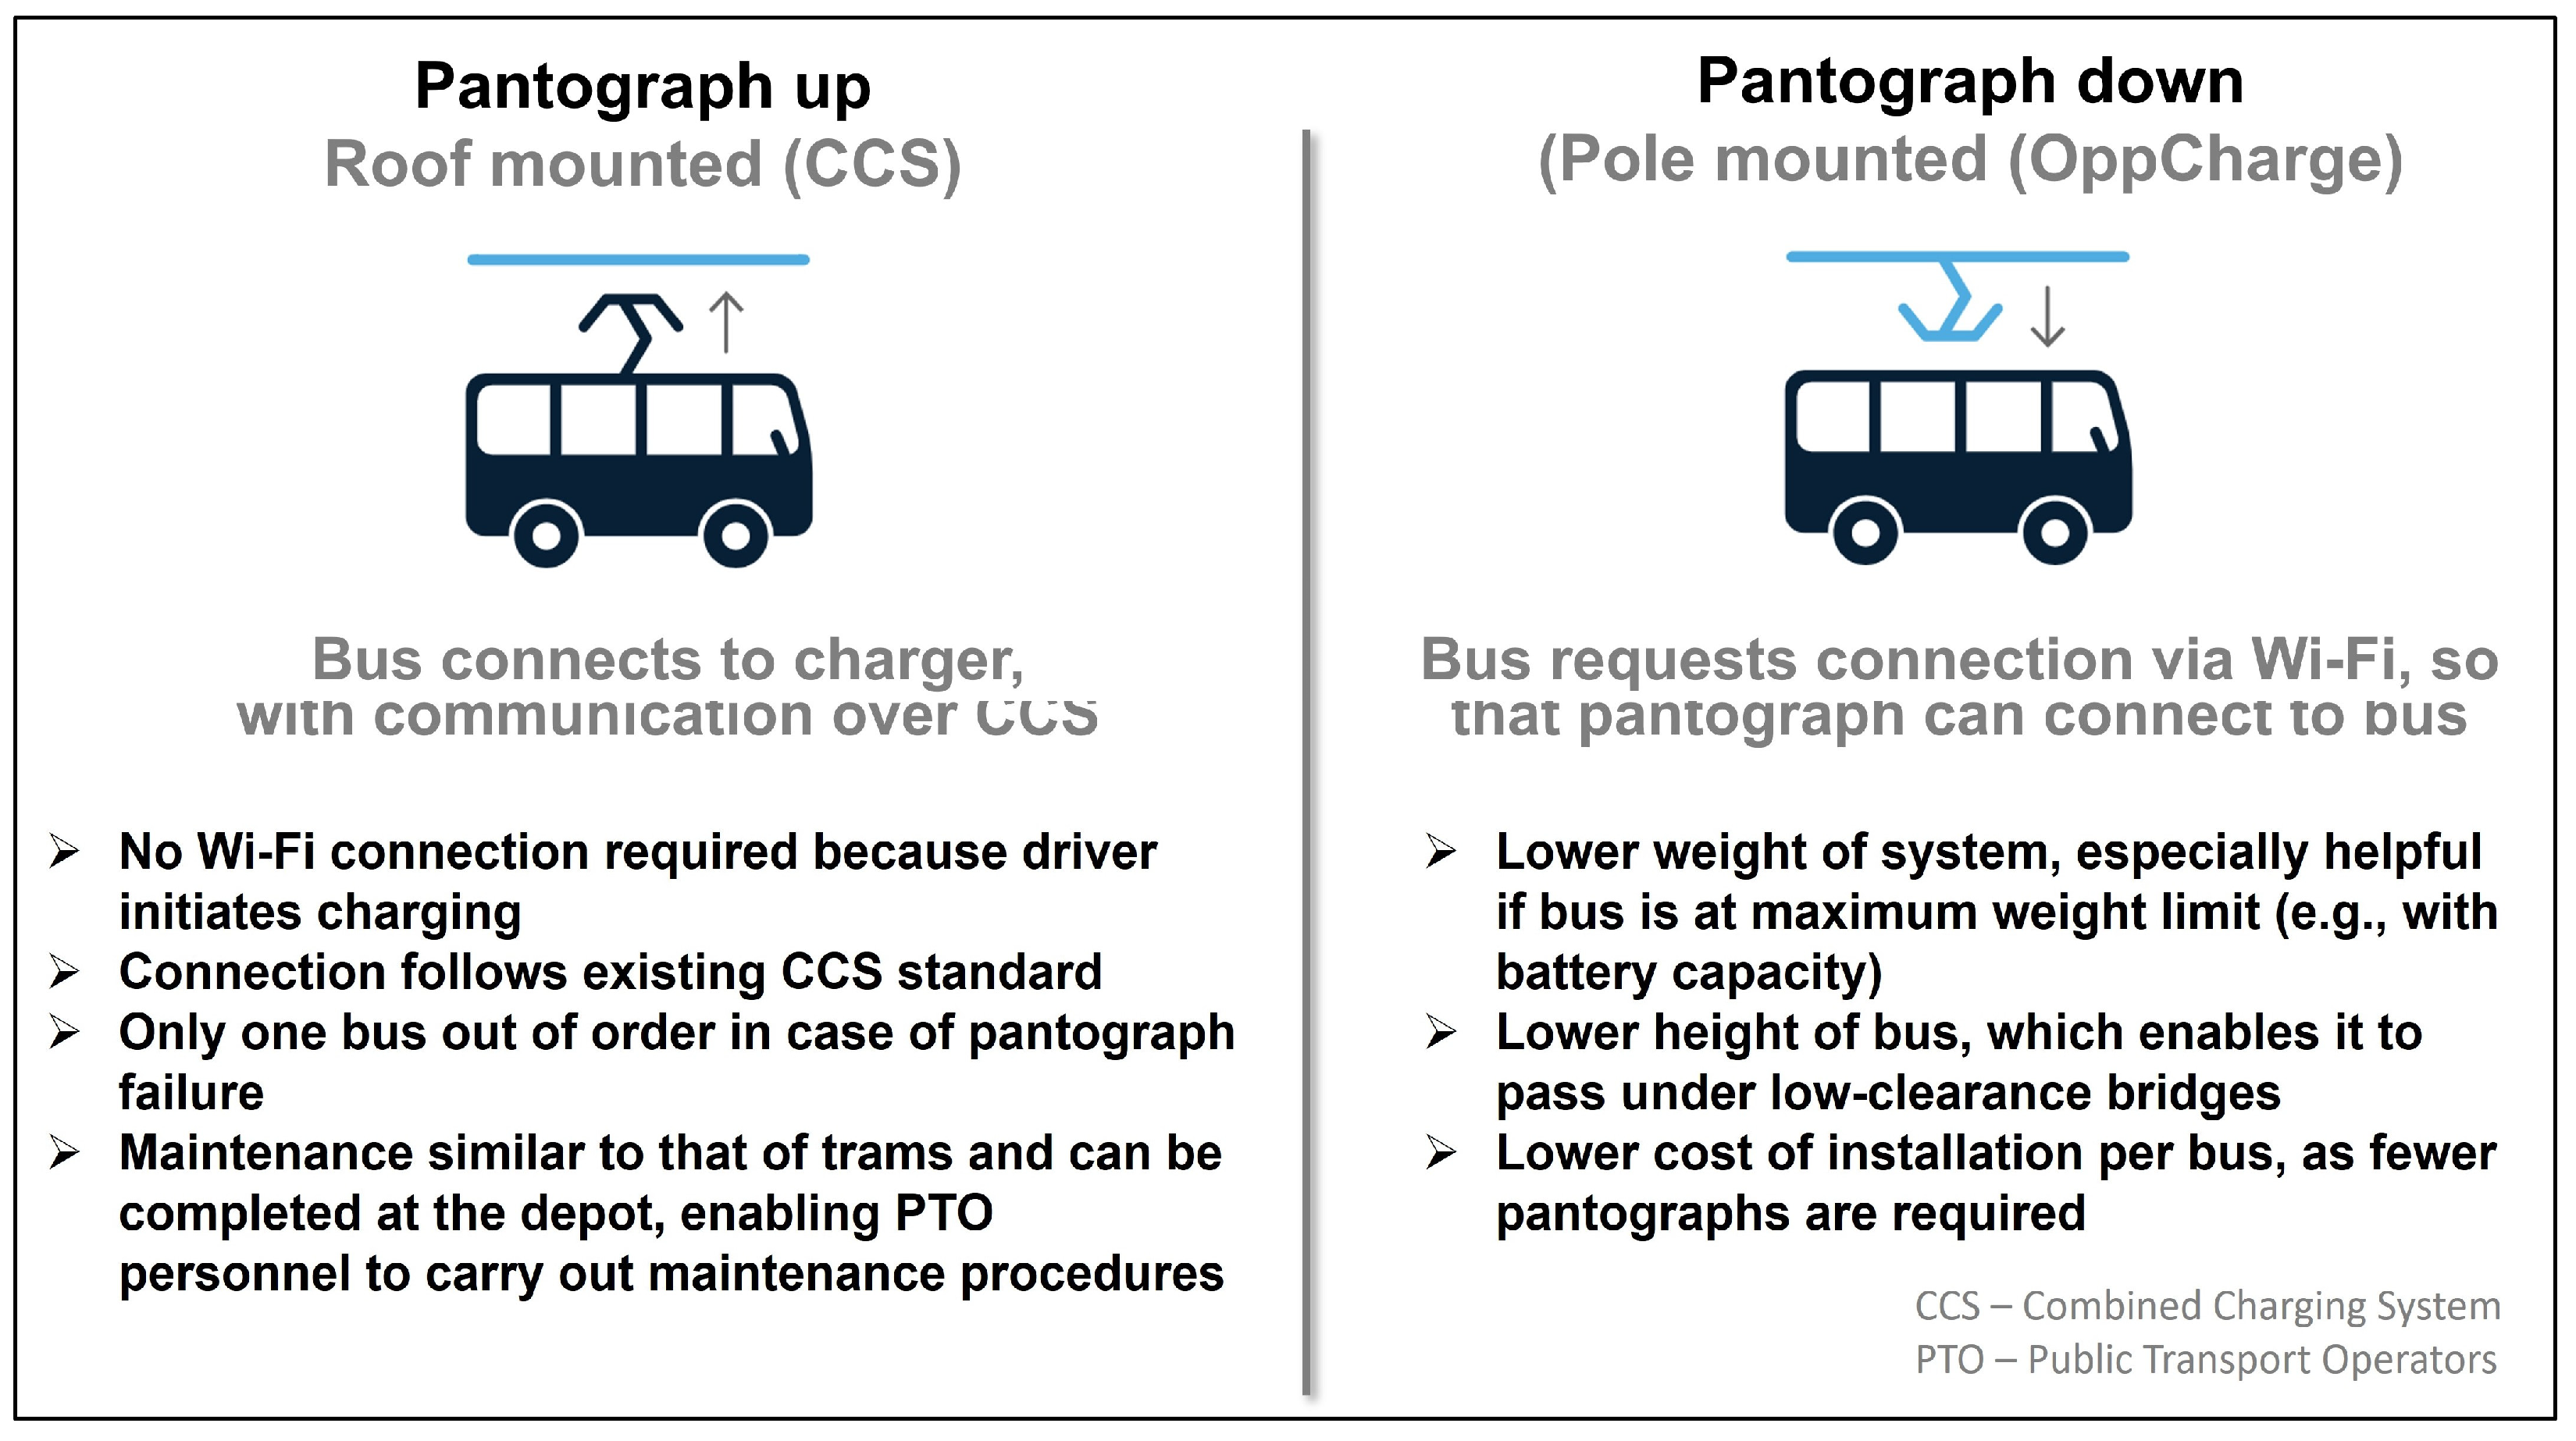
Pantograph charging achieves automated contact between the bus and the charging infrastructure [61]. These chargers come in two variants. The first variant involves roof-mounted ‘pantograph up’ style connections, where the driver activates a switch inside the bus to raise the pantograph, initiating charging. The second type is the pole-mounted ‘pantograph down’ configuration. These operate conversely, establishing a connection to overhead poles, typically through Wi-Fi, and remotely triggering the pantograph to lower. Figure 7 illustrates both configurations and outlines the respective advantages of each.
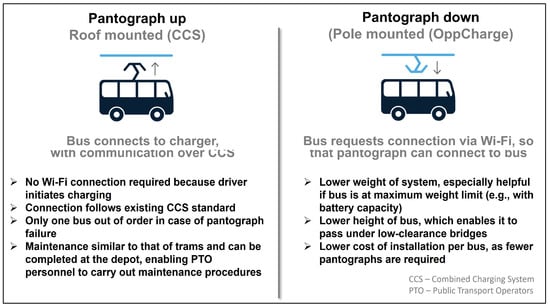
Figure 7.
Figure illustrating the benefits of each pantograph system. Adapted from [62].
The advantage of employing a pantograph-style charger lies in its automated process, allowing charging contacts to be connected with a simple button press or even in an automated fashion. This renders pantograph chargers suitable for on-route charging or large-scale depot charging. Additionally, overhead cables strategically installed along routes enable trolleybus-like operation, facilitating extended range without service interruption [63]. Pantograph charging also offers faster charge times than plug-in charging, owing to its capacity for higher power transfer [64].
As discussed earlier, the cost of installing this charger type can vary significantly due to different implementation methods. Depot pantograph chargers, for instance, may range between USD 67,000 and USD 160,000 per charger, exclusive of installation costs [65]. On-route charger expenses vary due to land and permission costs associated with public land installation, estimated as high as USD 571,420 per bus [63]. However, these chargers can service multiple buses throughout the day. The primary advantage of pantograph chargers lies in their ability to swiftly and autonomously provide rapid charging.
Ground-based chargers function similarly to pantograph chargers, where a ‘shoe’ extends from beneath a bus to establish contact with a conductive device embedded in the road, transferring power to the batteries [66]. These systems enable even faster charging rates, with power outputs reaching 200 kW. Additionally, the overall system is more compact and less intrusive to foot traffic, as it eliminates the need for overhead poles and masts, allowing most infrastructure components to be concealed underground or integrated within bus stops. Moreover, ground-based charging systems are safer than overhead pantograph systems, as the exposed charging pads are entirely covered during the charging process.
Although ground-based chargers represent emerging technology, and practical pricing data are not available, their cost is assumed to align with pantograph charging to remain competitive in pricing.
Each charging method optimally serves specific scenarios. For instance, plug-in chargers suit slower overnight depot charging, ensuring battery longevity. Overhead pantograph-style chargers are ideal for charging while the vehicle is in motion and suitable for routes with infrequent stops. Ground-based charging suits placements at each stop, allowing fast charging to extend the battery range until the next stop.
A study by the Department of Civil and Environmental Engineering at Utah State University [67] outlines a potential charging strategy using a mathematical model for an ideal bus route layout. This strategy proposes the placement of ‘Quasi-dynamic wireless chargers’ at bus stops and traffic lights.
City planners and bus operators must meticulously assess all charging options and strategize effectively for a transition to an electrified bus network, maximizing the advantages of these systems. By doing so, they can reduce costs and enhance services beyond the current offerings.
4. Emissions Analysis
The key advantage of employing an electric drivetrain is the complete elimination of tailpipe pollutants. The shift to EVs aims to reduce harmful emissions, particularly in urban areas. However, it is noteworthy that these vehicles still contribute to greenhouse gas emissions, given that a substantial portion of global electricity generation relies on processes that emit greenhouse gases [68]. The most effective approach to reducing emissions associated with driving EVs involves completely decarbonizing the electric grid system. Projections indicate that the National Grid in the UK aims to achieve ‘net zero’ emissions by 2050 [69]. Therefore, an electrified transport network will become an indisputable solution regarding usage emissions in the long term.
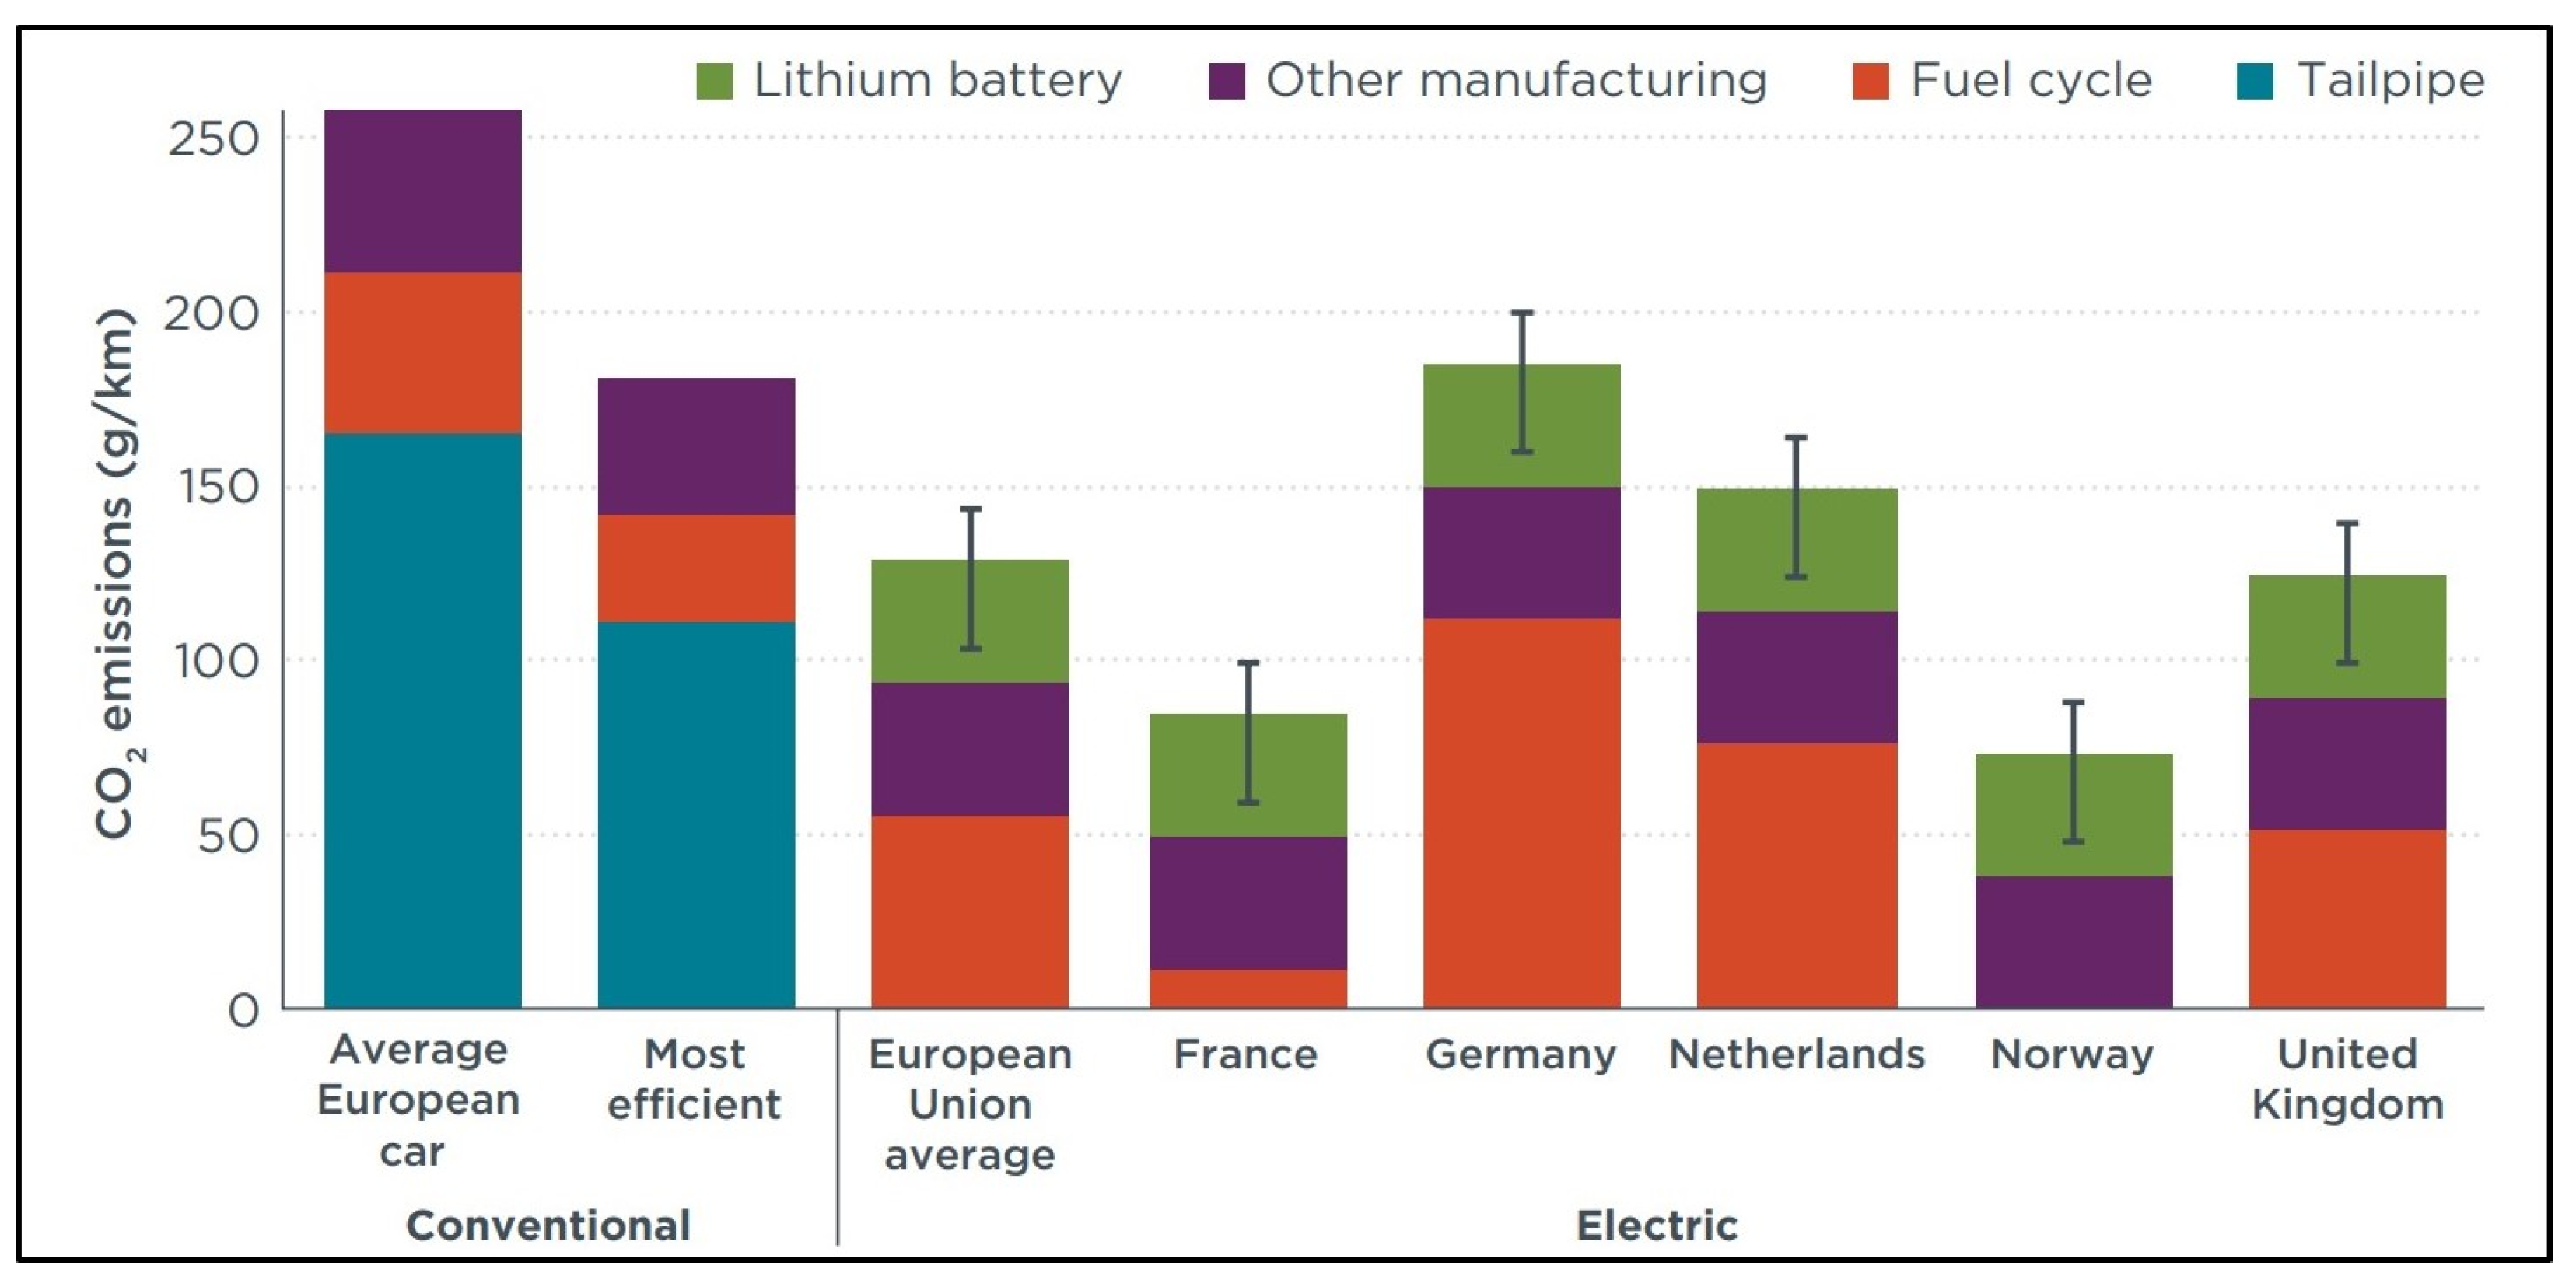
In the short term, an anticipated reduction in the carbon intensity of electricity by more than 30% by 2030 is expected [70]. This anticipated improvement allows for the emissions of an electrified transport network to decrease without requiring modifications to the vehicles themselves, making them an ideal and consistent option for bus operators. This concept is evident in Figure 8, illustrating that ‘fuel cycle’ emissions can significantly vary depending on the country’s electricity mix. Countries heavily reliant on nuclear power [71] and renewable energy [72] sources, like France or Norway, demonstrate minimal to no fuel cycle emissions [70]. By contrast, countries like Germany, which heavily utilize oil and gas in their electricity generation mix, showcase higher fuel cycle emissions [73].
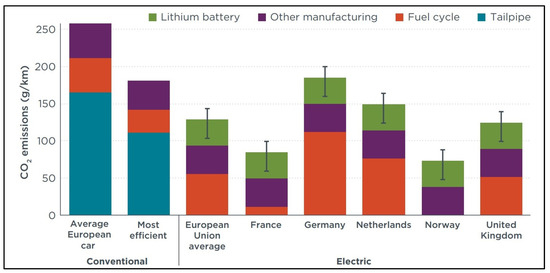
Figure 8.
Life-cycle impact of vehicle activities. Reproduced with permission from [70].
Figure 8 exemplifies how electric grid systems must be decarbonized to maximize the benefits of an electrified transport network, including a fully electrified bus fleet.
An area that demands scrutiny involves the emissions linked to battery production and end-of-life disposal. One significant factor impacting these emissions is the manufacturing location. Several factors influence the CO2 output, ranging from logistics transporting raw materials to implemented mining strategies. Specific reports indicate a potential increase of ‘up to 74% more CO2’ in factories powered by fossil fuels [74]. Consequently, governments must rigorously scrutinize manufacturers before granting import and operational licenses if governments aim to curtail carbon emissions.
An area where an electric driveline surpasses an ICE driveline is in efficiency. The electric motor boasts an efficiency range of around 70–90%, contingent on the load [75]. In comparison, an equivalent ICE motor operates at an efficiency of roughly 20–25% [76]. However, when considering overall efficiency, which factors in electricity production sources, the efficiency may decrease to 13–31% [77]. This number can rise to 40–70% if renewable sources are utilized.
Nevertheless, Figure 9 depicts significantly lower CO2 emissions from electric buses in the US, where the electricity mix resembles most Western nations. Immediate reductions in carbon emissions are feasible in cities such as Lahore and Delhi, which suffer from exceptional levels of air pollution [78]. This illustrates how the overall efficiency of an electric vehicle can outperform an equivalent fossil-fuel-powered vehicle.
According to a study by the University of Bangalore [79], each vehicle could save 25 tons of CO2 emissions annually, assuming a daily travel distance of 170 km. These emissions can be further reduced with the adoption of renewable energy sources. Eliminating tailpipe emissions also eradicates NOx emissions, a pollutant unique to internal combustion engines, particularly diesel engines, prevalent in most large vehicles today [80]. This reduction is vital in curbing the health risks associated with NOx, especially in urban areas where these emissions pose significant health hazards, especially for vulnerable groups like children and older adults.
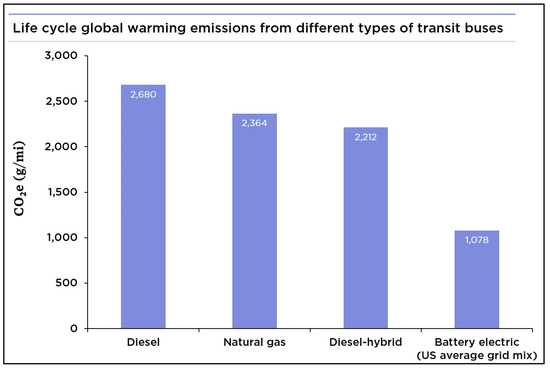
Figure 9.
CO2 emissions from buses. Reproduced with permission from [81].
Figure 9.
CO2 emissions from buses. Reproduced with permission from [81].

In emissions analysis of battery electric vehicles, a crucial yet often overlooked aspect is end-of-life battery recycling emissions [82]. As mentioned, assessing these emissions becomes critical since electric buses require a new battery pack every six years. The prevailing methods used for recycling electric vehicle batteries include pyrometallurgy and hydrometallurgy [83].
Pyrometallurgy involves subjecting the entire battery to extreme temperatures of up to 1000 °C, generating alloys, matte, and slag, which can then be processed into usable elements. This process is predominately used to recycle and extract Cu, Co, and Ni [69]. While this method offers high process efficiency, good compatibility for the Kroll process, and continuous operation [70], it fails to recover lithium effectively, the primary element in EV batteries, resulting in wastage. Moreover, with battery manufacturers reducing cobalt usage, this method is gradually becoming obsolete [69].
Hydrometallurgy, utilizing various solvents to extract pure substances, can be environmentally friendly with high efficiency [84]. However, its drawbacks include high cost, substantial chemical consumption, poor working environments, and time consumption, rendering large-scale recycling impractical [85].
Recycling batteries post-degradation is pivotal for sustainability and emission reduction [86]. Yet, current methods are financially and ecologically impractical, rendering them unviable options for reducing overall emissions [87].
5. Performance Analysis
The Cardiff Council presently operates a fleet of 36 Yutong TCe12 buses [88]. A direct ICE competitor to this model is the Mercedes Citario. A comparative analysis between these two vehicles reveals the following figures.
Referring to Table 2, we observe both vehicles’ power and torque specifications. While they exhibit similar power figures, the Yutong bus nearly doubles the torque of its counterpart. This higher torque allows for lower throttle settings, potentially increasing the range. Notably, there is substantial disparity in the maximum capacity between the two buses, with the diesel bus outperforming the electric bus by 50%.
Table 2.
Comparison of the two typical buses used in the UK [89,90].
5.1. Passenger Comfort
An advantage of an electric powertrain is its near-instantaneous torque delivery at any wheel speed. It eliminates the need for a gearbox and ensures continuous power application when the throttle is engaged. This results in a smoother experience for passengers, avoiding the jolts associated with gear changes, which can contribute to travel sickness and related symptoms [91].
Another benefit of an electric drivetrain is noise reduction. Electric buses produce minimal to no noise when stationary, maintaining ambient noise levels [92]. They operate around 5 dB to 7 dB in motion, quieter than their fossil-fuel-powered counterparts [93]. This is particularly advantageous in cities where noise pollution concerns local governments [94].
Passenger polls consistently show a preference for electric buses over diesel or biogas-powered buses across various categories, including emissions and noise [95]. An intriguing statistic from the survey is that most passengers would recommend trying an electric bus to others, which could significantly support government initiatives to encourage greater public transport use. Furthermore, most drivers preferred the drivability of electric buses, with some even considering them superior to other bus types [95]. Driver complaints primarily revolved around bus software and easily rectifiable issues. Rear visibility concerns were also raised, though these appear specific to certain models rather than inherent drivetrain issues.
5.2. Range
The average distance urban transport buses cover daily is approximately 130 miles [30], but this can extend to 240 miles on specific routes. Therefore, an equivalent electric bus must offer a similar range capacity.
In South Wales, the current fleet of electric buses comprises the Yutong TCe12. The company quotes an official range of 300–350 km [90], yet customer experience in real-world conditions suggests a range closer to 140 miles, providing a potential distance of 180 miles [96]. This discrepancy requires further investigation and testing of the bus’s Li-ion battery pack to validate these claims. It is evident that electric buses cannot cover all existing bus routes with current technology and require further enhancements to replace diesel buses entirely. Alternatively, as discussed earlier, substantial investment in charging infrastructure could enable bus operators to charge buses strategically at different intervals along their routes.
5.3. Alternative Battery Technologies
This paper primarily concentrates on Li-ion batteries, widely employed in the automotive industry. Despite this focus, various other battery materials have been developed and researched for potential use in electric vehicles, each possessing distinct characteristics that could be applied in an electric bus context.
Table 3 exhibits the distinct characteristics of several popular battery materials [97]. Lead acid batteries are known for their cost-effectiveness, simple manufacturing process, high overcharge tolerance, and discharge rates. However, they suffer from low energy density, limited deep discharge cycles, potential thermal runaway, and environmental damage due to their electrolyte media [98].
Table 3.
Comparison of different battery materials [97].
Nickel–cadmium (NiCd) batteries offer rapid charging, excellent low-temperature performance, and this group’s lowest cost per cycle. Yet, they face drawbacks, including relatively low energy density and the ‘memory effect’ issue [99].
Nickel–metal hydride (NiMH) is often seen as an alternative to NiCd, offering 30–40% higher capacity and the potential for increased energy densities. However, its drawback lies in the low number of deep cycles, which limits its automotive application [100].
Experimental materials like Na-NiCl2 batteries have shown superior theoretical performance compared to their Li-ion counterparts [101], reaching energy densities of up to 350 Wh/kg [102]. Nevertheless, safety concerns and potential battery degradation hinder their immediate implementation, necessitating further data for conclusive assessment.
However, due to their exceptional characteristics, Li-ion batteries have emerged as the optimal choice for electric buses. With high energy density ranging from 150–250 Wh/kg, they outperform lead acid, NiCd, and NiMH alternatives, providing more energy storage for extended travel ranges. Li-ion batteries exhibit low internal resistance, ensuring efficient energy conversion, and offer a longer cycle life of 500–1000 cycles, surpassing their counterparts. Nevertheless, these other emerging battery technologies showcase promising advancements, signaling possible alternatives to traditional Li-ion batteries.
5.4. Other Considerations
One advantage of maintaining a fossil-fuel-powered transport network is the government’s capacity to access stored oil reserves, particularly during wartime if necessary. This serves to bolster a nation’s transport system security when required.
However, should a complete transition from the current bus fleet to an all-electric battery fleet occur nationwide, substantial considerations concerning the power grid must be addressed. It will necessitate power regulation at the charger level and the integration of 3-phase fast charging connections into a high-voltage network. This demands collaboration with national grid organizations to facilitate seamless integration. Due to these infrastructural requirements, implementing electrification plans could pose significant challenges for local councils and governments.
6. Conclusions
6.1. Electric Bus Viability
The concept of an electric bus fleet is still in its early adoption phase, with a few local councils and private companies integrating them as an addition rather than a replacement to their existing fleets. A significant commitment from national governments is imperative for battery electric buses to become viable. This involves strategic investments of substantial public funds for infrastructure development and the transition process. Decisions need to be made regarding the type of infrastructure—whether it requires depot charging, on-route charging, or a combination of both. Investment in technology, both for infrastructure and buses, is crucial to drive innovation and widen the applicability of electric buses. Advancements in the field are necessary for mass adoption since a complete transition is not yet feasible with current technology.
Electric buses have the potential to curtail carbon emissions in major cities, even on a small scale, contributing to reducing the overall carbon footprint of a city’s transport network. This reduction can foster further technological advancements in the electric bus domain.
6.2. Recommendations for Future Research
This research could be enhanced in several ways, including long-term testing of newly developed battery materials to broaden the paper’s scope. Additionally, a comprehensive cost–benefit analysis of various charging infrastructures would provide more precise recommendations. Conducting an extensive, long-term study on the impact of rapid charging on the batteries used in the Yutong TCe12 would be instrumental for determining the real-world longevity of the drivetrain. Furthermore, this study did not analyze alternative fuels for internal combustion; therefore, a meta-analysis of alternative fossil fuels and their implications for the public transport system would be highly beneficial.
Author Contributions
Conceptualization, M.A.R. Original draft preparation, T.M. with the supervision of M.A.R. Validation, visualization, writing, review and editing S.B. and M.A.R. All authors have read and agreed to the published version of the manuscript.
Funding
This research received no external funding.
Conflicts of Interest
The authors declare no conflict of interest.
References
- Department of Transport. Transport and Environment Statistics 2021 Annual Report. Available online: https://assets.publishing.service.gov.uk/government/uploads/system/uploads/attachment_data/file/984685/transport-and-environment-statistics-2021.pdf (accessed on 31 December 2023).
- Clemente, J. Electrification to Fight Climate Change: The Challenge of a Lifetime. Available online: https://www.forbes.com/sites/judeclemente/2021/04/21/electrification-to-fight-climate-change-the-challenge-of-a-lifetime/ (accessed on 31 December 2023).
- Edwards, J. How Many EVs Are There in the UK-EV Market Statistics 2023-Zapmap. Available online: https://www.zap-map.com/ev-stats/ev-market (accessed on 31 December 2023).
- The Real Urban Emissions Initiative. Real-World Emissions from London Buses. Available online: https://theicct.org/sites/default/files/TRUE%20London%20Bus%20Fact%20Sheet%2020181218.pdf (accessed on 31 December 2023).
- Alberto Bernabeo, R. Health and Environmental Impacts of Nox: An Ultra-Low Level of Nox (Oxides of Nitrogen) Achievable with a New Technology. GJES 2019, 2, 1–6. [Google Scholar] [CrossRef]
- Department of Economic and Social Affairs. 68% of the World Population Projected to Live in Urban Areas by 2050, Says UN|UN DESA|United Nations Department of Economic and Social Affairs. Available online: https://www.un.org/development/desa/en/news/population/2018-revision-of-world-urbanization-prospects.html (accessed on 31 December 2023).
- Topham, G. How London Got Rid of Private Cars– and Grew More Congested than Ever. The Guardian, 11 February 2020. [Google Scholar]
- Ford, C. Why Buses Are More Sustainable Than Cars. Available online: https://www.amli.com/blog/why-buses-are-more-sustainable-than-cars (accessed on 31 December 2023).
- Houache, M.; Yim, C.-H.; Karkar, Z.; Abu-Lebdeh, Y. On the Current and Future Outlook of Battery Chemistries for Electric Vehicles—Mini Review. Batteries 2022, 8, 70. [Google Scholar] [CrossRef]
- Vishnumurthy, K.A.; Girish, K.H. A Comprehensive Review of Battery Technology for E-Mobility. J. Indian Chem. Soc. 2021, 98, 100173. [Google Scholar] [CrossRef]
- Coelho Barbosa, F. Battery Electric Bus Technology Review-Current Status and Perspectives. In Proceedings of the SAE BRASIL 2022 Congress, SAE Technical Paper. Sao Paolo, Brazil, 24–27 November 2022; 10 February 2022. [Google Scholar]
- Laizāns, A.; Graurs, I.; Rubenis, A.; Utehin, G. Economic Viability of Electric Public Busses: Regional Perspective. Procedia Eng. 2016, 134, 316–321. [Google Scholar] [CrossRef]
- Wood, J. Batteries Are a Key Part of the Energy Transition. Here’s Why. Available online: https://www.weforum.org/agenda/2021/09/batteries-lithium-ion-energy-storage-circular-economy/ (accessed on 31 December 2023).
- Schmidt-Rohr, K. How Batteries Store and Release Energy: Explaining Basic Electrochemistry. J. Chem. Educ. 2018, 95, 1801–1810. [Google Scholar] [CrossRef]
- Rangarajan, S.S.; Sunddararaj, S.P.; Sudhakar, A.; Shiva, C.K.; Subramaniam, U.; Collins, E.R.; Senjyu, T. Lithium-Ion Batteries—The Crux of Electric Vehicles with Opportunities and Challenges. Clean Technol. 2022, 4, 908–930. [Google Scholar] [CrossRef]
- Stephie, A. A Comprehensive Guide to Primary and Secondary Batteries. Res. Rev. J. Pure Appl. Phys. 2023, 11. [Google Scholar]
- Dell, R. Batteries Fifty Years of Materials Development. Solid State Ion. 2000, 134, 139–158. [Google Scholar] [CrossRef]
- Heubner, C.; Voigt, K.; Marcinkowski, P.; Reuber, S.; Nikolowski, K.; Schneider, M.; Partsch, M.; Michaelis, A. From Active Materials to Battery Cells: A Straightforward Tool to Determine Performance Metrics and Support Developments at an Application-Relevant Level. Adv. Energy Mater. 2021, 11, 2102647. [Google Scholar] [CrossRef]
- Bernhart, W. Battery Monitor 2022: Battery Materials. Available online: https://www.rolandberger.com/en/Insights/Publications/Battery-Monitor-2022-Battery-materials.html (accessed on 25 January 2024).
- Arumugam, B.; Mayakrishnan, G.; Subburayan Manickavasagam, S.K.; Kim, S.C.; Vanaraj, R. An Overview of Active Electrode Materials for the Efficient High-Performance Supercapacitor Application. Crystals 2023, 13, 1118. [Google Scholar] [CrossRef]
- Edge, J.S.; O’Kane, S.; Prosser, R.; Kirkaldy, N.D.; Patel, A.N.; Hales, A.; Ghosh, A.; Ai, W.; Chen, J.; Yang, J.; et al. Lithium Ion Battery Degradation: What You Need to Know. Phys. Chem. Chem. Phys. 2021, 23, 8200–8221. [Google Scholar] [CrossRef] [PubMed]
- Liu, Y.; Zhu, Y.; Cui, Y. Challenges and Opportunities towards Fast-Charging Battery Materials. Nat. Energy 2019, 4, 540–550. [Google Scholar] [CrossRef]
- Fichtner, M.; Edström, K.; Ayerbe, E.; Berecibar, M.; Bhowmik, A.; Castelli, I.E.; Clark, S.; Dominko, R.; Erakca, M.; Franco, A.A.; et al. Rechargeable Batteries of the Future—The State of the Art from a BATTERY 2030+ Perspective. Adv. Energy Mater. 2022, 12, 2102904. [Google Scholar] [CrossRef]
- Kader, Z.A.; Marshall, A.; Kennedy, J. A Review on Sustainable Recycling Technologies for Lithium-Ion Batteries. Emergent Mater. 2021, 4, 725–735. [Google Scholar] [CrossRef]
- Ziesche, R.F.; Heenan, T.M.M.; Kumari, P.; Williams, J.; Li, W.; Curd, M.E.; Burnett, T.L.; Robinson, I.; Brett, D.J.L.; Ehrhardt, M.J.; et al. Multi-Dimensional Characterization of Battery Materials. Adv. Energy Mater. 2023, 13, 2300103. [Google Scholar] [CrossRef]
- Liu, Q.; Wang, H.; Jiang, C.; Tang, Y. Multi-Ion Strategies towards Emerging Rechargeable Batteries with High Performance. Energy Storage Mater. 2019, 23, 566–586. [Google Scholar] [CrossRef]
- Guan, P.; Zhou, L.; Yu, Z.; Sun, Y.; Liu, Y.; Wu, F.; Jiang, Y.; Chu, D. Recent Progress of Surface Coating on Cathode Materials for High-Performance Lithium-Ion Batteries. J. Energy Chem. 2020, 43, 220–235. [Google Scholar] [CrossRef]
- Ghadbeigi, L.; Harada, J.K.; Lettiere, B.R.; Sparks, T.D. Performance and Resource Considerations of Li-Ion Battery Electrode Materials. Energy Environ. Sci. 2015, 8, 1640–1650. [Google Scholar] [CrossRef]
- Wei, Z.; He, Q.; Zhao, Y. Machine Learning for Battery Research. J. Power Sources 2022, 549, 232125. [Google Scholar] [CrossRef]
- Department of Transport. Bus Statistics Data Tables. Available online: https://www.gov.uk/government/statistical-data-sets/bus-statistics-data-tables (accessed on 31 December 2023).
- Bus Fleet Data & Audits. Available online: https://www.tfl.gov.uk/corporate/publications-and-reports/bus-fleet-data-and-audits (accessed on 31 December 2023).
- ISB6.7 Engine For Euro Truck & Bus. Available online: https://www.cummins.com/engines/isb67 (accessed on 31 December 2023).
- ISX15 SmartAdvantageTM Powertrain-HD Truck. Available online: https://www.cummins.com/engines/isx15-smartadvantagetm-powertrain-hd-truck (accessed on 31 December 2023).
- Frequently Asked Questions|Wrightbus|How Much Does a Double Decker Bus Cost UK? Available online: https://wrightbus.com/en-gb/faqs (accessed on 2 January 2024).
- Getting to the Heart of EVs: A Close-up Look at the Electric Drivetrain-Innovative Automation 2018. Available online: https://www.innovativeautomation.com/the-electric-vehicle-drivetrain/ (accessed on 31 December 2023).
- Jones, S. Yutong–Straight down the Line. Available online: https://www.busandcoachbuyer.com/yutong-straight-line/ (accessed on 2 January 2024).
- Fuel Prices|AHDB. Available online: https://ahdb.org.uk/fuel-prices (accessed on 2 January 2024).
- Roberts, G. Electric Vehicle Repair Costs Revealed versus ICE Equivalent. Available online: https://www.fleetnews.co.uk/news/latest-fleet-news/electric-fleet-news/2023/07/05/electric-vehicle-repair-costs-revealed-versus-ice-equivalent (accessed on 2 January 2024).
- Gooding, P. Consumer Price Inflation, UK-Office for National Statistics. Available online: https://www.ons.gov.uk/economy/inflationandpriceindices/bulletins/consumerpriceinflation/february2022 (accessed on 2 January 2024).
- Al-Mahadin, A.; Mustafa, M.Y. Utilizing Fuel Cell Technology for Dubai Roads and Transport Authority (RTA). In Proceedings of the 2018 Advances in Science and Engineering Technology International Conferences (ASET), Abu Dhabi, Dubai, 6 February–5 April 2018; pp. 1–6. [Google Scholar]
- Petrol Prices and Diesel Prices in the UK|Latest Fuel Data from the RAC|RAC Drive. Available online: https://www.rac.co.uk/drive/advice/fuel-watch/ (accessed on 2 January 2024).
- Van Asselt, H. Governing Fossil Fuel Production in the Age of Climate Disruption: Towards an International Law of ‘Leaving It in the Ground’. Earth Syst. Gov. 2021, 9, 100118. [Google Scholar] [CrossRef]
- Ofgem. Electricity Prices: Day Ahead Baseload Contracts-Monthly Average (GB). Available online: https://www.ofgem.gov.uk/energy-data-and-research/data-portal/wholesale-market-indicators (accessed on 2 January 2024).
- Yurday, E. Average Cost of Electricity per kWh in the UK (2024). Available online: https://www.nimblefins.co.uk/average-cost-electricity-kwh-uk (accessed on 2 January 2024).
- Proc, K.; Barnitt, R.; Hayes, R.R.; Ratcliff, M.; McCormick, R.L.; Ha, L.; Fang, H.L. 100,000-Mile Evaluation of Transit Buses Operated on Biodiesel Blends (B20). SAE Trans. 2006, 115, 524–537. [Google Scholar]
- Boyce, I.C. Comparison of Maintenance Cost of Medium and Heavy-Duty Alternative Fuel and Diesel Vehicles. Ph.D. Thesis, West Virginia University, Morgantown, WV, USA, 2022. [Google Scholar]
- Maccioni, F. Maintenance Program for Electric Vehicles Power Train by Reliability Centred Maintenance. 2012. Available online: https://core.ac.uk/download/pdf/14704402.pdf (accessed on 31 December 2023).
- Tomaszewska, A.; Chu, Z.; Feng, X.; O’Kane, S.; Liu, X.; Chen, J.; Ji, C.; Endler, E.; Li, R.; Liu, L.; et al. Lithium-Ion Battery Fast Charging: A Review. eTransportation 2019, 1, 100011. [Google Scholar] [CrossRef]
- Argue, C. EV Battery Health: What 6000 EV Batteries Tell Us. Available online: https://www.geotab.com/blog/ev-battery-health/ (accessed on 2 January 2024).
- Hanley, S. New Data Shows Heat & Fast-Charging Responsible for More Battery Degradation than Age or Mileage. Available online: https://cleantechnica.com/2019/12/16/new-data-shows-heat-fast-charging-responsible-for-more-battery-degradation-than-age-or-mileage/ (accessed on 2 January 2024).
- Simpson, R. Flat(s) Batteries. Available online: https://assets.markallengroup.com//article-images/226738/second%20life%20bus%20batteries.pdf (accessed on 31 December 2023).
- Li, P.; Jiang, M.; Zhang, Y.; Zhang, Y. Cooperative Optimization of Bus Service and Charging Schedules for a Fast-Charging Battery Electric Bus Network. IEEE Trans. Intell. Transport. Syst. 2023, 24, 5362–5375. [Google Scholar] [CrossRef]
- Mauler, L.; Duffner, F.; Zeier, W.G.; Leker, J. Battery Cost Forecasting: A Review of Methods and Results with an Outlook to 2050. Energy Environ. Sci. 2021, 14, 4712–4739. [Google Scholar] [CrossRef]
- Jin, H. Ukraine Invasion Sets Back Musk’s Dream for Cheaper EVs, for Now. Reuters. 2022. Available online: https://www.reuters.com (accessed on 31 December 2023).
- Edelstein, S. Analysts: Raw Material Price Surge Will Put EV Battery Affordability Gains on Hold until 2024. Available online: https://www.greencarreports.com/news/1135251_raw-material-price-surge-ev-battery-affordability-gains-on-hold-until-2024 (accessed on 2 January 2024).
- Speirs, J.; Contestabile, M.; Houari, Y.; Gross, R. The Future of Lithium Availability for Electric Vehicle Batteries. Renew. Sustain. Energy Rev. 2014, 35, 183–193. [Google Scholar] [CrossRef]
- Das, S.; Ray, A. Planning of Charging Infrastructure for Urban Public Electric Bus Fleets in India. In ISUW 2019; Pillai, R.K., Dixit, A., Dhapre, S., Eds.; Lecture Notes in Electrical Engineering; Springer: Singapore, 2022; Volume 764, pp. 217–234. ISBN 9789811612985. [Google Scholar]
- Mastoi, M.S.; Zhuang, S.; Munir, H.M.; Haris, M.; Hassan, M.; Usman, M.; Bukhari, S.S.H.; Ro, J.-S. An In-Depth Analysis of Electric Vehicle Charging Station Infrastructure, Policy Implications, and Future Trends. Energy Rep. 2022, 8, 11504–11529. [Google Scholar] [CrossRef]
- Sheng, Z. Charging towards Electric Bus and Charger Interoperability. Available online: https://cordis.europa.eu/article/id/406951-charging-towards-electric-bus-and-charger-interoperability (accessed on 2 January 2024).
- Johnson, C.; Nobler, E.; Eudy, L.; Jeffers, M. Financial Analysis of Battery Electric Transit Buses; National Renewable Energy Laboratory: Golden, CO, USA, 2020.
- Arnout de, P.; Engel, H.; Guldemond, M.; Keizer, A.; van de Staaij, J. The European Electric Bus Market Is Charging ahead, but How Will It Develop?|McKinsey. Available online: https://www.mckinsey.com/industries/oil-and-gas/our-insights/the-european-electric-bus-market-is-charging-ahead-but-how-will-it-develop (accessed on 2 January 2024).
- Verbrugge, B.; Hasan, M.M.; Rasool, H.; Geury, T.; El Baghdadi, M.; Hegazy, O. Smart Integration of Electric Buses in Cities: A Technological Review. Sustainability 2021, 13, 12189. [Google Scholar] [CrossRef]
- Wright, M. Bus Electrification: A Comparison of Capital Costs. Urban Transport Magazine. 2021. Available online: https://www.urban-transport-magazine.com/en/bus-electrification-a-comparison-of-capital-costs (accessed on 31 December 2023).
- ABB. Pantograph Bus|Pantograph Up. Available online: https://new.abb.com/ev-charging/pantograph-up (accessed on 2 January 2024).
- 300 kw 600 kw 500 A Fast Charging Station China Pantograph System Manufacturer. Available online: https://hiconics-zn.en.made-in-china.com/product/xsKngNDYXjkR/China-300kw600kw-500A-Fast-Charging-Station-China-Pantograph-System-Manufacturer.html (accessed on 2 January 2024).
- Alstom. SRS: Innovative, Safe and Automatic Charging for Trams and Electric Buses. Available online: https://www.alstom.com/solutions/infrastructure/srs-innovative-safe-and-automatic-charging-trams-and-electric-buses (accessed on 2 January 2024).
- He, Y.; Song, Z.; Liu, Z. Fast-Charging Station Deployment for Battery Electric Bus Systems Considering Electricity Demand Charges. Sustain. Cities Soc. 2019, 48, 101530. [Google Scholar] [CrossRef]
- Ritchie, H.; Rosado, P.; Roser, M. Electricity Mix. Our World Data. 2023. Available online: https://ourworldindata.org/electricity-mix (accessed on 31 December 2023).
- Pettigrew, J. National Grid’s Net Zero Commitment|National Grid Group. Available online: https://www.nationalgrid.com/stories/journey-to-net-zero/national-grids-net-zero-commitment (accessed on 2 January 2024).
- Hall, D.; Lutsey, N. Effects of Battery Manufacturing on Electric Vehicle Life-Cycle Greenhouse Gas Emissions. Available online: https://theicct.org/sites/default/files/publications/EV-life-cycle-GHG_ICCT-Briefing_09022018_vF.pdf (accessed on 31 December 2023).
- Rte-France. Tracking and Understanding Power Generation in France. Available online: http://www.rte-france.com/en/eco2mix/power-generation-energy-source (accessed on 2 January 2024).
- IEA. Norway-Countries & Regions. Available online: https://www.iea.org/countries/norway (accessed on 2 January 2024).
- IEA. Germany-Countries & Regions. Available online: https://www.iea.org/countries/germany (accessed on 2 January 2024).
- Dawid, I. The Most Carbon-Intensive Component of Electric Vehicles Deserves Attention|Planetizen News. Available online: https://www.planetizen.com/news/2018/10/101218-most-carbon-intensive-component-electric-vehicles-deserves-attention (accessed on 2 January 2024).
- O’Dea, J. Electric vs. Diesel vs. Natural Gas: Which Bus Is Best for the Climate? Available online: https://blog.ucsusa.org/jimmy-odea/electric-vs-diesel-vs-natural-gas-which-bus-is-best-for-the-climate/ (accessed on 2 January 2024).
- U.S. Department of Energy. Determining Electric Motor Load and Efficiency. Available online: https://www.energy.gov/sites/prod/files/2014/04/f15/10097517.pdf (accessed on 31 December 2023).
- Leach, F.; Kalghatgi, G.; Stone, R.; Miles, P. The Scope for Improving the Efficiency and Environmental Impact of Internal Combustion Engines. Transp. Eng. 2020, 1, 100005. [Google Scholar] [CrossRef]
- Albatayneh, A.; Assaf, M.N.; Alterman, D.; Jaradat, M. Comparison of the Overall Energy Efficiency for Internal Combustion Engine Vehicles and Electric Vehicles. Environ. Clim. Technol. 2020, 24, 669–680. [Google Scholar] [CrossRef]
- World Air Quality Index (AQI) Ranking|IQAir. Available online: https://www.iqair.com/world-air-quality-ranking (accessed on 3 January 2024).
- Adheesh, S.R.; Vasisht, M.S.; Ramasesha, S.K. Air-Pollution and Economics: Diesel Bus versus Electric Bus. Curr. Sci. 2016, 110, 858–862. [Google Scholar]
- Bindra, M.; Vashist, D. Particulate Matter and NOx Reduction Techniques for Internal Combustion Engine: A Review. J. Inst. Eng. India Ser. C 2020, 101, 1073–1082. [Google Scholar] [CrossRef]
- Zhang, H.; Xue, B.; Li, S.; Yu, Y.; Li, X.; Chang, Z.; Wu, H.; Hu, Y.; Huang, K.; Liu, L.; et al. Life Cycle Environmental Impact Assessment for Battery-Powered Electric Vehicles at the Global and Regional Levels. Sci. Rep. 2023, 13, 7952. [Google Scholar] [CrossRef] [PubMed]
- Zhou, L.-F.; Yang, D.; Du, T.; Gong, H.; Luo, W.-B. The Current Process for the Recycling of Spent Lithium Ion Batteries. Front. Chem. 2020, 8, 578044. [Google Scholar] [CrossRef] [PubMed]
- Le, M.N.; Lee, M.S. A Review on Hydrometallurgical Processes for the Recovery of Valuable Metals from Spent Catalysts and Life Cycle Analysis Perspective. Miner. Process. Extr. Metall. Rev. 2021, 42, 335–354. [Google Scholar] [CrossRef]
- Asadi Dalini, E.; Karimi, G.; Zandevakili, S.; Goodarzi, M. A Review on Environmental, Economic and Hydrometallurgical Processes of Recycling Spent Lithium-Ion Batteries. Miner. Process. Extr. Metall. Rev. 2021, 42, 451–472. [Google Scholar] [CrossRef]
- Muller, P.; Duboc, R.; Malefant, E. Recycling Electric Vehicle Batteries: Ecological Transformation and Preserving Resources. Field Actions Sci. Rep. J. Field Actions 2021, 74–81. [Google Scholar]
- Yang, Z.; Huang, H.; Lin, F. Sustainable Electric Vehicle Batteries for a Sustainable World: Perspectives on Battery Cathodes, Environment, Supply Chain, Manufacturing, Life Cycle, and Policy. Adv. Energy Mater. 2022, 12, 2200383. [Google Scholar] [CrossRef]
- Cardiff Is Going Electric|Cardiff Bus. Available online: https://www.cardiffbus.com/cardiff-going-electric (accessed on 3 January 2024).
- Atego: Engine Performance Data-Mercedes-Benz Trucks-Trucks You Can Trust. Available online: https://www.mercedes-benz-trucks.com/en_GB/models/atego-construction/technical-data/engine-data.html (accessed on 3 January 2024).
- Model E12–Yutong Eurobus Scandinavian, AB. Available online: https://yutongeurobus.se/products/model-e12-2/ (accessed on 31 December 2023).
- NHS. Motion Sickness. Available online: https://www.nhs.uk/conditions/motion-sickness/ (accessed on 3 January 2024).
- Borén, S. Electric Buses’ Sustainability Effects, Noise, Energy Use, and Costs. Int. J. Sustain. Transp. 2020, 14, 956–971. [Google Scholar] [CrossRef]
- Laib, F.; Braun, A.; Rid, W. Modelling Noise Reductions Using Electric Buses in Urban Traffic. A Case Study from Stuttgart, Germany. Transp. Res. Procedia 2019, 37, 377–384. [Google Scholar] [CrossRef]
- UNEP. The World’s Cities Must Take on the Cacophony of Noise Pollution. Available online: http://www.unep.org/news-and-stories/opinion/worlds-cities-must-take-cacophony-noise-pollution (accessed on 3 January 2024).
- Borén, S.; Nurhadi, L.; Ny, H. Preferences of Electric Buses in Public Transport; Conclusions from Real Life Testing in Eight Swedish Municipalities. World Acad. Sci. Eng. Technol. Int. J. Environ. Chem. Ecol. Geol. Geophys. Eng. 2016, 10, 312–321. [Google Scholar]
- E12 Electric Bus-Yutong Electric Buses and Coaches. Pelican Yutong. Available online: https://pelicanyutong.co.uk/buses/e12-electric-bus/ (accessed on 31 December 2023).
- What’s the Best Battery? Available online: https://batteryuniversity.com/article/whats-the-best-battery (accessed on 3 January 2024).
- Vangapally, N.; Penki, T.R.; Elias, Y.; Muduli, S.; Maddukuri, S.; Luski, S.; Aurbach, D.; Martha, S.K. Lead-Acid Batteries and Lead–Carbon Hybrid Systems: A Review. J. Power Sources 2023, 579, 233312. [Google Scholar] [CrossRef]
- Jeyaseelan, C.; Jain, A.; Khurana, P.; Kumar, D.; Thatai, S. Ni-Cd Batteries. In Rechargeable Batteries; Boddula, R., Inamuddin, P.R., Asiri, A.M., Eds.; Wiley: Hoboken, NJ, USA, 2020; pp. 177–194. ISBN 978-1-119-66119-1. [Google Scholar]
- Nickel Metal Hydride Batteries; Young, K., Ed.; MDPI-Multidisciplinary Digital Publishing Institute: Basel, Switzerland, 2016; ISBN 978-3-03842-302-7. [Google Scholar]
- Iclodean, C.; Varga, B.; Burnete, N.; Cimerdean, D.; Jurchiş, B. Comparison of Different Battery Types for Electric Vehicles. IOP Conf. Ser. Mater. Sci. Eng. 2017, 252, 012058. [Google Scholar] [CrossRef]
- Jung, K.; Chang, H.-J.; Bonnett, J.F.; Canfield, N.L.; Sprenkle, V.L.; Li, G. An Advanced Na-NiCl2 Battery Using Bi-Layer (Dense/Micro-Porous) Β″-Alumina Solid-State Electrolytes. J. Power Sources 2018, 396, 297–303. [Google Scholar] [CrossRef]


Disclaimer/Publisher’s Note: The statements, opinions and data contained in all publications are solely those of the individual author(s) and contributor(s) and not of MDPI and/or the editor(s). MDPI and/or the editor(s) disclaim responsibility for any injury to people or property resulting from any ideas, methods, instructions or products referred to in the content. |
© 2024 by the authors. Licensee MDPI, Basel, Switzerland. This article is an open access article distributed under the terms and conditions of the Creative Commons Attribution (CC BY) license (https://creativecommons.org/licenses/by/4.0/).