Review

Environmental Assessment of Lithium-Ion Battery Lifecycle and of Their Use in Commercial Vehicles

by
Livia Nastasi
and
Silvia Fiore
*
DIATI, Department of Engineering for Environment, Land and Infrastructure, Politecnico di Torino, Corso Duca Degli Abruzzi 24, 10129 Turin, Italy
*
Author to whom correspondence should be addressed.
Batteries 2024, 10(3), 90; https://doi.org/10.3390/batteries10030090
Submission received: 28 November 2023 / Revised: 31 January 2024 / Accepted: 1 February 2024 / Published: 4 March 2024

Abstract

:
This review analyzed the literature data about the global warming potential (GWP) of the lithium-ion battery (LIB) lifecycle, e.g., raw material mining, production, use, and end of life. The literature data were associated with three macro-areas—Asia, Europe, and the USA—considering common LIBs (nickel manganese cobalt (NMC) and lithium iron phosphate (LFP)). The GWP (kgCO2eq/kg) values were higher for use compared to raw material mining, production, and end of life management for hydrometallurgy or pyrometallurgy. Considering the significant values associated with the use phase and the frequent application of secondary data, this study also calculated the GWP of LIBs applied in public urban buses in Turin, Italy. The 2021 fleet (53% diesel, 36% natural gas, and 11% electric buses) was compared to scenarios with increasing shares of hybrid/electric. The largest reduction in CO2eq emissions (−41%) corresponded to a fleet with 64% electric buses. In conclusion, this review highlighted the bottlenecks of the existing literature on the GWP of the LIB lifecycle, a lack of data for specific macro-areas for production and use, and the key role of public transportation in decarbonizing urban areas.

Graphical Abstract

1. Introduction

The European Green Deal committed to making Europe the first carbon-neutral continent by 2050 [1]. Climate change is one of the most serious global challenges; however, it can be considered an opportunity to shift towards a clean, sustainable, low-carbon, resource-efficient, and competitive economy. In 2018, the transport sector globally contributed to 24% of the direct CO2 emissions associated to fuel combustion [2], corresponding to 8.2 Gt of CO2; three-quarters of these were caused by road transport, including cars, trucks, buses, and motorcycles. The electrification of vehicles can be considered one of the keys to reaching the decarbonization target set for the 27 member states of the European Union (EU). In 2020, electric vehicles in Europe totalled 10 million cars and vans, 0.6 million buses, and 31,000 trucks, whereas the forecast for 2030 involves millions of electric vehicles (220 million cars/vans, 5.5 million buses, and 3.9 million trucks) [3]. China is the global leader of the LIB supply chain, and Europe is strongly dependent on extra-EU countries for the import of battery cells and raw materials [4]. This is critical, as the European demand for LIBs used in electric vehicles will be 400 GWh in 2028 [4]. The European Battery Alliance was established to make Europe a global leader in sustainable batteries [4], covering the whole value chain, including the secure supply of primary raw materials, improved market of secondary raw materials, and battery production and end of life (EoL) management, with the lowest carbon footprint possible.
Nowadays, LIBs are largely used in hybrid/electric vehicles and portable electronic devices, due to excellent characteristics such as high specific density, absence of memory effect, low self-discharge, and long lifetime [5]. The environmental impacts of the LIB lifecycle have been deeply discussed within the scientific community, mainly through Life Cycle Assessment (LCA) studies [6,7,8]. The literature mostly investigated batteries, including graphite anodes [9,10] combined with cathodes made of lithium nickel cobalt manganese oxide (NMC), lithium iron phosphate (LFP), lithium nickel cobalt aluminum oxide (NCA), lithium manganese oxide (LMO), and lithium cobalt oxide (LCO) [11]. The adopted functional unit (FU) was, alternatively, “battery pack”, “1 kg of battery”, “1 kWh of battery energy capacity”, “1 kg of battery cell”, “1 kWh of battery cell”, and “1 km driving distance” [5]. The boundary conditions describing the explored phases of the lifecycle were [5,12,13] cradle to gate (including raw material extraction and battery and component manufacturing); cradle to gate including use; use; cradle to grave (from raw material extraction to battery and component manufacturing and EoL management); cradle to grave excluding use; and end of life (recycling and/or disposal). Overall, battery production is the most studied lifecycle phase [5,7,8], including cell and battery component manufacturing and pack assembly. Fewer LCA studies specifically explored LIB use and EoL management [8,14].
The results provided by the state-of-the-art literature related to LCA studies on the LIB lifecycle are controversial [15], and comparison is rarely possible. Even considering the same chemistries for anodes and cathodes, the literature results are significantly variable because they are based on different key assumptions, as follows. The studies considering the use phase strictly depend on battery specifications, the vehicle’s electricity consumption, and battery charging efficiency [16]. Only a few LCA studies explored the use phase of LIBs used in vehicles [13]. Regarding EoL management, pyrometallurgy, hydrometallurgy, or combined pyrometallurgy and hydrometallurgy are the technologies applied at the industrial scale for LIB recycling [12,17]. Some LCA studies accounted for the emissions related to a specific recycling process [18,19,20], while others compared different scenarios and present results as % variations [14,21]. Obviously, the results of existing LCA studies are affected by the energy mix adopted for the associated geographical context. The literature on the topic mostly referred to Asia (China, Japan, and the Republic of Korea) [22,23,24,25]; fewer studies referred to Europe and the USA [26,27], and just few authors considered Australia and South America [11]. The applied impact assessment method is also a crucial issue; most of the literature applied ReCiPe, CML-IA, eco-indicator 99 LCA impact methodologies, and the GREET lifecycle model [6]. The provided LCA results included numerous impact categories (e.g., climate change, ozone depletion, human toxicity); other studies considered only the climate change impact category, expressed by the global warming potential (GWP) indicator, to estimate the greenhouse gas (GHG) emissions [27,28,29,30]. In addition, the LCA results are highly influenced by the data source; the availability of primary data (provided by battery manufacturers, recycling companies, etc.) is limited, and secondary data, i.e., derived from other studies, technical reports, and databases, are commonly employed [6]. Among the most cited literature studies for the LCA data inventory, four studies should be mentioned [31].
In this framework, a consistent critical analysis of the LCA studies applied to the LIB lifecyle is not yet possible. Compared to the existing literature, this review has the following two objectives and elements of novelty: 1. investigating the influence of geographical context on the LCA of the whole LIB lifecycle, considering that the LIB use phase is scarcely analyzed by the existing literature and that the few studies available are related to passenger vehicles; 2. exploring the environmental impacts of the use phase of LIBs used in public urban buses, considering Turin (Italy) as the case study. To address these objectives, the first part of this review study has been dedicated to the selection and inventory of up-to-date literature on the LCA of the LIB lifecycle, with a specific interest in three different geographical contexts, e.g., Asia, Europe, and the USA. The general goal was to identify the main inconsistencies and key findings of the existing literature on the topic, to better interpret the available results and to identify crucial issues and bottlenecks to provide guidance for future research on the topic and promote its progress. The second part of this review was aimed at a quantitative assessment of the use phase of LIBs used in commercial vehicles adopted for urban public transport (i.e., buses). Indeed, electric vehicles (EVs) are often defined as “green vehicles”and “zero-emission vehicles” because they are powered by electricity and do not directly emit pollutants during their use. However, the emissions associated with the EV use phase are related to battery charging and thus the energy mix of the country in which the EVs are used. This review study calculated the environmental impacts of the use phase of LIBs used in commercial vehicles adopted for public transportation, specifically the urban bus fleet of Turin, Italy, in 2021. This choice was driven by the lack of studies reporting the environmental impacts of LIBs used in such a context, as the existing literature considers the battery alone or its application in passenger vehicles, overlooking larger commercial vehicles used for public transportation. The emissions assessment was based on Turin and the Italian energy mix; therefore, its results can be considered reliable only for this specific city and do not purport to provide a benchmark for Italy.
The city of Turin is located in northwestern Italy and it has about 850,000 inhabitants [32]. Based on the data on air quality in Italy [33], Turin was the most polluted city in Italy in 2020, with PM10 values exceeding the limit of 50 μg/m3 for 98 days instead of the 35 imposed by national law (Legislative Decree 155/2010), and an average yearly value 1.2 times higher than the limit of 35 μg/m3 recommended by the World Health Organization [33]. To improve the air quality, the mayor of Turin sets limits for the circulation of vehicles depending on their emission profiles [34]; from September 15 to April 15, passenger and commercial vehicles cannot circulate if Diesel Euro 4 or lower, while vehicles Euro 2 or lower cannot be used all year long.

2. Methodology

2.1. Literature Review of LCA Studies on LIB Lifecycle

The literature review was based on three consequent phases:
(i)
Survey of Scopus and Science Direct databases to pre-screen the review studies and research papers published in English from 2011 to 2023. The keywords “Lithium-ion” (or Li-ion), “battery” (or batteries), “LCA”, “environmental assessment”, and “recycling” have been used in various combinations. Only the references related to cells involving NMC and LFP cathodes and graphite anodes have been selected, as they are the most common in LIBs used in electric vehicles [16].
(ii)
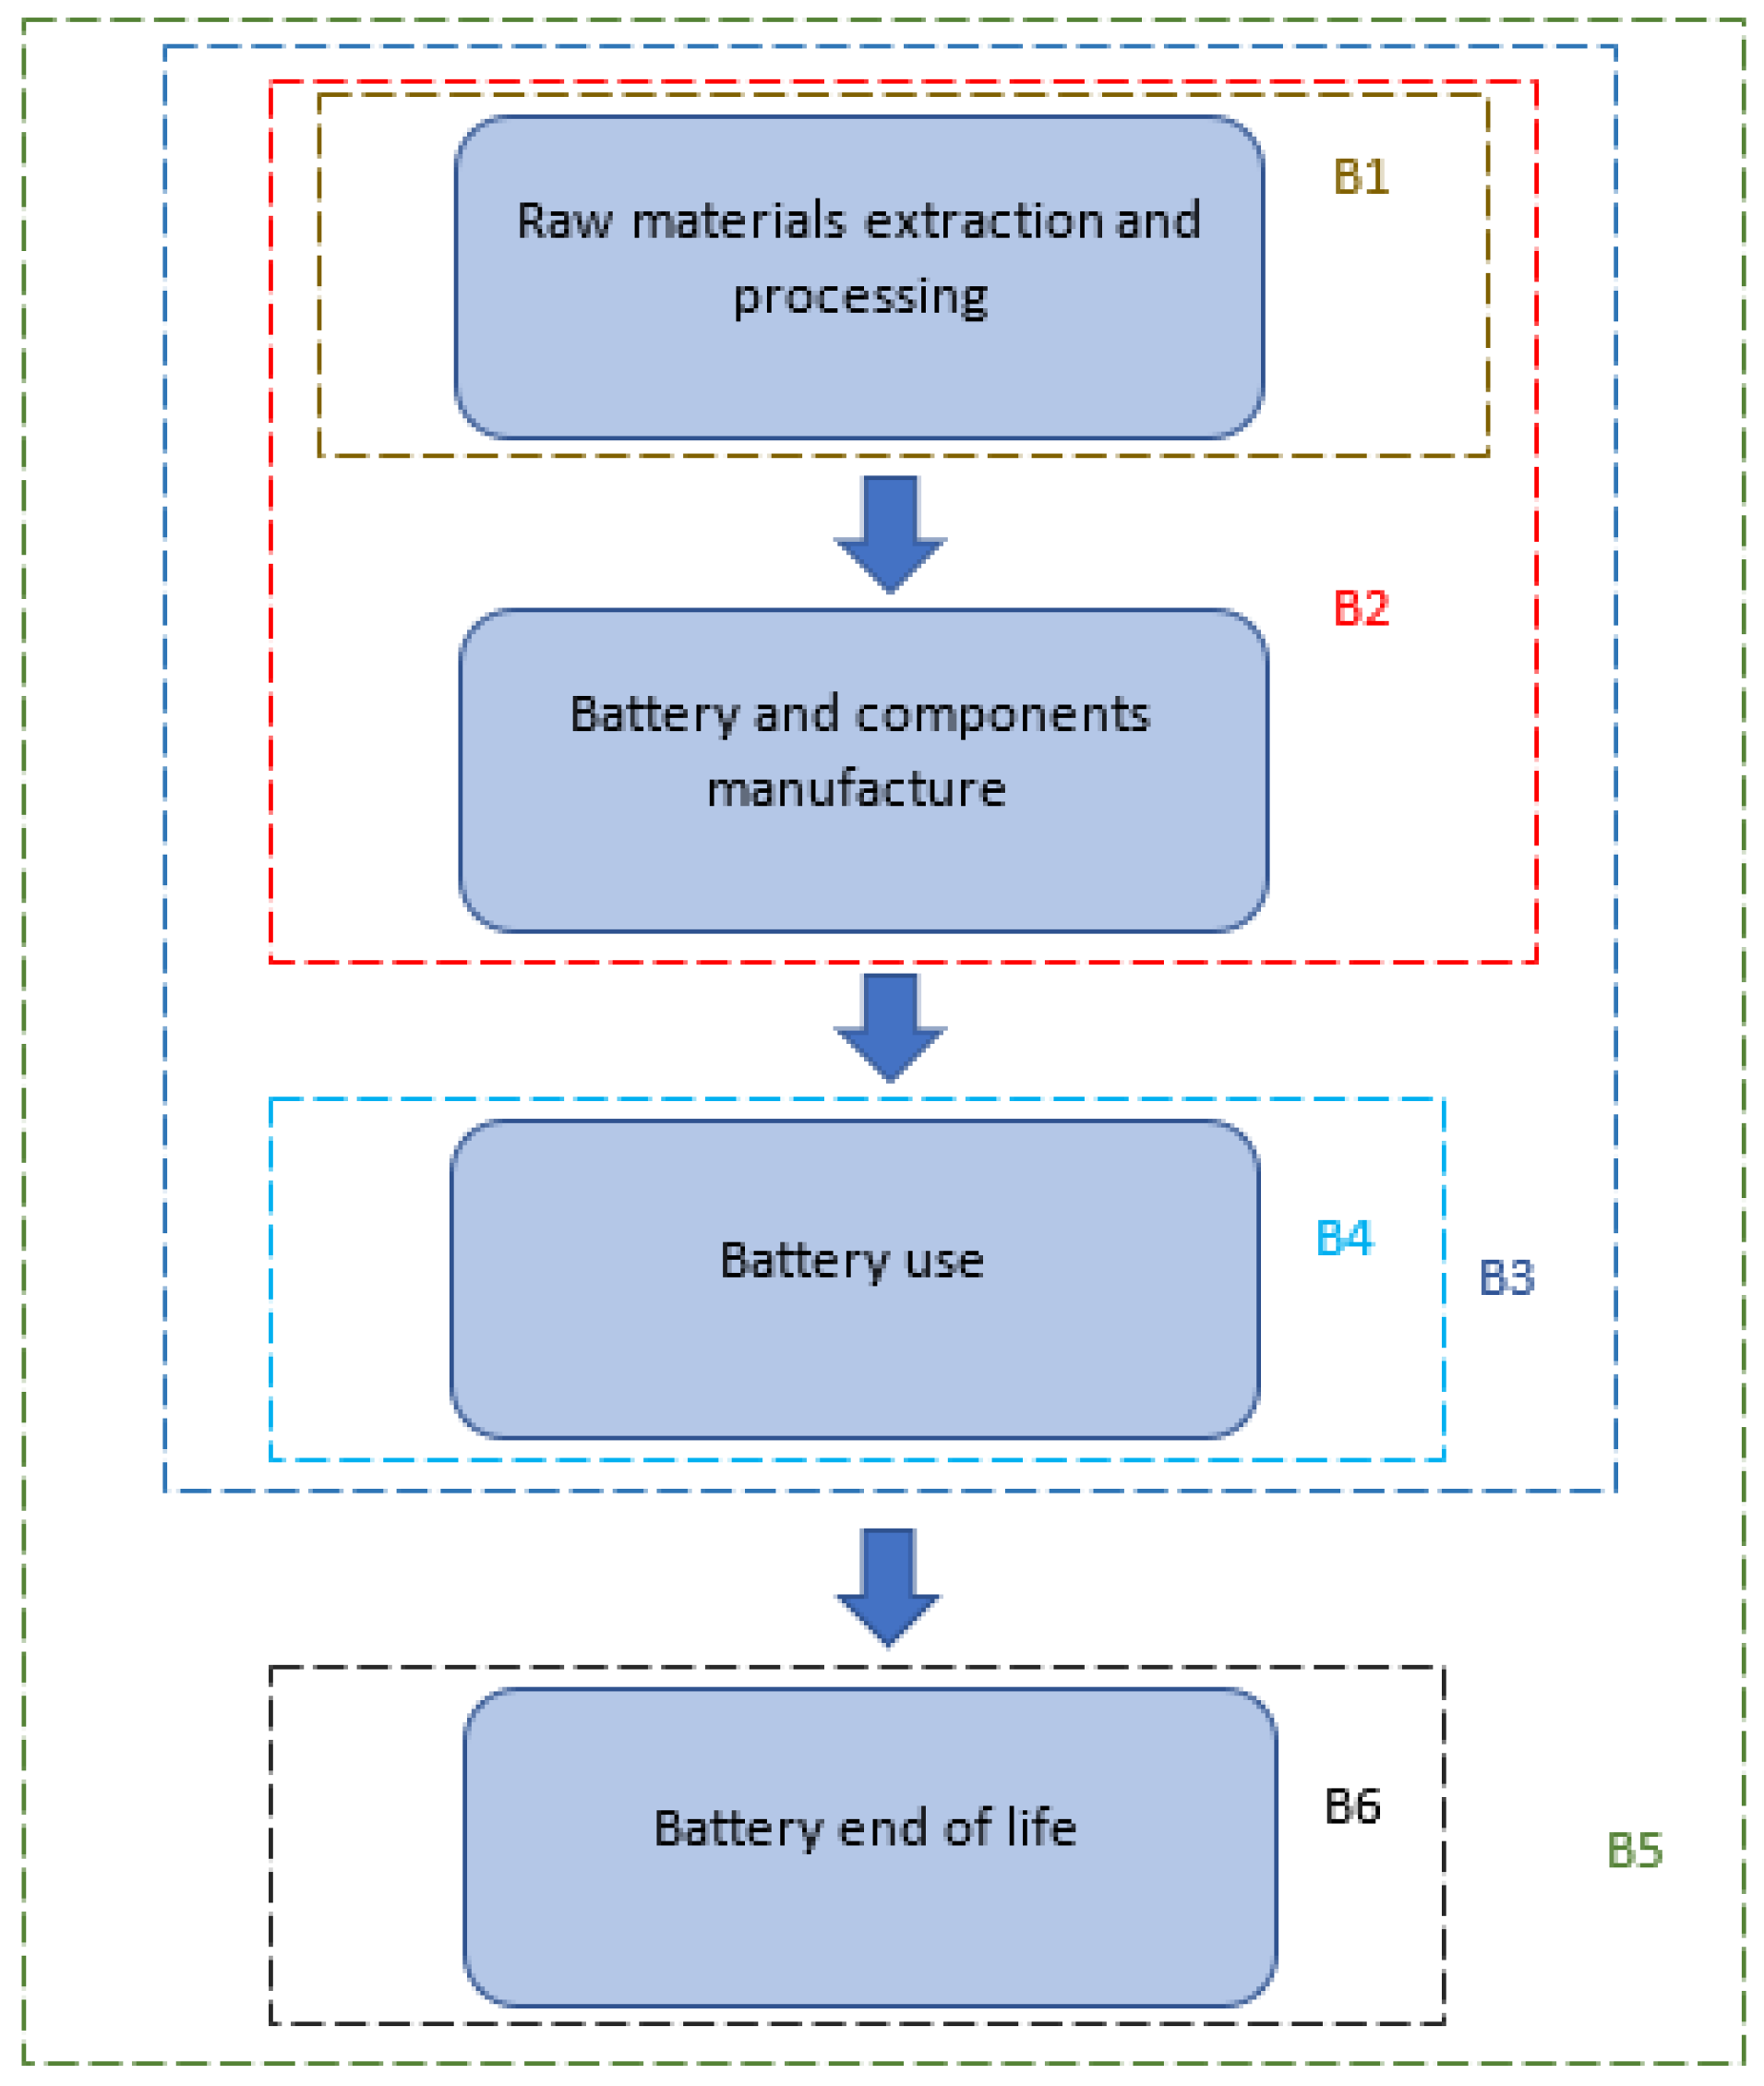
Selection of the pre-screened references based on the consistency of title and abstract with the scope of this study, and inventory according to the following categories: article type (review or research); specific focus (the reference considers only the LIB or the whole passenger/commercial vehicle); approach (complete LCA or assessment of GHG emissions); phase of lifecycle (depending on boundary conditions); geographical context (Asia, Europe, or the USA); functional unit. Specifically, to assign the phase of the LIB lifecycle associated to the boundary conditions defined in the selected references, the whole lifecycle was considered (Figure 1): raw material extraction and processing, cradle to gate, cradle to gate including use, use, cradle to grave, cradle to grave excluding use, and end of life. This analysis considered hybrid passenger and commercial vehicles, plug-in hybrid, and fully electric-type LIBs; only for the use phase were plug-in hybrid vehicles excluded. Fuel cell electric vehicles were not considered in this work.
(iii)
Extraction of global warming potential (GWP) values associated to each lifecycle phase from the inventoried references. To achieve consistency, the GWP values have been normalized to refer to the same unit, i.e., 1 kg of battery. NMC-graphite and LFP-graphite cell compositions have been based on [35], considering graphite and Li, Co, Ni, Mn, Cu, and Al for NMC and Li, Fe, Cu, and Al for LFP. The specifications reported for NMC [28] and LFP [16] were as follows: total capacity 23.5 kWh, weight 165 kg (119.77 kg of cells) for NMC and 203.1 kg (147.59 kg of cells) for LFP.
Regarding raw material extraction, production, and refining, the specific GWP values were derived from the literature for Li, Co, Ni, Mn, Fe, Cu, and Al [36], and for graphite [37], as follows: 7.1 kgCO2eq/kg for Li; 8.3 kgCO2eq/kg for Co; 6.5 kgCO2eq/kg for Ni; 1.0 kgCO2eq/kg for Mn; 2.8 kgCO2eq/kg for Cu; 8.2 kgCO2eq/kg for Al; 1.5 kgCO2eq/kg for Fe; 4.2 kgCO2eq/kg for graphite. P was excluded due to the lack of data (the only data available concern fertilizer production). The specific impacts associated to the raw materials play a crucial role in the LIB supply chain. Lithium, cobalt, phosphorous, and natural graphite are Critical Raw Materials [38]; they are essential for the European industry but present high supply risk associated to political instability and unsustainable mining [4]. Raw material extraction, production, and refining happen in different countries, and the average GWP values have been accounted for separately. Lithium is mainly produced in Australia and Chile, cobalt in the Democratic Republic of Congo, Australia, and Canada, natural graphite in China [39].
The average GWP values referring to other lifecycle phases (from component manufacturing to EoL) have been categorized into three geographical macro-contexts: Asia (China, Japan, and Republic of Korea), Europe, and the USA. Considering LIB production (from cells to modules, and battery and component assembly), the references presenting data that refer to multiple countries (as an example, production in the Republic of Korea and assembling in Norway) have been excluded. Considering the use phase, the average GWP values have been calculated for LIBs installed in electric vehicles according to specific features (Table 1) [40] provided by the car manufacturers and excluding plug-in hybrid electric vehicles. The GWP values calculated according to the features in Table 1 are affected only by the average energy mix of the three macro-areas. On the other hand, the GWP values referring to the use phase retrieved from the literature were highly variable, as they depend on the geographical context, battery specifications (capacity and weight), and other assumptions (total lifetime mileage, electricity consumption, charging efficiencies).
Regarding the EoL phase, pyrometallurgy and hydrometallurgy were accounted for. The average GWP values for each geographical context have been based on the emissions related to the specific processes, excluding references reporting results as avoided emissions compared to virgin raw material extraction. For Europe, the average GWP values derive from the selected references and from the Ecoinvent 3.9 database.

2.2. Assessment of the Emissions of Turin Urban Bus Fleet

The quantitative evaluation of the emissions associated to urban buses was based on the analysis of the baseline situation (inventory of Turin 2021 urban bus fleet), on the definition of 6 hypothetical scenarios corresponding to a progressive replacement of diesel and CNG buses with electric or hybrid, and on the calculation of associated annual emissions (as GHG and single pollutants) according to specific emission factors.
The analysis of the baseline situation accounted for the composition of the 2021 urban bus fleet disclosed by GTT Gruppo Torinese Trasporti [41], the company managing public transportation in Turin. The bus fleet included 940 vehicles, powered by diesel, compressed natural gas (CNG), and electric. The fleet composition was 36% CNG, 28% diesel EEV (Enhanced—Environmentally Friendly Vehicle, with emission profile between Euro 5 and 6), 11% electric, 10% Euro 6 Diesel, 7% Euro 2 Diesel, 6% Euro 3 Diesel, and 2% Euro 4 Diesel. A total of 50,000 km per year have been considered for each case [42]. The electric (EL) and hybrid (HYB) buses have been considered as alternatives in the hypothesized scenarios, as hybrid vehicles’ charge is not affected by the national energy mix. Six scenarios have been hypothesized (Figure 2), corresponding to a progressive electrification of the fleet, as follows.
The emissions produced by the Turin urban bus fleet have been evaluated as follows:
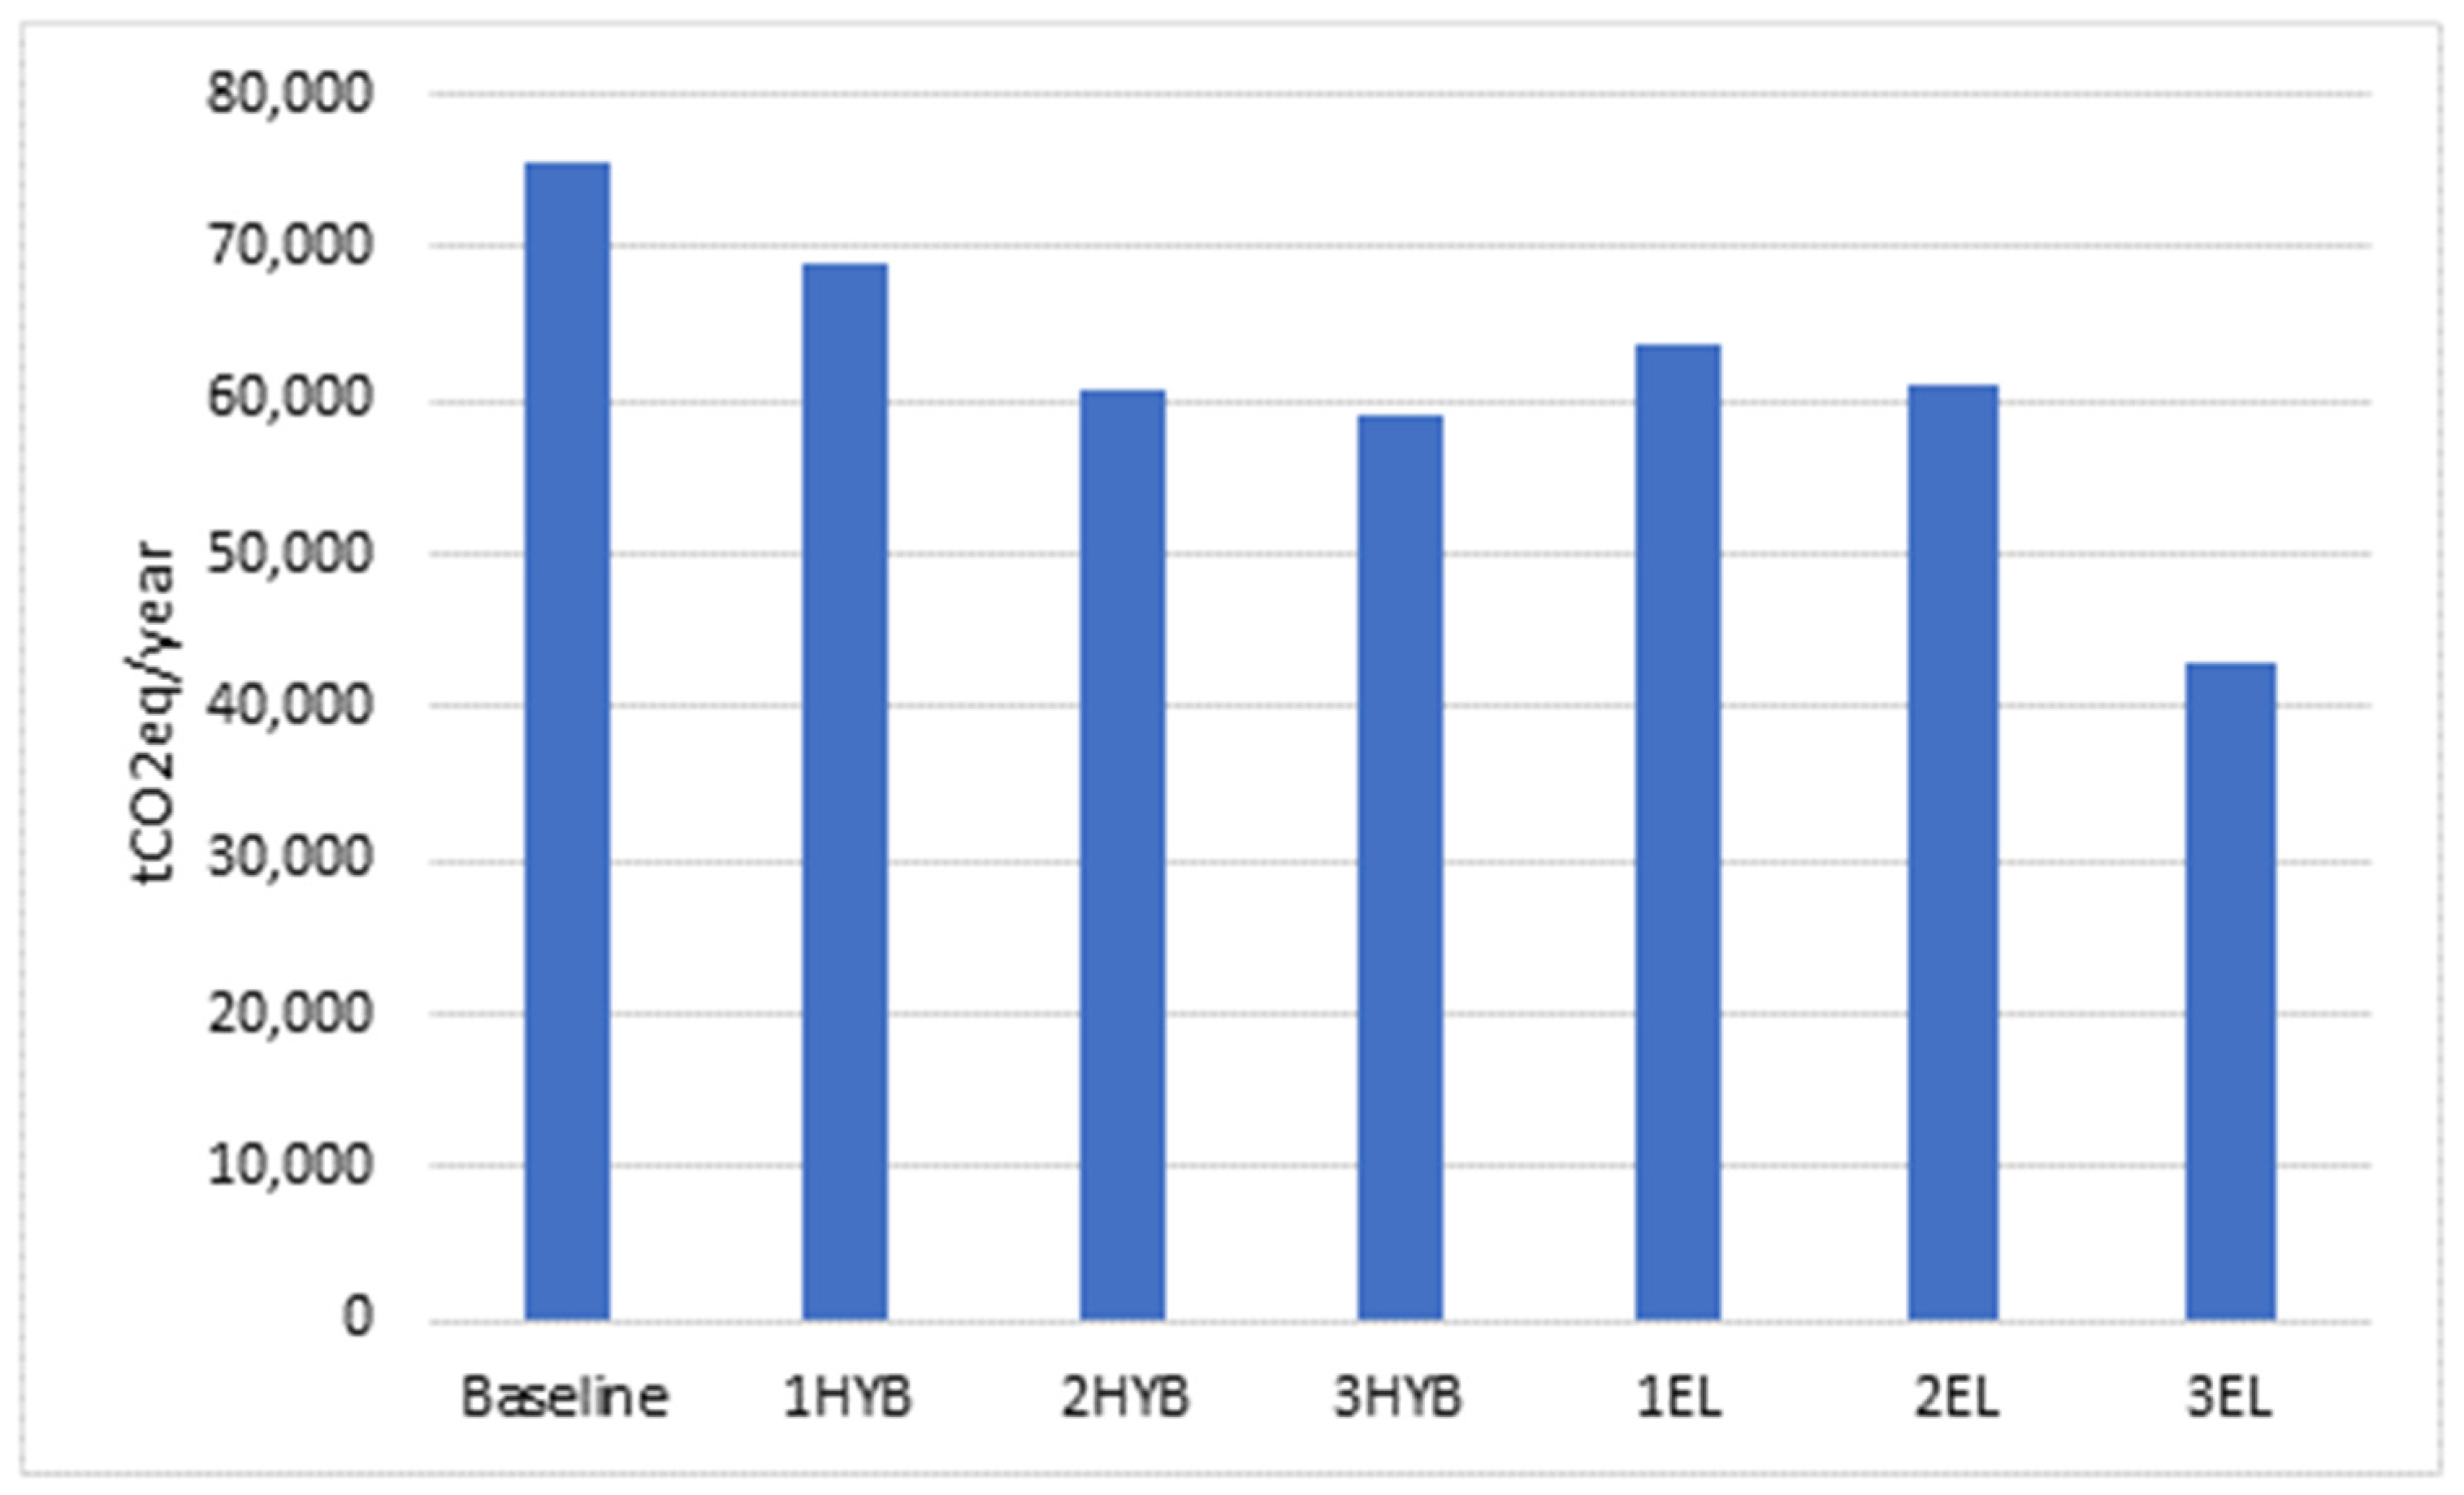
  • (iv) GHG emissions (GWPuse, for all types of vehicles), expressed as tonnes of CO2eq, considering the GWP100 of each pollutant contributing to the GHG effect according to Equation (1):
GWPuse [t CO2eq] = ((FE/0.9) × TM × GHG emissions for the electricity production)/BW
where FE is the fuel efficiency of the battery, TM is the total lifetime mileage and BW is the battery weight (Table 1). The GHG emissions for electricity production were 628.4 gCO2eq/kWh for Asia (average values of China, India, Indonesia, Japan, and Republic of Korea) [43], 230.7 gCO2eq/kWh for Europe [44], and 423 gCO2eq/kWh for the USA [43].
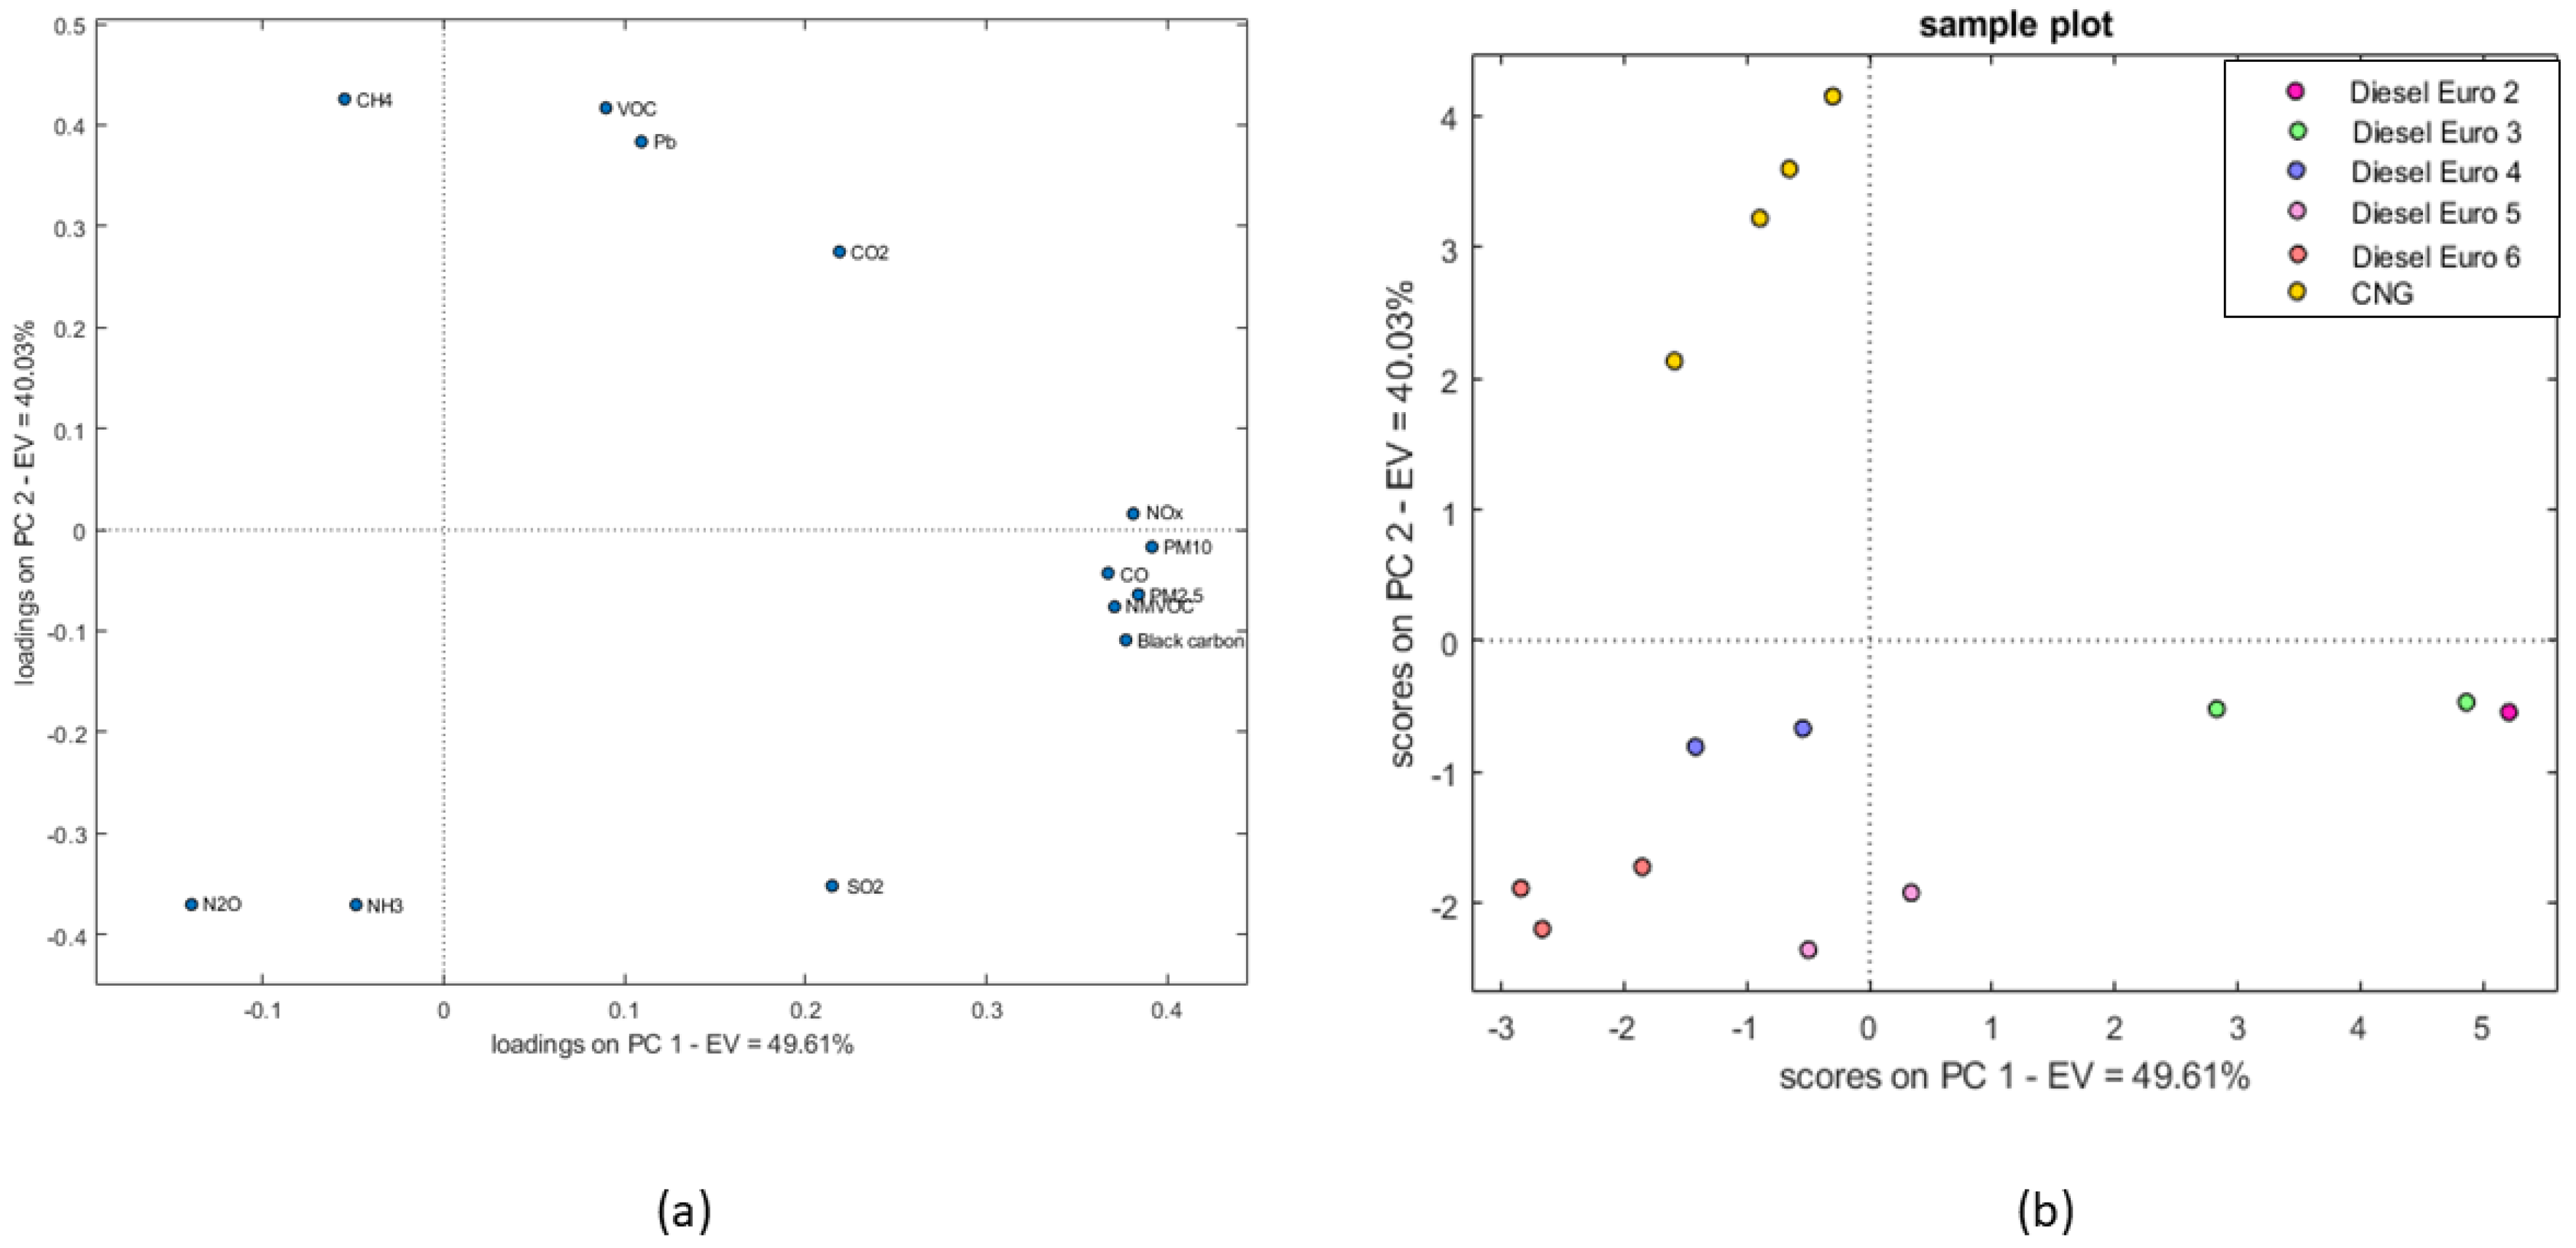
  • (v) Emissions from 13 single pollutants (for diesel and CNG buses), considering CO2, CO, NOx, PM (including black carbon and organic carbon), VOC, CH4, SO2 and NH3, N2O, Pb, and non-methane volatile organic compounds (NMVOCs). The calculation was based on Equation (2), where the emission factor (EF) is multiplied to the number of km/y covered by each bus (50,000 km) and the number of buses in the fleet.
p o l l u t a n t   e m i s s i o n k g = E F g k m × 50,000   k m · n u m b e r   o f   v e h i c l e s
The emission factors (EFs, expressed as g of pollutant per g of fuel) have been calculated for diesel, CNG, and electric buses as detailed in the following. For diesel buses, the single pollutants and the associated emissions (in tonnes of pollutant per TJ) have been considered for the different emission categories according to the Italian Institute for Environmental Protection and Research [45], which is based on the COPERT version 5.6.5 database, and hypothesizing a medium load of the vehicles, through Equations (3) and (4):
E F D i e s e l g   p o l l u t a n t g   f u e l = 42.7 · E F t   p o l l u t a n t T J
E F D i e s e l   g   p o l l u t a n t k m = E F   g   p o l l u t a n t k g   f u e l · f u e l   c o n s u m p t i o n   k g   f u e l k m
Accordingly, the EFs for CNG buses have been calculated accounting the single pollutants and the emission profiles [45] via Equations (5) and (6):
E F   g   p o l l u t a n t m 3   f u e l = 38.17 · E F   t   p o l l u t a n t T J
E F C N G g   p o l l u t a n t k m = E F g   p o l l u t a n t m 3   f u e l · f u e l   c o n s u m p t i o n m 3   f u e l k m
Principal Component Analysis (PCA) [46] was applied to the EF values obtained for diesel and CNG buses and the 13 pollutants specified above. PCA was performed using a toolbox on Matlab version r2019a [47].
Regarding the pollutant emissions and the EFs associated to the electric buses, the calculation referred to the charging phase. The electric buses do not directly emit pollutants during their use phase but rather during the charge of the batteries. The EFs of the electric buses (gCO2eq/km) have been calculated through Equation (7) by multiplying the value of GHG emission intensity of the electricity generation in Italy (213.4 gCO2 eq/kWh) [44] by the electricity consumption, assuming 79.3% charging efficiency [48].
E F e l e c t r i c g C O 2 e q k m = ( c o n s u m p t i o n k W h k m 0.793 ) · G H G   e m i s s i o n s   i n t e n s i t y   o f   e l e c t r i c i t y   g e n e r a t i o n g C O 2 e q k W h
To describe the baseline situation (Turin urban bus fleet in 2021), the total annual emissions of the 13 considered pollutants from diesel and CNG buses have been calculated with Equation (8):
  T o t a l   p o l l u t a n t   e m i s s i o n D i e s e l + C N G i t = j p o l l u t a n t   e m i s s i o n i k g 1000
where i represents the different pollutants considered (e.g., CO2, N2O, CO, VOC, etc.) and j the bus categories. The total annual emissions have thus been expressed as CO2eq, accounting for the GWP100 of single pollutants [49] using Equation (9):
T o t a l   e m i s s i o n s D i e s e l + C N G t C O 2 e q = i G W P 100 · t o t a l   a n n u a l   p o l l u t a n t   e m i s s i o n ( t ) i
To convert the pollutant emissions into CO2eq, the following GWP100 values were used: for pollutants directly contributing to the greenhouse gas effect, 1 for CO2, 265 for N2O, 28 for CH4 [49]; for pollutants having an indirect effect on global warming, 2.1 for CO, 3.4 for NMVOC and NOx, and 460 for black carbon [50,51].
The contribution of electric buses was accounted for by Equation (10):
T o t a l   e m i s s i o n s e l e c t r i c t C O 2 e q = E F e l e c t r i c g C O 2 e q k m · 50,000   k m · n u m b e r   o f   v e h i c l e s
Finally, the total annual emissions, expressed as tCO2eq, generated by the Turin urban bus fleet were calculated, adding the contribution of diesel, CNG, and electric buses (Equation (11)):
T o t a l   a n n u a l   e m i s s i o n t C O 2 e q = T o t a l   e m i s s i o n s D i e s e l + C N G + T o t a l   e m i s s i o n s e l e c t r i c t C O 2 e q
The scenarios involved in this study considered hybrid buses (Iveco Urbanway Hybrid High Value 12 m and 18 m) as alternatives to electric buses. The associated EFs have been calculated as for diesel buses (Equation (3)), accounting for −30% fuel consumption compared to Euro 6 Diesel [52]. Regarding the scenarios involving electric vehicles, this study considered Iveco E-WAY 18 m. Both the hybrid and electric buses used NMC-Gr or LFP-Gr batteries as alternatives. Full details of the calculations are in the Supplementary Materials (Tables S17–S52).

3. Results and Discussion

3.1. Overview of Literature Review

Forty-six references (forty research articles and six reviews) have been selected and inventoried (Supplementary Materials, Table S1) according to the applied methodology. A growing interest in the LIB lifecycle is evident, with 14 references published between 2011 and 2017, and 32 from 2018 to 2023. A total of 80% of the selected references present the results of a complete LCA applying ReCiPe and CML, and the rest only evaluated GHG emissions. Regarding the specific focus, thirty-seven references analyzed the lifecycle of a single battery, with just six articles considering a whole passenger vehicle and three articles referring to commercial vehicles. The chosen functional units were 1 kg battery pack, 1 kWh battery pack, and kilometers driven during the whole life of the LIB.
A total of 41% of the references considered a cradle to grave system, 26% cradle to gate, 13% cradle to grave excluding use, 9% focused on raw materials, 2% on the use phase, 6% cradle to gate with use, and 4% end of life. Concerning the geographical context, the reviews and few research articles were classified as “general” (no specific location assigned), ten articles referred to Asia (China, Japan, and Republic of Korea), six articles referred to Europe, five articles referred to Asia, Europe, and the USA, three articles referred to both Asia and the USA, and only two references considered Australia and South America (Chile).
The full details about the calculation of the average GWP values for LIB production, use, and end of life (expressed as kgCO2eq/kg of battery) referring to Asia, Europe, and the USA are in the Supplementary Materials (Table S2). Overall, the selected references presented results based on a combination of primary data (if available), usually gathered from industries (e.g., vehicles manufacturers, LIB recycling companies) and secondary data (previous literature, public documents); 61% referred to the same databases (Ecoinvent, GREET). Details about the selected literature’s data sources are in the Supplementary Materials (Table S2).
Taking into account raw material extraction, processing, and refining, the obtained average GWP values were 2.32 kgCO2eq/kg of battery for NMC and 1.45 kgCO2eq/kg for LFP. These values account for the whole composition of NMC-gr and LFP-gr batteries and have been calculated as the average of the values referring to the countries where the mining and refining activities take place (Section 2.1).
Considering the manufacturing phase, overall, the literature data present a large variability of GWP values (3.8–25.2 kgCO2eq/kg for NMC and 3–23.15 kgCO2eq/kg for LFP) because of different assumptions, sources of data, battery technical features, and the impact method adopted within the different studies. Disregarding the different locations, the range values are similar; few primary data (i.e., from the industries) are available and, consequently, secondary data retrieved from Ecoinvent, GREET databases, and the literature are commonly employed. The average GWP values calculated were as follows(Figure 3 and Supplementary Materials, Tables S5–S16): for NMC, 14.12 kgCO2eq/kg for Asia, 14.04 kgCO2eq/kg for Europe, and 13.98 kgCO2eq/kg for the USA; for LFP, 12.14 kgCO2eq/kg for Asia, 19.17 kgCO2eq/kg for Europe, and 10.83 kgCO2eq/kg GWP for the USA. Most references (28 out of a total of 46) focused on NMC production, while just 13 focused on LFP. The 2022 worldwide market share of cathode chemistries used for electric vehicles was 30% for LFP and 60% for NMC [53].
The GWP values obtained from the literature for the use phase are strictly related to the energy mix of the specific countries and to the technical features of the LIB considered in each reference. The average GWP values calculated for NMC were 93.26 kgCO2eq/kg for Asia, 59.06 kgCO2eq/kg for Europe, and 45 kgCO2eq/kg for the USA; for LFP, the values were 77.4 kgCO2eq/kg for Asia and 41.31 kgCO2eq/kg for Europe, with no data available for the USA. The selected references consider multiple types of batteries and, consequently, the literature data are highly variable (see Supplementary Materials, Table S2), as they depend on the geographical context and also on battery specifications (capacity and weight) and other assumptions (total lifetime mileage, electricity consumption, charging efficiencies). Therefore, to perform a consistent comparison of the GWP associated to the use phase in Asia, Europe, and the USA, this review study considered “sample” NMC and LFP batteries (Table 1) having defined features. In this way, the GWP values retrieved are related only to the energy mix and they are not affected by the differences within battery specifications and other assumptions. The highest average GWP values were obtained for Asia (28.3 kgCO2eq/kg for NMC and 34.6 kgCO2eq/kg for LFP); the lowest were obtained for Europe (10.39 kgCO2eq/kg for NMC and 12.7 kgCO2eq/kg for LFP); for USA, they were 19.05 kgCO2eq/kg for NMC and 23.3 kgCO2eq/kg for LFP.
The GWP literature data associated to the end of life phase were fewer compared to the other lifecycle phases (10 references out of a total of 46), and they do not specifically refer to NMC and LFP batteries (see Supplementary Materials, Table S16). As concerns pyrometallurgy, an average value of 1.14 kgCO2eq/kg was obtained for Europe, with no data for Asia or the USA. For hydrometallurgy, average GWP values were 0.94 kgCO2eq/kg for Europe, 1.41 kgCO2eq/kg for Asia, and 0.9 kgCO2eq/kg for the USA. The average GWP value for pyrometallurgy and hydrometallurgy in cascade was 1.41 kgCO2eq/kg. In addition, the average GWP values retrieved from the literature for Europe have also been compared to the average GWP values reported on the Ecoinvent database [54], considering different impact methods, as follows: for pyrometallurgy, 1.32 kgCO2eq/kg (IPPC 2013), 1.44 kgCO2eq/kg (EF v3.0), 1.39 kgCO2eq/kg (ReCiPe Midpoint (H)), and 1.4 kgCO2eq/kg (CML v4.8 2016); for hydrometallurgy, 0.88 kgCO2eq/kg (IPPC 2013), 0.90 kgCO2eq/kg (EF v3.0), 0.83 kgCO2eq/kg (ReCiPe Midpoint (H)), and 0.86 kgCO2eq/kg (CML v4.8 2016). It may be observed that these impacts are similar even if different impact methods were considered.

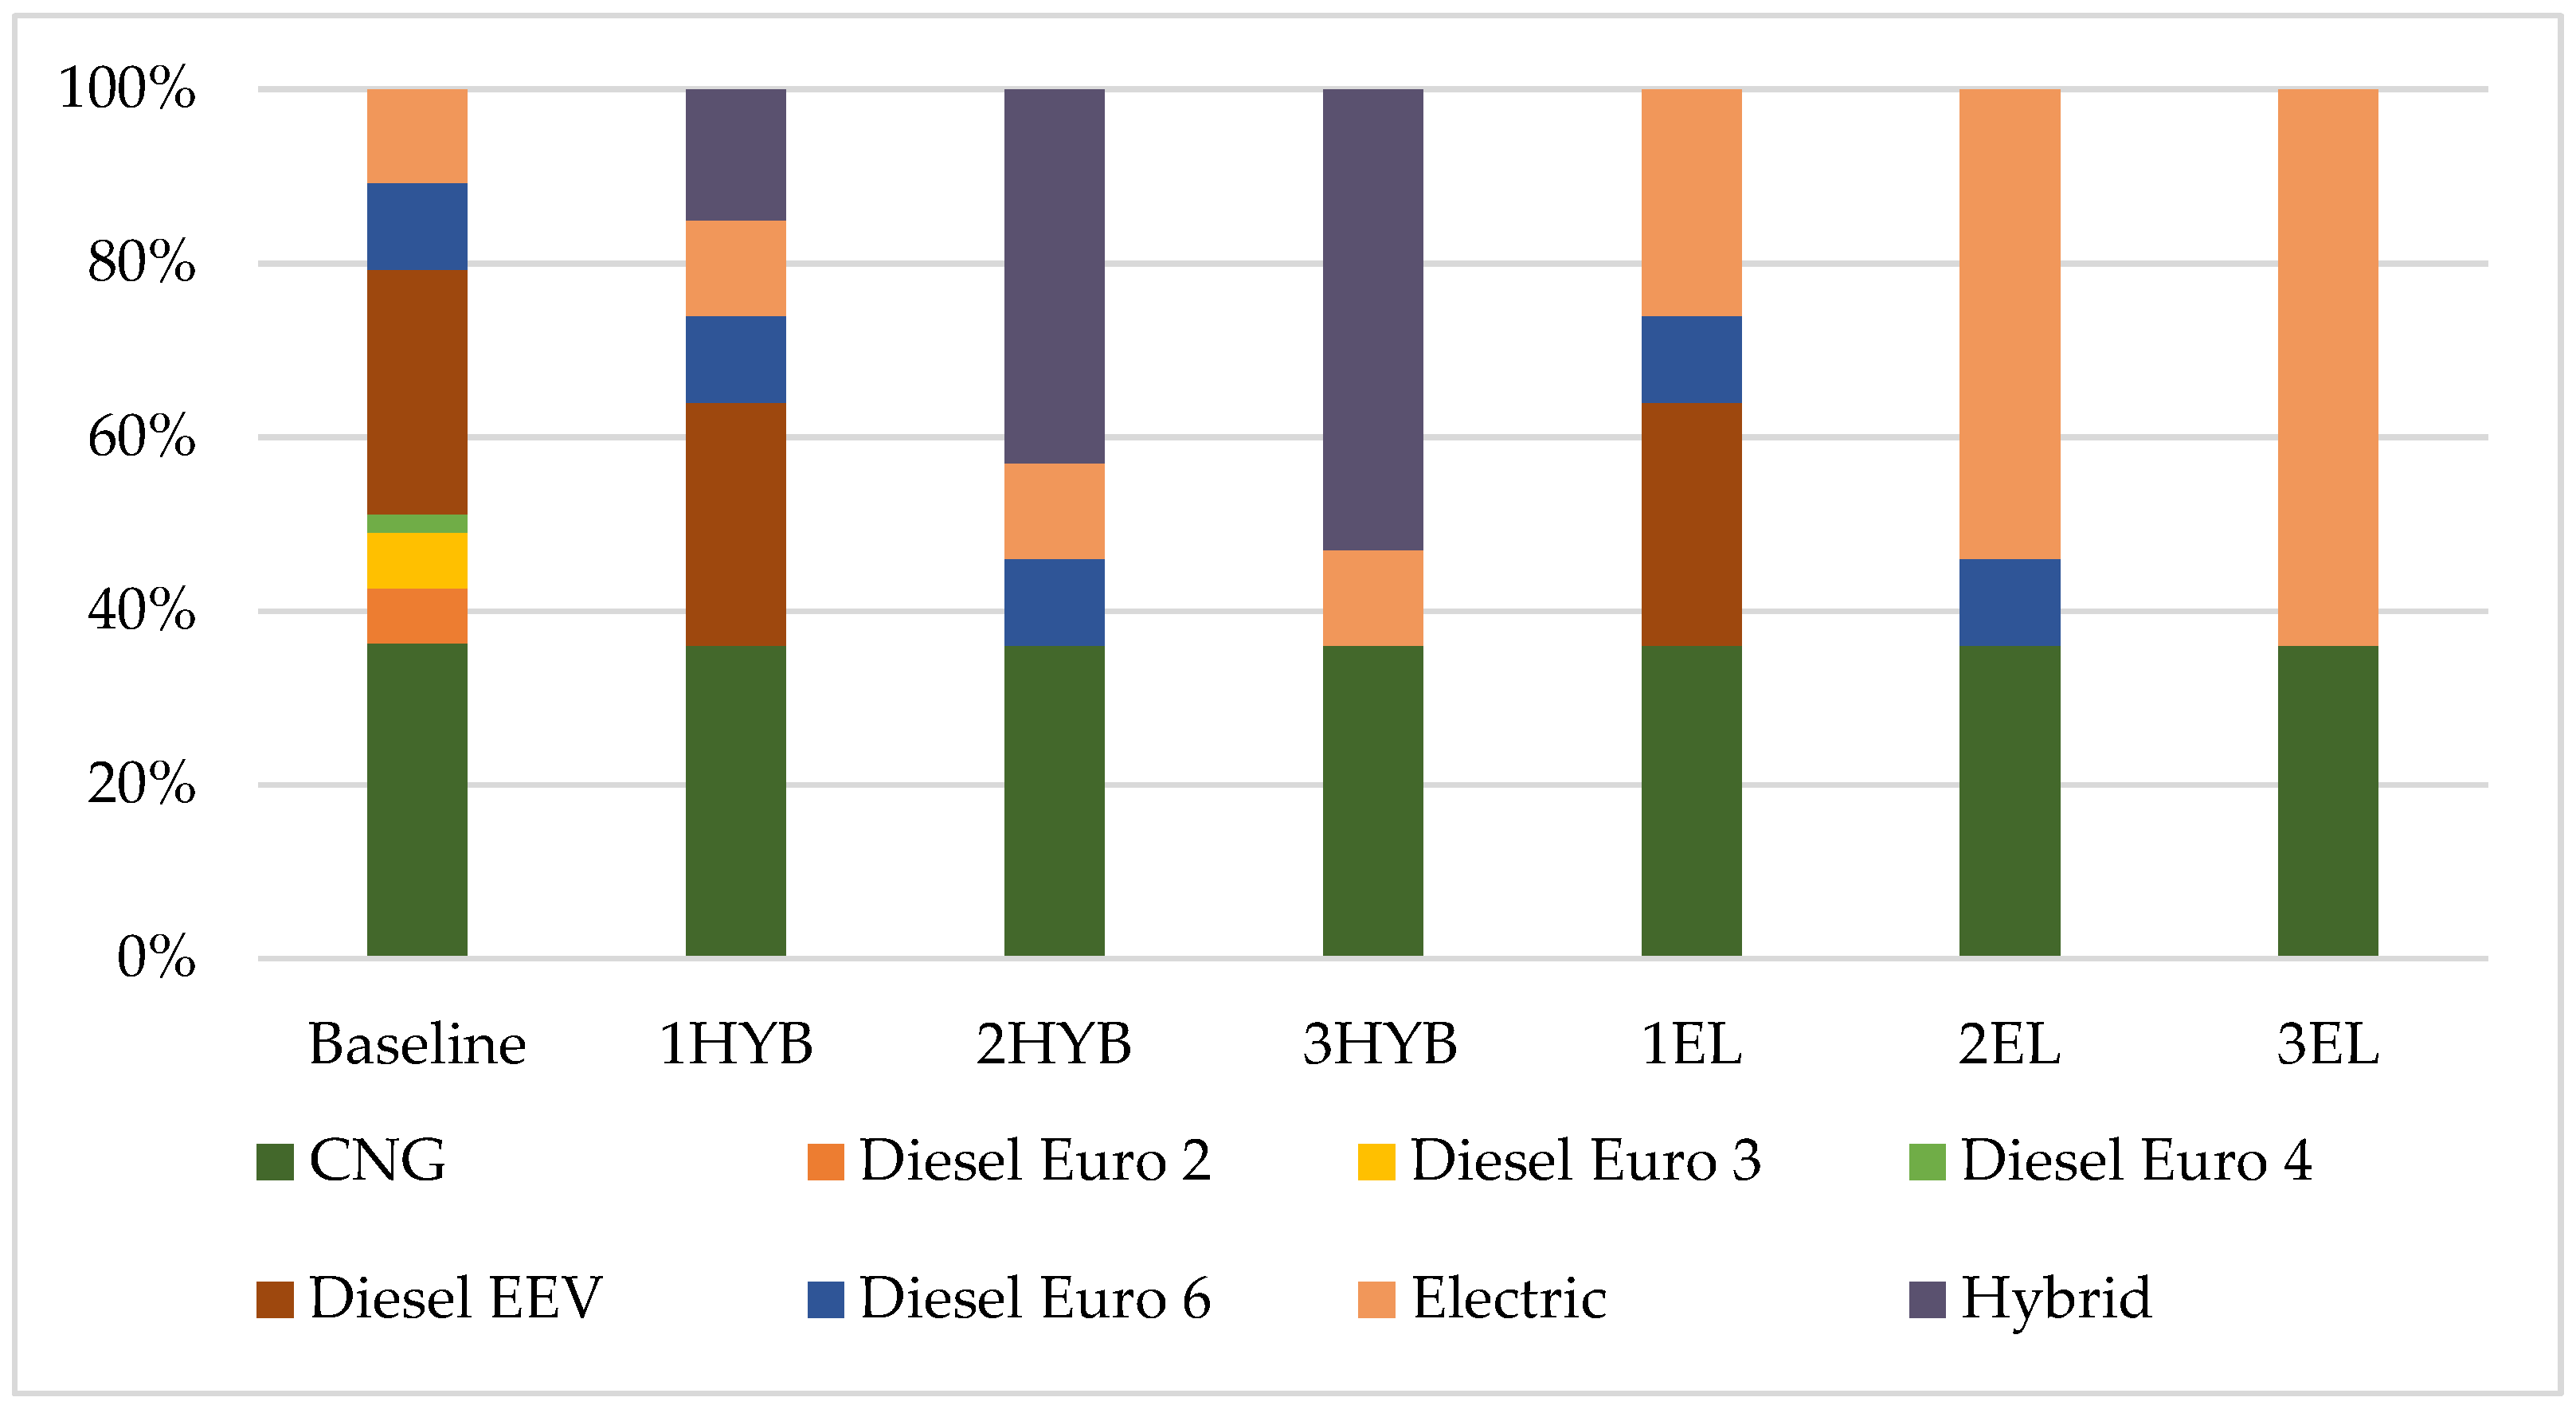
3.2. Emission Assessment of the Turin Urban Bus Fleet—Use Phase

The EFs calculated for the diesel buses (Supplementary Materials, Tables S22–S31) showed that the value of emitted CO2 is almost the same for all categories, but the CO and NOx emissions drastically decrease for Euro 6 Diesel compared with others. The EFs related to the diesel buses were in the range of 0.7–2 kgCO2/km, 0.24–3.9 gCO/km, 0.5–19.8 gNOx/km, and 0.01–0.16 gCH4/km. The EFs calculated for the CNG buses revealed that N2O, NH3, and black carbon are not emitted, but CH4 presented an EF higher than diesel buses, due to the fuel composition. In an ideal scenario, when a conventional carbon-based fuel such as gasoline or diesel is burned in an engine, this would only produce carbon dioxide and water. However, in real conditions, the fuel combustion is incomplete, leading to the formation of different kinds of pollutants (in addition to CO2 and water) [55]. Consequently, CO2 produces the highest emissions because it is the main product of fuel combustion; the other pollutants (CO, PM, HC, NH3) mainly derive from the incomplete combustion of the diesel fuel. The EFs related to the diesel buses were 2.2 kgCO2/km, 1.8 gCO/km, 6.8 gNOx/km, and 1.78 gCH4/km. The EFs calculated for the electric buses were in the range of 180.22–279.75 kgCO2eq/km. Details about the calculated EFs are in the Supplementary Materials (Tables S32–S37).
The Principal Component Analysis (PCA) was used to investigate possible correlations among the EFs calculated for diesel and CNG buses and the features of the Turin urban bus fleet (Figure 4). The results of the PCA are the loading plot (Figure 4a), representing the influence of the features on the variability of the EFs, and the scores plot (Figure 4b), where PC1 and PC2 are the directions of maximal variance in the data. The two plots should be evaluated by analyzing the angles between the loadings and the scores; angles equal to 0° represent positive correlations, 180° angles represent negative correlations, and 90° angles represent uncorrelated variables. This translates into positive correlations amongst the emissions factors and the features located in the same area of the plots. The results of the PCA revealed a positive correlation linking Euro 2 and 3 Diesel buses with higher EFs associated to NOx, PM, CO, and black carbon, Euro 5 and 6 Diesel with higher EFs associated to NH3 and N2O, and CNG buses with higher EFs associated to CH4.
The total annual emissions of the single pollutants emitted from the Turin urban bus fleet calculated for the baseline situation are shown in Table 2. The highest emissions are due to CO2 (69,016.27 t), followed by NOx (358.04 t) and CO (102.12 t). The full details of the calculated emissions are in the Supplementary Materials (Tables S44–S49).
The conversion of the data in Table 2 into annual emissions expressed as CO2eq led to 71,536.34 tCO2eq in total. The diesel and CNG buses contributed to 98% of the total, while the few electric buses contributed to 1.7%. The calculated annual emissions from the single pollutants (expressed as tCO2eq) (Figure 5) showed that NOx was the prevailing pollutant for the baseline and all scenarios, with 2HYB, 3HYB and 3EL leading to similar values (about 117 tNOx/year) and scenario 1HYB to the second highest value (246 tNOx/year) after the baseline (358 tNOx/year). For scenarios 1HYB and 1EL, CO and NOx emissions were similar (73 tCO/year and 244 tNOx/year, respectively); the same happened for scenarios 3HYB and 3EL (29 tCO/year and 115 tNOx/year). This means that replacing the diesel buses with hybrid or electric could lead to the same CO and NOx emissions. The values calculated for VOC and CH4 were similar for the baseline and all scenarios (about 29 tVOC/year for both pollutants). For the baseline, PM2.5 and PM10 calculated emissions values were 7.48 tPM2.5/year and 10.78 tPM10/year, respectively, while the hypothesized scenarios returned lower values, with similar performances for scenarios 1HYB and 1EL (5 tPM2.5/year and 7.7 tPM10/year), and for 2HYB, 3HYB, 2EL (4.2 tPM2.5/year and 6.1 tPM10/year), and the best performances for 3EL (1.91 tPM2.5/year and 3.49 tPM10/year). As regards NMVOC, replacing Euro 2, 3, and 4 Diesel buses led to a significant decrease in emissions: 1.26 tNMVOC/year for 3HYB and 0.44 tNMVOC/year for 3EL. Moreover, the scenario 3EL (only CNG and electric buses) diminished to zero N2O, NH3, SO2, and black carbon. Full details are in the Supplementary Materials (Table S50).
The total annual CO2 emissions calculated for the baseline and the hypothesized scenarios (see Supplementary Materials, Table S51) showed that the highest value was associated to the baseline (69,016.27 tCO2/year). Scenarios 1HYB, 2HYB, and 3HYB corresponded to a gradual decrease in the emissions, and the same happened for scenarios 1EL, 2EL, and 3EL. Comparing scenarios HYB and EL, lower CO2 emissions were associated to electric buses, as less pollutants are emitted during the use phase. However, scenario 1EL emitted more CO2 (56,851.9 tons/year) than 3HYB (31,383.6 tons/year). Specifically analyzing equivalent scenarios of hybrid and electric percentage substitutions, e.g., comparing 1HYB with 1EL, 2HYB with 2EL, and 3HYB with 3EL, CO2 emissions values were always lower for scenarios including electric buses.
The total annual emissions, expressed as tCO2eq associated to the baseline and the hypothesized scenarios, also including the contribution of the greenhouse gas effect of the energy used for electric bus charging, are shown in Figure 6. Comparing the alternative scenarios with the baseline, the most significant emission reduction is related to 3EL, which allows savings of 43.1% of tCO2eq compared to the baseline scenario; the lowest reduction is due to scenario 1HYB (8.9%); scenarios 2HYB, 3HYB, 1EL, and 2EL present similar reductions equal to 19.6%, 21.8%, 15.7%, and 19.1%, respectively.

4. Conclusions

This review paper aimed to address two knowledge gaps associated to the environmental assessment of LIBs, and was based on the following assumptions: batteries made of NMC and LFP cathodes and graphite anodes; emissions expressed as global warming potential (GWP); end of life management through pyro- or hydrometallurgy with no difference between battery types. The first knoweldge gap was related to the evaluation of the influence of the geographical context analyzed on the results of the LCA of the LIB lifecycle. Raw material extraction, processing, and refining phases occur in multiple countries spread around the world, and the average GWP values retrieved from the literature were 2.32 kgCO2eq/kg for NMC batteries and 1.45 kgCO2eq/kg for LFP. Battery manufacturing happens in many countries, and the average GWP values were similar for Asia, Europe, and the USA (14.12, 14.04, and 13.98 kgCO2eq/kg for NMC, and 12.14, 19.17, and 10.83 for LFP, respectively). We observed a lack of primary data related to the GWP of the LIB production phase, and most of the literature refers to the same secondary data, thus flattening the influence of the geographical context on the LCA results. On the other hand, the GWP literature values associated to the LIB use phase are highly affected by the local energy mix and battery specifications. The average GWP values related to the use phase retrieved from the literature were as follows: for NMC, 93.26 kgCO2eq/kg for Asia, 59.06 kgCO2eq/kg for Europe, and 44.96 kgCO2eq/kg for the USA; for LFP, only average values for Asia (77.42 kgCO2eq/kg) and Europe (41.31 kgCO2eq/kg) have been calculated, due to the lack of data for the USA. To perform a consistent comparison, excluding the influence of battery technical features and accounting only for the influence of the local energy mix, the GWP values for “sample” NMC and LFP batteries have been calculated. In detail, the average emissions related to the LIB use phase in Europe were the lowest (59.06 kgCO2eq/kg), compared to Asia (93.26 kgCO2eq/kg) and the USA (44.96 kgCO2eq/kg). Considering the end of life, the GWP values obtained for hydrometallurgy in the USA (0.90 kgCO2eq/kg) and Europe (0.94 kgCO2eq/kg) were lower than in Asia (1.41 kgCO2eq/kg); for pyrometallurgy, 1.14 kgCO2eq/kg was calculated for Europe, with no data available for Asia and the USA.
The second knowledge gap addressed by this review was related to the LIB use phase, with a specific interest in the assessment of the influence of a progressive electrification of the public urban bus fleet in an Italian city (Turin in 2021, assuming 50,000 km/year per vehicle) as a case study. The baseline (53% diesel, 36% CNG, and 11% electric) produced about 70,000 t CO2eq/y. Six scenarios have been hypothesized, corresponding to a progressive replacement of diesel buses with hybrid or electric as alternatives. According to the performed calculations, and accounting for the Italian energy mix (79% fossil fuels, 18% renewables, and 4% other) [56], when all the diesel buses have been replaced and the fleet includes 64% electric buses and 36% CNG, CO2eq emissions may be decreased by 41% compared to the baseline.
This review study may support further research on the analysis of the LCA results related to the lifecycle of lithium-ion batteries. Furthermore, this could facilitate the positive perception of the electrification of public transportation among policymakers and the wider public.

Supplementary Materials

The following supporting information can be downloaded at: https://www.mdpi.com/article/10.3390/batteries10030090/s1.

Author Contributions

Conceptualization, data curation, visualization, writing—original draft preparation, L.N.; Conceptualization, methodology, supervision, writing—review and editing, S.F. All authors have read and agreed to the published version of the manuscript.

Funding

This research was funded by PON “Ricerca e Innovazione” 2014–2020, Asse IV “Istruzione e ricerca per il recupero” con riferimento all’Azione IV.4 “Dottorati e contratti di ricerca su tematiche dell’innovazione” e all’Azione IV.5 “Dottorati su tematiche green”. DM 1061/2021. Batteries 10 00090 i001

Data Availability Statement

Data will be made available on request.

Conflicts of Interest

The authors declare no conflicts of interest.

References

  1. European Commission. Communication from the Commission to the European Parliament, the European Council, the Council, the European Economic and Social Committee and the Committee of the Regions—The European Green Deal. 2019. Available online: https://eur-lex.europa.eu/resource.html?uri=cellar:b828d165-1c22-11ea-8c1f-01aa75ed71a1.0002.02/DOC_1&format=PDF (accessed on 30 March 2022).
  2. IEA. Tracking Transport 2020—Analysis—IEA. Available online: https://www.iea.org/reports/tracking-transport-2020 (accessed on 17 January 2022).
  3. IEA. Global EV Outlook 2021. Accelerating Ambitions Despite the Pandemic. 2021. Available online: www.iea.org/t&c/ (accessed on 17 January 2022).
  4. European Commission. Committee of the Regions and the European Investment Bank on the Implementation of the Strategic Action Plan on Batteries: Building a Strategic Battery Value Chain in Europe. 2019. Available online: https://eur-lex.europa.eu/legal-content/en/TXT/?uri=CELEX%3A52019DC0176 (accessed on 17 January 2022).
  5. Arshad, F.; Lin, J.; Manurkar, N.; Fan, E.; Ahmad, A.; Tariq, M.N.; Wu, F.; Chen, R.; Li, L. Life Cycle Assessment of Lithium-ion Batteries: A Critical Review. Resour. Conserv. Recycl. 2022, 180, 106164. [Google Scholar] [CrossRef]
  6. Peters, J.F.; Baumann, M.; Zimmermann, B.; Braun, J.; Weil, M. The environmental impact of Li-Ion batteries and the role of key parameters—A review. Renew. Sustain. Energy Rev. 2017, 67, 491–506. [Google Scholar] [CrossRef]
  7. Bouter, A.; Guichet, X. The greenhouse gas emissions of automotive lithium-ion batteries: A statistical review of life cycle assessment studies. J. Clean. Prod. 2022, 344, 130994. [Google Scholar] [CrossRef]
  8. Aichberger, C.; Jungmeier, G. Environmental Life Cycle Impacts of Automotive Batteries Based on a Literature Review. Energies 2020, 13, 6345. [Google Scholar] [CrossRef]
  9. Zhong, C.; Weng, S.; Wang, Z.; Zhan, C.; Wang, X. Kinetic limits and enhancement of graphite anode for fast-charging lithium-ion batteries. Nano Energy 2023, 117, 108894. [Google Scholar] [CrossRef]
  10. Zhang, H.; Yang, Y.; Ren, D.; Wang, L.; He, X. Graphite as anode materials: Fundamental mechanism, recent progress and advances. Energy Storage Mater. 2021, 36, 147–170. [Google Scholar] [CrossRef]
  11. Zhao, E.; Walker, D.; Surawski, N.C.; Bennett, N.S. Assessing the life cycle cumulative energy demand and greenhouse gas emissions of lithium-ion batteries. J. Energy Storage 2021, 43, 103193. [Google Scholar] [CrossRef]
  12. Yang, Y.; Okonkwo, E.G.; Huang, G.; Xu, S.; Sun, W.; He, Y. On the sustainability of lithium ion battery industry—A review and perspective. Energy Storage Mater. 2021, 36, 186–212. [Google Scholar] [CrossRef]
  13. Lai, X.; Chen, Q.; Tang, X.; Zhou, Y.; Gao, F.; Guo, Y.; Bhagat, R.; Zheng, Y. Critical review of life cycle assessment of lithium-ion batteries for electric vehicles: A lifespan perspective. eTransportation 2022, 12, 100169. [Google Scholar] [CrossRef]
  14. Ellingsen, L.A.W.; Hung, C.R.; Strømman, A.H. Identifying key assumptions and differences in life cycle assessment studies of lithium-ion traction batteries with focus on greenhouse gas emissions. Transp. Res. D Transp. Environ. 2017, 55, 82–90. [Google Scholar] [CrossRef]
  15. Crenna, E.; Gauch, M.; Widmer, R.; Wäger; Hischier, R. Towards more flexibility and transparency in life cycle inventories for Lithium-ion batteries. Resour. Conserv. Recycl. 2021, 170, 105619. [Google Scholar] [CrossRef]
  16. Quan, J.; Zhao, S.; Song, D.; Wang, T.; He, W.; Li, G. Comparative life cycle assessment of LFP and NCM batteries including the secondary use and different recycling technologies. Sci. Total Environ. 2022, 819, 153105. [Google Scholar] [CrossRef] [PubMed]
  17. Kallitsis, E.; Korre, A.; Kelsall, G.H. Life cycle assessment of recycling options for automotive Li-ion battery packs. J. Clean. Prod. 2022, 371, 133636. [Google Scholar] [CrossRef]
  18. Sun, X.; Luo, X.; Zhang, Z.; Meng, F.; Yang, J. Life cycle assessment of lithium nickel cobalt manganese oxide (NCM) batteries for electric passenger vehicles. J. Clean. Prod. 2020, 273, 123006. [Google Scholar] [CrossRef]
  19. Wang, F.; Deng, Y.; Yuan, C. Life cycle assessment of lithium oxygen battery for electric vehicles. J. Clean. Prod. 2020, 264, 121339. [Google Scholar] [CrossRef]
  20. Deng, Y.; Li, J.; Li, T.; Gao, X.; Yuan, C. Life cycle assessment of lithium sulfur battery for electric vehicles. J. Power Sources 2017, 343, 284–295. [Google Scholar] [CrossRef]
  21. Mohr, M.; Peters, J.F.; Baumann, M.; Weil, M. Toward a cell-chemistry specific life cycle assessment of lithium-ion battery recycling processes. J. Ind. Ecol. 2020, 24, 1310–1322. [Google Scholar] [CrossRef]
  22. Guo, W.; Feng, T.; Li, W.; Hua, L.; Meng, Z.; Li, K. Comparative life cycle assessment of sodium-ion and lithium iron phosphate batteries in the context of carbon neutrality. J. Energy Storage 2023, 72, 108589. [Google Scholar] [CrossRef]
  23. Tao, Y.; Wang, Z.; Wu, B.; Tang, Y.; Evans, S. Environmental life cycle assessment of recycling technologies for ternary lithium-ion batteries. J. Clean. Prod. 2023, 389, 136008. [Google Scholar] [CrossRef]
  24. Feng, T.; Guo, W.; Li, Q.; Meng, Z.; Liang, W. Life cycle assessment of lithium nickel cobalt manganese oxide batteries and lithium iron phosphate batteries for electric vehicles in China. J. Energy Storage 2022, 52, 104767. [Google Scholar] [CrossRef]
  25. Lai, X.; Gu, H.; Chen, Q.; Tang, X.; Zhou, Y.; Gao, F.; Han, X.; Guo, Y.; Bhagat, R.; Zheng, Y. Investigating greenhouse gas emissions and environmental impacts from the production of lithium-ion batteries in China. J. Clean. Prod. 2022, 372, 133756. [Google Scholar] [CrossRef]
  26. Abdelbaky, M.; Schwich, L.; Crenna, E.; Peeters, J.R.; Hischier, R.; Friedrich, B.; Dewulf, W. Comparing the environmental performance of industrial recycling routes for lithium nickel-cobalt-manganese oxide 111 vehicle batteries. Procedia CIRP 2021, 98, 97–102. [Google Scholar] [CrossRef]
  27. Dai, Q.; Kelly, J.C.; Gaines, L.; Wang, M. Life cycle analysis of lithium-ion batteries for automotive applications. Batteries 2019, 5, 48. [Google Scholar] [CrossRef]
  28. Qiao, Q.; Zhao, F.; Liu, Z.; Jiang, S.; Hao, H. Cradle-to-gate greenhouse gas emissions of battery electric and internal combustion engine vehicles in China. Appl. Energy 2017, 204, 1399–1411. [Google Scholar] [CrossRef]
  29. Hao, H.; Mu, Z.; Jiang, S.; Liu, Z.; Zhao, F. GHG Emissions from the Production of Lithium-Ion Batteries for Electric Vehicles in China. Sustainability 2017, 9, 504. [Google Scholar] [CrossRef]
  30. Ambrose, H.; Kendall, A. Effects of battery chemistry and performance on the life cycle greenhouse gas intensity of electric mobility. Transp. Res. D Transp. Environ. 2016, 47, 182–194. [Google Scholar] [CrossRef]
  31. Zackrisson, M.; Avellán, L.; Orlenius, J. Life cycle assessment of lithium-ion batteries for plug-in hybrid electric vehicles—Critical issues. J. Clean. Prod. 2010, 18, 1519–1529. [Google Scholar] [CrossRef]
  32. ISTAT. Popolazione Residente al 1° Gennaio: Piemonte. Available online: http://dati.istat.it/Index.aspx?QueryId=18540 (accessed on 18 January 2022).
  33. Minutolo, A.; Laurenti, M.A. Poggio di Legambiente, Mal’aria di città. 2021. [Google Scholar]
  34. Comune di Torino. Città di Torino-Limitazioni Alla Circolazione. Available online: http://www.comune.torino.it/emergenzaambientale/ (accessed on 18 January 2022).
  35. Gaines, L.; Richa, K.; Spangenberger, J. Key issues for Li-ion battery recycling. MRS Energy Sustain. 2018, 5, E14. [Google Scholar] [CrossRef]
  36. Nuss, P.; Eckelman, M.J. Life Cycle Assessment of Metals: A Scientific Synthesis. PLoS ONE 2014, 9, e101298. [Google Scholar] [CrossRef]
  37. Manjong, N.B.; Usai, L.; Burheim, O.S.; Strømman, A.H. Life cycle modelling of extraction and processing of battery minerals—A parametric approach. Batteries 2021, 7, 57. [Google Scholar] [CrossRef]
  38. European Commission. Critical Raw Materials. Available online: https://ec.europa.eu/growth/sectors/raw-materials/areas-specific-interest/critical-raw-materials_it (accessed on 18 February 2022).
  39. U.S. Geological Survey. Mineral Commodity Summaries. 2021. Available online: https://pubs.usgs.gov/periodicals/mcs2021/mcs2021.pdf (accessed on 15 February 2022).
  40. Xiong, S.; Ji, J.; Ma, X. Comparative Life Cycle Energy and GHG Emission Analysis for BEVs and PhEVs: A Case Study in China. Energies 2019, 12, 834. [Google Scholar] [CrossRef]
  41. GTT. Parco Veicoli-Schede Tecniche. 2021. Available online: https://www.gtt.to.it/cms/risorse/gruppo/veicoli/parco_veicoli_tpl.pdf (accessed on 18 January 2022).
  42. GTT. Bilancio di Sostenibilità. 2018. Available online: https://www.gtt.to.it/cms/risorse/gruppo/bilancio_sostenibilit%C3%A0_2018.pdf (accessed on 18 January 2022).
  43. Climate Transparency. Brown to Green Report. Available online: https://www.climate-transparency.org/g20-climate-performance/g20report2018#1531904263713-04b62b8d-e708 (accessed on 16 February 2022).
  44. European Environmental Agency. Greenhouse Gas Emission Intensity of Electricity Generation by Country. Available online: https://www.eea.europa.eu/data-and-maps/daviz/co2-emission-intensity-9#tab-googlechartid_googlechartid_googlechartid_chart_1111 (accessed on 16 February 2022).
  45. ISPRA. La Banca Dati dei Fattori di Emissione Medi per il Parco Circolante in Italia. Available online: https://fetransp.isprambiente.it/#/ (accessed on 10 March 2022).
  46. Jollife, I.T.; Cadima, J. Principal component analysis: A review and recent developments. Philos. Trans. R. Soc. A Math. Phys. Eng. Sci. 2016, 374, 20150202. [Google Scholar] [CrossRef]
  47. Ballabio, D. A MATLAB toolbox for Principal Component Analysis and unsupervised exploration of data structure. Chemom. Intell. Lab. Syst. 2015, 149, 1–9. [Google Scholar] [CrossRef]
  48. Song, Q.; Wang, Z.; Wu, Y.; Li, J.; Yu, D.; Duan, H.; Yuan, W. Could urban electric public bus really reduce the GHG emissions: A case study in Macau? J. Clean. Prod. 2018, 172, 2133–2142. [Google Scholar] [CrossRef]
  49. IPPC. Fifth Assessment Report-AR5. 2014. Available online: https://www.ipcc.ch/ (accessed on 18 January 2022).
  50. Fuglestvedt, J.S.; Shine, K.P.; Berntsen, T.; Cook, J.; Lee, D.S.; Stenke, A.; Skeie, R.B.; Velders, G.J.M.; Waitz, I.A. Transport impacts on atmosphere and climate: Metrics. Atmos. Environ. 2010, 44, 4648–4677. [Google Scholar] [CrossRef]
  51. Lammel, G.; Graßl, H. Greenhouse effect of NOX. Environ. Sci. Pollut. Res. 1995, 2, 40–45. [Google Scholar] [CrossRef]
  52. Sustainable Bus. 15 Iveco Urbanway Hybrids for Bruxelles. The First Group of a 141 Units Order. Available online: https://www.sustainable-bus.com/hybrid-bus/15-iveco-urbanway-hybrids-for-bruxelles-the-first-group-of-a-141-units-order/ (accessed on 23 November 2023).
  53. International Energy Agency. Trends in Batteries. Available online: https://www.iea.org/reports/global-ev-outlook-2023/trends-in-batteries (accessed on 23 November 2023).
  54. ecoQuery. Available online: https://ecoquery.ecoinvent.org/Account/LogOn?ReturnUrl=%2f (accessed on 16 February 2022).
  55. EEA. Explaining Road Transport Emissions. EEA Report; European Environment Agency: Copenhagen, Denmark, 2016; pp. 1–31. Available online: https://www.eea.europa.eu/publications/explaining-road-transport-emissions (accessed on 8 January 2024).
  56. Statista. Italy: Energy mix 2021 | Statista. Available online: https://www.statista.com/statistics/873552/energy-mix-in-italy/ (accessed on 27 November 2023).
Figure 1. Definition of system boundaries adopted in the selected LCA studies on LIB lifecycle: (B1) raw materials, (B2) cradle to gate, (B3) cradle to gate including use, (B4) use, (B5) cradle to grave, (B5–B4) cradle to grave excluding use, (B6) end of life.
Batteries 10 00090 g001
Figure 2. Composition of Turin urban bus fleet in 2021 and in the hypothesized scenarios. Scenario 1HYB: Euro 2, Euro 3, and Euro 4 Diesel (15% of the fleet) are replaced by hybrid buses; Scenario 2HYB: Euro 2, Euro 3, Euro 4, and EEV Diesel (43% of the fleet) are replaced by hybrid buses; Scenario 3HYB: Euro 2, Euro 3, Euro 4, EEV, and Euro 6 Diesel (53% of the fleet) are replaced by hybrid buses; Scenario 1EL: Euro 2, Euro 3, and Euro 4 Diesel buses (15% of the fleet) are replaced by electric buses; Scenario 2EL: Euro 2, Euro 3, Euro 4, and EEV Diesel (43% of the fleet) are replaced by electric buses; Scenario 3EL: Euro 2, Euro 3, Euro 4, EEV, and Euro 6 Diesel (53% of the fleet) are replaced by electric buses.
Batteries 10 00090 g002
Figure 3. Average GWP for (a) NMC-gr and (b) LFP-gr battery manufacturing. (The no. of references is given in parentheses. For each series, the blue circle represents an outlayer, “×” is the average value, and the line the median value. The bars represent the minimum and maximum value).
Batteries 10 00090 g003
Figure 4. Results of Principal Component Analysis (PCA) applied to the emission factors of different diesel and CNG bus categories: (a) loadings plot; (b) scores plot.
Batteries 10 00090 g004
Figure 5. Annual emissions of Turin urban bus fleet according to the hypothesized scenarios: (a) CO, VOC, NOx, CH4; (b) NMVOC, N2O, NH3, PM2.5, PM10, SO2, Pb, black carbon (all expressed as tCO2eq/year).
Batteries 10 00090 g005
Figure 6. Total annual emissions of Turin urban bus fleet according to the baseline and the hypothesized scenarios (tCO2eq/year).
Batteries 10 00090 g006
Table 1. Specifications and assumptions for the use phase of nickel manganese cobalt (NMC) and lithium iron phosphate (LFP) lithium-ion batteries considered in this review.
NMCLFPSource
Battery weight (kg)444494[40]
Battery capacity (kWh)17.147.5[40]
Fuel efficiency (electricity) (kWh/100 km)1515.3[40]
Charging efficiency (%)9090[14]
Total lifetime mileage (km) 120,000160,000[40]
Table 2. Total annual pollutant emissions calculated for Turin urban bus fleet (baseline).
PollutantTotal Annual Emissions (t)
CO102.12
VOC33.97
NOx358.04
NMVOC5.78
CH429.85
N2O0.84
NH30.29
PM 2.57.48
PM1010.78
SO20.15
Pb0.01
Black carbon2.38
CO269,016.27
Disclaimer/Publisher’s Note: The statements, opinions and data contained in all publications are solely those of the individual author(s) and contributor(s) and not of MDPI and/or the editor(s). MDPI and/or the editor(s) disclaim responsibility for any injury to people or property resulting from any ideas, methods, instructions or products referred to in the content.

