
Fast Impedance Spectrum Construction for Lithium-Ion Batteries Using a Multi-Density Clustering Algorithm


Abstract
1. Introduction
- (1)
- A density-based spatial clustering of applications with a noise-based (DBSCAN-based) impedance data processing method is proposed to utilize the distribution properties of the measurement points by PRBS excitation.
- (2)
- A parameter setting workflow was designed to properly cluster the data points of the impedance measured by DBSCAN, where the key parameters, that is, the neighborhood radius and the minimum number of points within the specific neighborhood, can be adjusted according to the frequency ranges.
- (3)
- The fast measurement of a battery’s impedance by integrating the PRBS and the data processing method was verified at various temperatures and SOCs on a 3 Ah lithium-ion battery.
2. The Principle of Rapid Measurement of a Battery’s Impedance Spectrum
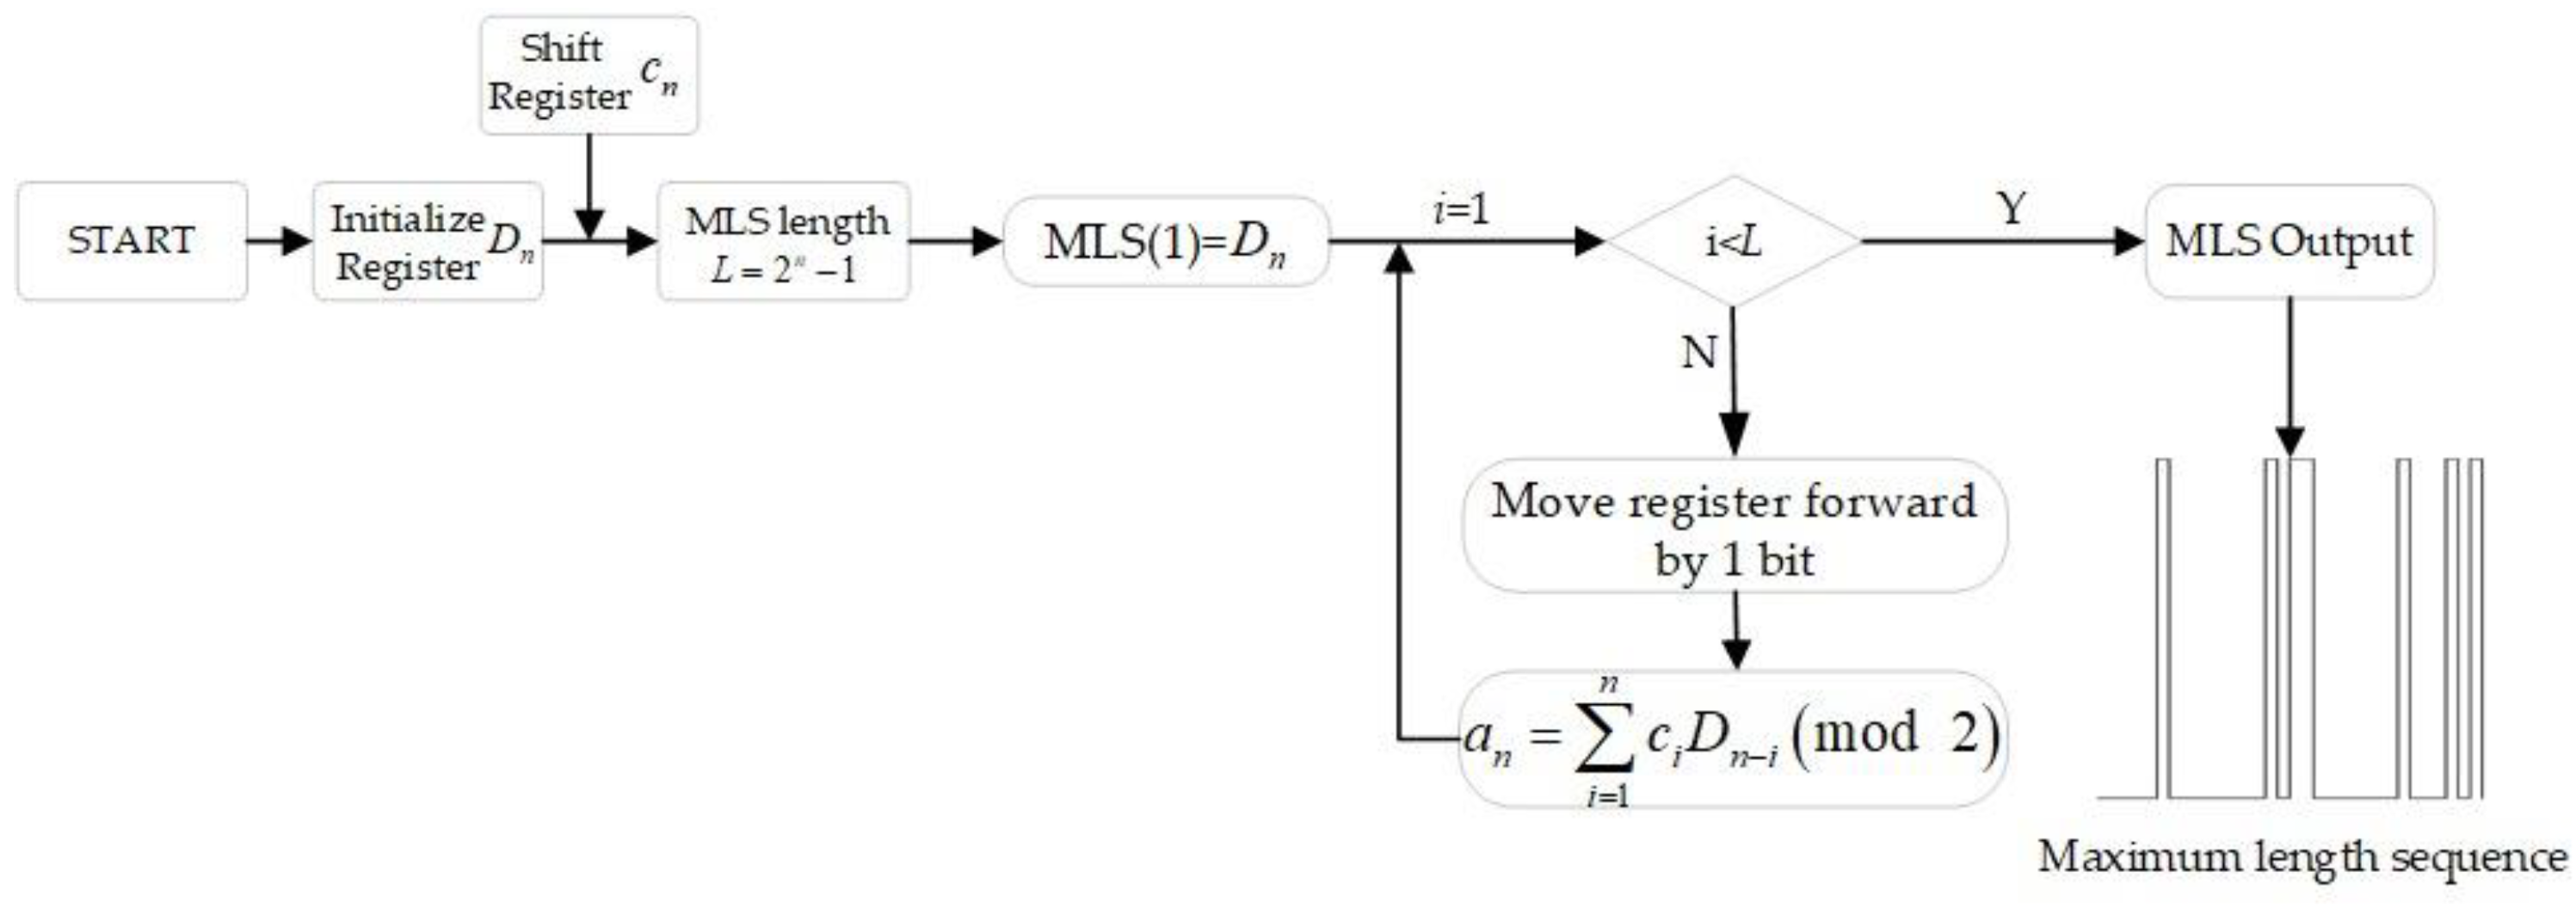
2.1. PRBS Generation
2.2. Calculation of the Battery’s Impedance
3. Extraction of the Lithium-Ion Battery’s EIS Using Multi-Density Data Clustering
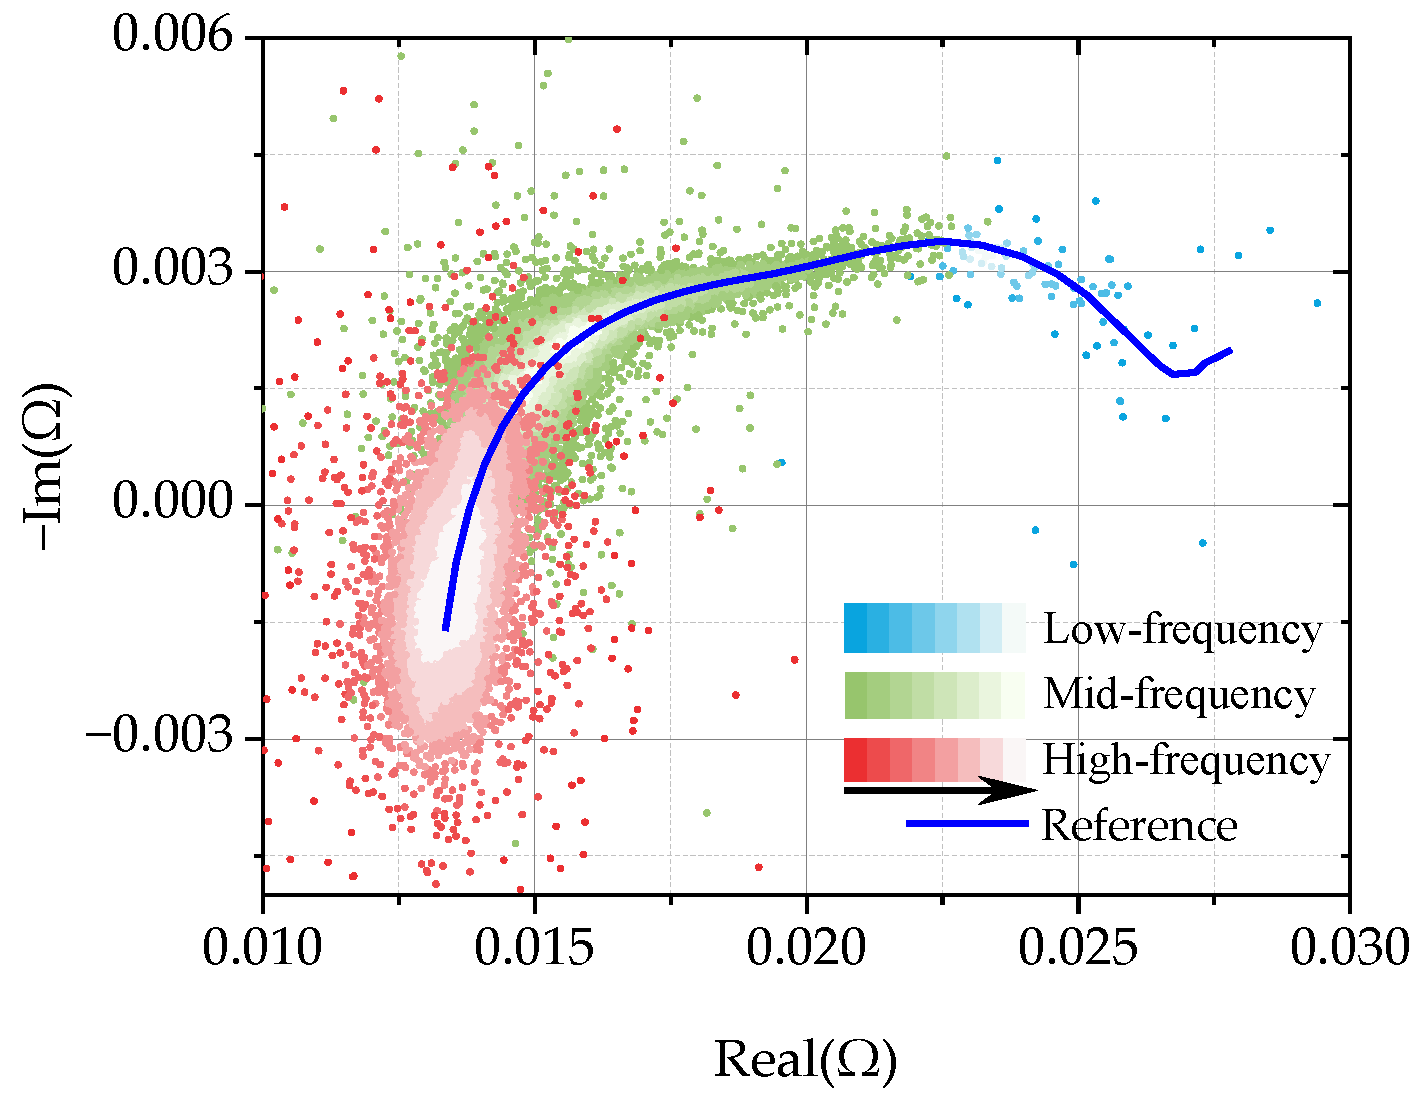
3.1. Characterization of the Distribution of Batteries’ Impedance Based on PRBS Excitation
3.2. Impedance Extraction Algorithm with DBSCAN
3.2.1. Parameters Setting for DBSCAN
- (1)
- Minpts
- (2)
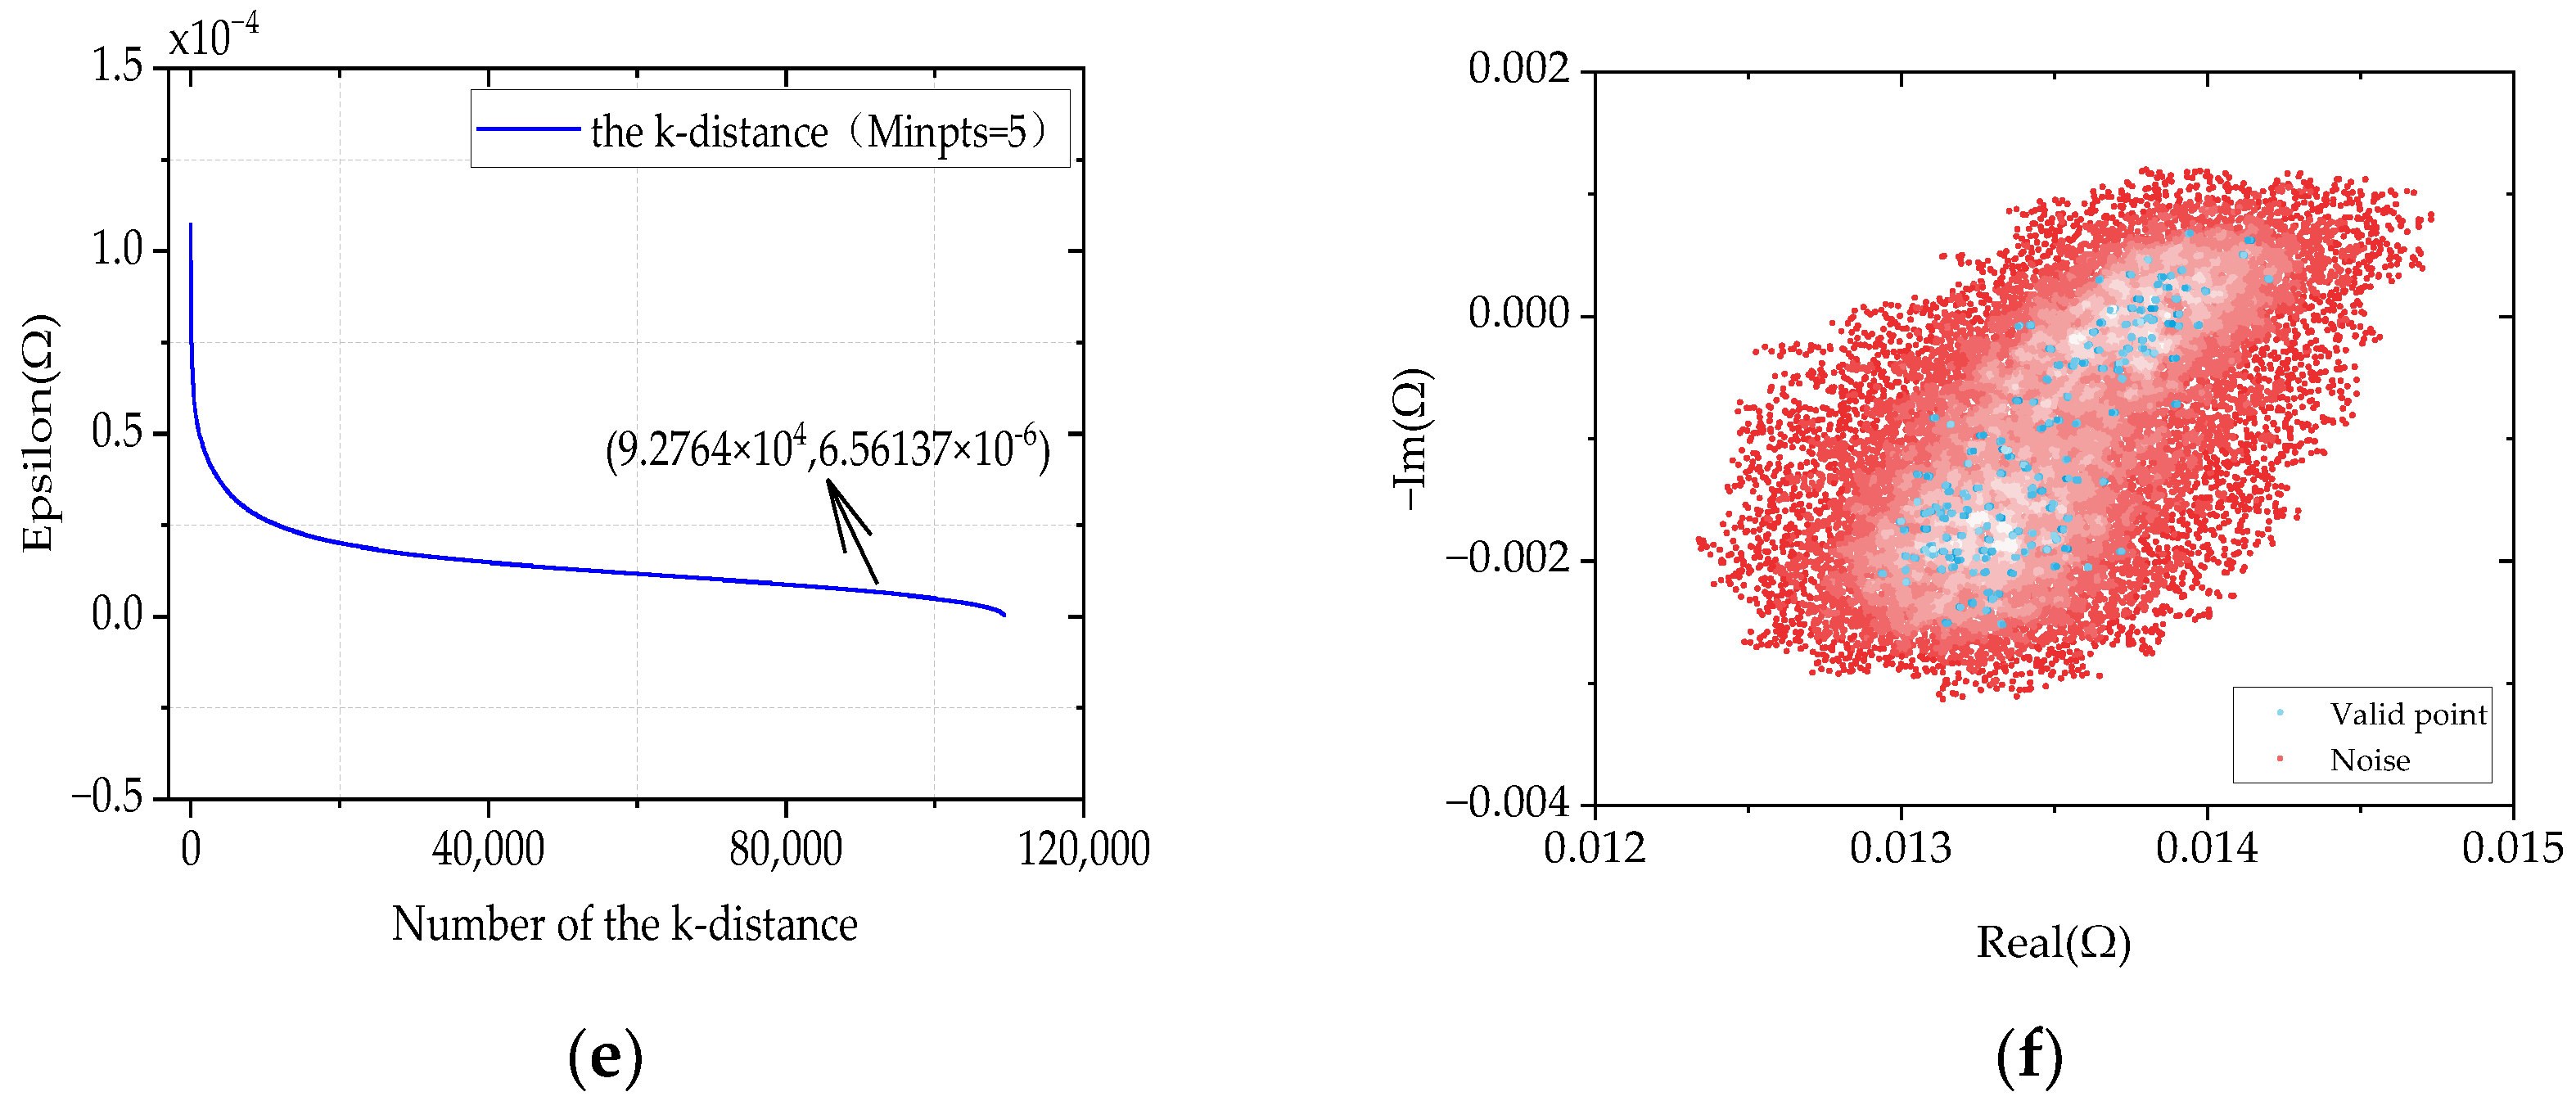
- Eps
3.2.2. Clustering Impedance Data
- (a)
- Determination of the cluster cores based on clustering parameters: if a data point has more than MinPts points in its neighborhood with a radius of Eps, this data point is marked as a core point. We can then find all core points in the dataset. The circles of different colors in subfigures (a) and (b) represent the neighborhood of the point with radius Eps.
- (b)
- Formation of a neighborhood chain: for each core point, find all points that are densely accessible from that core point, forming a chain of neighborhoods.
- (c)
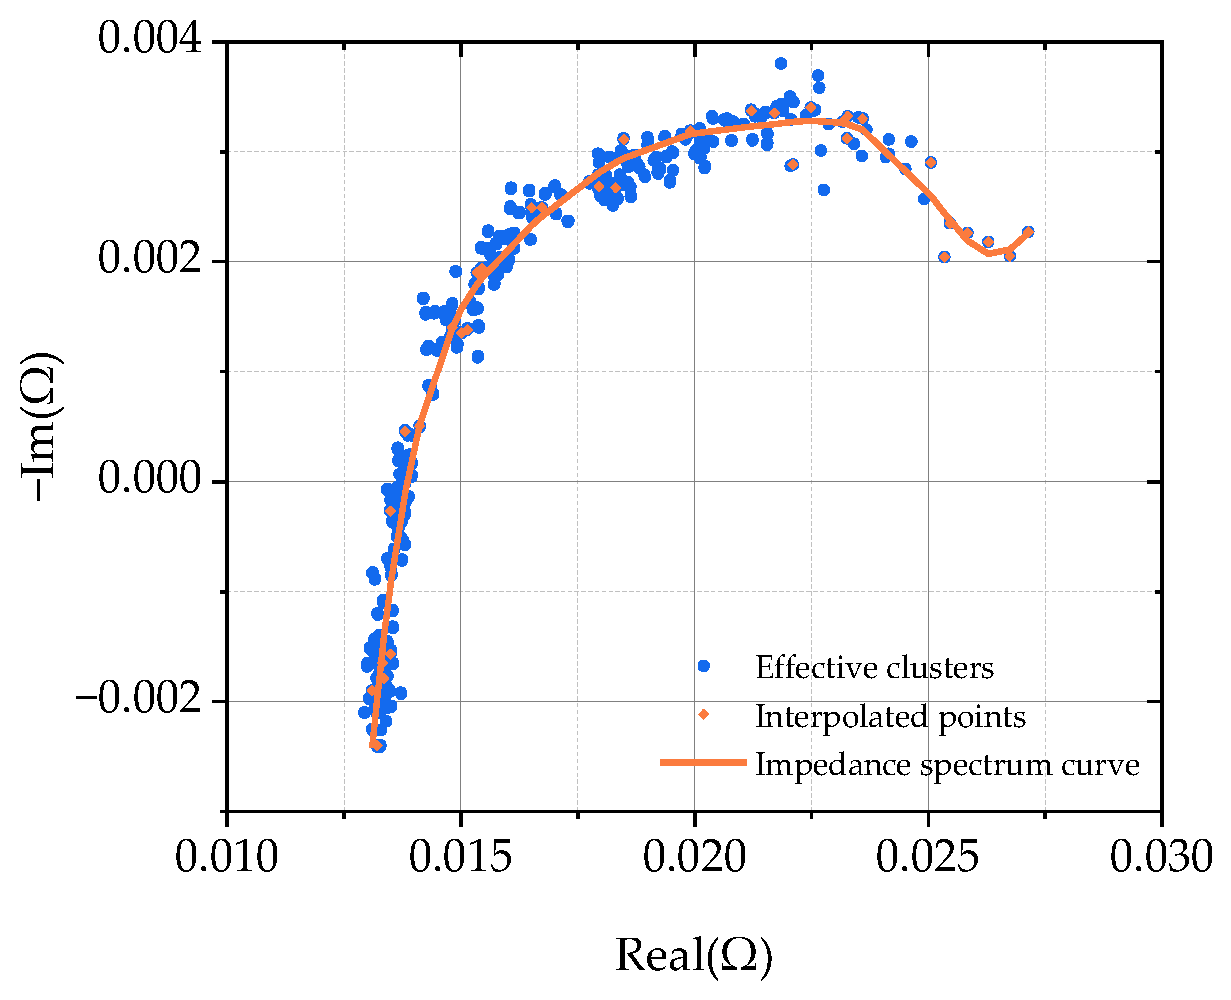
- Labeling the cluster classes and noise points: All points contained in a neighborhood chain are labeled as a cluster class, boundary points are assigned to the core point cluster class to which they are connected, and points that are not assigned to any cluster class are labeled as noise. The entire impedance test dataset is scanned and then labeled with noise points and several data clusters consisting of core and boundary points.
3.2.3. The Proposed Multi-Density Clustering Algorithm
| Algorithm 1 The proposed multi-density clustering algorithm. |
| Input: Dataset: D = {x1,x2, …,xm}, Eps:, MinPts |
| 1. Ω |
| 2. for j = 1,2,…, m do |
| 3. if then |
| 4. Ω = Ω ∪ {xj} |
| 5. end if |
| 6. end for |
| 7. k = 0 |
| 8. = D |
| 9. while do |
| 10. |
| 11. Q = <o> |
| 12. |
| 13. while do |
| 14. if then |
| 15. |
| 16. |
| 17. end if |
| 18. end while |
| 19.k = k+1, |
| 20. Ω = Ω\Ck |
| 21. end while |
| Output: Clustering result: C = {C1,C2, …,Ck} |
4. Experimental Verification
4.1. Experimental Platform
4.2. Validation of the Impedance Measurement
4.3. Validation at Different SOCs and Temperatures
5. Conclusions
Author Contributions
Funding
Data Availability Statement
Conflicts of Interest
References
- Lawder, M.T.; Suthar, B.; Northrop, P.W.C.; De, S.; Hoff, C.M.; Leitermann, O.; Crow, M.L.; Santhanagopalan, S.; Subramanian, V.R. Battery Energy Storage System (BESS) and Battery Management System (BMS) for Grid-Scale Applications. Proc. IEEE 2014, 102, 1014–1030. [Google Scholar] [CrossRef]
- Xiong, R.; Pan, Y.; Shen, W.; Li, H.; Sun, F. Lithium-Ion Battery Aging Mechanisms and Diagnosis Method for Automotive Applications: Recent Advances and Perspectives. Renew. Sustain. Energy Rev. 2020, 131, 110048. [Google Scholar] [CrossRef]
- Han, X.; Ouyang, M.; Lu, L.; Li, J. Cycle Life of Commercial Lithium-Ion Batteries with Lithium Titanium Oxide Anodes in Electric Vehicles. Energies 2014, 7, 4895–4909. [Google Scholar] [CrossRef]
- Qays, M.O.; Buswig, Y.; Hossain, M.L.; Abu-Siada, A. Recent Progress and Future Trends on State of Charge Estimation Methods to Improve Battery-Storage Efficiency: A Review. CSEE J. Power Energy Syst. 2019, 8, 105–114. [Google Scholar] [CrossRef]
- Hao, X.; Wu, J. Online State Estimation Using Particles Filters of Lithium-Ion Polymer Battery Packs for Electric Vehicle. In Proceedings of the 2015 IEEE International Conference on Systems, Man, and Cybernetics, Hong Kong, China, 9–12 October 2015; pp. 783–788. [Google Scholar] [CrossRef]
- Meng, J.; Cai, L.; Stroe, D.-I.; Luo, G.; Sui, X.; Teodorescu, R. Lithium-Ion Battery State-of-Health Estimation in Electric Vehicle Using Optimized Partial Charging Voltage Profiles. Energy 2019, 185, 1054–1062. [Google Scholar] [CrossRef]
- Hannan, M.A.; Lipu, M.S.H.; Hussain, A.; Mohamed, A. A Review of Lithium-Ion Battery State of Charge Estimation and Management System in Electric Vehicle Applications: Challenges and Recommendations. Renew. Sustain. Energy Rev. 2017, 78, 834–854. [Google Scholar] [CrossRef]
- Peng, J.; Meng, J.; Chen, D.; Liu, H.; Hao, S.; Sui, X.; Du, X. A Review of Lithium-Ion Battery Capacity Estimation Methods for Onboard Battery Management Systems: Recent Pro-Gress and Perspectives. Batteries 2022, 8, 229. [Google Scholar] [CrossRef]
- Meng, J.; Luo, G.; Ricco, M.; Swierczynski, M.; Stroe, D.-I.; Teodorescu, R. Overview of Lithium-Ion Battery Modeling Methods for State-of-Charge Estimation in Electrical Vehicles. Appl. Sci. 2018, 8, 659. [Google Scholar] [CrossRef]
- Li, L.; Li, Y.; Cui, W.; Chen, Z.; Wang, D.; Zhou, B.; Hong, D. A Novel Health Indicator for Online Health Estimation of Lithium-Ion Batteries Using Partial Incremental Capacity and Dynamic Voltage Warping. J. Power Sources 2022, 545, 231961. [Google Scholar] [CrossRef]
- Feng, X.; Ouyang, M.; Liu, X.; Lu, L.; Xia, Y.; He, X. Thermal Runaway Mechanism of Lithium Ion Battery for Electric Vehicles: A Review. Energy Storage Mater. 2018, 10, 246–267. [Google Scholar] [CrossRef]
- Han, X.; Lu, L.; Zheng, Y.; Feng, X.; Li, Z.; Li, J.; Ouyang, M. A Review on the Key Issues of the Lithium Ion Battery Degradation among the Whole Life Cycle. eTransportation 2019, 1, 100005. [Google Scholar] [CrossRef]
- Gao, Y.; Jiang, J.; Zhang, C.; Zhang, W.; Jiang, Y. Aging Mechanisms under Different State-of-Charge Ranges and the Multi-Indicators System of State-of-Health for Lith-Ium-Ion Battery with Li(NiMnCo)O2 Cathode. J. Power Sources 2018, 400, 641–651. [Google Scholar] [CrossRef]
- Huang, Q.; Shen, Y.; Huang, Y.; Zhang, L.; Zhang, J. Electrochimica Acta Impedance Characteristics and Diagnoses of Automotive Lithium-Ion. Electrochim. Acta 2016, 219, 751–765. [Google Scholar] [CrossRef]
- Wang, X.; Wei, X.; Chen, Q.; Dai, H. A Novel System for Measuring Alternating Current Impedance Spectra of Series-Connected Lithium-Ion Batteries with a High-Power Dual Active Bridge Converter and Distributed Sampling Units. IEEE Trans. Ind. Electron. 2021, 68, 7380–7390. [Google Scholar] [CrossRef]
- Du, X.; Meng, J.; Peng, J.; Zhang, Y.; Liu, T.; Teodorescu, R. Sensorless Temperature Estimation of Lithium-Ion Battery Based on Broadband Impedance Measurements. IEEE Trans. Power Electron. 2022, 37, 10101–10105. [Google Scholar] [CrossRef]
- Cai, J.; Zhang, L.; Wang, X.; Zhu, J.; Yuan, Y.; Wang, Y.; Wei, X.; Dai, H. Investigation of an M-Sequence Based Impedance Spectrum Acquisition Method for Lithium-Ion Batteries from the Engineering Application Perspective. J. Energy Storage 2023, 59, 106428. [Google Scholar] [CrossRef]
- Shu, X.; Yang, W.; Yang, B.; Wei, K.; Punyawudho, K.; Liu, C. Research on EIS Characterization and Internal Morphological Changes of LIBs during Degradation Process. Eng. Fail. Anal 2024, 155, 107764. [Google Scholar] [CrossRef]
- Buchicchio, E.; De Angelis, A.; Santoni, F.; Carbone, P.; Bianconi, F.; Smeraldi, F. Battery SOC Estimation from EIS Data Based on Machine Learning and Equivalent Circuit Model. Energy 2023, 283, 128461. [Google Scholar] [CrossRef]
- Li, J.; Zhao, S.; Miah, M.S.; Niu, M. Remaining Useful Life Prediction of Lithium-Ion Batteries via an EIS Based Deep Learning Approach. Energy Rep. 2023, 10, 3629–3638. [Google Scholar] [CrossRef]
- De Angelis, A.; Buchicchio, E.; Santoni, F.; Moschitta, A.; Carbone, P. Practical Broadband Measurement of Battery EIS. In Proceedings of the 2021 IEEE International Workshop on Metrology for Automotive, MetroAutomotive, Bologna, Italy, 1–2 July 2021; pp. 25–29. [Google Scholar] [CrossRef]
- Wang, X.; Kou, Y.; Wang, B.; Jiang, Z.; Wei, X.; Dai, H. Fast Calculation of Broadband Battery Impedance Spectra Based on S Transform of Step Disturbance and Response. IEEE Trans. Transp. Electrif. 2022, 7782, 3659–3672. [Google Scholar] [CrossRef]
- Roinila, T.; Abdollahi, H.; Santi, E. Frequency-Domain Identification Based on Pseudorandom Sequences in Analysis and Control of Dc Power Distribution Systems: A Review. IEEE Trans. Power Electron 2021, 36, 3744–3756. [Google Scholar] [CrossRef]
- Sihvo, J.; Messo, T.; Roinila, T.; Luhtala, R. Online Internal Impedance Measurements of Li-Ion Battery Using PRBS Broadband Excitation and Fourier Techniques: Methods and Injection Design. In Proceedings of the 2018 International Power Electronics Conference, IPEC-Niigata—ECCE Asia 2018, Niigata, Japan, 20–24 May 2018; pp. 2470–2475. [Google Scholar]
- Sihvo, J.; Messo, T.; Roinila, T.; Luhtala, R.; Stroe, D.I. Online Identification of Internal Impedance of Li-Ion Battery Cell Using Ternary-Sequence Injection. In Proceedings of the 2018 IEEE Energy Conversion Congress and Exposition, ECCE 2018, Portland, OR, USA, 23–27 September 2018; pp. 2705–2711. [Google Scholar]
- Sihvo, J.; Stroe, D.I.; Messo, T.; Roinila, T. Fast Approach for Battery Impedance Identification Using Pseudo-Random Sequence Signals. IEEE Trans. Power Electron. 2020, 35, 2548–2557. [Google Scholar] [CrossRef]
- Du, X.; Du, X.; Meng, J.; Meng, J.; Peng, J.; Peng, J. Hybrid Pseudorandom Sequence for Broadband Impedance Measurements of Lithium-Ion Batteries. IEEE Trans. Ind. Electron. 2022, 70, 6856–6864. [Google Scholar] [CrossRef]
- Zhang, Y.; Du, X.; Meng, J.; Jiang, Q.; Peng, J.; Liu, T. Rapid Broadband Impedance Acquisition of Lithium-Ion Batteries Based on Measurement Evaluating and Impedance Filtering. IEEE Trans. Transp. Electrif. 2023, 9, 4888–4897. [Google Scholar] [CrossRef]
- Sihvo, J.; Roinila, T.; Stroe, D.I. Novel Fitting Algorithm for Parametrization of Equivalent Circuit Model of Li-Ion Battery from Broadband Impedance Measurements. IEEE Trans. Ind. Electron. 2021, 68, 4916–4926. [Google Scholar] [CrossRef]
- Gücin, T.N.; Ovacik, L. Online Impedance Measurement of Batteries Using the Cross-Correlation Technique. IEEE Trans. Power Electron. 2020, 35, 4365–4375. [Google Scholar] [CrossRef]
- Peng, J.; Meng, J.; Du, X.; Cai, L.; Stroe, D.I. A Fast Impedance Measurement Method for Lithium-Ion Battery Using Power Spectrum Property. IEEE Trans. Ind. Inform. 2023, 19, 8253–8261. [Google Scholar] [CrossRef]
- Meng, J.; Peng, J.; Cai, L.; Song, Z. Rapid Impedance Extraction for Lithium-Ion Battery by Integrating Power Spectrum and Frequency Property. IEEE Trans. Ind. Electron. 2023, 1–10. [Google Scholar] [CrossRef]


| Nominal Capacity | Voltage Range | Maximum Current |
|---|---|---|
| 3000 mAh | 2.0–4.25 V | 30 A |
| Frequencies | Times | MinPts | Eps |
|---|---|---|---|
| High frequency | 1 | 5 | 6.25 × 10⁻⁴ |
| 2 | 5.85 × 10⁻⁵ | ||
| 3 | 6.56 × 10⁻⁶ | ||
| Mid-frequency | 1 | 4 | 2.65 × 10⁻⁴ |
| 2 | 6.30 × 10⁻⁵ | ||
| 3 | 9.64 × 10⁻⁶ | ||
| Low frequency | 1 | 3 | 1.04 × 10⁻³ |
| 2 | 2.77 × 10⁻⁴ | ||
| 3 | 1.30 × 10⁻⁵ |
Disclaimer/Publisher’s Note: The statements, opinions and data contained in all publications are solely those of the individual author(s) and contributor(s) and not of MDPI and/or the editor(s). MDPI and/or the editor(s) disclaim responsibility for any injury to people or property resulting from any ideas, methods, instructions or products referred to in the content. |
© 2024 by the authors. Licensee MDPI, Basel, Switzerland. This article is an open access article distributed under the terms and conditions of the Creative Commons Attribution (CC BY) license (https://creativecommons.org/licenses/by/4.0/).
Share and Cite
Zhu, L.; Peng, J.; Meng, J.; Sun, C.; Cai, L.; Qu, Z. Fast Impedance Spectrum Construction for Lithium-Ion Batteries Using a Multi-Density Clustering Algorithm. Batteries 2024, 10, 112. https://doi.org/10.3390/batteries10030112
Zhu L, Peng J, Meng J, Sun C, Cai L, Qu Z. Fast Impedance Spectrum Construction for Lithium-Ion Batteries Using a Multi-Density Clustering Algorithm. Batteries. 2024; 10(3):112. https://doi.org/10.3390/batteries10030112
Chicago/Turabian StyleZhu, Ling, Jichang Peng, Jinhao Meng, Chenghao Sun, Lei Cai, and Zhizhu Qu. 2024. "Fast Impedance Spectrum Construction for Lithium-Ion Batteries Using a Multi-Density Clustering Algorithm" Batteries 10, no. 3: 112. https://doi.org/10.3390/batteries10030112
APA StyleZhu, L., Peng, J., Meng, J., Sun, C., Cai, L., & Qu, Z. (2024). Fast Impedance Spectrum Construction for Lithium-Ion Batteries Using a Multi-Density Clustering Algorithm. Batteries, 10(3), 112. https://doi.org/10.3390/batteries10030112