Abstract
The market for electric vehicles (EVs) has been growing in popularity, and by 2027, it is predicted that the market valuation will reach $869 billion. To support the growth of EVs in public road safety, advances in battery safety research for EV application should achieve low-cost, lightweight, and high safety protection. In this research, the development of a lightweight, crashworthy battery protection system using an excellent energy absorption capability is carried out. The lightweight structure was developed by using metastructure constructions with an arrangement of repeated lattice cellular structures. Three metastructure configurations (bi-stable, star-shaped, double-U) with their geometrical variables (thickness, inner spacing, cell stack) and material types (stainless steel, aluminium, and carbon steel) were evaluated until the maximum Specific Energy Absorptions (SEA) value was attained. The Finite Element Method (FEM) is utilised to simulate the mechanics of impact and calculate the optimum SEA of the various designs using machine learning methodology. Latin Hypercube Sampling (LHS) was used to derive the design variation by dividing the variables into 100 samples. The machine learning optimisation method utilises the Artificial Neural Networks (ANN) and Non-dominated Sorting Genetic Algorithm-II (NSGA-II) to forecast the design that produces maximum SEA. The optimum control variables are star-shaped cells consisting of one vertical unit cell using aluminium material with a cross-section thickness of 2.9 mm. The optimum design increased the SEA by 5577% compared to the baseline design. The accuracy of the machine learning prediction is also verified using numerical simulation with a 2.83% error. Four different sandwich structure configurations are then constructed using the optimal geometry for prismatic battery protection subjected to ground impact loading conditions. An optimum configuration of core cells arrangement results in a maximum displacement of 7.33 mm for the prismatic battery in the ground impact simulation, which is still less than the deformation threshold for prismatic battery safety of 10.423 mm. It is shown that the lightweight metastructure is very efficient for prismatic battery protection subjected to ground impact loading conditions.
1. Introduction
In recent years, electric vehicle usage and popularity have been growing steadfastly. The Mobility Market Outlook report from Statista estimates that the worldwide sales of electric vehicles will reach $384 billion by 2022 [1]. According to the analysis, in 2027, it is predicted that the combined market value of electric vehicles will be $869 billion, surpassing the sales of internal combustion engine vehicles. Global electric vehicles are too new to project a certain future trajectory, but the market is expected to accelerate exponentially due to their cost/energy efficiency, improved performance, and limited environmental impact. Over 3.2 million new plug-in vehicles were listed worldwide in the year’s first half [2].
The increasing growth of electric vehicles has increased the significance of battery usages while also emphasising the need to develop their safety. Lithium-ion batteries are currently used in most of today’s electric vehicles due to excellent performance at high temperatures, low self-discharge, high power-to-weight ratio, and elevated energy efficiency [3]. Research and development have proceeded to lower the cost of Li-ion batteries, increase their usable life, and solve overheating safety concerns.
While the batteries are intact and free of flaws, lithium batteries are usually secure and not likely to explode. Li-ion battery damage from a crash can happen quickly or gradually and present the risks of fire or explosion [4]. The Li-ion battery in a moving vehicle always functions at different speeds and accelerations. A moving battery is subject to local stresses and deformations that, in extreme circumstances, such as car accidents, may cause local cell damage [5]. An increase in battery temperature could set off more unfavourable mechanisms and result in thermal runaway, an uncontrollable situation where the battery produces too much heat [6]. Therefore, safeguarding Li-ion cells from harm caused by crashes is a key challenge. Battery packs are positioned away from impact areas and from where foreign things could penetrate. However, for bigger electric vehicles, the floor battery pack arrangement exposes the battery to serious damage from ground impact, including localised indentation, piercing, and fracture of its bottom construction [7].
Improving the protection system becomes a priority to limit deformation during impact and lower incident risk. A crashworthy battery protector should be extremely light to conserve energy, strong enough to prevent excessive deformation, and have excellent energy absorption capabilities. Many designs, including sandwich structures, have been researched as Li-ion battery shields. The sandwich structure consists of a pair of skins that is strong, thin, and stiff, which becomes a cover on the upper and lower parts; the thick but light core material is placed in the middle of the skins as a load transfer medium, usually using cell-shaped material with less rigid and ultra-low-density material. These structures’ light weight and high energy absorption capability make them popular in the construction and aerospace industries [8,9].
Different structures, including metastructure, can be placed within the sandwich structure’s core [9]. Metastructures, which are lighter than comparable solid structures, form by repeatedly arranging unit cell structures. Metastructure can be classified using a variety of structures, with human bones and honeycomb-like beehive structures as two examples found in nature. Because of its lightweight characteristics and strength, metastructure has significant potential for high energy absorption. For this reason, the metastructure-filled sandwich structure make it a viable candidate for use as a battery protection system.
One of the smallest unit cells in the metastructure is the bi-stable element, which is becoming increasingly popular as a basic element due to its ability to easily support loads and be manufactured using additive manufacturing techniques [10]. While other bi-stable unit cell components appear rigid, the curved section is first constructed as a curved clamped beam [11]. Their multi-stability allows their curved shell designs to create newly architected metamaterials to trap energy [12]. Due to the instability of the buckling that initiates the bi-stable snap-through behaviour, this structure with negative stiffness characteristics will experience greater deformation, preserve its deformed shape, and trap the crushing energy. As a result, it is very suitable as an energy-absorbing element.
Another type of metastructure is the auxetic structure [13]. Due to its exact geometric configuration and mechanical deformation of its microstructures, auxetic material shrinks laterally when crushed because it has a negative Poisson’s ratio [14]. As a result, this material exhibits exceptional shear stiffness, excellent fracture toughness, remarkable indentation resistance, and unusual energy absorption capabilities. Because the auxetic structure is drawn to the impact location, it also has a smaller peak crushing force, which lessens damage and harm to the protected object [14]. With its remarkable and unique features, the auxetic structure has great potential for many applications, such as protection work and variable-type aerospace wingtips [15]. The auxetic patterns explored in this research are star-shaped and double-U honeycomb (DUH).
Previous research has been focused on the optimisation design of different metastructure configurations with a wide range of optimisation methods, including topological, multi-objective, Design for Six Sigma (DFSS), machine learning-based, etc. Filho et al. [16] performed a multi-objective optimisation of sustainable sandwich panels with perforated foam cores to withstand impact loads. The research by Francisco et al. [17] centred on optimising the double arrowhead auxetic model using the multi-objective Lichtenberg algorithm. Nasrullah et al. [18] explored the topology optimisation of lattice structure configuration design for crashworthy components. The study by Kirana [19] carried out the optimisation of the bi-stable metastructure configuration subjected to explosive and compressive loads to present the energy-absorbing mechanism using the Taguchi method with an L16′ orthogonal array. Biharta et al. [20] developed an auxetic-based 3D sandwich architecture to protect an electric vehicle pouch battery from ground impact stress. The auxetic structures were optimised using Taguchi’s DFSS method to increase the specific energy absorbed. Another relevant research is from Carakapurwa et al. [21], who used machine learning to predict the best protection system for pouch batteries by optimising several 2D auxetic configurations (re-entrant, double-arrow, star-shaped, DUH), material, and geometric variables.
To address the gaps from previous research regarding application and design variables, this research will focus on optimising the electric vehicle prismatic battery protection system to resist ground impact using a sandwich metastructure configuration. Based on studies by Xia et al. [7], the sandwich structure was positioned on the floor structure of the vehicle and simulated to withstand an impact from an oncoming impactor that came from below. The prismatic Li-ion battery modelled and experimentally tested in the study by Reynolds et al. [22] formed the basis for the battery system used in this research.
Bi-stable [19], star-shape [23], and double-u honeycomb [24] 3D configurations were the different types of geometry for the metastructure studied, while the material type was limited to SS304, Al6061, and ST37. The machine learning optimisation method was implemented to vary these variables to forecast the ideal configuration. To acquire the SEA for every sample in the data sampling process, 100 samples were constructed using LHS and manually simulated through FEM. The whole input and SEA values datasets were then processed through data training using ANN to develop a mathematical model that predicted SEA. As the final optimisation stage, the NSGA-II was used to iterate the variables in search of the maximum SEA.
The optimised metastructure design predicted by machine learning was modelled in an entire battery system simulation exposed to a dynamic impact to validate its accuracy and safety capability. The crashworthiness of the entire battery system and optimised structure was evaluated using a prismatic battery failure threshold, which fails when the deformation exceeds 10.423 mm [22]. If the battery’s deformation is less than the failure limit, the system can safeguard against severe deformation.
The objective of the battery protection structure’s optimisation and analysis is to offer the best possible solution for the safety of electric vehicle Li-ion batteries. Future uses for electric vehicles may benefit from implementing the design of battery protection against thermal runaways presented in this research. Machine learning optimisation can also offer strong solutions to determine outstanding SEA value.
2. Geometry and Numerical Model
2.1. Bi-Stable Design
Optimisation of 3D bi-stable meta-structure using Taguchi’s DFSS method had been researched for explosive and compressive loads. Basic geometry from Kirana’s optimised 3D beam-type metastructure [19] was chosen as the preliminary baseline model to study its crashworthiness performance. The geometric model replicated the model from Zhang et al. [25] by adjusting several parameters. Preliminary modelling and simulation were used to find accurate settings and validate the model. The dimensions listed in Table 1 Figure 1 were used to build the baseline model. Two, two-dimensional unit cells were combined and joined in the middle to form a 3D metastructure unit cell, as shown in Figure 2.

Table 1.
Metastructure configuration unit cell specifications.
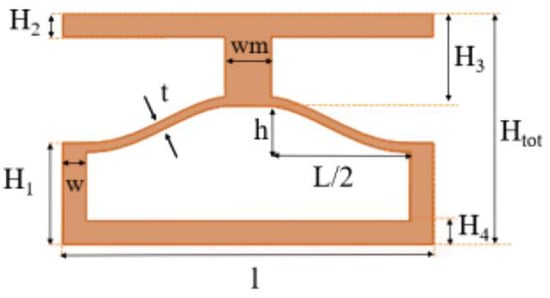
Figure 1.
2D unit cell of beam-type metastructure configuration.
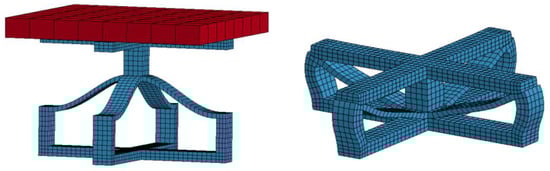
Figure 2.
3D bi-stable baseline configuration with an impactor (left), and its crushing result (right).
The simulation was performed using LS-DYNA explicit numerical simulation. The impactor is modelled as a solid rigid box that measures mm, weighs 500 kg, and moves at a constant 15 m/s velocity. The material used for this model is Stainless Steel SS304 with properties defined from MatWeb, Blacksburg, VA, USA [26].
2.2. Result Validation
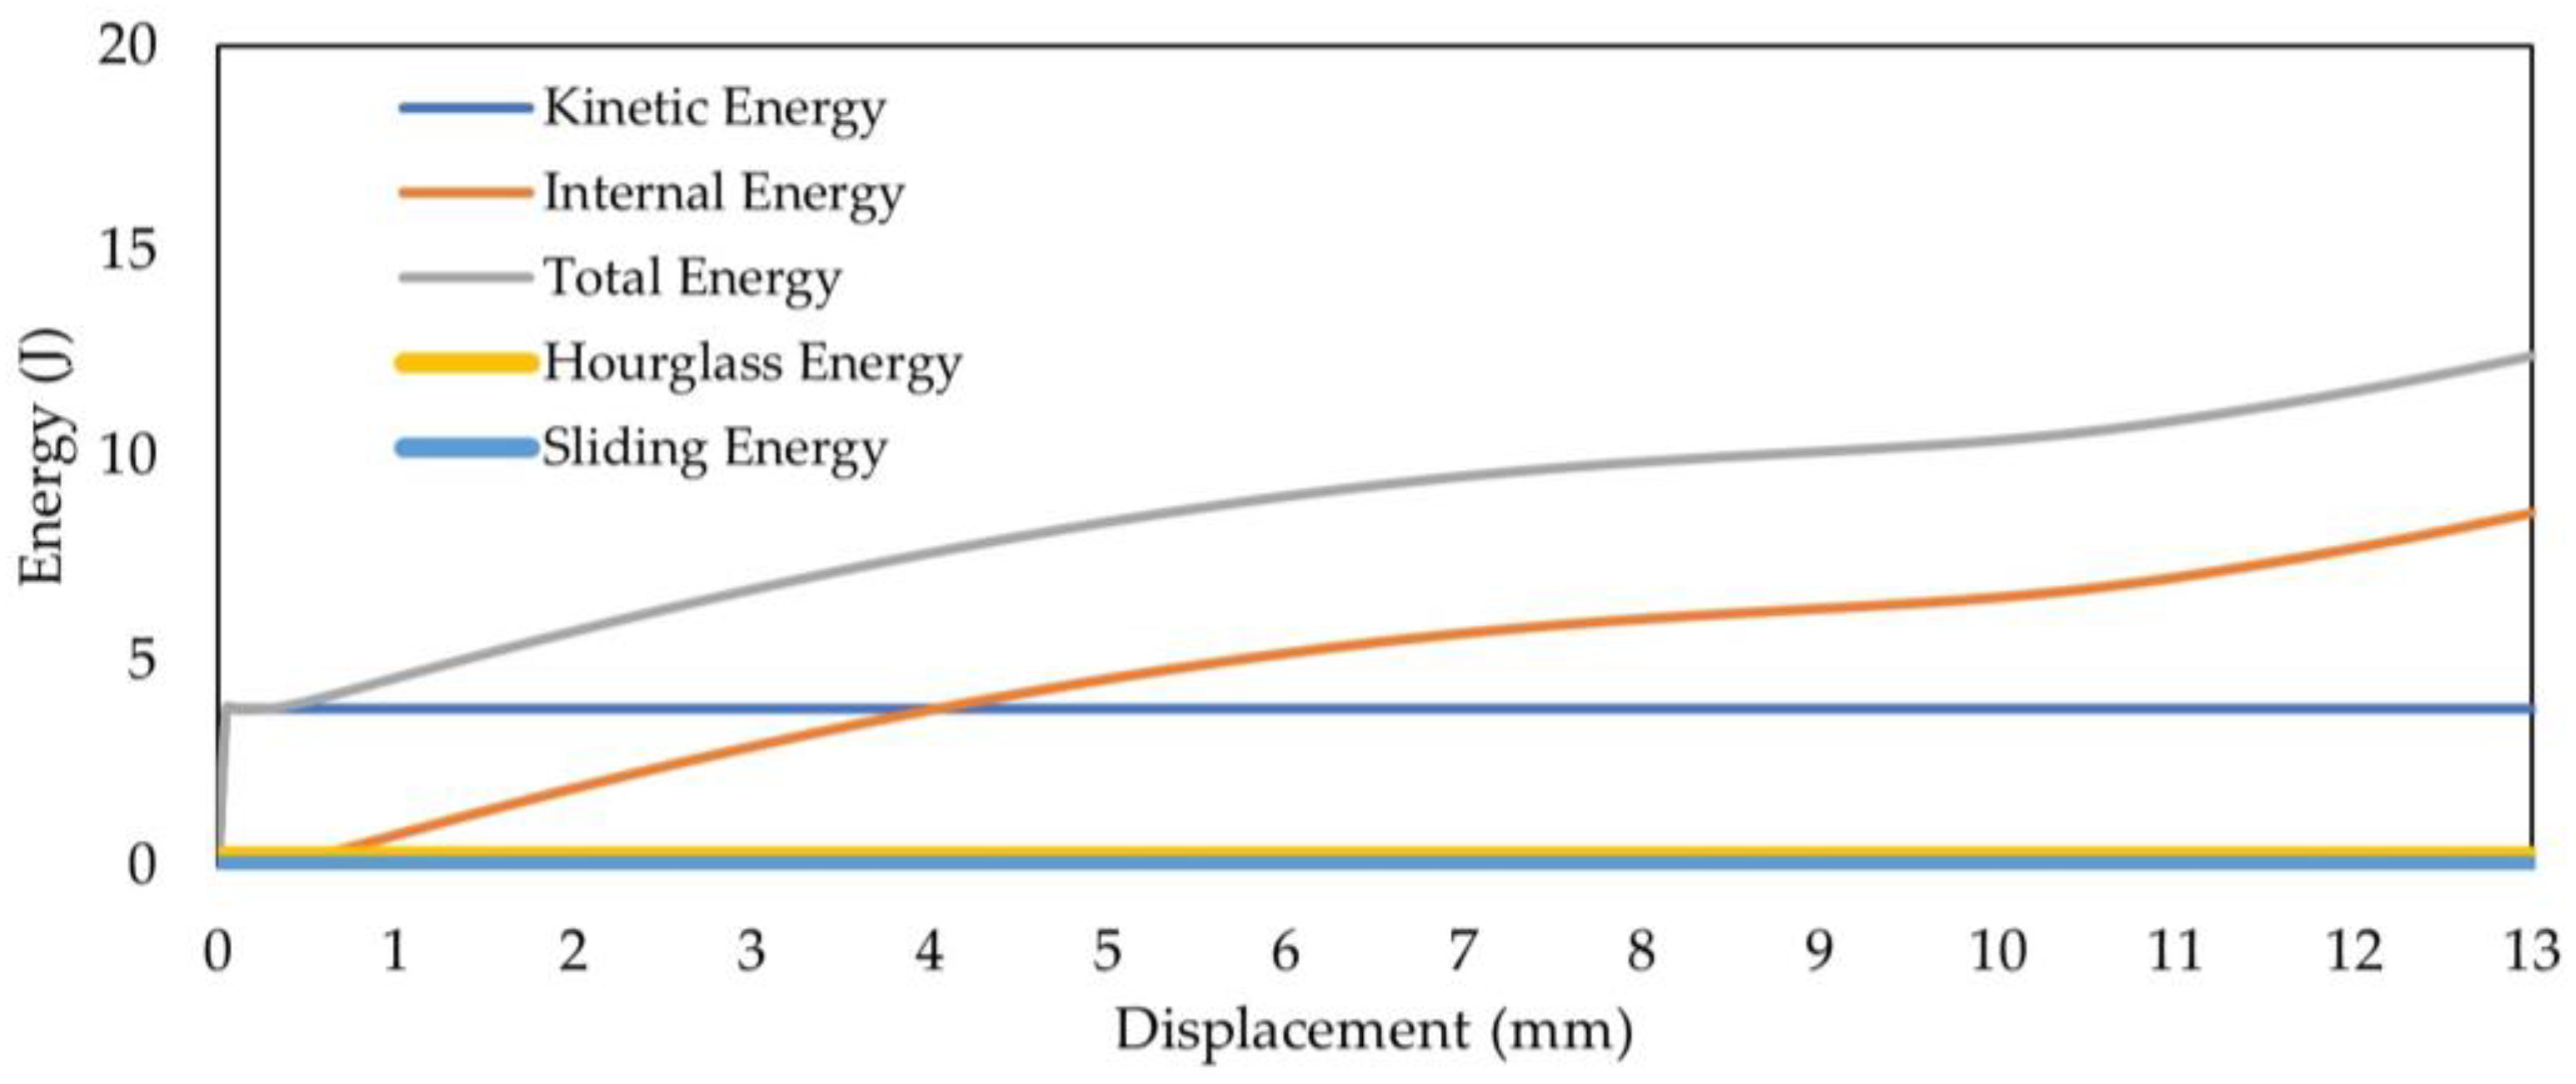
To validate the result of this simulation, the force vs. displacement and energy vs. displacement curves were observed in Figure 3 and Figure 4. The slow increase in structural internal energy during quasi-static loading shows the structure’s capacity to absorb impact energy. Over time, the kinetic energy value remains constant and is less than the internal energy. This is consistent with the definition of quasi-static, where the process occurs little by little and resembles a static case in which the inertial effect can be negligible. Furthermore, the sliding and hourglass energy values are both positive and significantly small in relation to the total energy. Therefore, the numerical model is presumed to be valid enough to define the actual model.
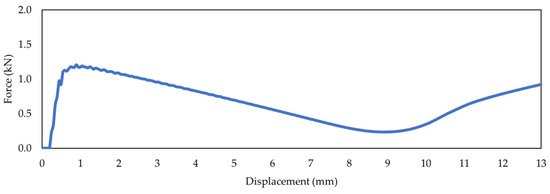
Figure 3.
Crushing force vs. displacement curve baseline model.

Figure 4.
Energy vs. displacement curve baseline model.
3. Metastructure Configurations Modelling and Machine Learning Optimisation
3.1. Data Sampling Process
Estimating the size of the sample required for the ANN model’s input was done via data sampling. The training and the validation data are two separate datasets for this data. With the help of these data, a regressor model is constructed to forecast the variables of an output from an input. Data are employed in two ways: discrete variables (categories) for cross-section configuration and material type, and continuous variables (numerical) for geometrical variables and material thickness, as described in Table 2.
Table 2.
Variables for design optimisation.
3.1.1. Geometry Definition
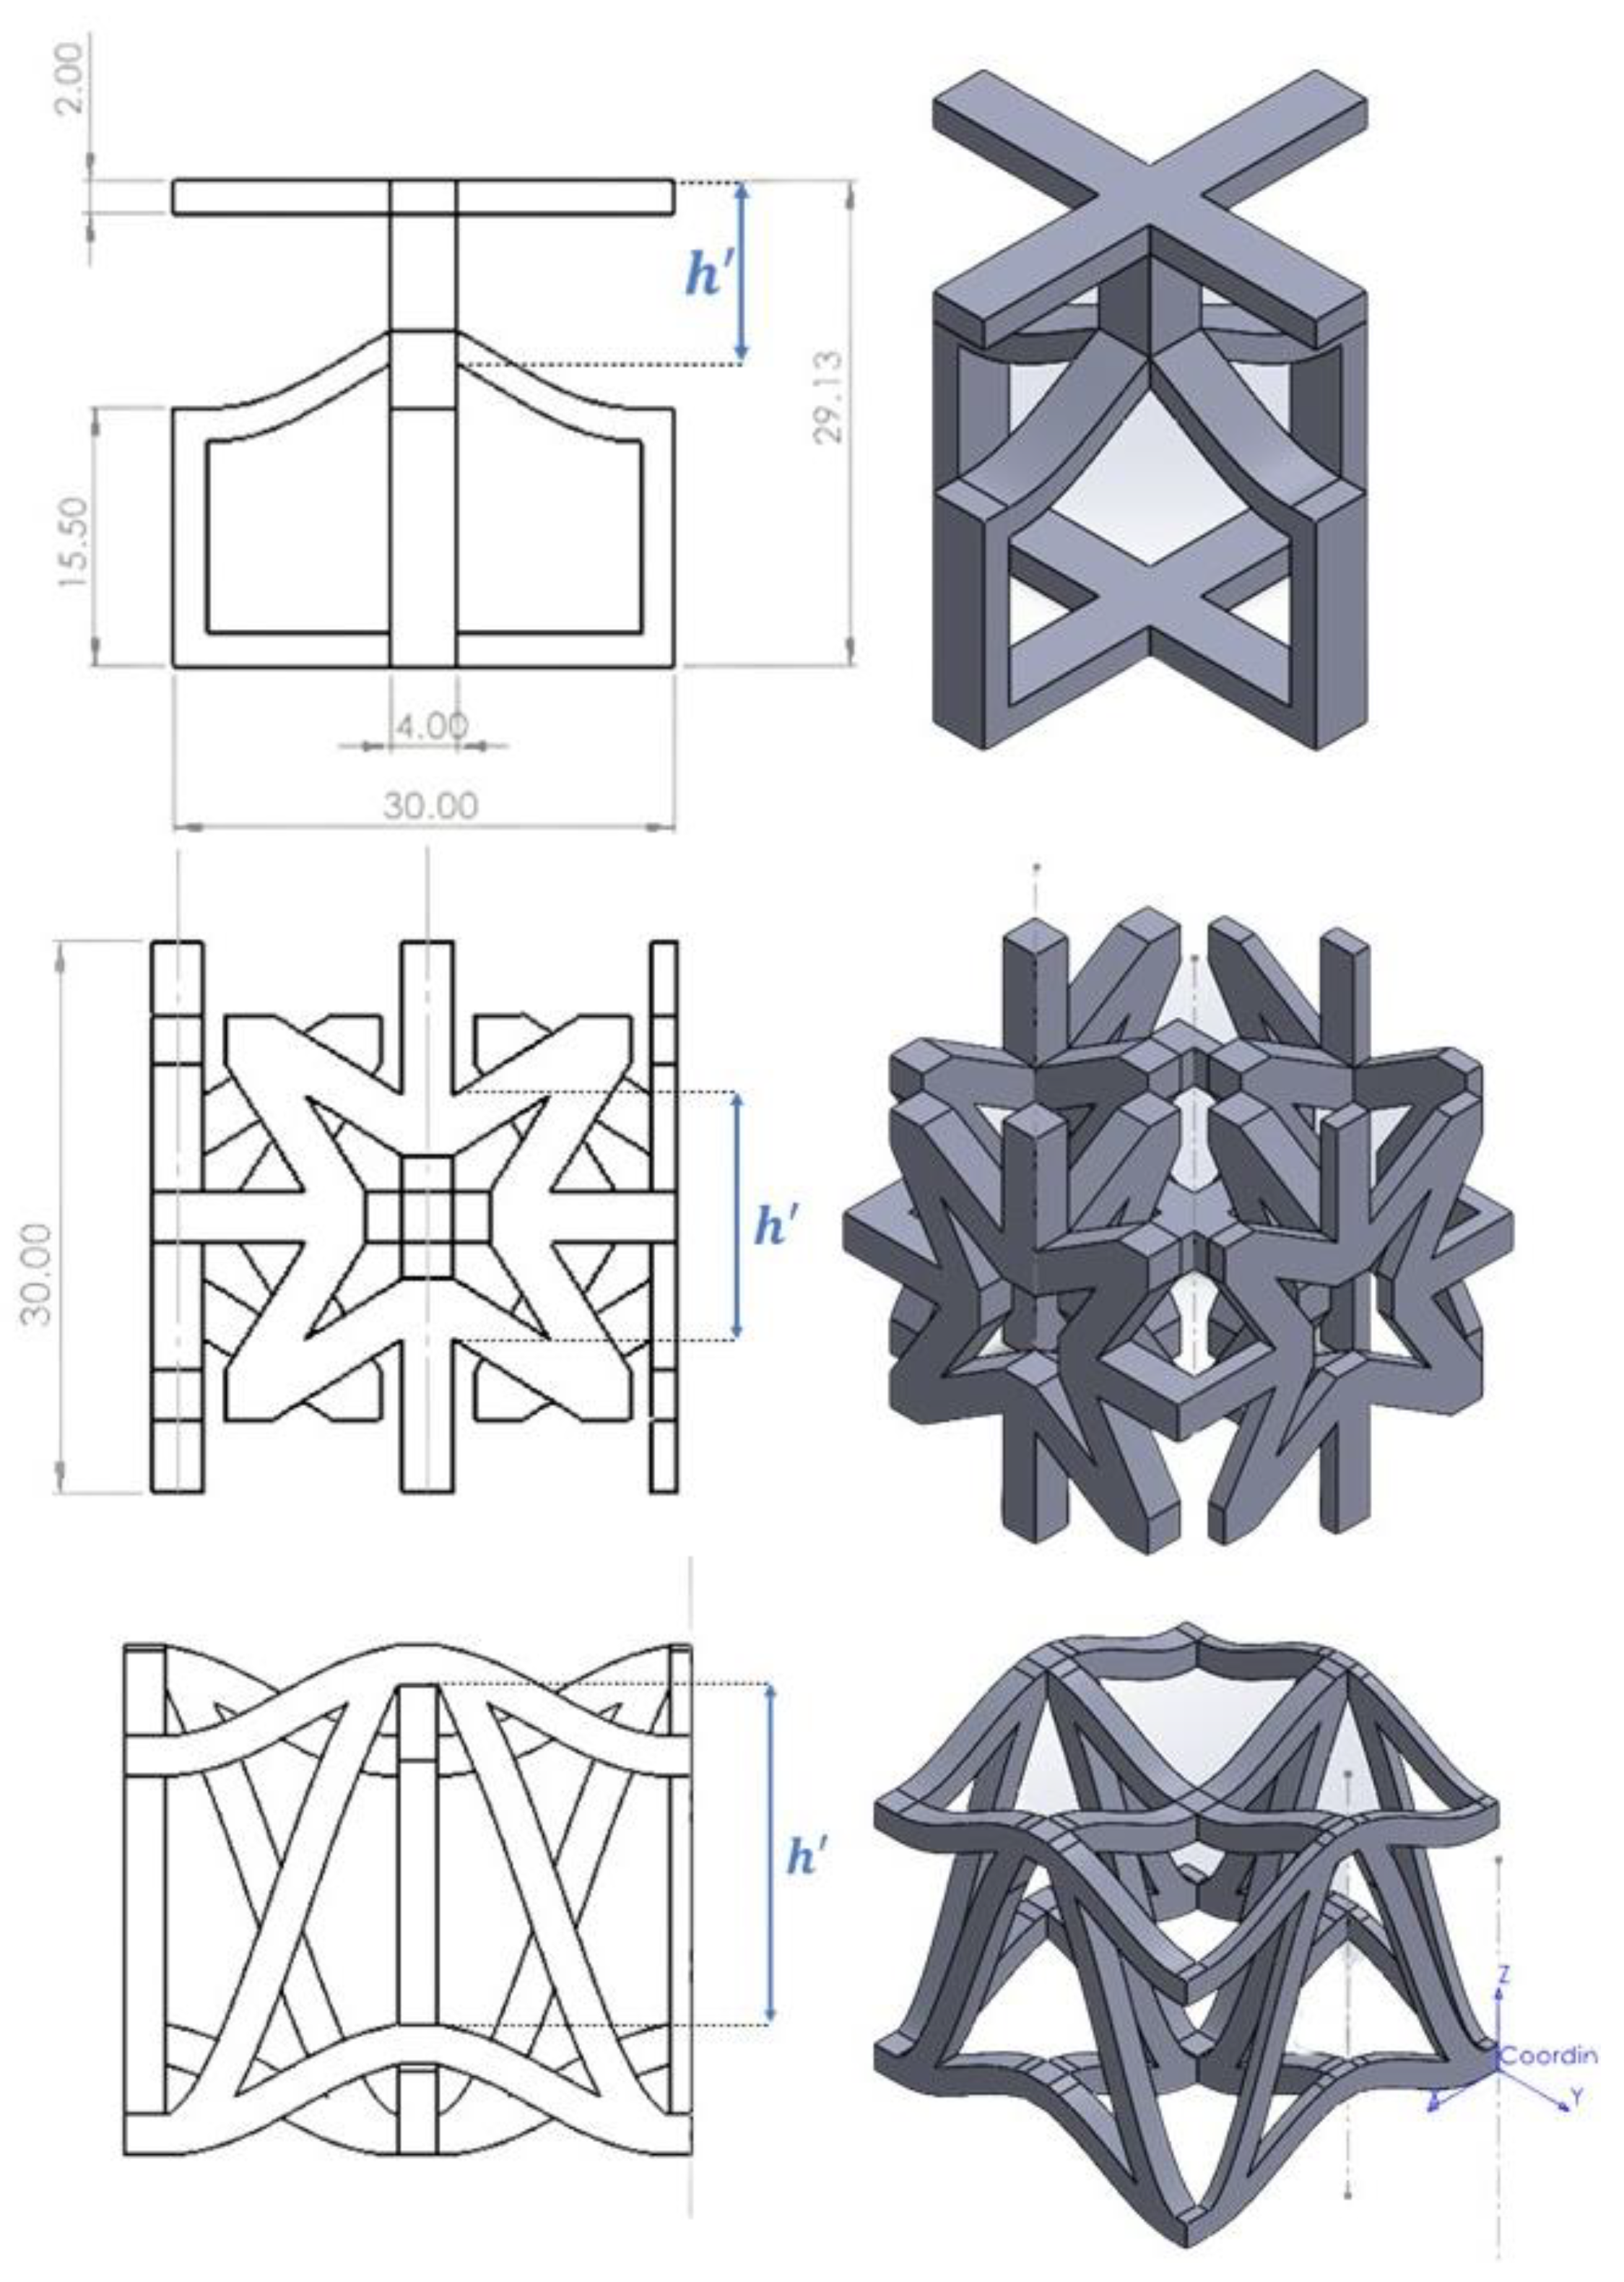
The geometry variables are normalized or standardized since shape and geometry properties differ. Two predetermined input variables serve as the foundation for the normalisation: h as the “inner cell spacing” and vertical stack units. The height of cells is constrained to be 29–31 mm and the configuration is set to be for all samples. Variable transformation provides the geometry limitations for each cross-section type and addresses compatibility issues between input variables and the distinctive cell shapes. For example, the cell becomes wider and hollower as the inner spacing grows. The specification of the geometry constraint for each type of cross-section is listed in Table 3. The configurations of the structure are shown in Figure 5.
Table 3.
Geometrical limitations for design optimisation.
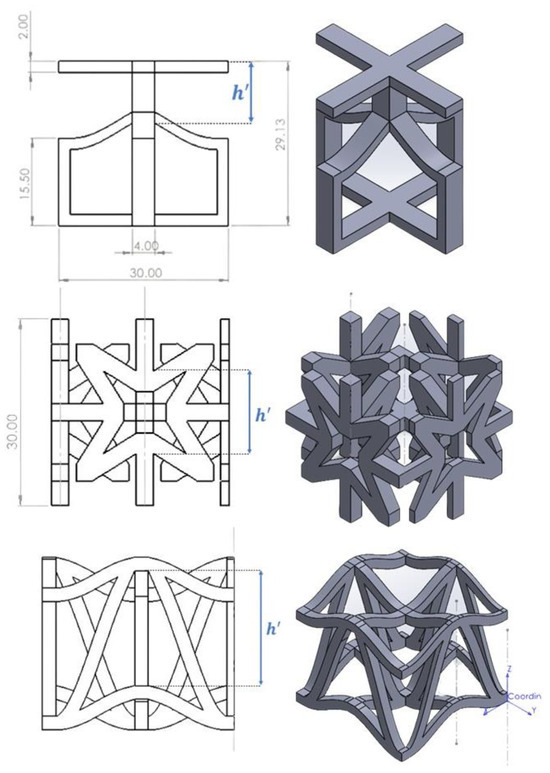
Figure 5.
Variable definitions of Bi-stable, Star-shaped, and DUH cells in mm.
3.1.2. Material Definition
The material variants include stainless steel SS304, Aluminium Al 6061-T6, and carbon steel ST37. All the materials are modelled using MAT_024 piecewise linear plasticity. Al 6061-T6 properties are provided by ASM Material Data [27], Garcia’s article [28], and Abotula’s paper [29]. Stainless steel material is specified using material properties obtained in MatWeb [26]. The material properties are defined in Table 4.
Table 4.
Material properties.
3.1.3. Sampling Process
The selection of samples should be broad and varied but also restricted to shorten the calculation time required to create a precise and representative model. A popular and widely utilised splitting ratio of 80:20 is employed to achieve the data-splitting approach [30]. Therefore, the sample size is 100, of which 20 will be utilised for the validation data set and 80 for the training data set. By comparing the numerical simulation results with the machine learning prediction of SEA, the error can be determined.
The discrete uniform distribution is used to create samples from categorical data, assuming that each individual has an equal probability of being chosen for a sample [31]. Meanwhile, for the continuous variables, LHS divides each parameter’s range into intervals equal to the number of samples needed, then chooses one value as the midpoint from each interval to generate samples by taking into consideration the already presented sample points in a virtually random sample, which is more beneficial for multi-dimensional distribution [32,33]. As a result, it can guarantee that the range of possible values is suitably represented by the collection of random numbers.
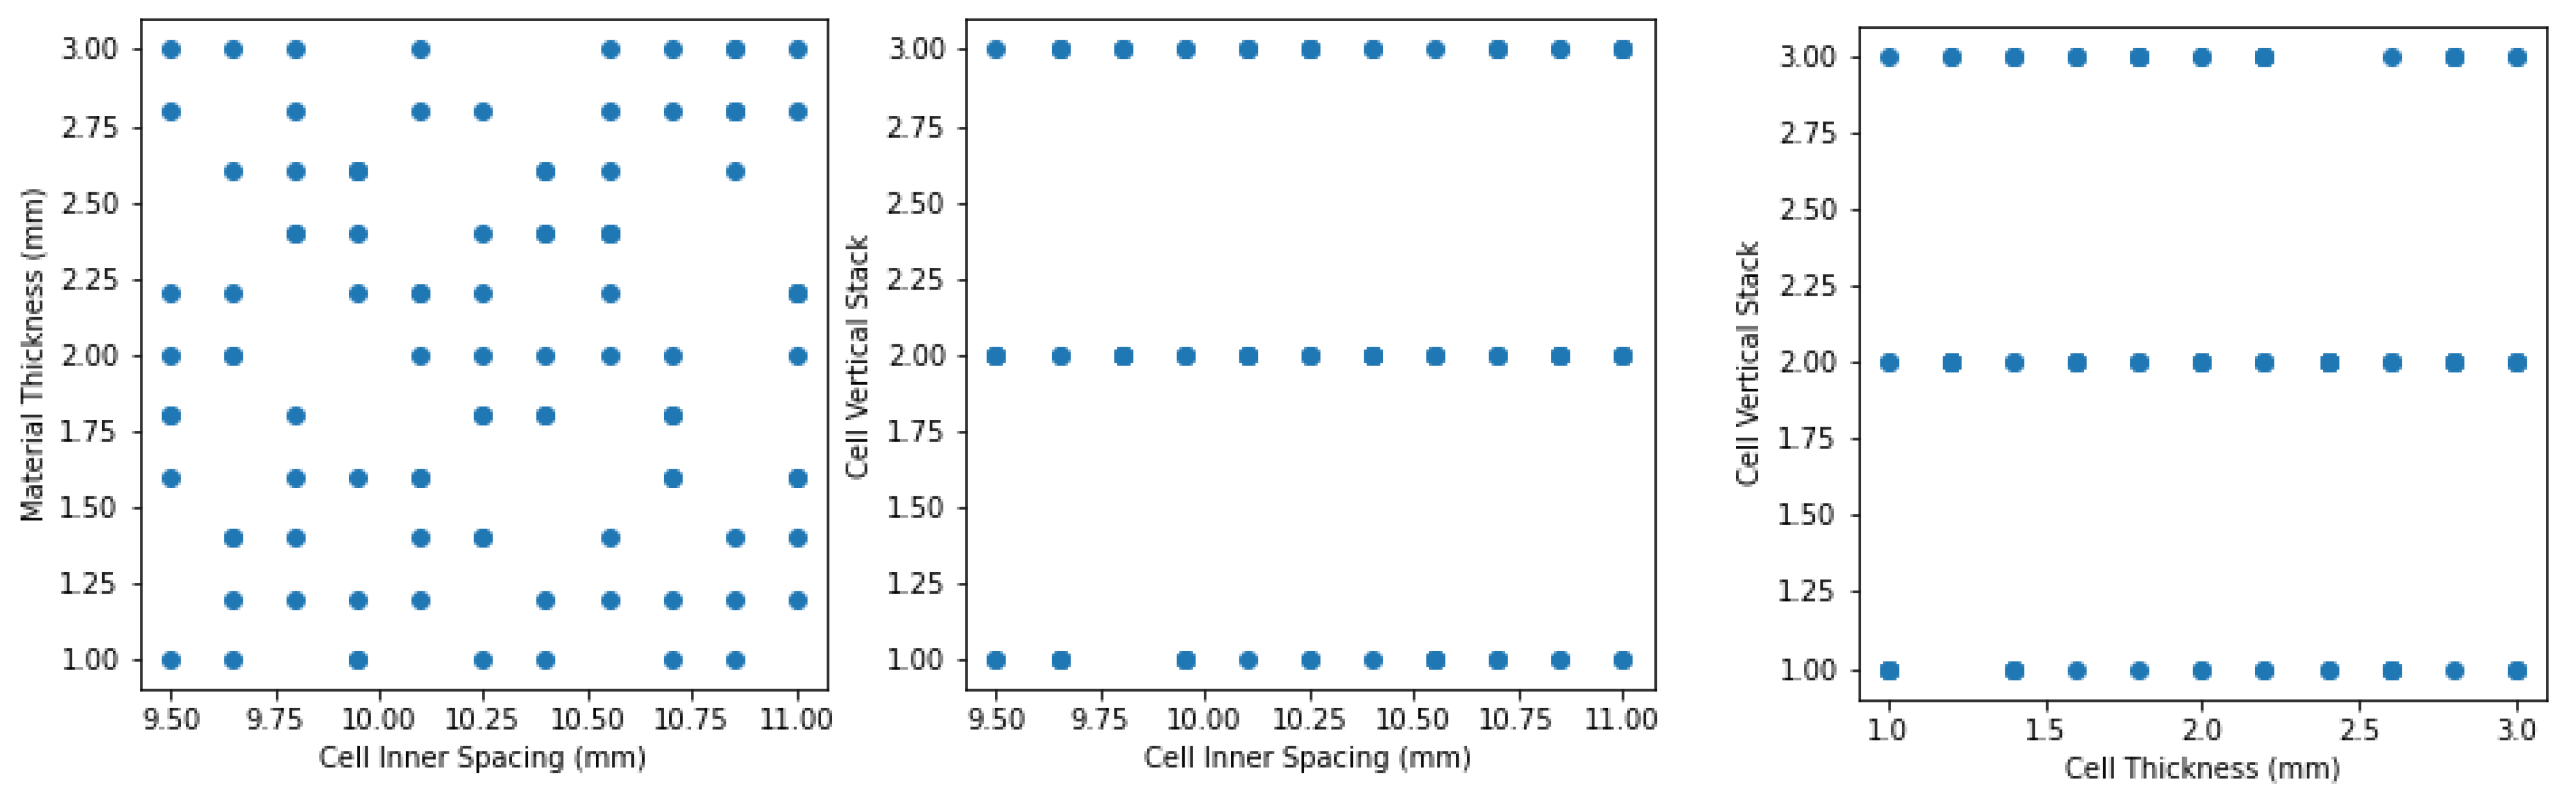
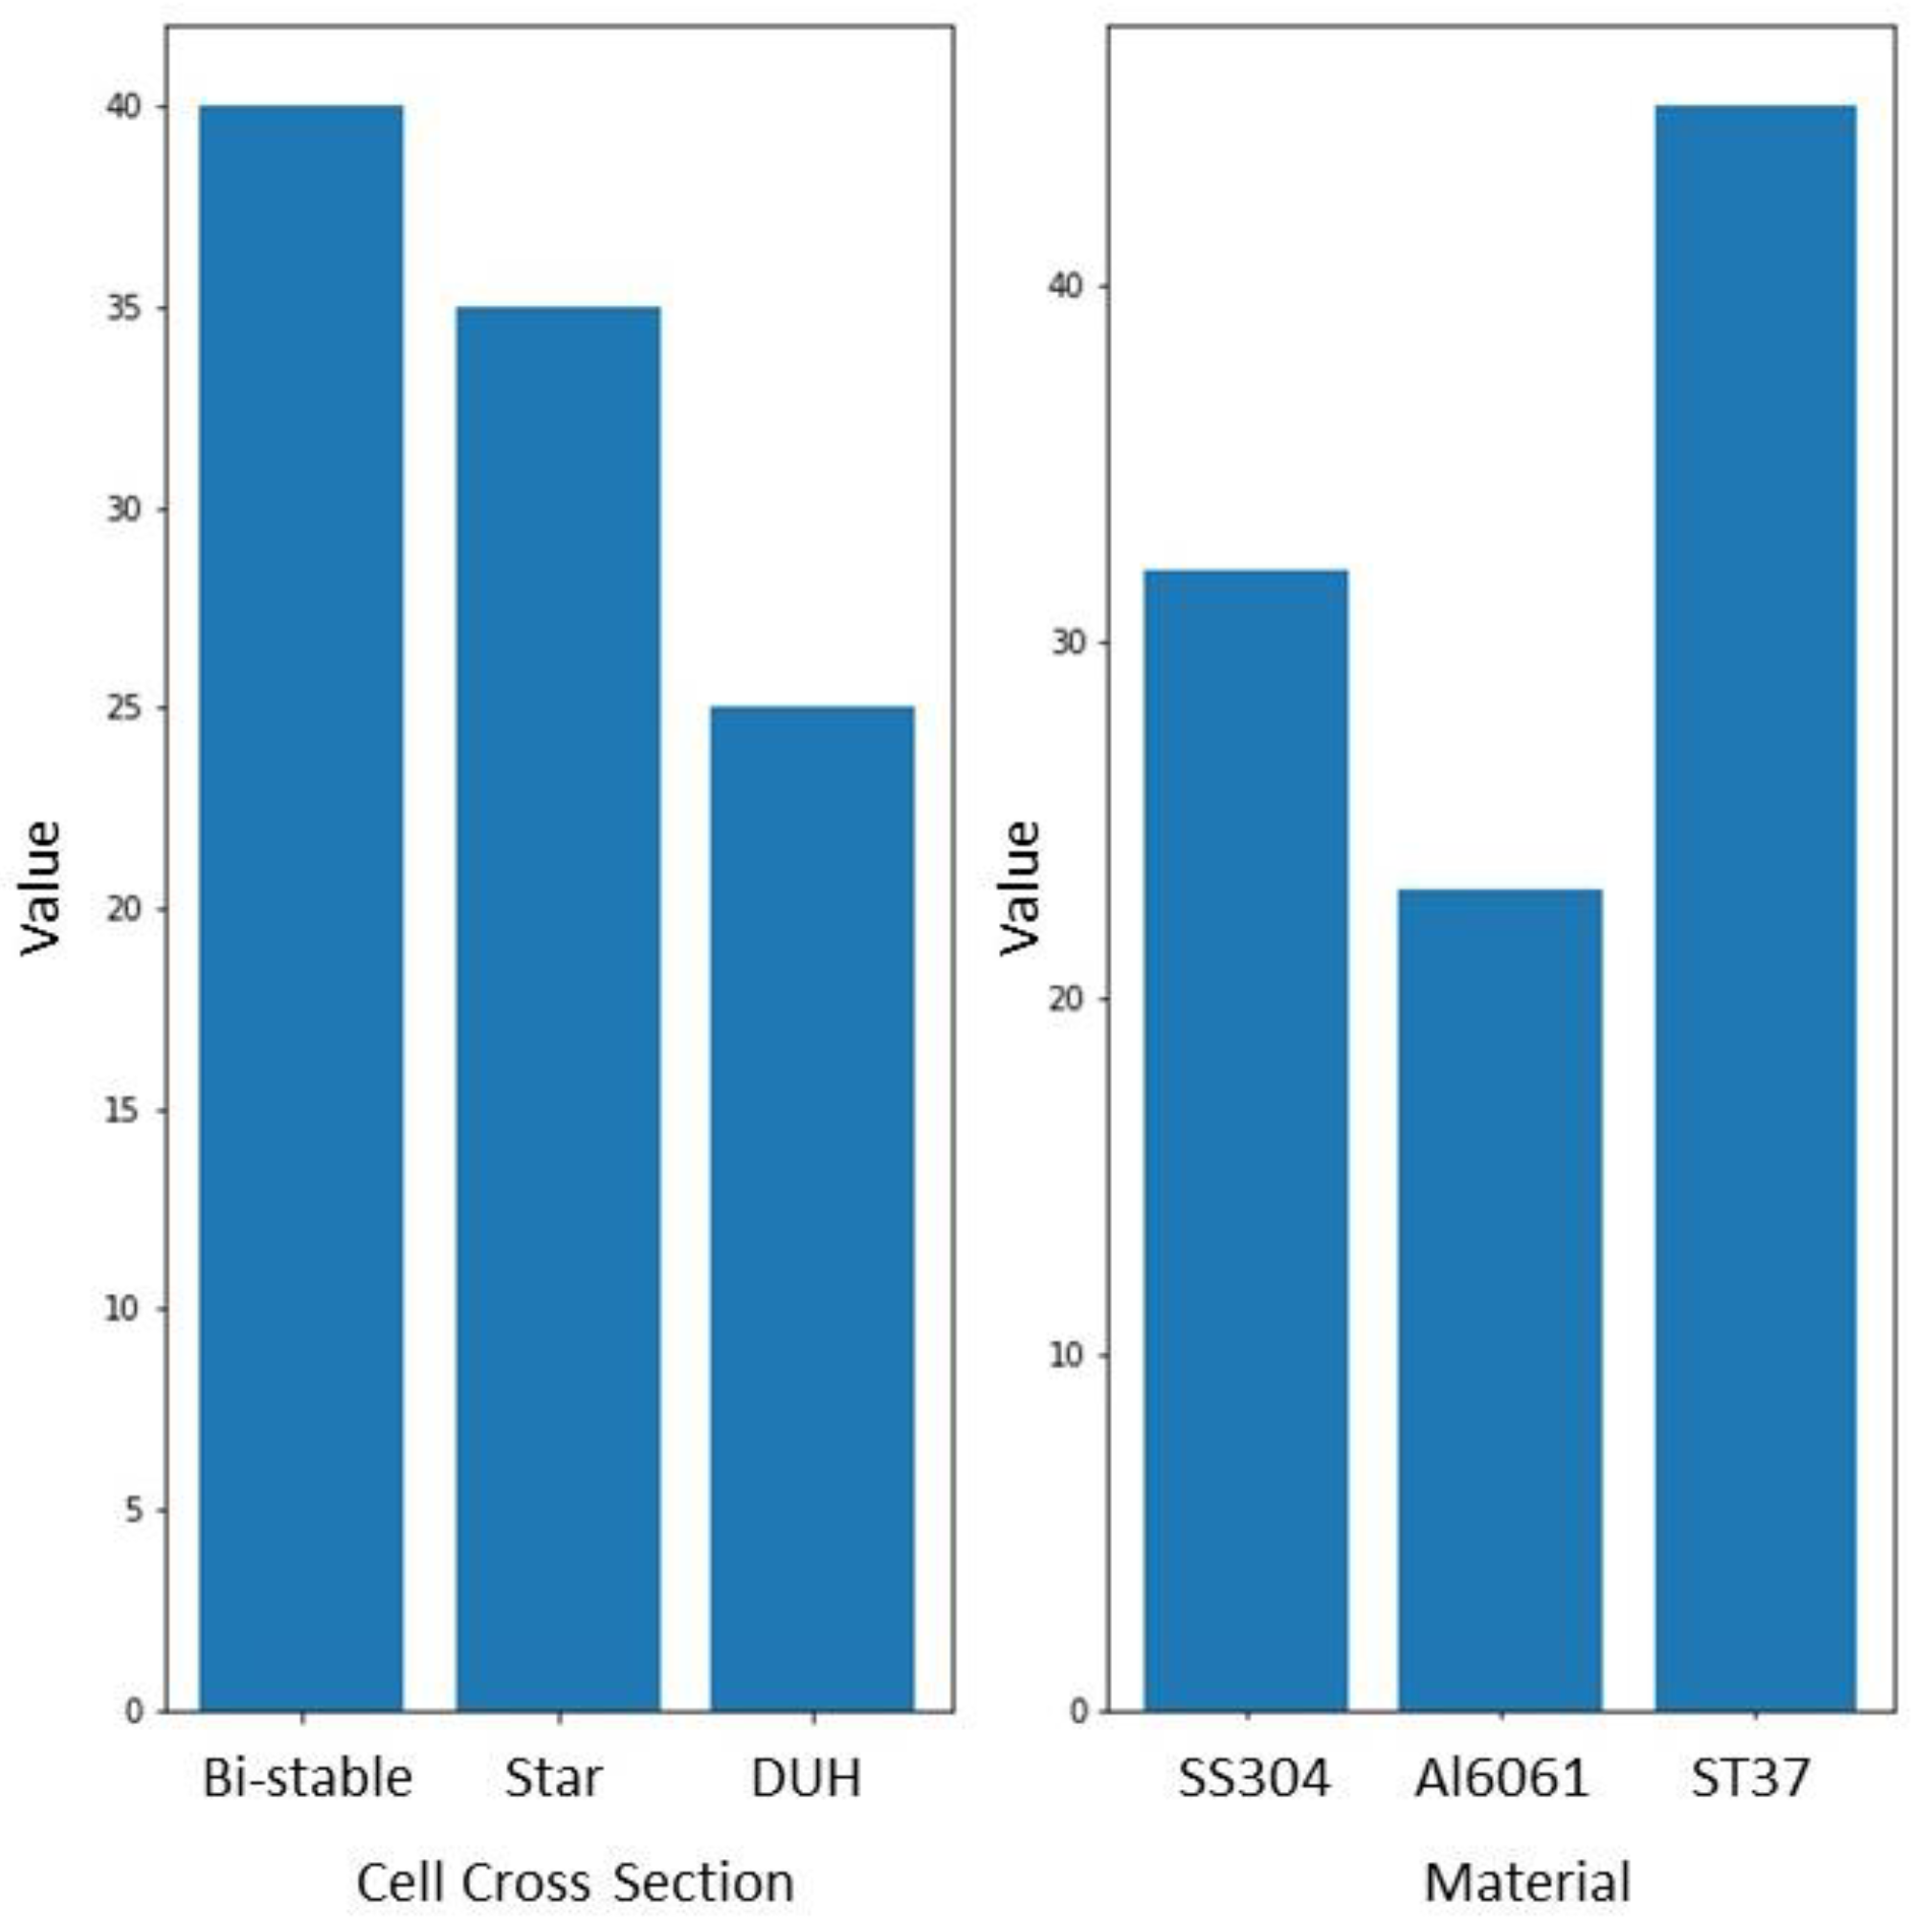
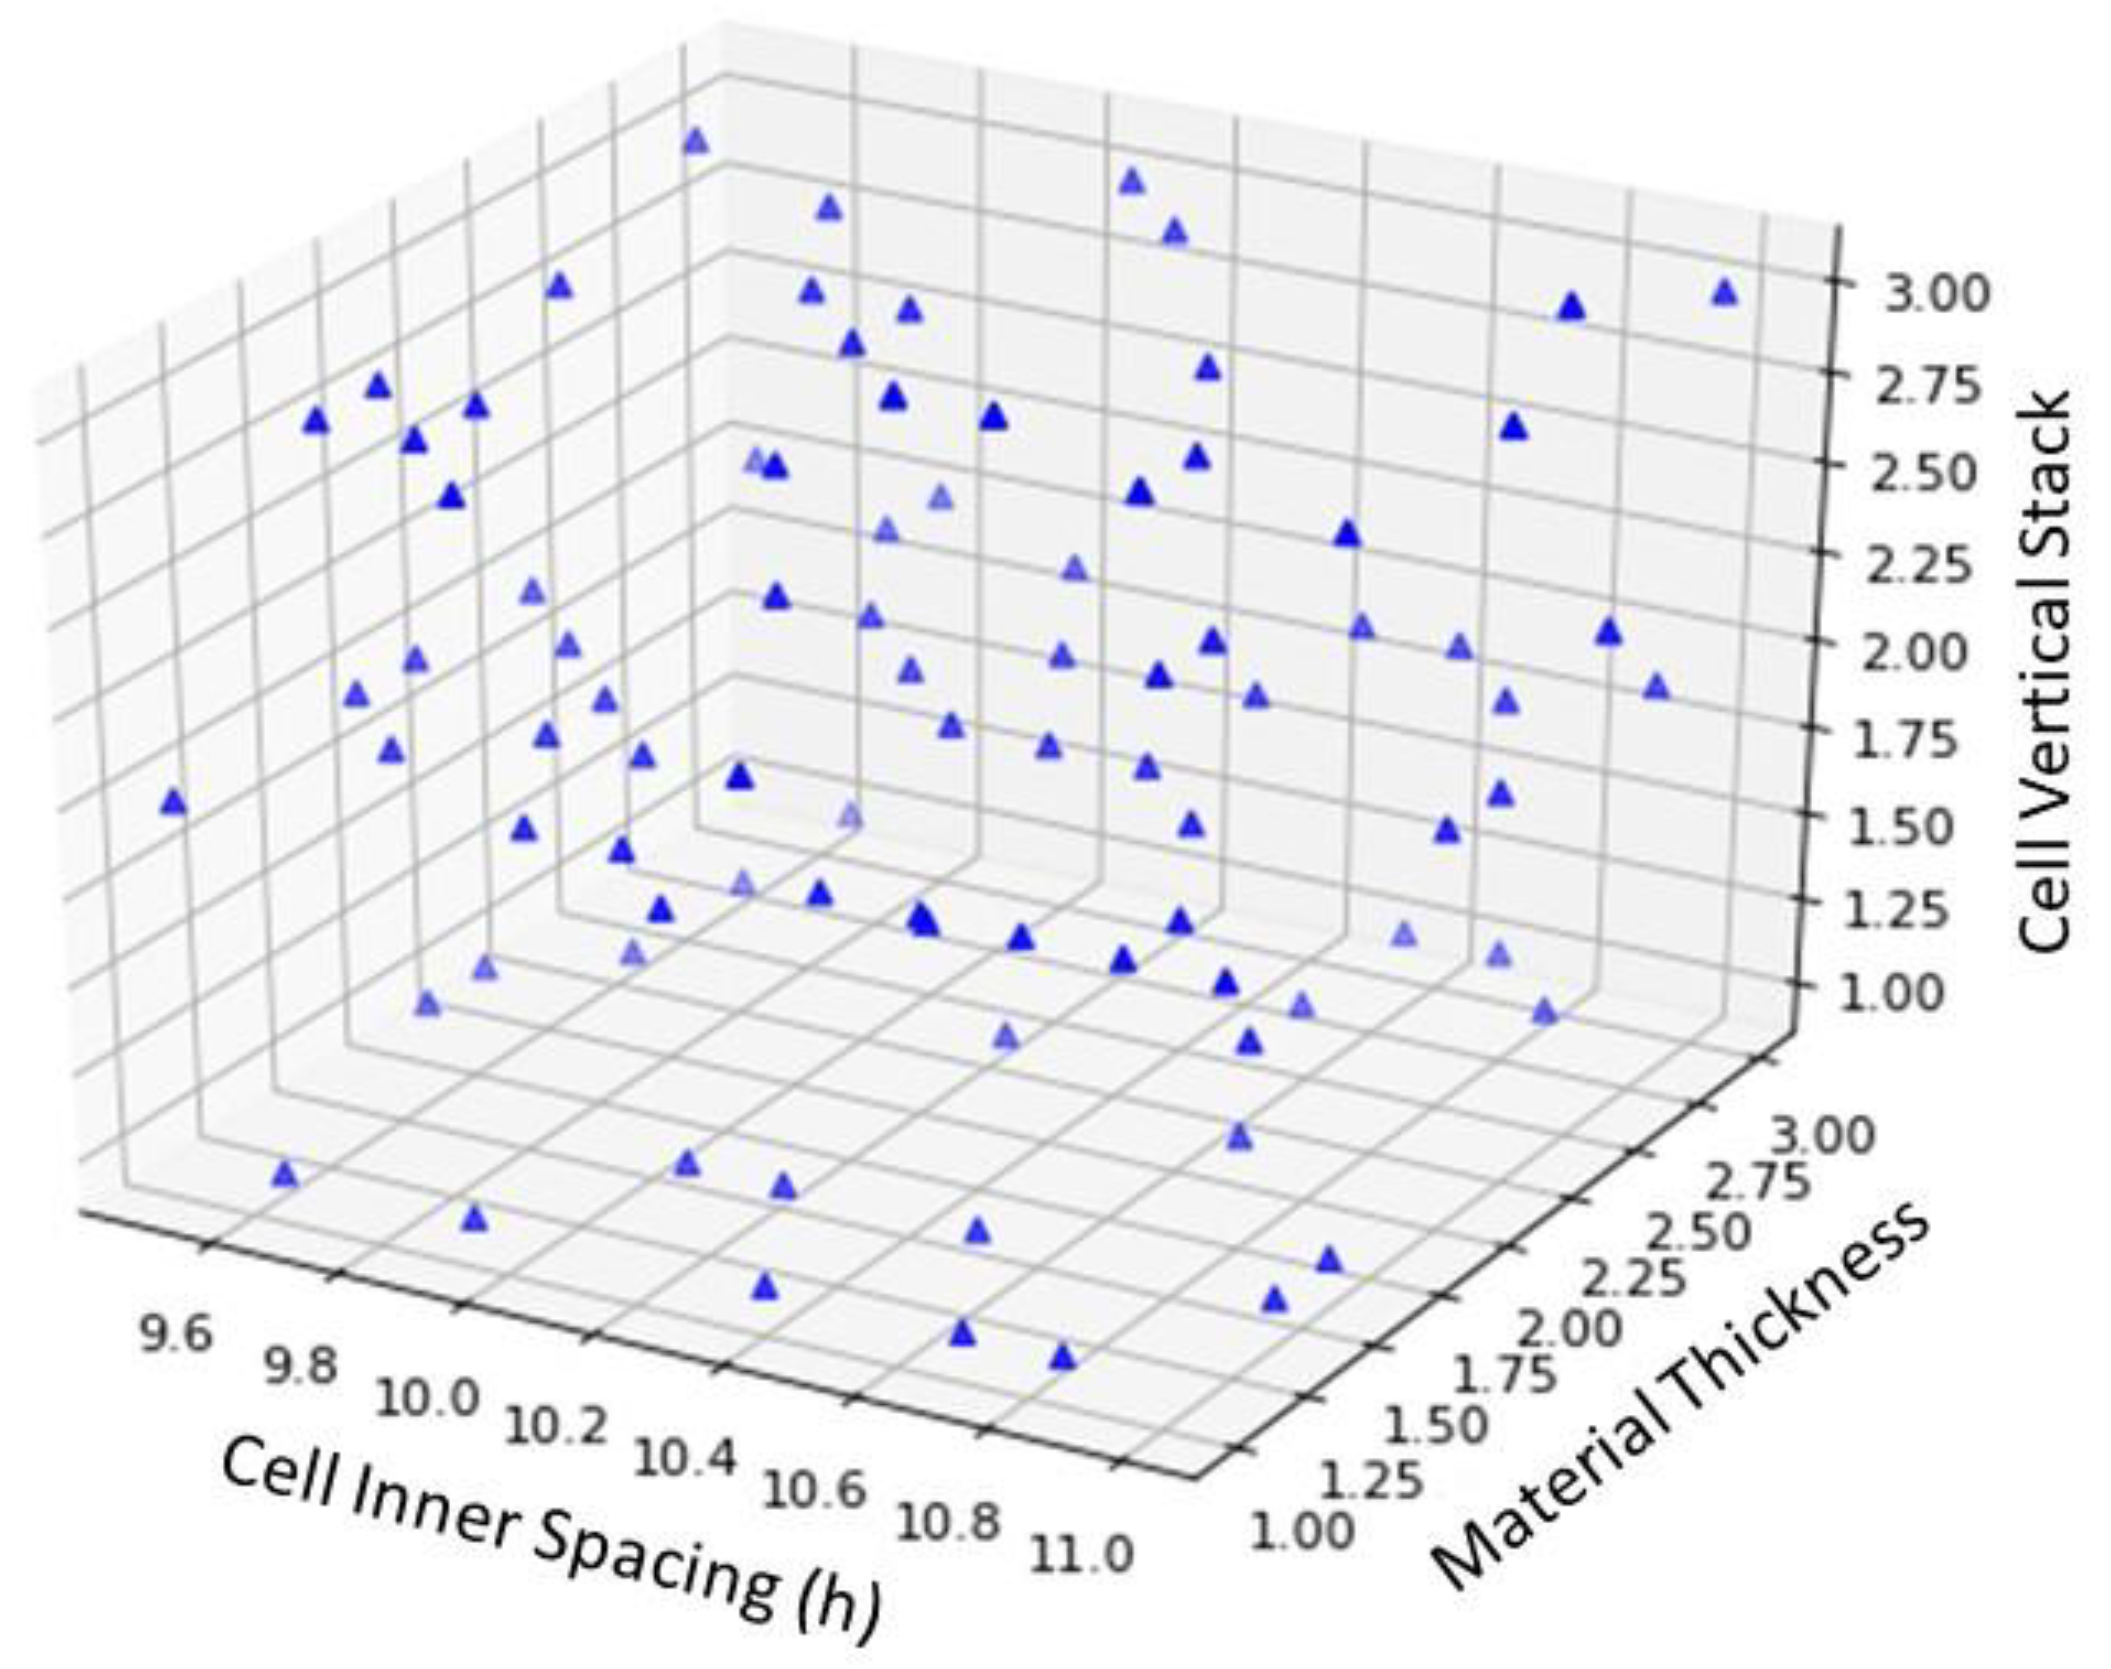
In this study, the representative sample points are chosen randomly from 100 samples and three continuous variables to create an accurate model. Figure 6 (continuous variable), Figure 7 (categorical variable), and Figure 8 (numerical sampling space distribution) show the distributions of the sample variables created. The SEA value was then determined by numerical simulation using the sampled data as input. The data set is finished once the output value has been collected.
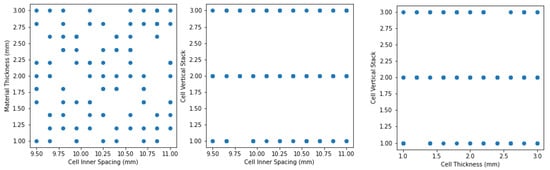
Figure 6.
Continuous variable sampling result.
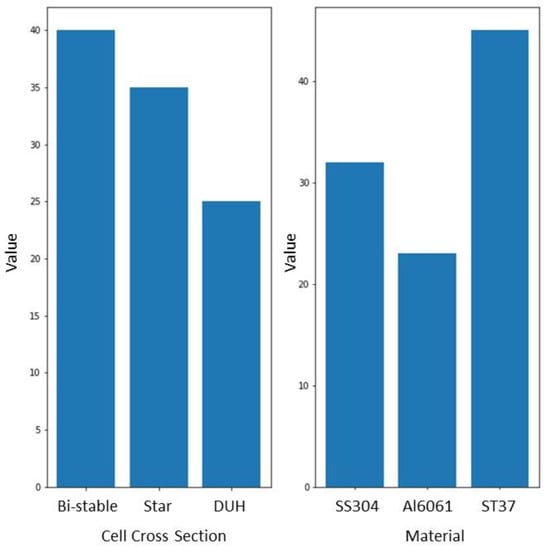
Figure 7.
Categorical variable sampling result.
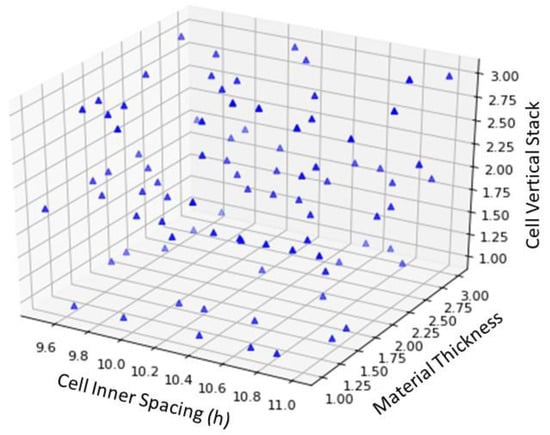
Figure 8.
Continuous variable sampling result in 3D space.
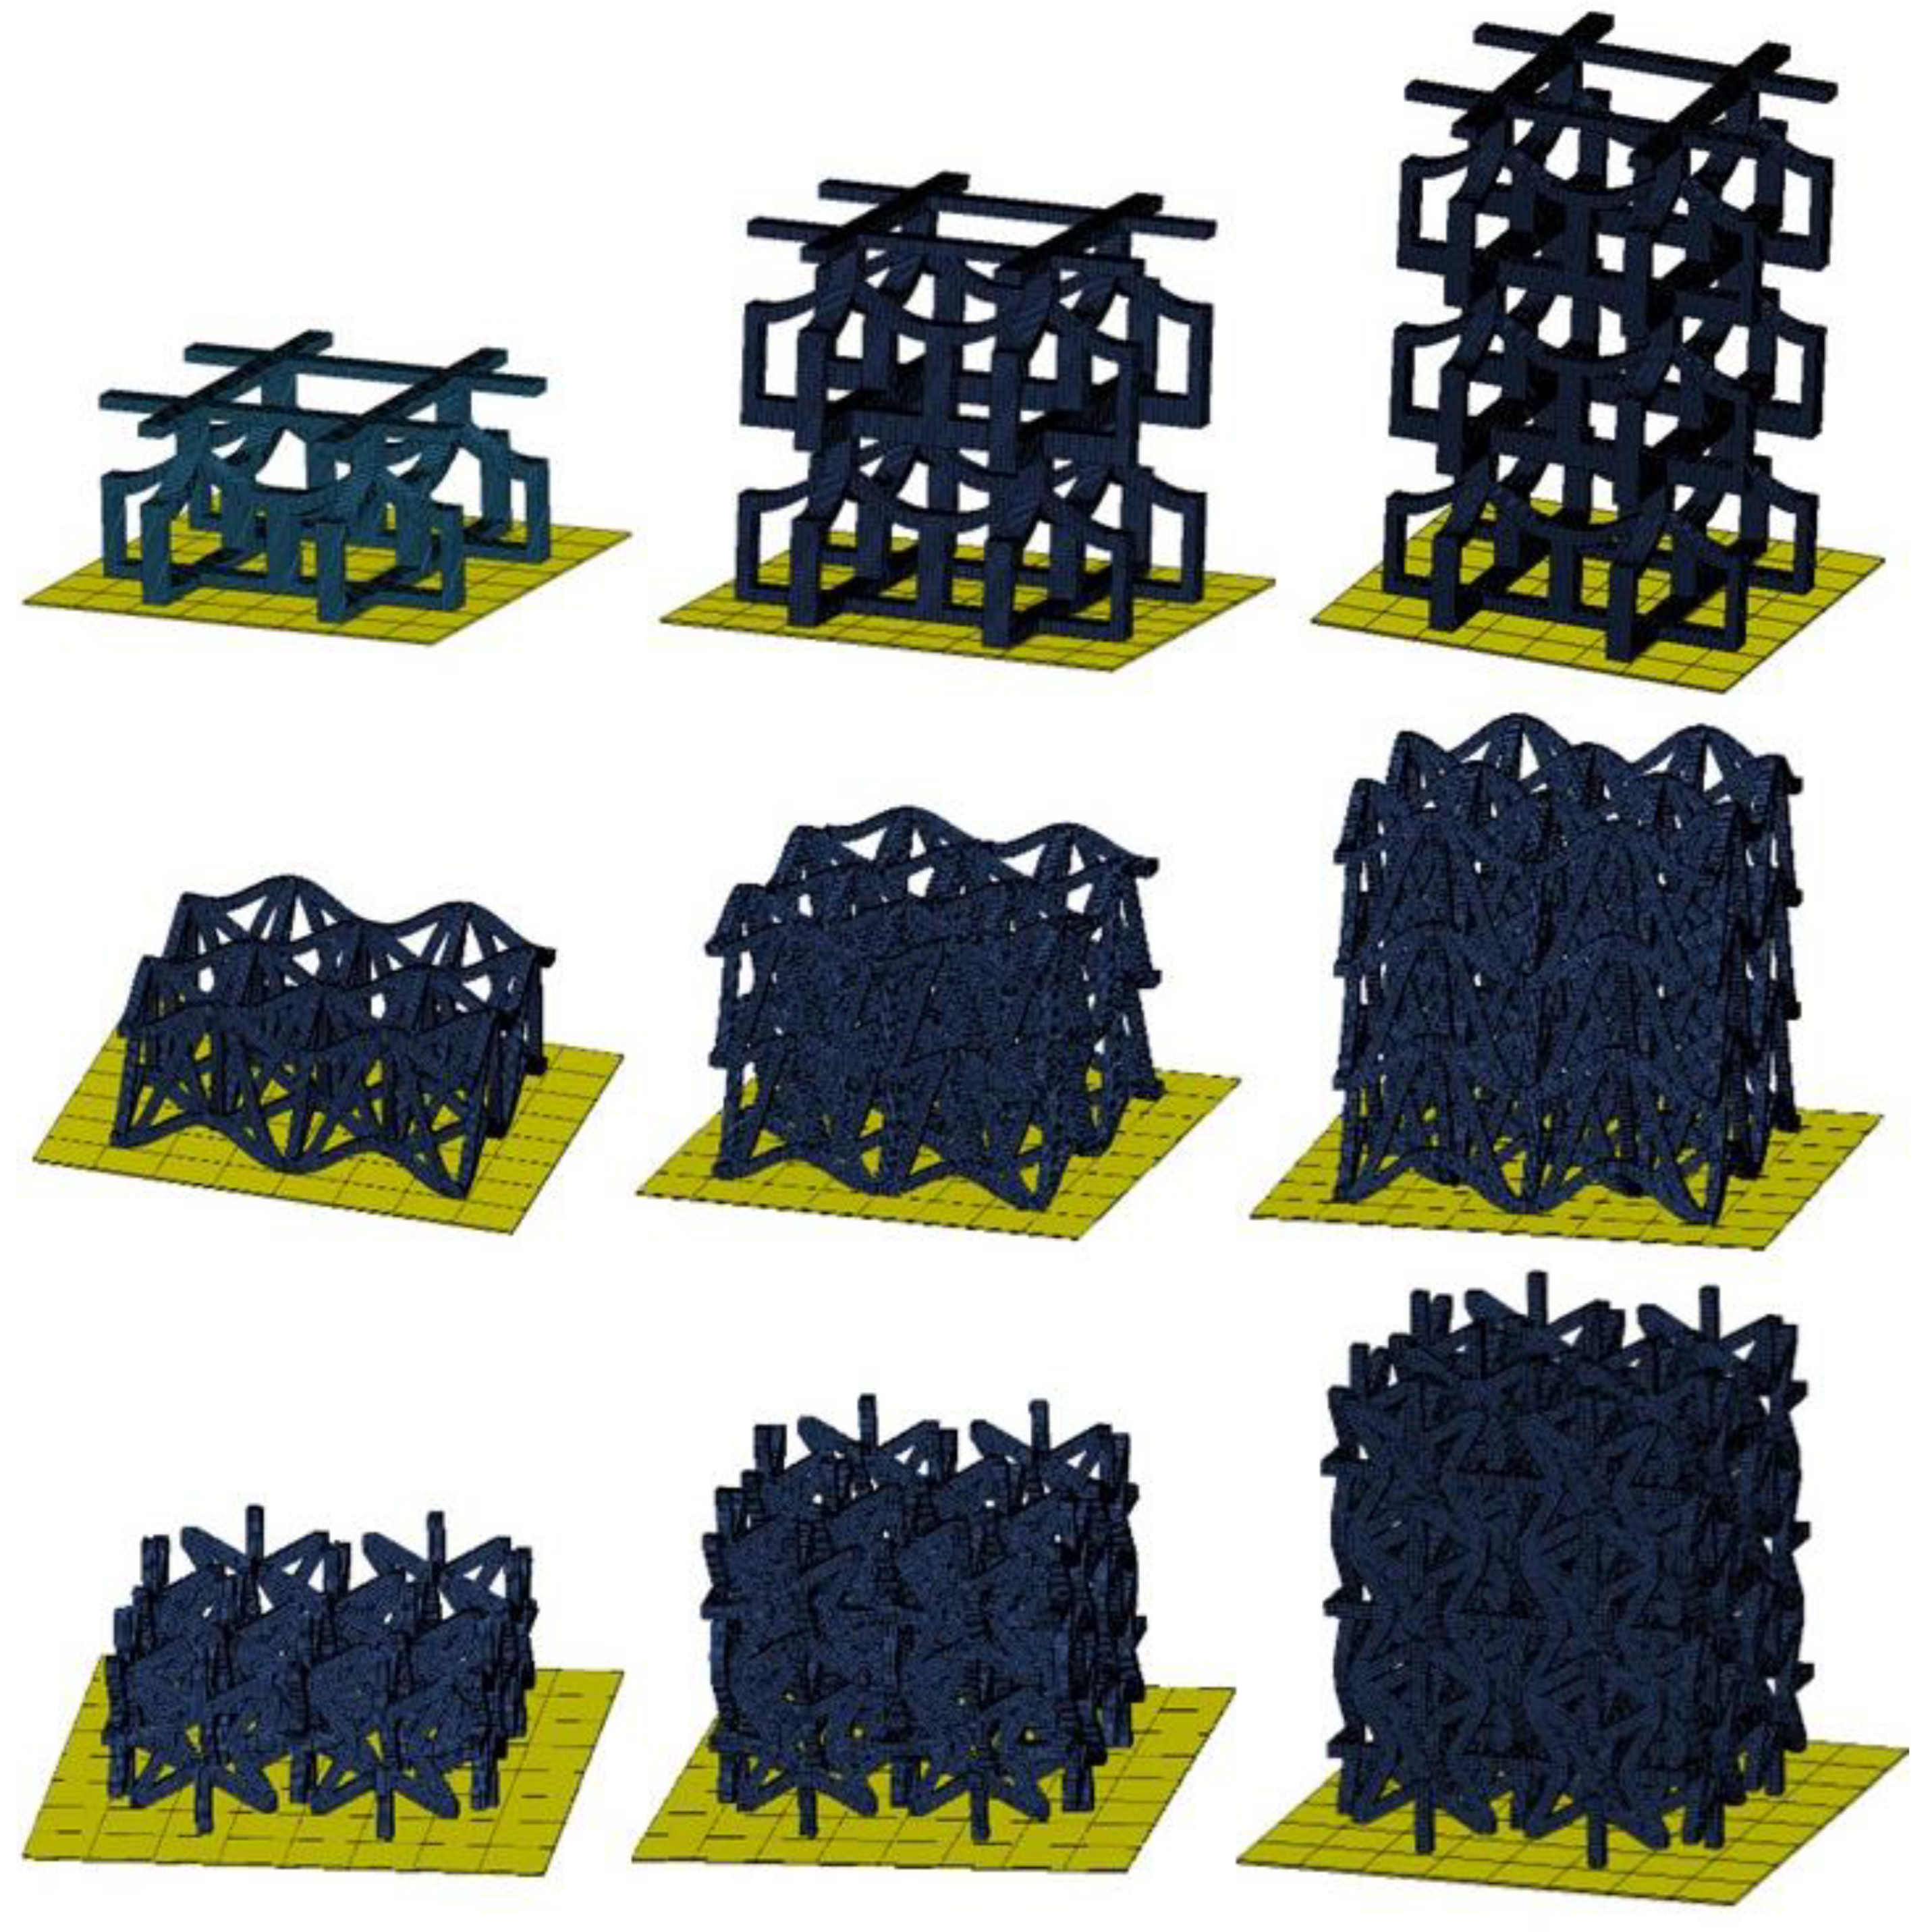
The samples are then modelled and imported into the LS-DYNA R11.0.0 software to determine the generated samples’ crush resistance performance. The meshing process uses HyperWorks 2022 software to consider the contours of the curved structures. The samples modelled are illustrated in Figure 9.

Figure 9.
Numerical simulation of Bi-stable, DUH, and Star configurations.
The output variable is the energy absorbed per unit mass of the collision-impacted structure, as represented by SEA. The goal is to have as high an SEA as possible, given that this results in the best energy absorption capability. SEA is therefore assessed as the outcome of the optimisation.
3.2. Data Pre-Processing
The datasets presented in Table 5 are pre-processed before the input and output variables are combined. To properly quantify categorical data, they must be transformed into unique index numbers (1, 2, 3) and an artificial variable must be created to address each of these variables separately. The categorical input variables are quantified using one-hot encoding and converted into Boolean dummy models for regression analysis. The dummy variable assigned by the one-hot encoder algorithm for the input parameter’s first level is erased to avoid multi-collinearity between two variables, or the dummy trap, which occurs when the variables are highly correlated. The output variables are scaled simultaneously so that the highest absolute value of each variable is 1.0 without affecting the sparsity of the data.
Table 5.
Categorical variables converted to dummy variables.
In training the neural network model, the processed datasets are split into an approximate 80:20 ratio between the training and validation data to ensure accuracy and prevent overfitting [34]. The training set is instructed to understand the correlation connecting the input variables and select the best weights. The test set calculates the loss between the two datasets to assess the performance of the trained model.
3.3. ANN Architecture Model
The ANN model is used to solve optimisation questions as the regressor. To define a neural network model’s confidence level, the right activation units and number of hidden layers are essential; therefore, numerous iterations are necessary to find the ideal configuration. Three hidden layers, each with a consistent 9-neuron unit count, make up the model configuration, as depicted in Figure 10. To reduce the size of the error or loss function, this number of hidden layers and units was selected. Each hidden layer’s parameters are listed in Table 6. Additionally, Table 7 defines the input variables that feed into the input layer. The parameters used for the ANN optimisation are listed in Table 8.
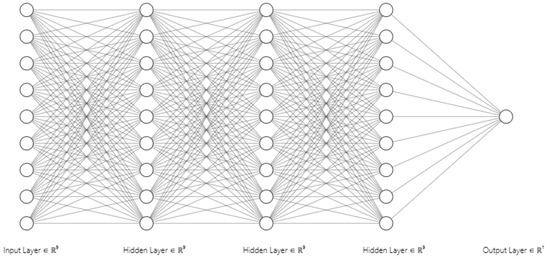
Figure 10.
The architecture of ANN model.
Table 6.
Units, weight, bias, and activation function for all ANN layers.
Table 7.
ANN input variables.
Table 8.
Variables for ANN optimisation.
3.4. ANN Model Accuracy
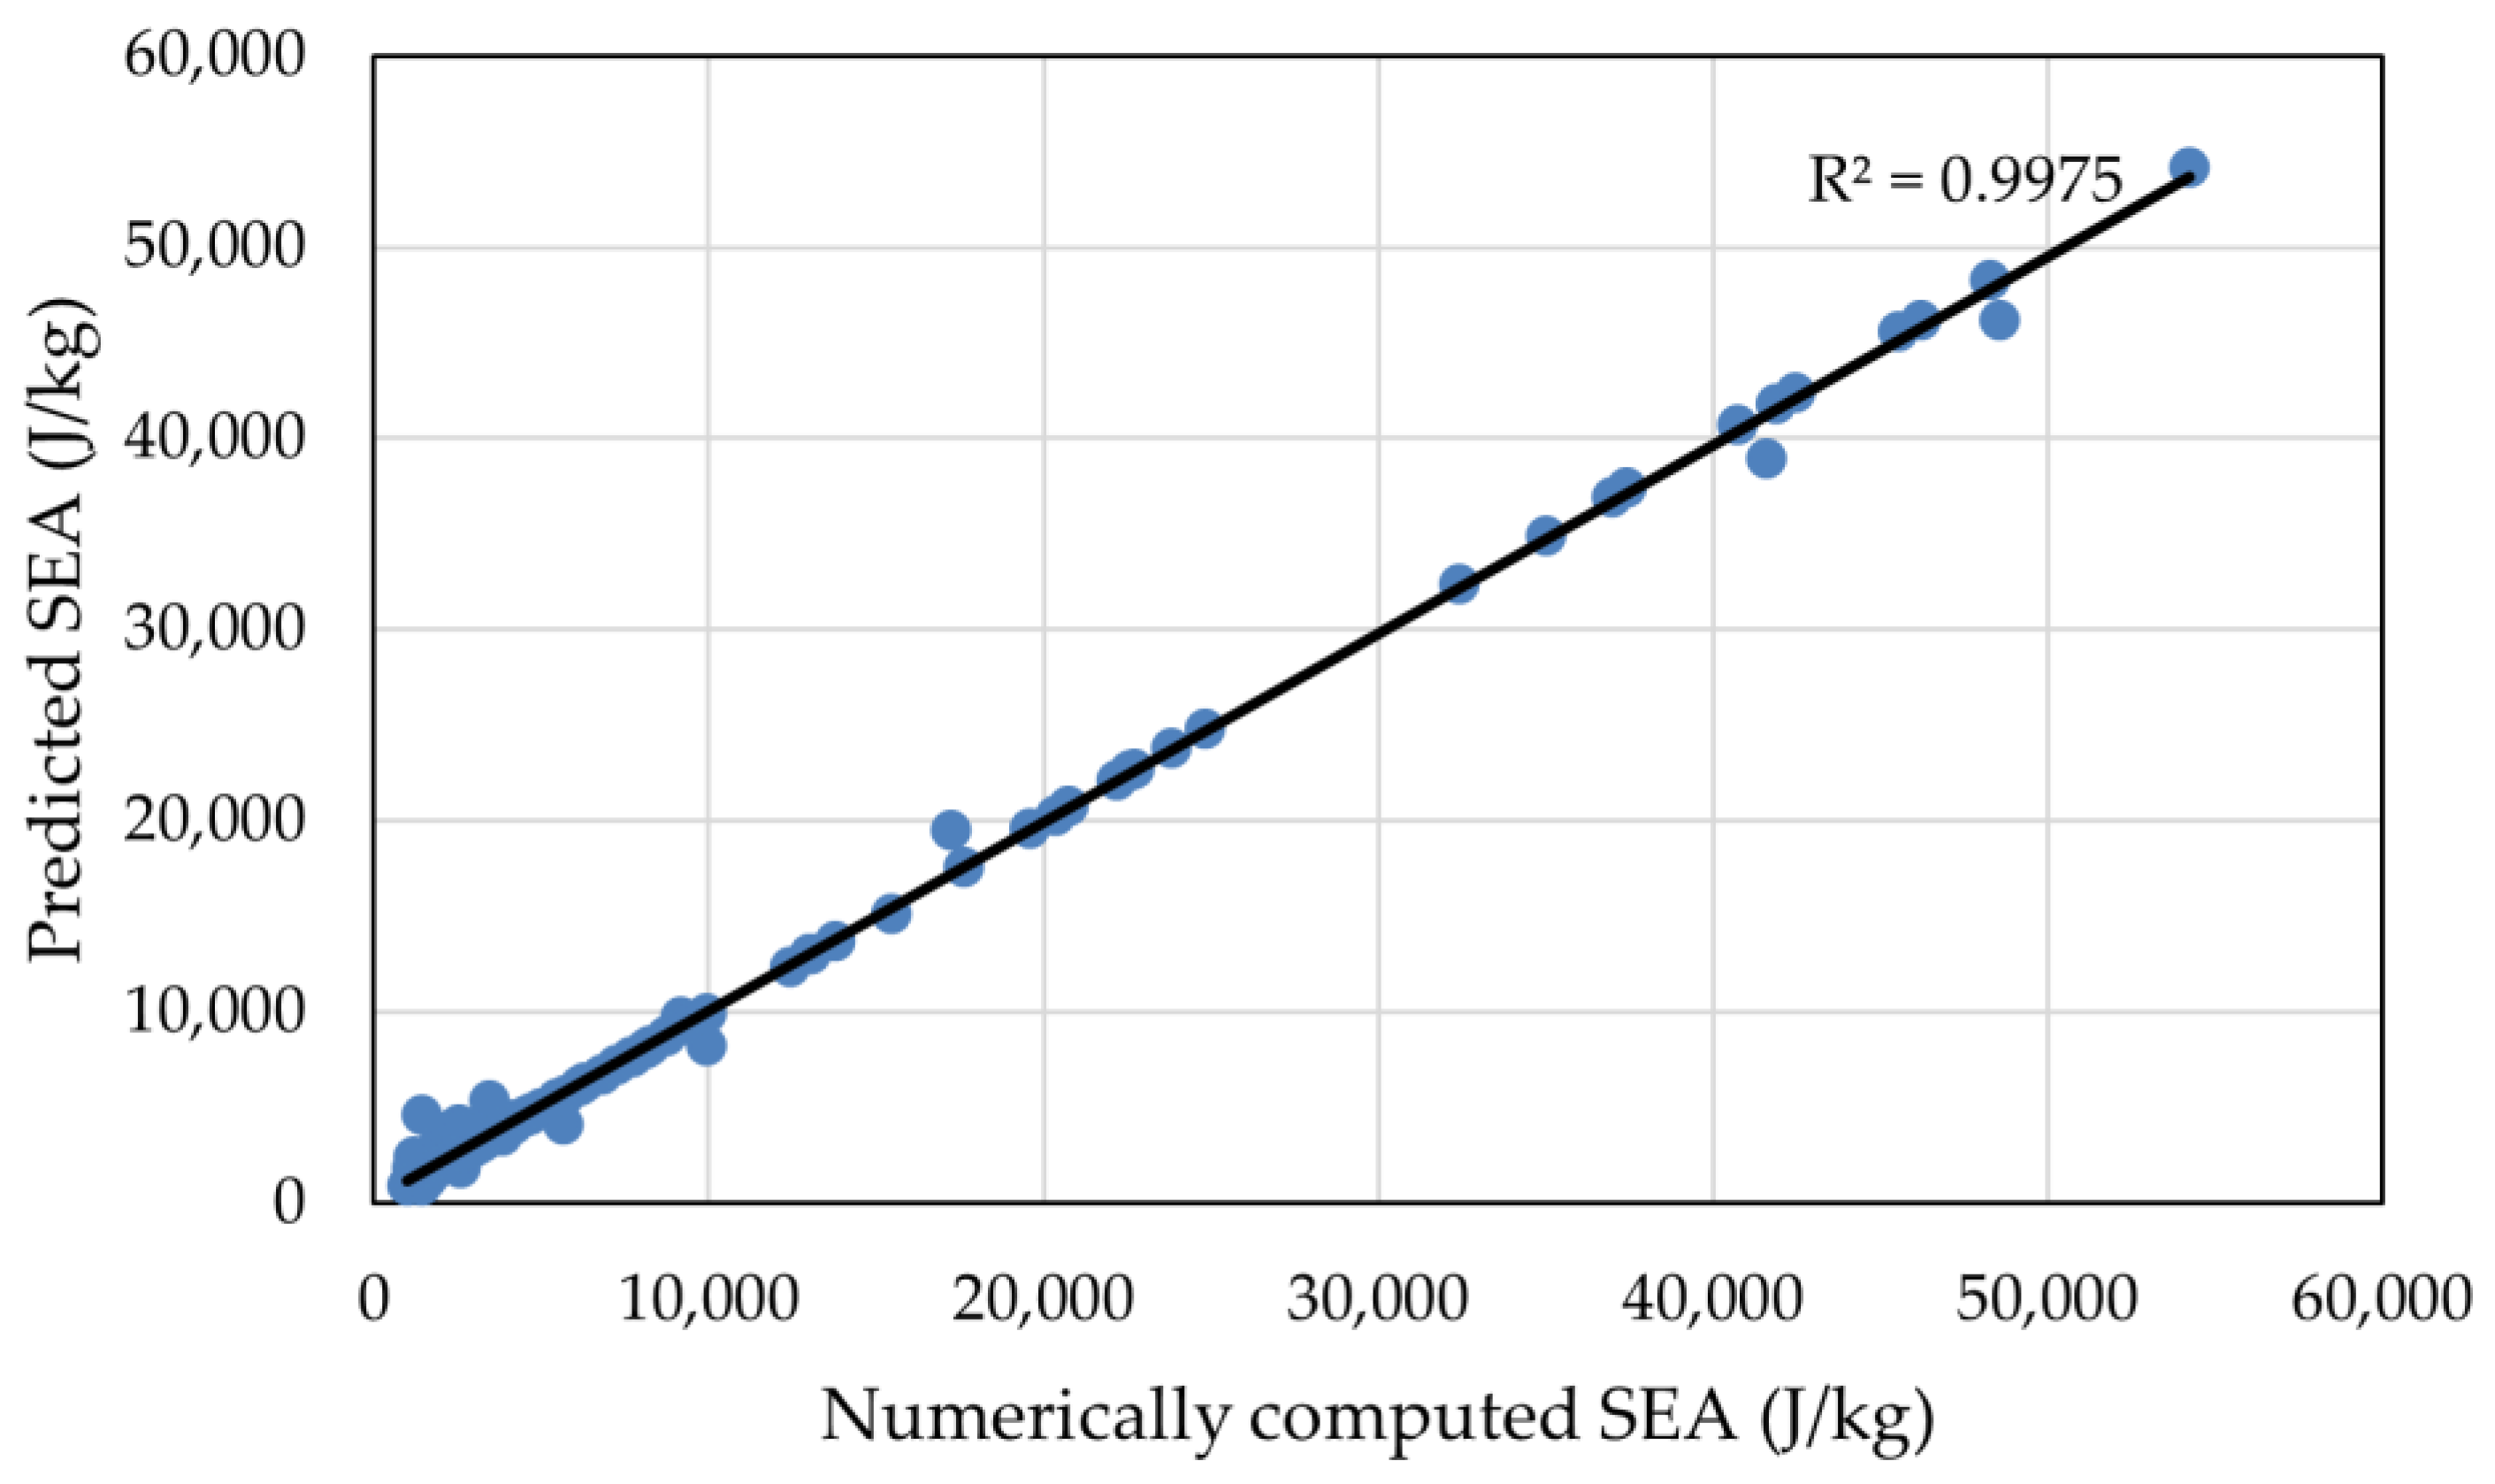
By comparing the numerically computed results from simulation with outcomes predicted by machine learning, the accuracy of ANN prediction can be seen in Figure 11. To determine how well the model corresponds to the real data points, we quantified the graph and obtained . The higher the value of , the higher the accuracy. It is generally regarded as sufficiently precise for [35].
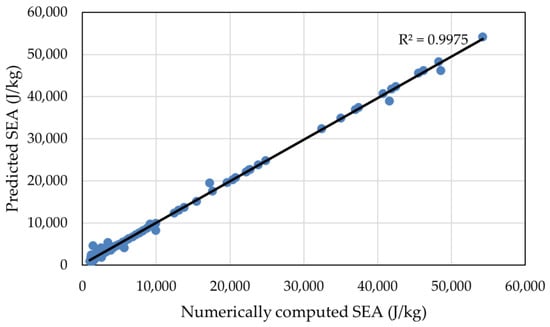
Figure 11.
Comparison between predicted and computed SEA.
It is also measured for the training and validation data sets using MAE (Mean Absolute Error) and MSE, as shown in Table 9. The constructed ANN model delivers comparatively small absolute error of 0.0695 (66.95%) according to the iterations performed.
Table 9.
ANN model training loss result.
A neural network regression model is defined in which weight and bias values represent the connections between every layer in a neural network to comprehend the relationship between the input and output parameters. The total acquired weight obtained by the ANN model is equal to the number of layers times the number of branches in every layer, whereas the full bias attained is equal to one for every unit. Linear equations cannot be constructed from the generated weight and bias due to the Sigmoid and ReLU activation functions used in the model. Rather, the ANN model was imported straight to the NSGA-II optimisation method.
3.5. Decision of Optimised Model
The set of design parameters for the highest SEA was chosen by the NSGA-II algorithm using the trained ANN model as the input. The weight and bias of the crashworthiness variables generated from the neural network training are the first values imported by the NSGA-II algorithm. This algorithm iterated over the values of the variables according to the specified constraints and objectives. The geometrical and material definition range served as the constraints, and the objective of the NSGA-II algorithm was confined to forecasting the best crashworthiness parameters of the structure for any given arrangement of input variables.
The design variables are iterated 1000 times to produce design point candidates that meet the maximum SEA value. Based on the optimisation result, the NSGA-II algorithm produced the highest estimated SEA of 54,992.62 J/kg. Table 10 listed the design parameters of the optimised design.
Table 10.
Variable maximum correlation.
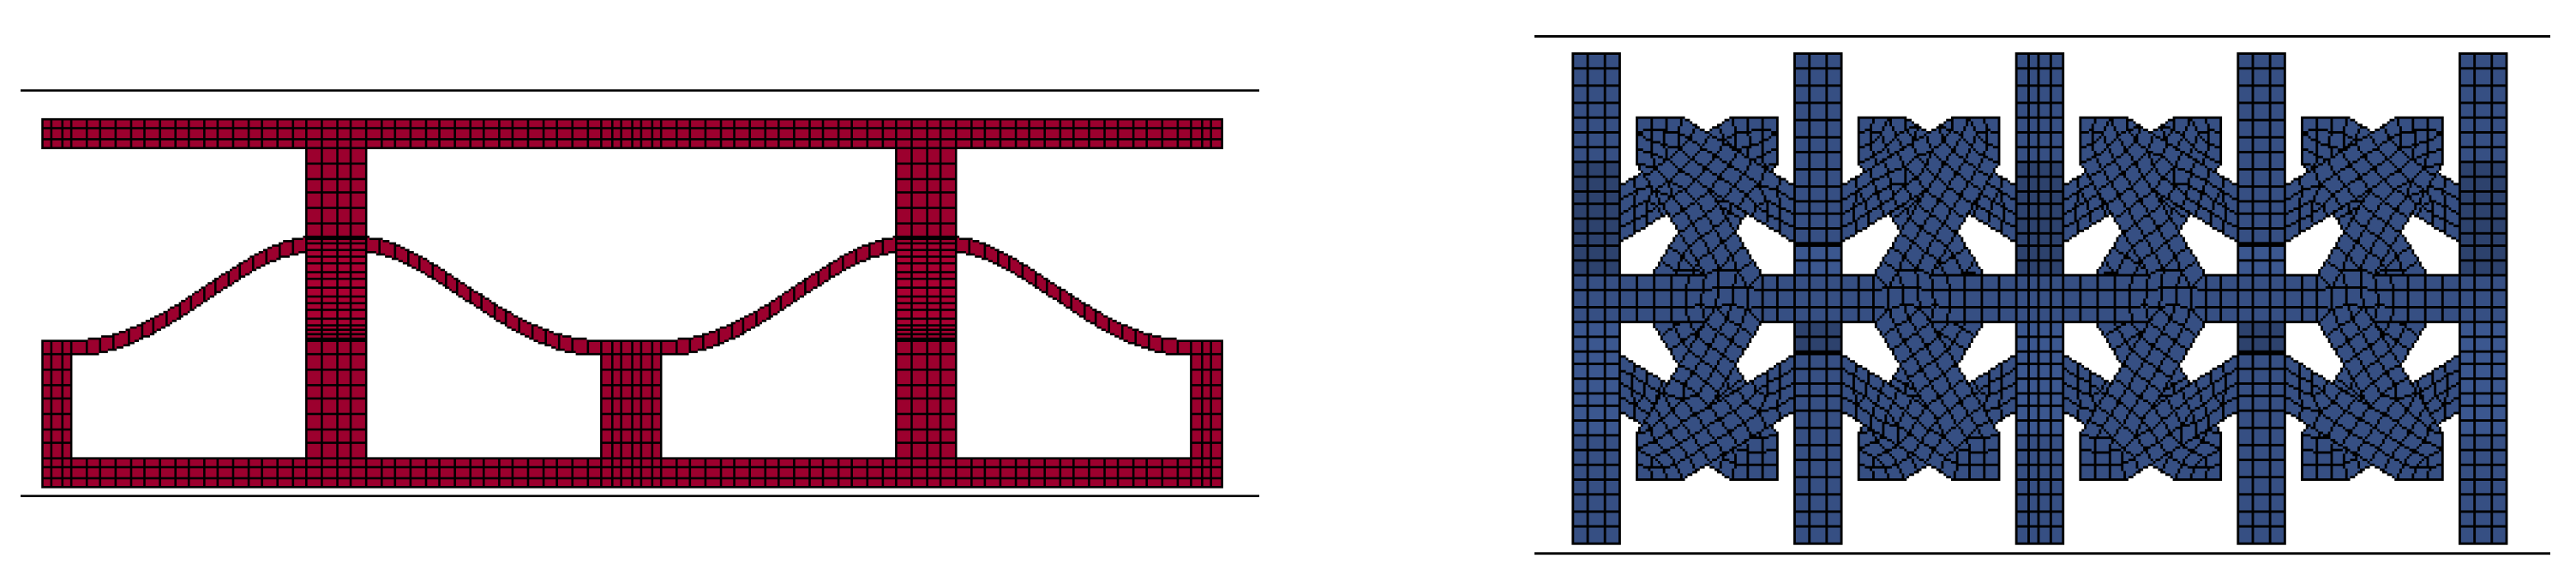
Then, LS-DYNA is used to model the resulting design variables to verify the precision of ANN prediction and the result of NSGA-II optimisation (Figure 12). Table 11 compares predicted design variables, simulation output values, and baseline model.

Figure 12.
Numerical simulation of the baseline (left) and optimised (right) models.
Table 11.
Comparison between baseline and optimised models.
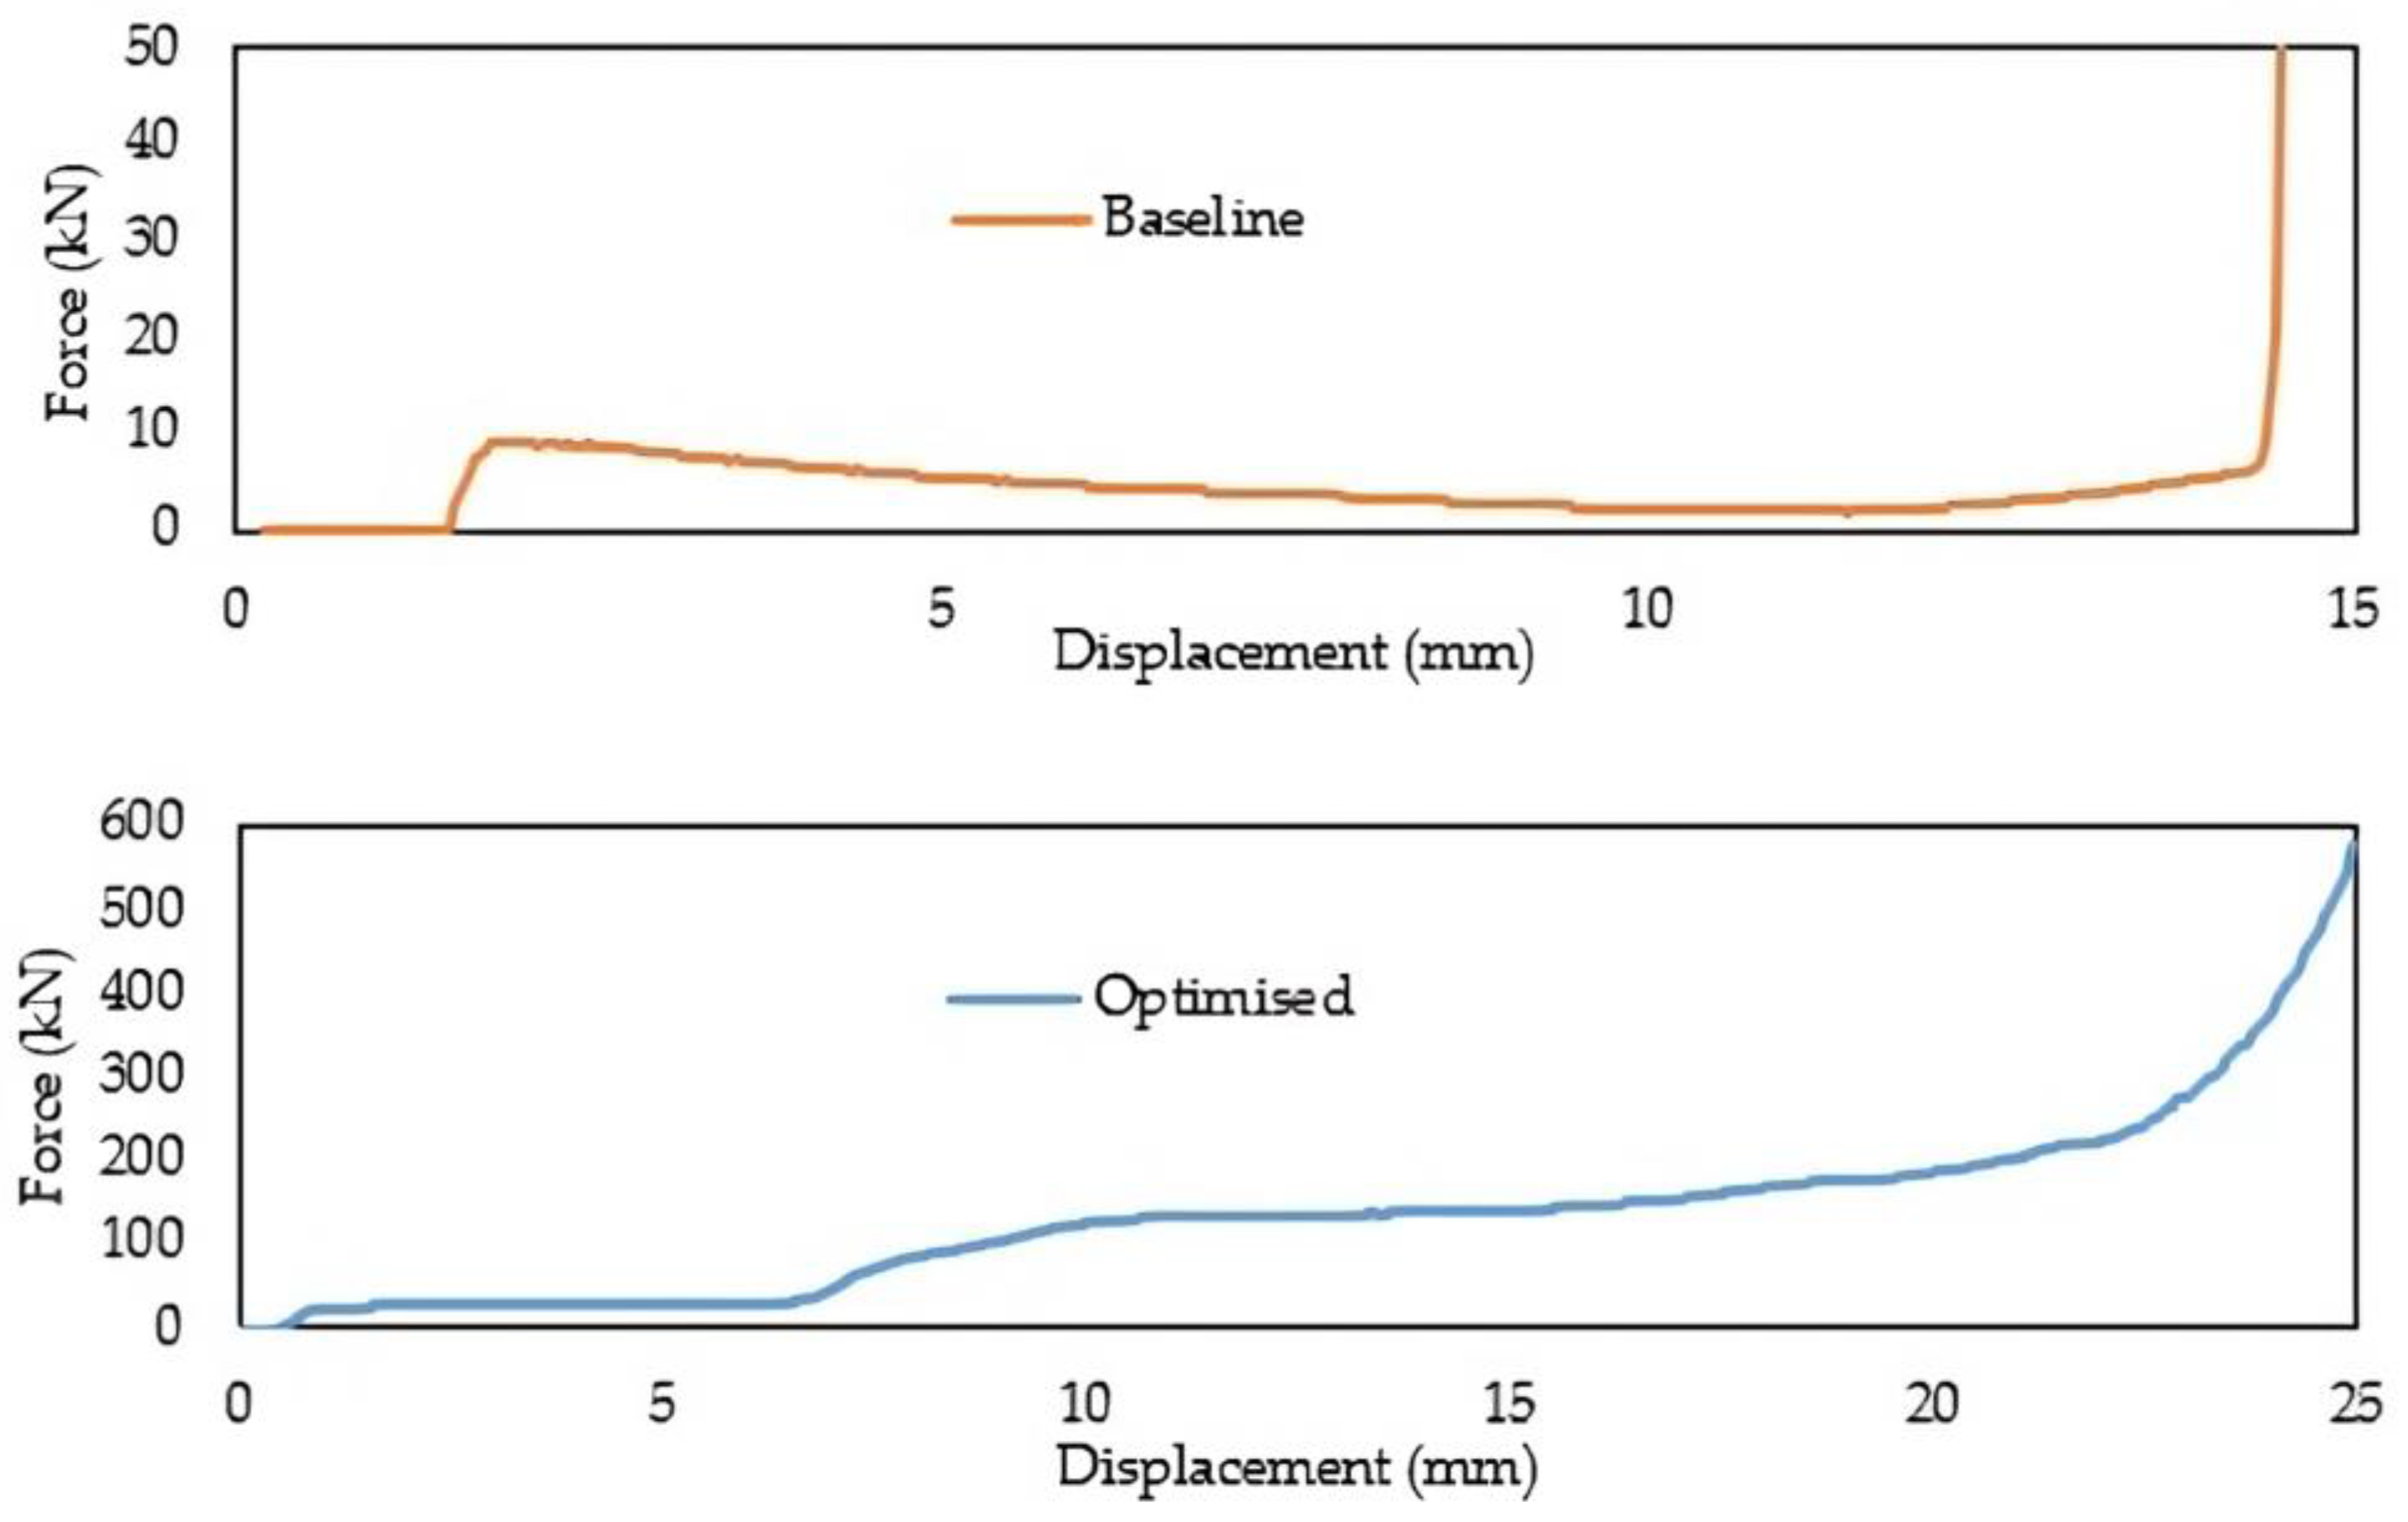
As opposed to the optimised design from Kirana’s research [19] as the baseline model, the optimised model’s SEA value is 5577% higher. The predicted model could successfully estimate the SEA value with the difference between the predicted and actual SEA from the numerical simulation of only 2.83%. Figure 13 displays the force vs. displacement curves for the baseline and optimised models.
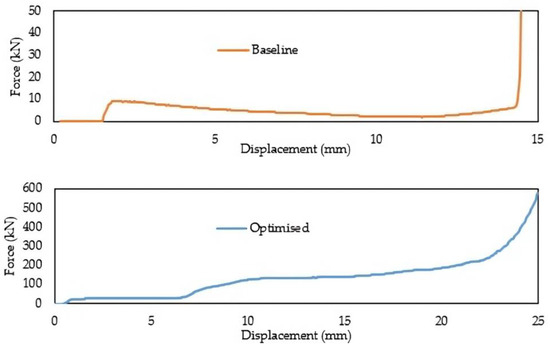
Figure 13.
Force vs. displacement curves for baseline (upper) and optimised (lower) models.
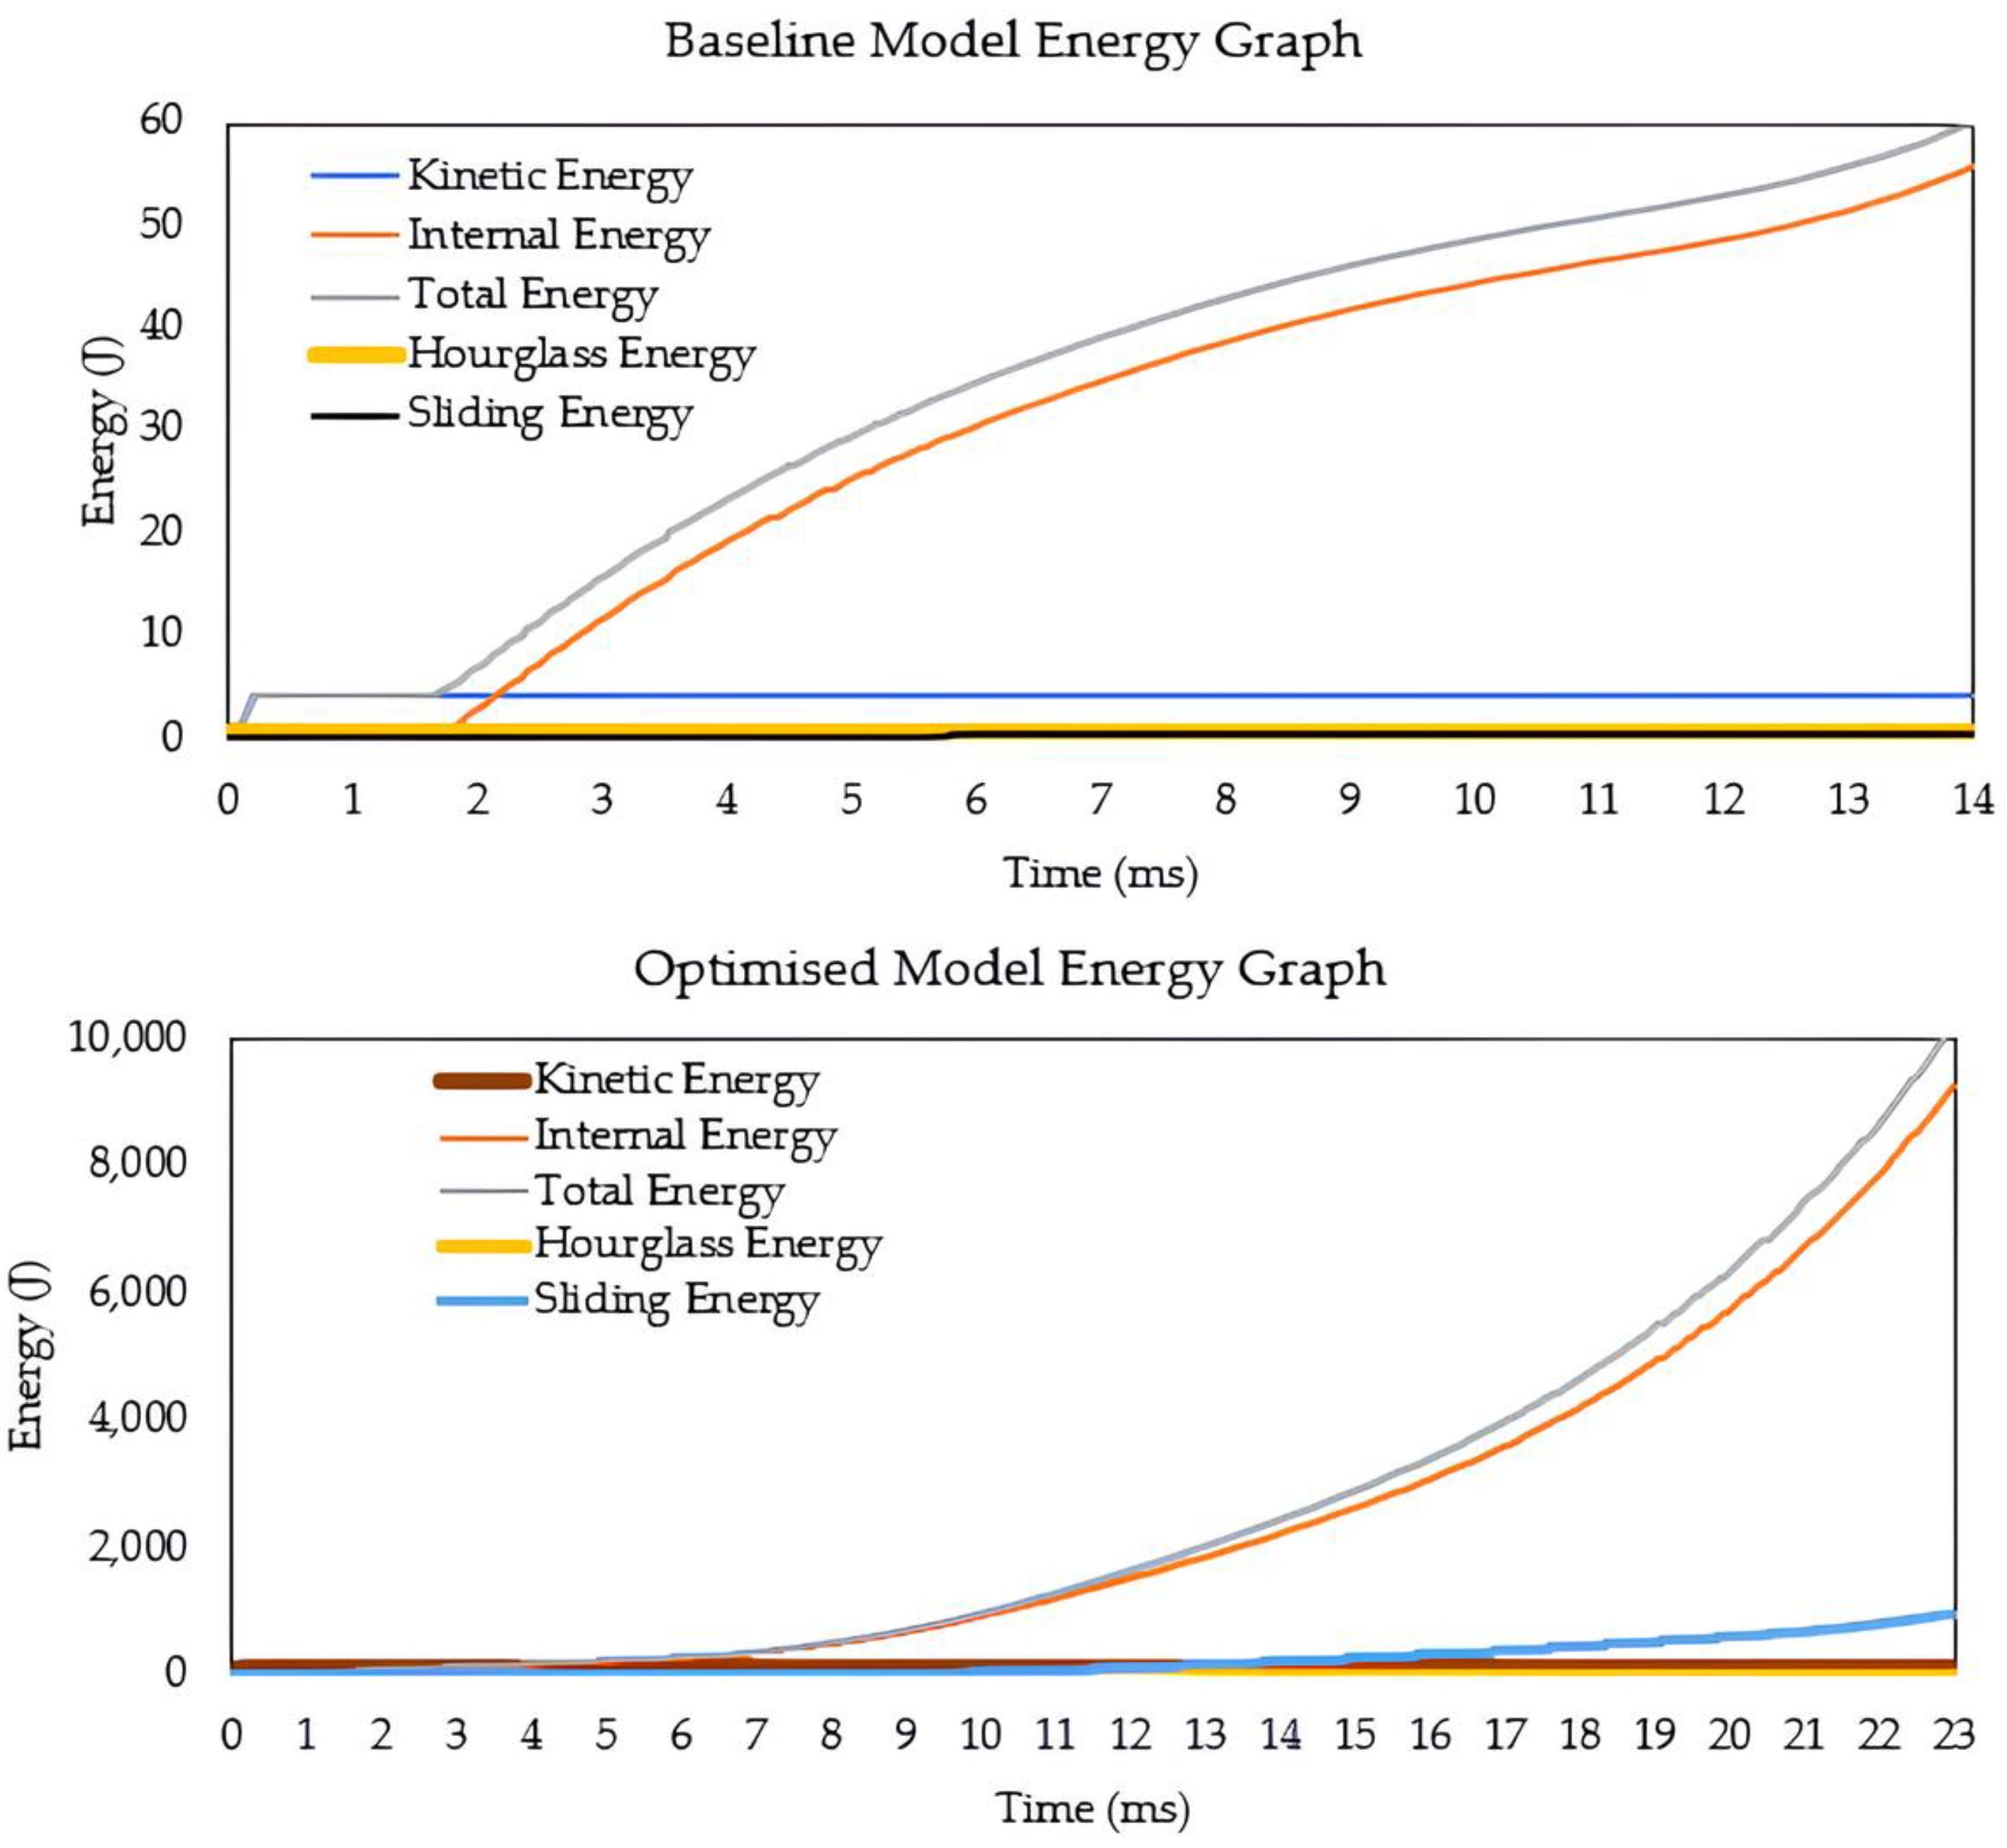
The optimised model’s crushing force is significantly greater than the baseline model’s, leading to a notable increase in energy absorption. Figure 14 also displays the energy plot for both models.
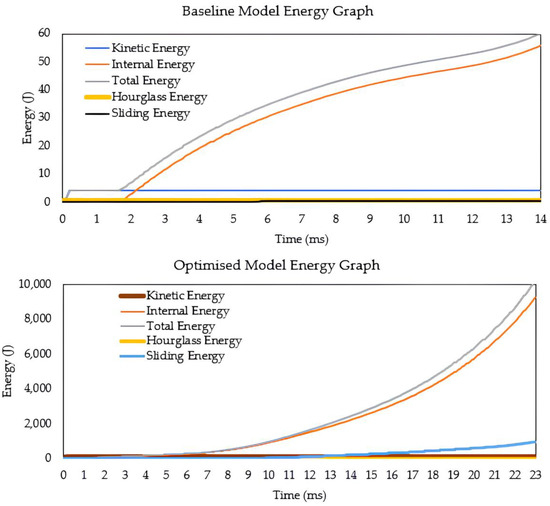
Figure 14.
Energy vs. time curves for baseline (upper) and optimised (lower) models.
Notably, the impactor moves quasi-static, producing a constant kinetic energy. The energy curves exhibit a continuous rise in internal energy and a lack of negative energy, allowing the structure to absorb impact energy.
4. Battery System Analysis with Optimised Protection Configuration
4.1. Decision of Optimised Model
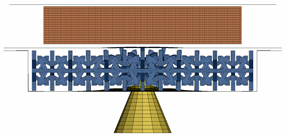
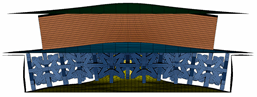
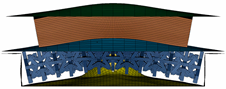
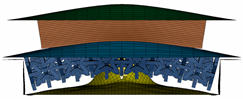
The final simulation shows the effectiveness of the optimised configuration in a ground impact scenario using a prismatic battery positioned on the floor structure of a vehicle. The system is based on the Lightweight Structures Laboratory ITB’s model with minor adjustments from Carakapurwa’s research [21]. The system comprises a prismatic battery, a floor, a plate casing for the protection layout, and an impactor, as shown in Figure 15.
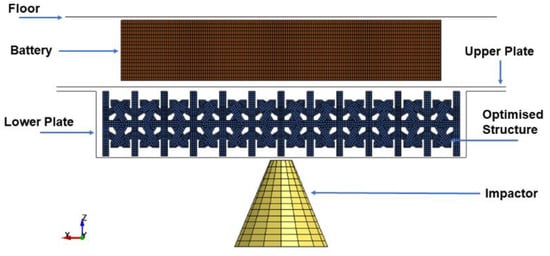
Figure 15.
The complete layout of the battery system.
The optimised structure’s energy absorption capability is to minimise substantial prismatic battery deformation. The failure displacement for the prismatic battery before a runaway is 10.423 mm, in light of Reynolds’s study [22]. This configuration is qualified for battery protection if the structure can stop the battery’s failure.
The vehicle’s floor serves as its structural framework, and the plate casing is arranged in a sandwich pattern, with the cell structure serving as its core. To illustrate a foreign object that can cause damage to the battery pack, the impactor is represented as a cone. The lower and upper plates are modelled using the same material as the floor structure, as summarised in Table 12.
Table 12.
Al2024-T351 material properties.
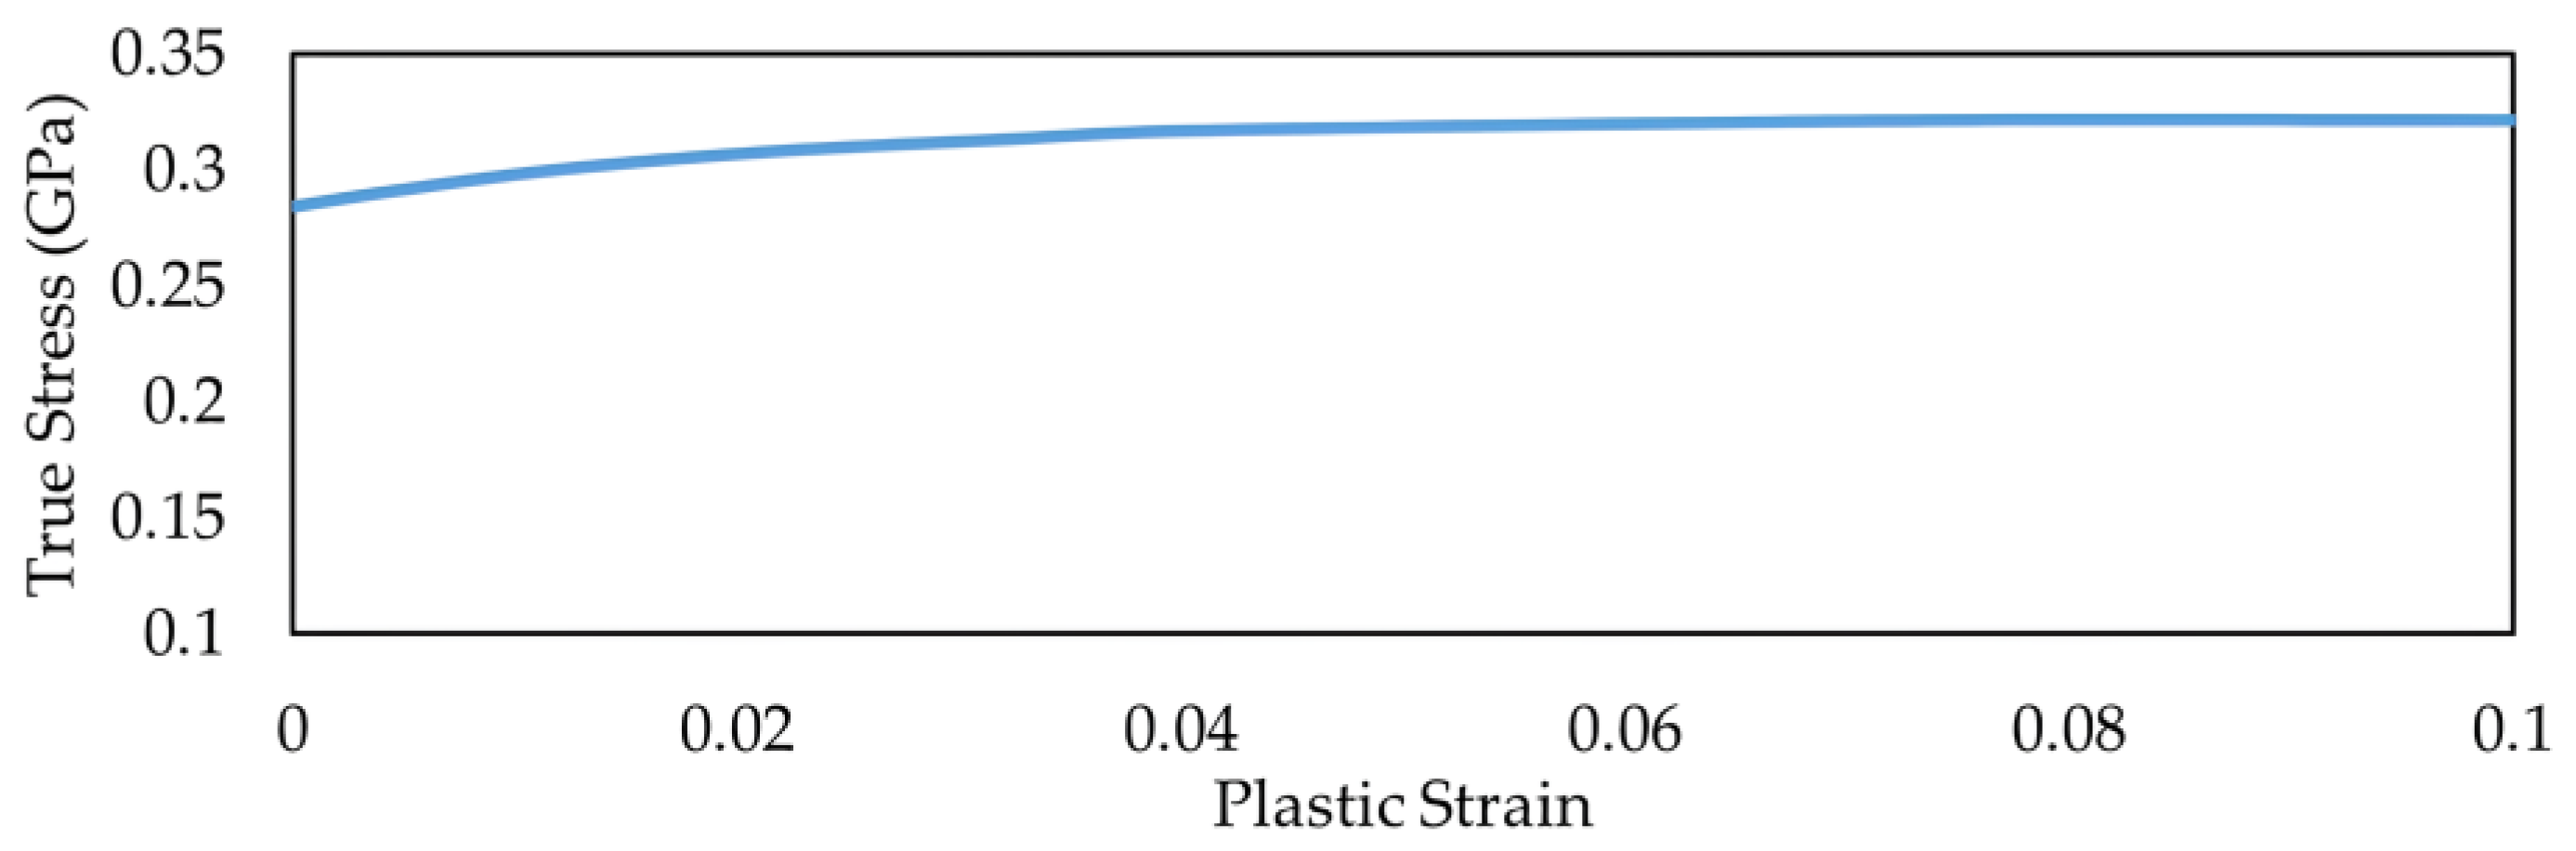
For the prismatic battery, all modelling parameters are based on variables and assumptions in research on prismatic battery cells. To accurately represent the homogenized behaviour of the cell under compression via thickness, material model 63 was chosen. Wei’s research [37] generated the hardening curves (true stress vs. plastic strain) for the aluminium casing of prismatic battery cells, as shown in Figure 16. Based on the slope of the load-deflection curve, the modulus of elasticity is computed as a reference value for the battery module’s engineering stiffness under tensile loading. Since the material is expected to be highly compressive because of the cell porosity, Poisson’s ratio is set to 0.1. The dimensions of floor structure, prismatic battery, upper and lower plates are detailed in Table 13.
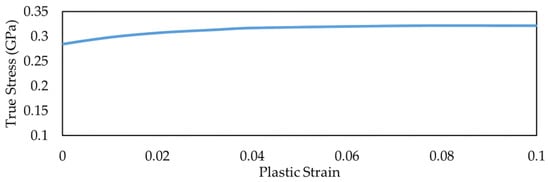
Figure 16.
Polymer Lithium-Ion Battery (PLIB) aluminium casing hardening curve.
Table 13.
Floor, upper, and lower plates dimensions.
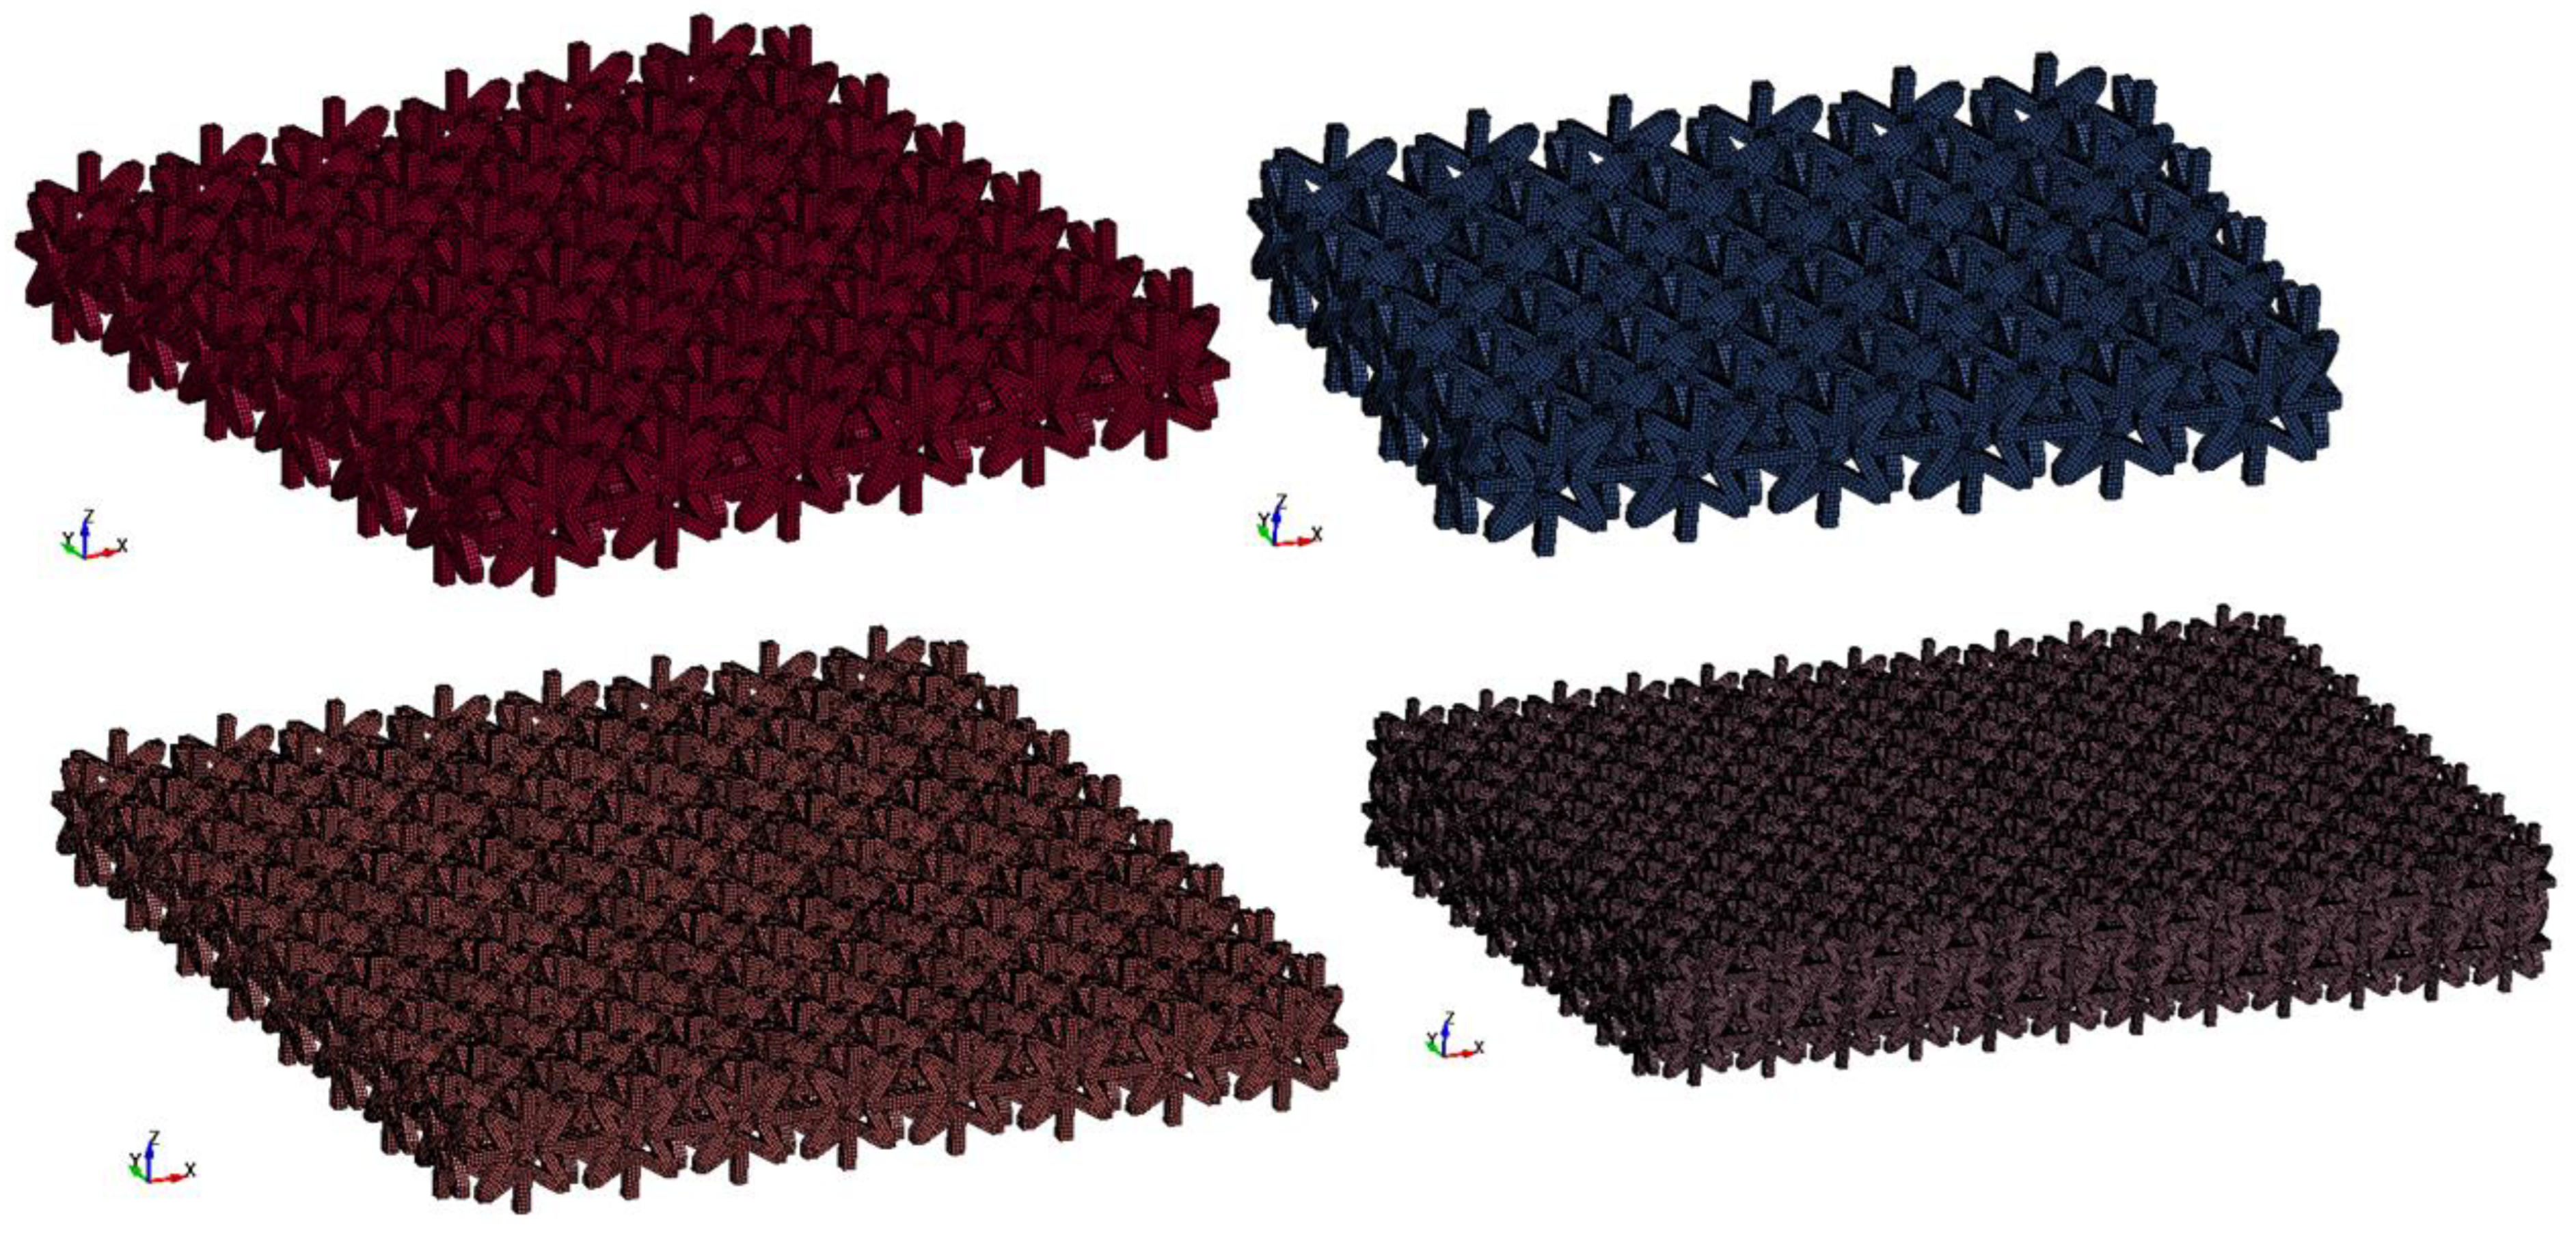
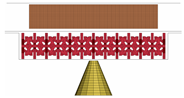
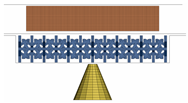
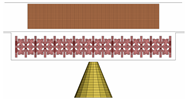
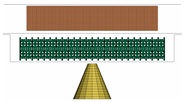
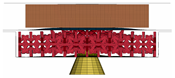
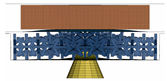
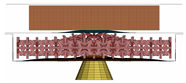
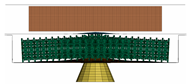
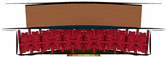
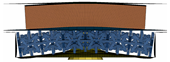
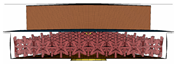
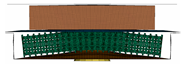
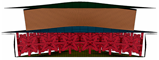
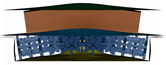
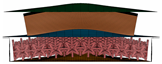
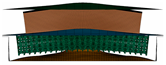
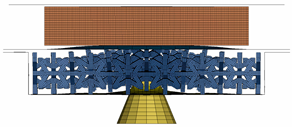
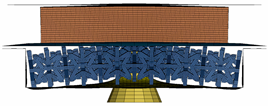
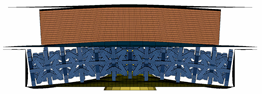
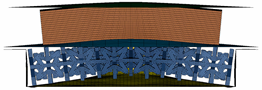
This optimisation has four different cell structure configurations, as shown in Figure 17. The optimised model is used for all cell configurations. Each configuration’s element size equals the thickness of a single cell divided by 3. The dimensions of each configuration are detailed in Table 14.
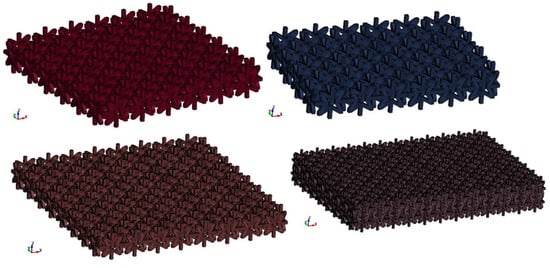
Figure 17.
Cell configuration 1 (upper left), cell configuration 2 (upper right), cell configuration 3 (lower left), cell configuration 4 (lower right).
Table 14.
Cell configurations for battery protection system.
The impactor simulates an outside item striking the battery system upon ground impact. The impactor was modelled as a flat-tipped cone. It weighs 0.77 kg and is designed to move in the direction of Z+ at an initial speed of 42 m/s. The total energy of the system during simulation is equal to the initial kinetic energy of the impactor, which is 678.74 J.
4.2. Results and Discussion
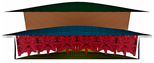
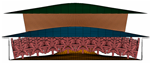
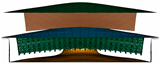
The numerical simulation’s result was applied over a period of 2 ms. Table 15 shows the impact simulation result.
Table 15.
Visualisation of the battery thickness deformation for four configurations during impact. The battery is the most deformed for simulation using configuration 3 and least deformed using configuration 1.
Calculations are made to determine whether the cell structure can minimize battery deformation by measuring the displacement of nodes along the battery. The battery planar, predicted to experience the greatest deformation, is evaluated at the centre. To view the deformation as a time function, the local thickness—the distance between the highest and lowermost nodes—is determined at that point during the whole simulation time interval using Equation (1).
Firstly, to decide the best configuration, the battery must be shielded from impact loads to function properly throughout the simulation. Secondly, the ideal battery protector should be as compact and lightweight as possible because then a smaller amount of energy will be required to operate the vehicle.
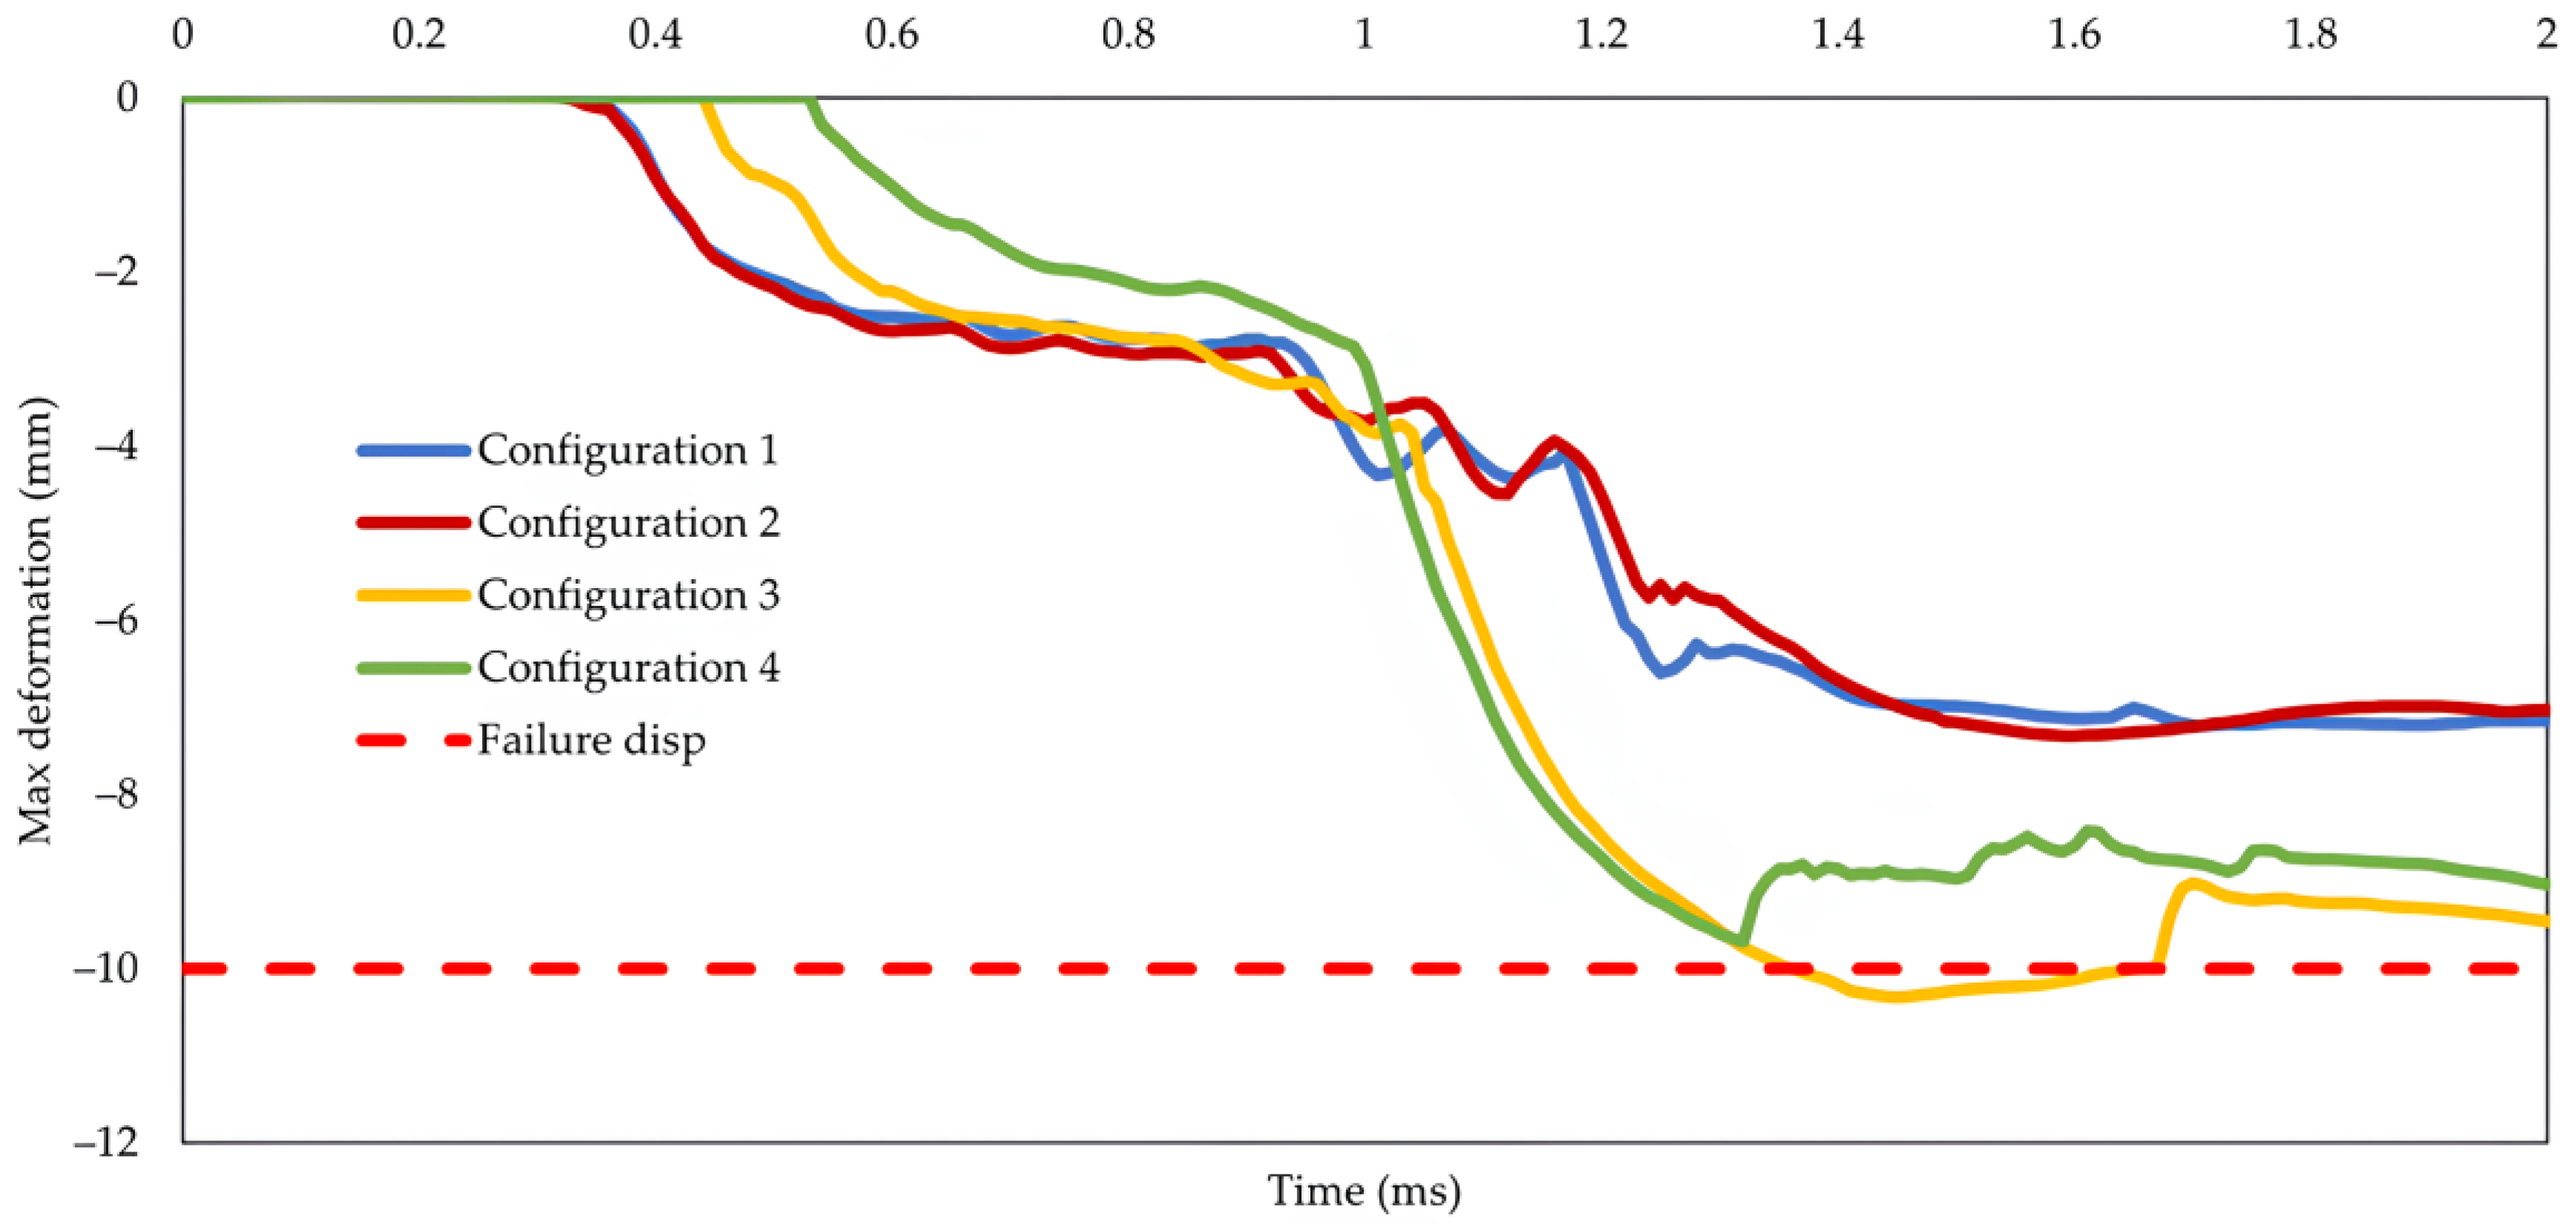
Figure 18 shows the change in maximum deformation for all cell configurations. Only the third configuration fails to protect the battery as it underwent more deformation than is necessary for battery failure. The first, second, and fourth configurations thereby satisfy the first condition. The structure’s dimensions and mass are compared to pick between the other three configurations.

Figure 18.
Change in maximum deformation throughout simulation for all cell configurations.
Table 16 shows that the second configuration is 7.5% heavier than the fourth configuration but 46.6% lighter than the first. However, compared to the first and fourth configurations (46.6% and 15.7%, respectively), the cell structure of the second configuration yields the highest SEA value. Based on this number, the second configuration is the most effective for protecting the battery.
Table 16.
Simulation results comparison for all cell configurations.
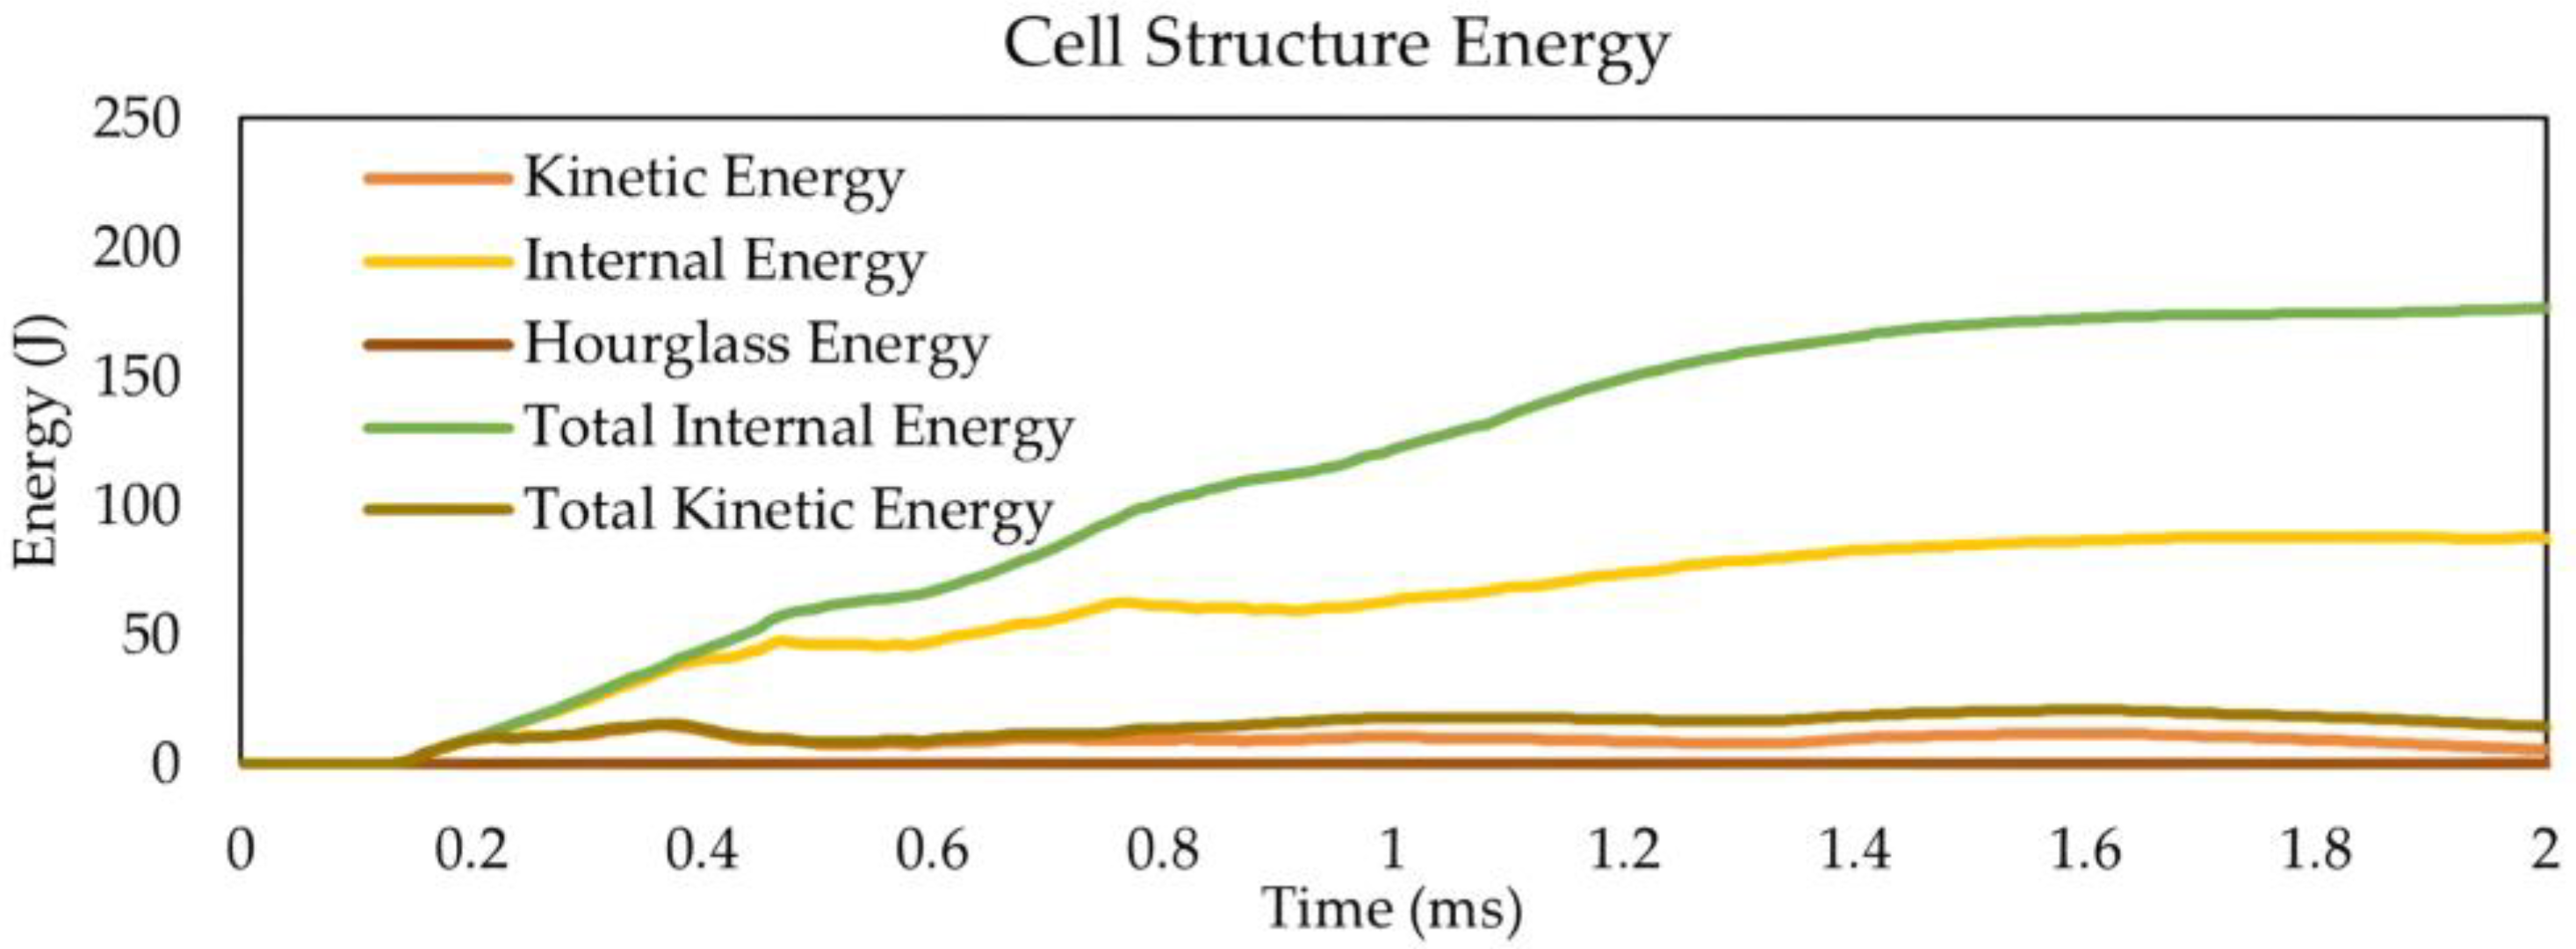
Smaller single-cell designs tend to experience more deformation, which suggests that the amount of deformation experienced by the battery is related to the single-cell structure’s size. Due to the larger single-cell size of the configuration structure, it was predicted that thicker materials possess greater flexural stiffness and are more capable of resisting three-point bending, following Campbell [9]. By comparing the third and fourth configurations, it is possible to see that when modelling many stacks for smaller single-cell structures, the SEA increases. The energy values for the battery system and the second configuration cell structure are also plotted to test the structure’s capacity to absorb impact energy.
As shown in Figure 19, the system’s total energy (about 679 J) remains constant throughout the simulation. The simulation result in Table 17 shows some damage to the cell structure starting at 1 ms, indicating that the material’s failure criterion has been met and some of the cell’s elements have begun to erode. The corroded elements are also causing a slight decrease in the energy of the cell structure (Figure 20). For the simulation result to be accurate, the system’s sliding energy, the sum of friction energy from all contacts, must be positive. Due to the initial velocity of the impactor, kinetic energy is the only energy in the system. It gradually decreases as internal energy increases, corresponding to the actual physical situation where the impactor is slowed down when interacting with the battery protector.
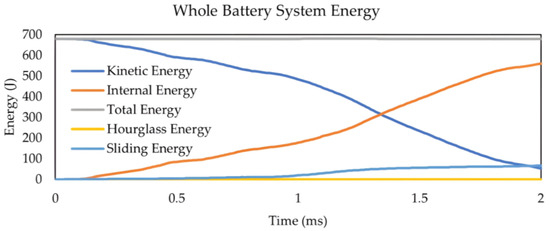
Figure 19.
Energy vs. time curve for whole battery system.
Table 17.
Numerical simulation results for the optimised cell configuration.

Figure 20.
Energy vs. time curve for metastructure cell structure.
A battery failure can be avoided by the optimised structure using configurations 1, 2, and 4, given that no point has been compressed more than 10.4 mm. Considering the dimension, mass, and specific energy consumption value, the second configuration is the best to protect the prismatic battery.
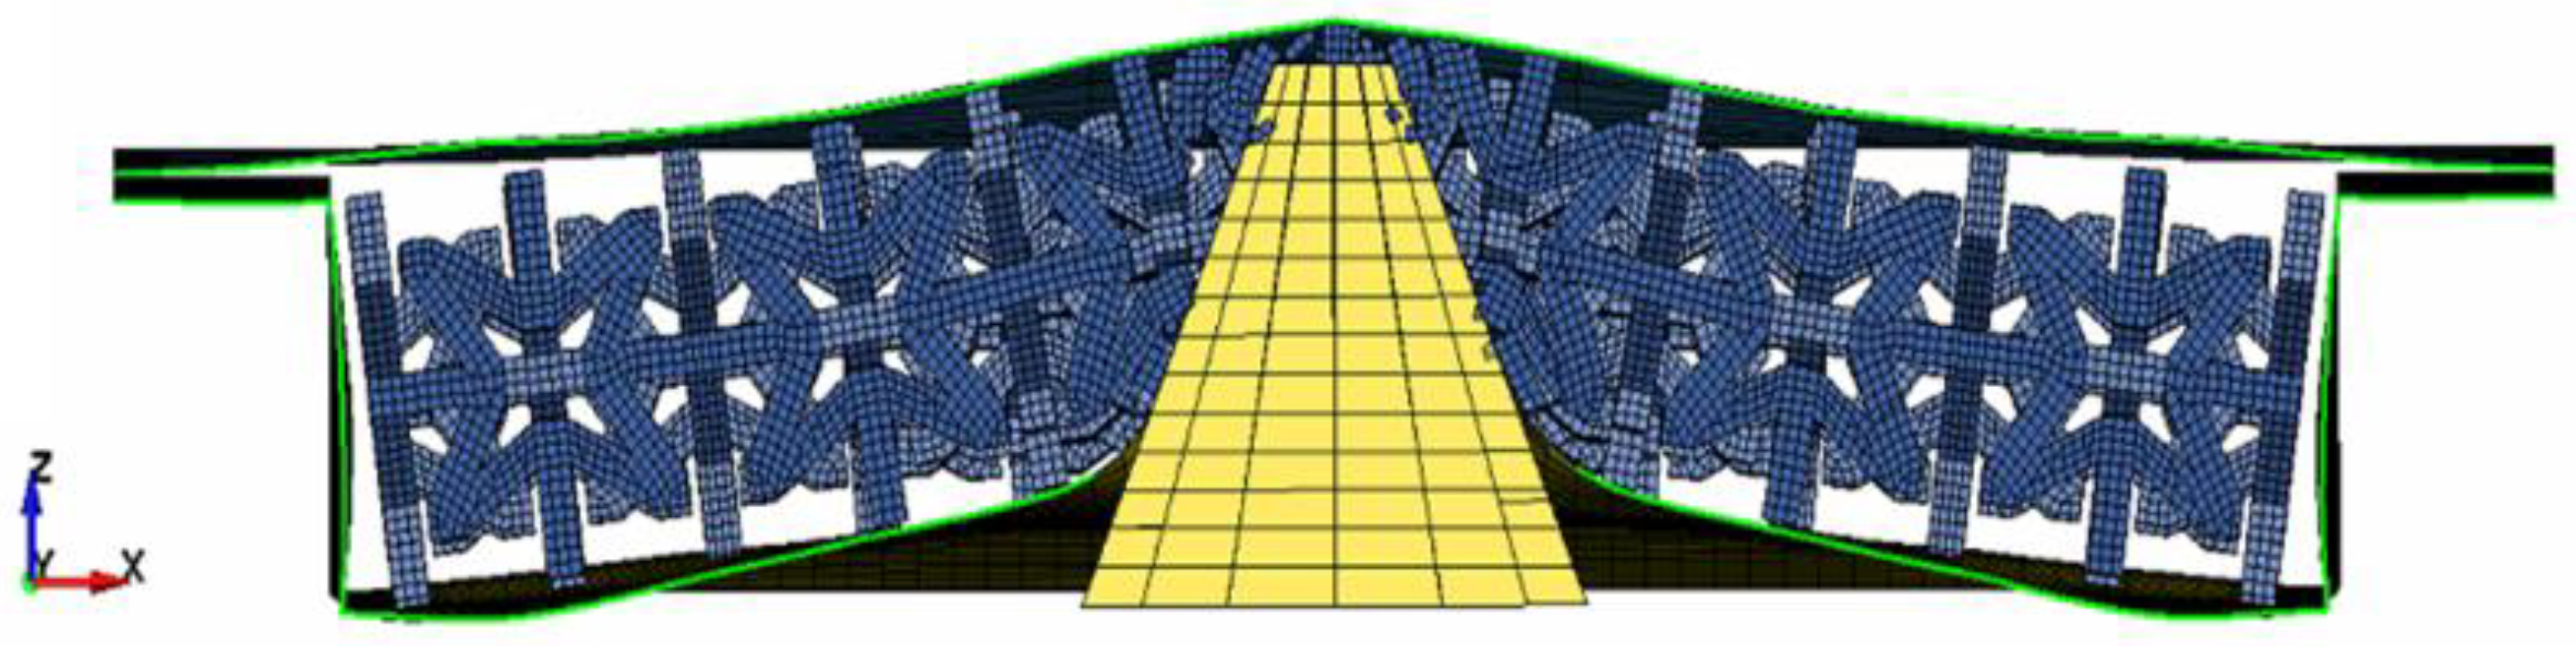
Nevertheless, the cell structure, which is supposed to become denser as compression occurs, could not form its auxetic characteristic due to the crushing trend seen in Figure 21. Instead, the impulsive force caused the cell structure to lift, which may be caused by the concentrated (not uniformly dispersed) impact mechanism at one point.
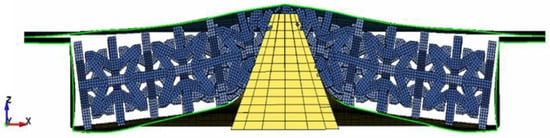
Figure 21.
Numerical simulation result of the most optimised battery protector system configuration using concentrated impactor.
On the other hand, the design optimisation for data training utilised a rigid plane as the impactor to yield an even distribution. The cell structure can be scaled up to the point where the side of the cell is wide enough to bend when in contact with enclosing plates to avoid this, resulting in the auxetic feature shown in Figure 22.
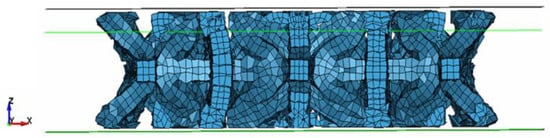
Figure 22.
Numerical simulation result of the optimised cell structure for quasi-static loading using rigid plane impactor from data training process.
5. Conclusions
Preliminary modelling and validation of simulation were used to determine the valid modelling parameters and baseline performance using the optimised beam-type bi-stable metastructure from Kirana’s research [19]. The simulation has shown that the baseline structure can absorb a crash energy of 58.7 J. The SEA value of the baseline model is 996.9 J/kg, given its mass of 0.0589 kg.
ANN and NSGA-II were used to predict the optimised metastructure configuration. It is found that the star-shaped auxetic cell can absorb the most crushing energy while having the least amount of mass, which results in the highest SEA. When subjected to a uniformly dispersed load, the cell structure has auxetic characteristics due to the crushing trend where the centre of the cell laterally shrinks in the transversal direction, as shown in Figure 22.
The optimal cell (Figure 12) has the following dimensions: 10.2 mm inner spacing, 2.9 mm thickness, and consists of 1 stack. With 0.049 kg of mass and 2772.38 J of absorbed energy, the optimal cell has a SEA value of 56,596.28 J/kg or 5577% higher than the baseline model, according to the numerical simulation results.
Furthermore, the best cell configuration is the second arrangement, based on the whole battery system simulation results and comparison analysis, (Figure 17), in which the optimised cell is arranged in cells for a total dimension of mm. This dimension formed a 95,695.6 volume with 0.258 kg of mass. With this arrangement, the battery’s maximum deformation is 7.33 mm, significantly less than the deformation required for prismatic battery failure (10.423 mm).
Future research is suggested to improve this work by extending the data training process, investigating different machine learning methods, and also validating other shape-type options. The data training process can be developed by considering new geometrical shapes and additional materials such as composites, simulating additional impactor conditions, and other loading scenarios with manufacturing aspects in the simulation. Another optimisation method to be explored can conclude single-objective genetic algorithms that are Pareto-dominance-based.
Author Contributions
Conceptualization, methodology, validation, analysis review, resources, writing—review and editing, supervision, project administration, S.P.S.; Numerical modelling, numerical analysis and validation, investigation, data curation, writing—original draft preparation, writing—review and editing, visualization, I.C.F.; Methodology, validation, analysis review, resources, writing—review and editing, supervision, project administration, D.W. and Methodology, validation, analysis review, resources, writing—review and editing, supervision A.N.P. All authors have read and agreed to the published version of the manuscript.
Funding
The authors received no specific funding from any organisation for the submitted work. No funding was given to assist with the preparation of this manuscript and conducting this study.
Data Availability Statement
Due to confidentiality agreements, data created and analysed during the research is available from the corresponding author on request.
Acknowledgments
The authors would like to acknowledge the Teladan scholarship program from Tanoto Foundation (Jakarta, Indonesia) for providing support in fulfilling the degree of Sarjana Teknik from Institut Teknologi Bandung.
Conflicts of Interest
The authors declare no conflict of interest.
References
- Fleck, A. EV Market Revenue Set To Hit $384 Billion in 2022. Available online: https://www.statista.com/chart/28211/electric-vehicles-revenue-projections/ (accessed on 14 July 2023).
- The Global Electric Vehicle Market Overview in 2023: Statistics & Forecasts. Available online: https://www.virta.global/en/global-electric-vehicle-market#one (accessed on 14 July 2023).
- Batteries for Electric Vehicles. Available online: https://afdc.energy.gov/vehicles/electric_batteries.html (accessed on 14 July 2023).
- Preventing Fire and/or Explosion Injury from Small and Wearable Lithium Battery Powered Devices. Available online: https://www.osha.gov/sites/default/files/publications/shib011819.pdf (accessed on 14 July 2023).
- Sahraei, E.; Meier, J.; Wierbicki, T. Characterizing and Modeling Mechanical Properties and Onset of Short Circuit for Three Types of Lithium-Ion Pouch Cells. J. Power Sources 2014, 247, 503–516. [Google Scholar] [CrossRef]
- Chen, Y.; Kang, Y.; Zhao, Y.; Wang, L.; Liu, J.; Li, Y.; Liang, Z.; He, X.; Li, X.; Tavajohi, N.; et al. A Review of Lithium-Ion Battery Safety Concerns: The Issues, Strategies, and Testing Standards. J. Energy Chem. 2021, 59, 83–99. [Google Scholar] [CrossRef]
- Xia, Y.; Wierzbicki, T.; Sahraei, E.; Zhang, X. Damage of Cells and Battery Packs Due to Ground Impact. J. Power Sources 2014, 267, 78–97. [Google Scholar] [CrossRef]
- Yazdani Sarvestani, H.; Akbarzadeh, A.H.; Mirbolghasemi, A.; Hermenean, K. 3D Printed Meta-Sandwich Structures: Failure Mechanism, Energy Absorption and Multi-Hit Capability. Mater. Des. 2018, 160, 179–193. [Google Scholar] [CrossRef]
- Campbell, F.C., Jr. Manufacturing Technology for Aerospace Structural Materials; Elsevier: Amsterdam, The Netherlands, 2006; ISBN 978-1-85617-495-4. [Google Scholar]
- Bertoldi, K.; Vitelli, V.; Christensen, J.; Van Hecke, M. Flexible Mechanical Metamaterials. Nat. Rev. Mater. 2017, 2, 17066. [Google Scholar] [CrossRef]
- Che, K.; Yuan, C.; Wu, J.; Jerry Qi, H.; Meaud, J. Three-Dimensional-Printed Multistable Mechanical Metamaterials with a Deterministic Deformation Sequence. J. Appl. Mech. 2017, 84, 011004. [Google Scholar] [CrossRef]
- Liu, J.; Chang, J.; Yu, J.; Zhang, W.; Huang, S. Machine Learning-Based Optimization Design of Bistable Curved Shell Structures with Variable Thickness. Structures 2023, 52, 175–186. [Google Scholar] [CrossRef]
- Gibson, L.J.; Ashby, M.F. Cellular Solids: Structure and Properties. Available online: https://www.cambridge.org/core/books/cellular-solids/BC25789552BAA8E3CAD5E1D105612AB5 (accessed on 14 July 2023).
- Zhang, J.; Lu, G.; You, Z. Large Deformation and Energy Absorption of Additively Manufactured Auxetic Materials and Structures: A Review. Compos. Part B Eng. 2020, 201, 108340. [Google Scholar] [CrossRef]
- Wang, L.; Sun, J.; Ding, T.; Liang, Y.; Ho, J.C.M.; Lai, M.H. Manufacture and Behaviour of Innovative 3D Printed Auxetic Composite Panels Subjected to Low-Velocity Impact Load. Structures 2022, 38, 910–933. [Google Scholar] [CrossRef]
- Ribeiro Filho, S.L.M.; Tonatto, M.L.P.; Hallak Panzera, T.; Remillat, C.D.L.; Scarpa, F. Multi-Objective Optimisation of Aluminium Skins and Recycled/Perforated PET Foams Sandwich Panels Subjected to Impact Loads. Structures 2022, 43, 1750–1765. [Google Scholar] [CrossRef]
- Brendon Francisco, M.; Luiz Junho Pereira, J.; Augusto Vilas Boas Vasconcelos, G.; Simões da Cunha Jr, S.; Ferreira Gomes, G. Multiobjective Design Optimization of Double Arrowhead Auxetic Model Using Lichtenberg Algorithm Based on Metamodelling. Structures 2022, 45, 1199–1211. [Google Scholar] [CrossRef]
- Nasrullah, A.I.H.; Santosa, S.P.; Dirgantara, T. Design and Optimization of Crashworthy Components Based on Lattice Structure Configuration. Structures 2020, 26, 969–981. [Google Scholar] [CrossRef]
- Kirana, S. Studi Parametrik Konfigurasi Metastruktur Logam Berbasis Open Cell dengan Pembebanan Kompresi untuk Aplikasi Kendaraan Tempur; Institut Teknologi Bandung: Bandung, Indonesia, 2021. [Google Scholar]
- Biharta, M.A.S.; Santosa, S.P.; Widagdo, D.; Gunawan, L. Design and Optimization of Lightweight Lithium-Ion Battery Protector with 3D Auxetic Meta Structures. World Electr. Veh. J. 2022, 13, 118. [Google Scholar] [CrossRef]
- Carakapurwa, F.E.; Santosa, S.P. Design Optimization of Auxetic Structure for Crashworthy Pouch Battery Protection Using Machine Learning Method. Energies 2022, 15, 8404. [Google Scholar] [CrossRef]
- Reynolds, C.M.A. Relationship of Mechanical Deformations and Electrochemical Properties of Lithium Ion Batteries—An Experimental Study. Available online: https://dspace.mit.edu/bitstream/handle/1721.1/144746/reynolds-cmar14-NavE-MechE-2022-thesis.pdf?sequence=1&isAllowed=y (accessed on 1 March 2023).
- Zhang, W.; Zhao, S.; Sun, R.; Scarpa, F.; Wang, J. In-Plane Mechanical Behavior of a New Star-Re-Entrant Hierarchical Metamaterial. Polymers 2019, 11, 1132. [Google Scholar] [CrossRef]
- Yang, H.; Wang, B.; Ma, L. Mechanical Properties of 3D Double-U Auxetic Structures. Int. J. Solids Struct. 2019, 180–181, 13–29. [Google Scholar] [CrossRef]
- Zhang, Y.; Tichem, M.; Keulen, F.V. Rotational Snap-through Behavior of Multi-Stable Beam-Type Metastructures. Int. J. Mech. Sci. 2021, 193, 106172. [Google Scholar] [CrossRef]
- AISI Type 304 Stainless Steel. Available online: https://www.matweb.com/search/datasheet.aspx?matguid=bd20a4281ae3430d97cfbebf6904ec50&ckck=1 (accessed on 14 July 2023).
- ASM Material Data Sheet. Available online: https://asm.matweb.com/search/SpecificMaterial.asp?bassnum=ma6061t6 (accessed on 14 July 2023).
- García, R.; López, V.-H.; Natividad, C.; Ambriz, R.-R.; Salazar, M. Fusion Welding with Indirect Electric Arc. In Arc Welding; IntechOpen: London, UK, 2011; pp. 21–44. ISBN 978-953-307-642-3. [Google Scholar]
- Abotula, S.; Chalivendra, V. An Experimental and Numerical Investigation of the Static and Dynamic Constitutive Behaviour of Aluminium Alloys. J. Strain Anal. Eng. Des. 2010, 1, 1–11. [Google Scholar] [CrossRef]
- Joseph, V.R. Optimal Ratio for Data Splitting. Stat. Anal. Data Min. ASA Data Sci. J. 2022, 15, 531–538. [Google Scholar] [CrossRef]
- Sinharay, S. Discrete Probability Distributions. In International Encyclopedia of Education, 3rd ed.; Peterson, P., Baker, E., McGaw, B., Eds.; Elsevier: Oxford, UK, 2010; pp. 132–134. ISBN 978-0-08-044894-7. [Google Scholar]
- McKay, M.D.; Beckman, R.J.; Conover, W.J. A Comparison of Three Methods for Selecting Values of Input Variables in the Analysis of Output from a Computer Code. Technometrics 1979, 21, 239–245. [Google Scholar] [CrossRef]
- Mckay, M.D.; Beckman, R.J.; Conover, W.J. A Comparison of Three Methods for Selecting Values of Input Variables in the Analysis of Output from a Computer Code. Technometrics 2000, 42, 55–61. [Google Scholar] [CrossRef]
- Gholamy, A.; Kreinovich, V.; Kosheleva, O. Why 70/30 or 80/20 Relation between Training and Testing Sets: A Pedagogical Explanation. In Departmental Technical Reports (CS); 2018; pp. 1–6. Available online: https://scholarworks.utep.edu/cs_techrep/1209 (accessed on 2 January 2023).
- Tan, H.; He, Z.; Li, E.; Cheng, A.; Chen, T.; Tan, X.; Li, Q.; Xu, B. Crashworthiness Design and Multi-Objective Optimization of a Novel Auxetic Hierarchical Honeycomb Crash Box. Struct. Multidiscip. Optim. 2021, 64, 2009–2024. [Google Scholar] [CrossRef]
- Irawan, D.; Santosa, S.P.; Jusuf, A.; Sambegoro, P.L. Sandwich Panel Composite Based Light-Weight Structure Design for Reserved Energy Storage System (RESS) Protection. In Proceedings of the 2019 6th International Conference on Electric Vehicular Technology, Bali, Indonesia, 18–21 November 2019. [Google Scholar]
- Qiao, H.; Wei, Q. 10-Functional Nanofibers in Lithium-Ion Batteries. In Functional Nanofibers and Their Applications; Wei, Q., Ed.; Woodhead Publishing Series in Textiles; Woodhead Publishing: Sawston, UK, 2012; pp. 197–208. ISBN 978-0-85709-069-0. [Google Scholar]


Disclaimer/Publisher’s Note: The statements, opinions and data contained in all publications are solely those of the individual author(s) and contributor(s) and not of MDPI and/or the editor(s). MDPI and/or the editor(s) disclaim responsibility for any injury to people or property resulting from any ideas, methods, instructions or products referred to in the content. |
© 2024 by the authors. Licensee MDPI, Basel, Switzerland. This article is an open access article distributed under the terms and conditions of the Creative Commons Attribution (CC BY) license (https://creativecommons.org/licenses/by/4.0/).