Article

Effect of Mn Substitution on GeFe2O4 as an Anode for Sodium Ion Batteries

1
Chemistry Department, University of Pavia, Viale Taramelli 16, 27100 Pavia, Italy
2
RSE—Ricerca Sul Sistema Energetico, Via R. Rubattino 54, 20134 Milano, Italy
3
C.S.G.I., Consorzio Per i Sistemi a Grande Interfase, Via Della Lastruccia 3, 50019 Sesto Fiorentino (FI), Italy
4
National Reference Centre for Electrochemical Energy Storage (GISEL)-INSTM, Via G. Giusti 9, 50121 Firenze, Italy
*
Author to whom correspondence should be addressed.
Batteries 2024, 10(2), 48; https://doi.org/10.3390/batteries10020048
Submission received: 21 December 2023 / Revised: 17 January 2024 / Accepted: 22 January 2024 / Published: 27 January 2024

Abstract

:
GeFe2O4 (GFO), with its intriguing intercalation mechanism based on alloying–conversion reactions, was recently proposed as an anode material for sodium ion batteries (SIBs). However, drawbacks related to excessive volume expansion during intercalation/deintercalation and poor electronic conductivity enormously hinder its practical application in batteries. In this regard, some experimental strategies such as cation substitutions and proper architectures/carbon coatings can be adopted. In this paper, pure and Mn-doped GFO samples were prepared by hydrothermal synthesis. The doped samples maintained the spinel cubic structure and the morphology of pure GFO. The electrochemical tests of the samples, performed after proper carbon coating, showed the expected redox processes involving both Ge and Fe ions. The Mn doping had a positive effect on the capacity values at a low current density (about 350 mAh/g at C/5 for the Mn 5% doping in comparison to 300 mAh/g for the pure sample). Concerning the cycling stability, the doped samples were able to provide 129 mAh/g (Mn 10%) and 150 mAh/g (Mn 5%) at C/10 after 60 cycles.

Graphical Abstract

1. Introduction

The transition from fossil fuels to sustainable energy resources, which are in many cases intermittently available, requires the use of suitable energy storage systems (ESSs). Rechargeable batteries represent one of the most diffused EESs thanks to their high conversion efficiency and eco-friendly nature. In this field lithium-ion batteries (LIBs) have become essential, but the growing market for LIBs will inevitably lead to a shortage of lithium resources and an increase in the price of lithium, making the individuation and introduction of concrete substitutes urgent.
Sodium-ion batteries (SIBs) are considered one of the most promising alternatives to LIBs; the main reasons for this are the chemical similarity of sodium and lithium ions and the high natural abundance of sodium, which is the sixth most abundant element on Earth and well-distributed worldwide, with apparently unlimited availability [1,2]. In addition, sodium does not alloy with aluminum, making its use as anode collector in SIBs possible in place of the more expensive copper that is used in LIBs, leading to a sensible reduction in costs.
Notwithstanding the similar electrochemical mechanisms that could allow for the use of the same electrodes for LIBs and SIBs, there are some drawbacks related to the use of sodium; one of the biggest of these drawbacks is represented by its large ionic radius (Na+ 1.02 Å; Li+ 0.76 Å), resulting in sluggish reactions kinetics as well as huge volume expansions during the insertion and deinsertion processes [3,4]. In addition, the heavier atomic mass of sodium and its lower standard electrochemical potential in comparison to lithium make it difficult for SIBs to exceed LIBs in terms of energy density. For this reason, SIBs are suitable for applications prioritising cost-effectiveness rather than energy density as the most critical issue, such as in large-scale electrical EESs. As a result, SIBs have attracted attention as low-cost rechargeable batteries.
To improve SIBs’ performance, it is necessary to find innovative suitable materials for the realization of both their anode and cathode compartments, as well as for their electrolytes [5,6]. For example, the well-diffused and commercialized graphite anodes employed in LIBs are unsuitable for SIBs [7]. Concerning the anodes, three different types are conventionally defined for both LIBs and SIBs, according to their functioning mechanism: namely, intercalation-/de-intercalation-based, alloying-reaction-based, and conversion-reaction-based materials.
Alloy-type anodes represent a promising category of materials for battery application, thanks to their ability to react electrochemically with sodium, as well as with lithium, to form binary compounds with high specific capacities [8,9]. However, these materials suffer from the same issues—in particular, their large volume expansion during charge and discharge, leading to the pulverization of the anode material and hence to rapid capacity fading. This requires that the anode materials for SIBs be better engineered to render them able to withstand several hundred cycles without experiencing capacity fading.
Materials based on the conversion reaction mechanism are particularly intriguing due to their high theoretical capacity and improved discharge potential compared to graphite, as well as their ability to avoid dendrite formation under fast discharging rates. In this regard, germanium ternary oxides have been considered as novel alternatives for SIBs thanks to their ability to incorporate more than one Na+ ion, allowing significantly high theoretical capacities. Within this family, GeFe2O4 (GFO) stands out as a promising SIB anode material [10] thanks to its low toxicity, environmental friendliness, and especially high theoretical specific capacity due to the combination of its conversion and alloying reactions, as represented in equations 1–3 below:
Fe2GeO4 + 8Na+ + 8e → 2Fe + Ge + 4Na2O
Ge + xNa+ + xe ↔ NaxGe
2Fe + 3Na2O ↔ Fe2O3 + 6Na+ + 6e
Unfortunately, GeFe2O4 has a very poor cycling stability because of the large volume expansions that occur during sodiation/desodiation and its poor electronic conductivity, similar to many other spinel phases [8]. To avoid these issues, the design of hybrid structures is considered a winning strategy. In fact, the synthesis of active material particles embedded into a carbonaceous matrix is useful to both buffer volume changes and, at the same time, to improve the electronic conductivity of the electrode [11]. In addition, the introduction of doping ions could be successful in improving the structural stability and increasing the conductivity of electrode materials [12,13].
GeFe2O4 has been coated with carbon for application in both LIBs and SIBs, but, to date, nothing has been reported about the use of doping to possibly improve its electrochemical performance. In the few published papers available, GFO-based anodes were synthesized by means of the hydrothermal method with a carbon coating or using freeze-drying technology [14,15,16,17].
In this paper, pure and Mn-doped GeFe2O4 were prepared by hydrothermal synthesis and tested as anodes in SIBs. The materials were carbon coated using the hydrothermal method; the amount of carbon was quantified via thermogravimetric analysis (TGA) and its chemical nature was characterized by micro-Raman spectroscopy. X-ray powder diffraction with Rietveld refinement has been employed to determine the purity level and the main structural parameters of the samples, the morphological features were studied by scanning electron microscopy (SEM), and the chemical composition was determined by energy dispersive X-ray spectroscopy (EDS) analysis. Finally, the samples were characterized by cyclic voltammetry and galvanostatic cycling at different C rates in a half-cell configuration. The long-term stability of the electrodes was measured at C/10 for 200 cycles.

2. Materials and Methods

The GeFe2−XMnXO4 (x = 0.1, 0.2) samples were obtained by a hydrothermal synthesis [16] starting from FeCl2∙4H2O (Supelco, Merck, Darmstadt, Germany), GeO2 (Sigma-Aldrich, St. Louis, MO, USA, >99.99%), NaOH (Merck, Darmstadt, Germany) and, in case of doping, MnCl2 4H2O (Sigma-Aldrich, St. Louis, MO, USA, ≥99.0%). For GFO preparation, an excess amount of iron was used (Fe/Ge 3:1 ratio) as in ref. [16], since trials carried out with a stoichiometric amount of Fe did not lead to the desired product, but to intermediates with an unclear composition. The excess of iron probably leads to the formation of oxide impurities, in particular the Magnetite phase (Fe3O4), due to the easy oxidation of iron.
The synthesis involved as a first step the formation of hydroxide, which subsequently converted to oxide in the autoclave.
The reaction for the pure compound is:
Ge4+ + 2Fe2+ + 8OH → Fe2Ge(OH)8 → GeFe2O4 + 4H2O
The reaction for the doped samples was similar, with the desired amount of Mn dopant replacing part of the FeCl2.
For the synthesis, two solutions were prepared in 40 mL of distilled water each: solution A with GeO2 and NaOH, and solution B with FeCl2∙4H2O. After the complete solubilization of the precursors, the two solutions were mixed under magnetic stirring for 30 min, and subsequently transferred into a Teflon container (100 mL) hermetically closed in a stainless-steel autoclave maintained at 180 °C for 24 h. After the thermal treatment, the autoclave was cooled to room temperature, the obtained powder was washed several times with water and ethanol, and finally dried at 80 °C for 12 h.
The carbon coating was realized for all the samples via a hydrothermal method [16]. Before the synthesis, the GeFe2−xMxO4 samples were ball-milled in WC jars and balls at 300 rpm for 1 h to reduce the grain sizes. Then, 0.8 g of glucosamine was dissolved in 60 mL of distilled water and 0.4 g of GeFe2−xMxO4 were added to the solution and sonicated for 30 min. The dispersions were transferred to a Teflon container (100 mL), hermetically closed in a stainless-steel autoclave, and thermally treated in an oven at 140 °C for 12 h. The powders were centrifuged, washed with water and ethanol, then dried at 80 °C overnight. As a last step, the products were treated at 500 °C for 3 h under nitrogen atmosphere to obtain the carbon-coated samples. In the following, the GeFe2O4, GeFe1.9Mn0.1O4, and GeFe1.8Mn0.2O4 samples will be named GFO, GFO-Mn-5, and GFO-Mn-10, respectively, and GFO-C, GFO-Mn5-C, and GFO-Mn10-C when carbon-coated.
A Bruker D5005 diffractometer (Karlsruhe, Germany), equipped with CuKα radiation, was used to perform X-ray powder diffraction (XRD) measurements. The patterns were collected in the angular range 17°–110°, with a step size of 0.03° and 15 s/step of counting time. The structural refinements were performed using the Rietveld method with TOPAS 3.0 software; the employed crystallographic model was the known structure of the cubic GeFe2O4 spinel phase [18]. During the refinements, the parameters were varied in the following order: zero error, background coefficients, lattice parameters, crystallite sizes, oxygen coordinate, and thermal factors. The atomic ratios, due to the similar X-rays scattering factors of Fe and Mn, were fixed to their stoichiometric values.
A Zeiss EVO MA10 (Carl Zeiss, Oberkochen, Germany) microscope coupled with an EDS detector (X-max 50 mm, Oxford Instruments, Oxford, UK) was used to perform Scanning Electron Microscopy (SEM) and microanalysis measurements. The samples for the SEM were gold-sputtered, while for the EDS measurements, they were used as loose powders.
A thermal analysis of the samples (Thermo Gravimetric Analysis (TGA) and Differential Scanning Calorimetry (DSC)) was performed using a simultaneous SDT Q600 TA instrument (TA Instruments, New Castle, DE, USA). The data were acquired in the following conditions: air atmosphere and heating rate of 10 °C/min from room temperature to 750 °C.
Raman measurements were performed at room temperature using an automated confocal micro-Raman spectrometer, XploRA Plus HORIBA Scientific (Osaka, Japan), equipped with an Olympus (Tokyo, Japan) microscope BX43. Neutral filters with different optical densities allowed us to set the incident laser power. The investigated samples were positioned on a motorized xy stage. The spectral resolution was about 1 cm−1. An Open Electrode CCD camera with a multistage Peltier air cooling system was used as a detector. The measurements were performed with a 638 nm (90 mW) laser source using a 50× magnification objective, leading to a spot size of about 4 µm2. The laser power density on the samples was kept at 4.5 × 10⁴ W/cm2. The spectra were collected with an integration time of 5 s and a number of accumulations equal to 10 in different areas of the samples. The reported spectra were the average of those collected.
The slurries were prepared in water by mixing the active material with carbon (350P, Imerys, Paris, France) and Sodium Carboxymethylcellulose (Na–CMC) as a binder in a 70:20:10 weight% ratio and then coated on an aluminum carbon-coated foil using a homemade doctor blade. They were kept at room temperature overnight, dried at 60 °C for 4 h in a vacuum oven, and finally hot-pressed at 90 °C for 5 min. The electrodes were cut from the slurries in the form of discs with a diameter of 1 cm (mass loading in the range 1–1.9 mg/cm2) and used as a working electrode in Swagelok cells assembled in a dry box under an Argon atmosphere (MBraun, Garching bei München, Germany, O2 < 1 ppm, H2O < 1 ppm), with Na metal as the reference and counter electrode and a Whatman GF/D disc as the separator. The chosen electrolyte was 1 M NaPF6 in EC:DEC (1:1 v/v).
An Autolab PGSTAT30 (Eco Chemie, Metrohm, Utrecht, The Netherlands) was used to perform cyclic voltammetry (CV) in the potential range 0.01–3 V for five cycles at a scan rate of 0.1 mV/s. The prevalent mechanism (diffusive or pseudo-capacitive) of the Na intercalation/deintercalation was studied by cycling the cells for 3 cycles at 0.1 mV/s and then for one cycle at 0.2, 0.5, 0.7, and 1.0 mV/s.
Finally, a Neware (Hong-Kong, China) Battery Test System was employed to perform the galvanostatic cycling with potential limitation (GCPL) tests in the 0.01–3 V potential range at C rates between 0.1 C and 2 C. The long cycling tests were performed for about 200 cycles at 0.1 C.

3. Results and Discussion

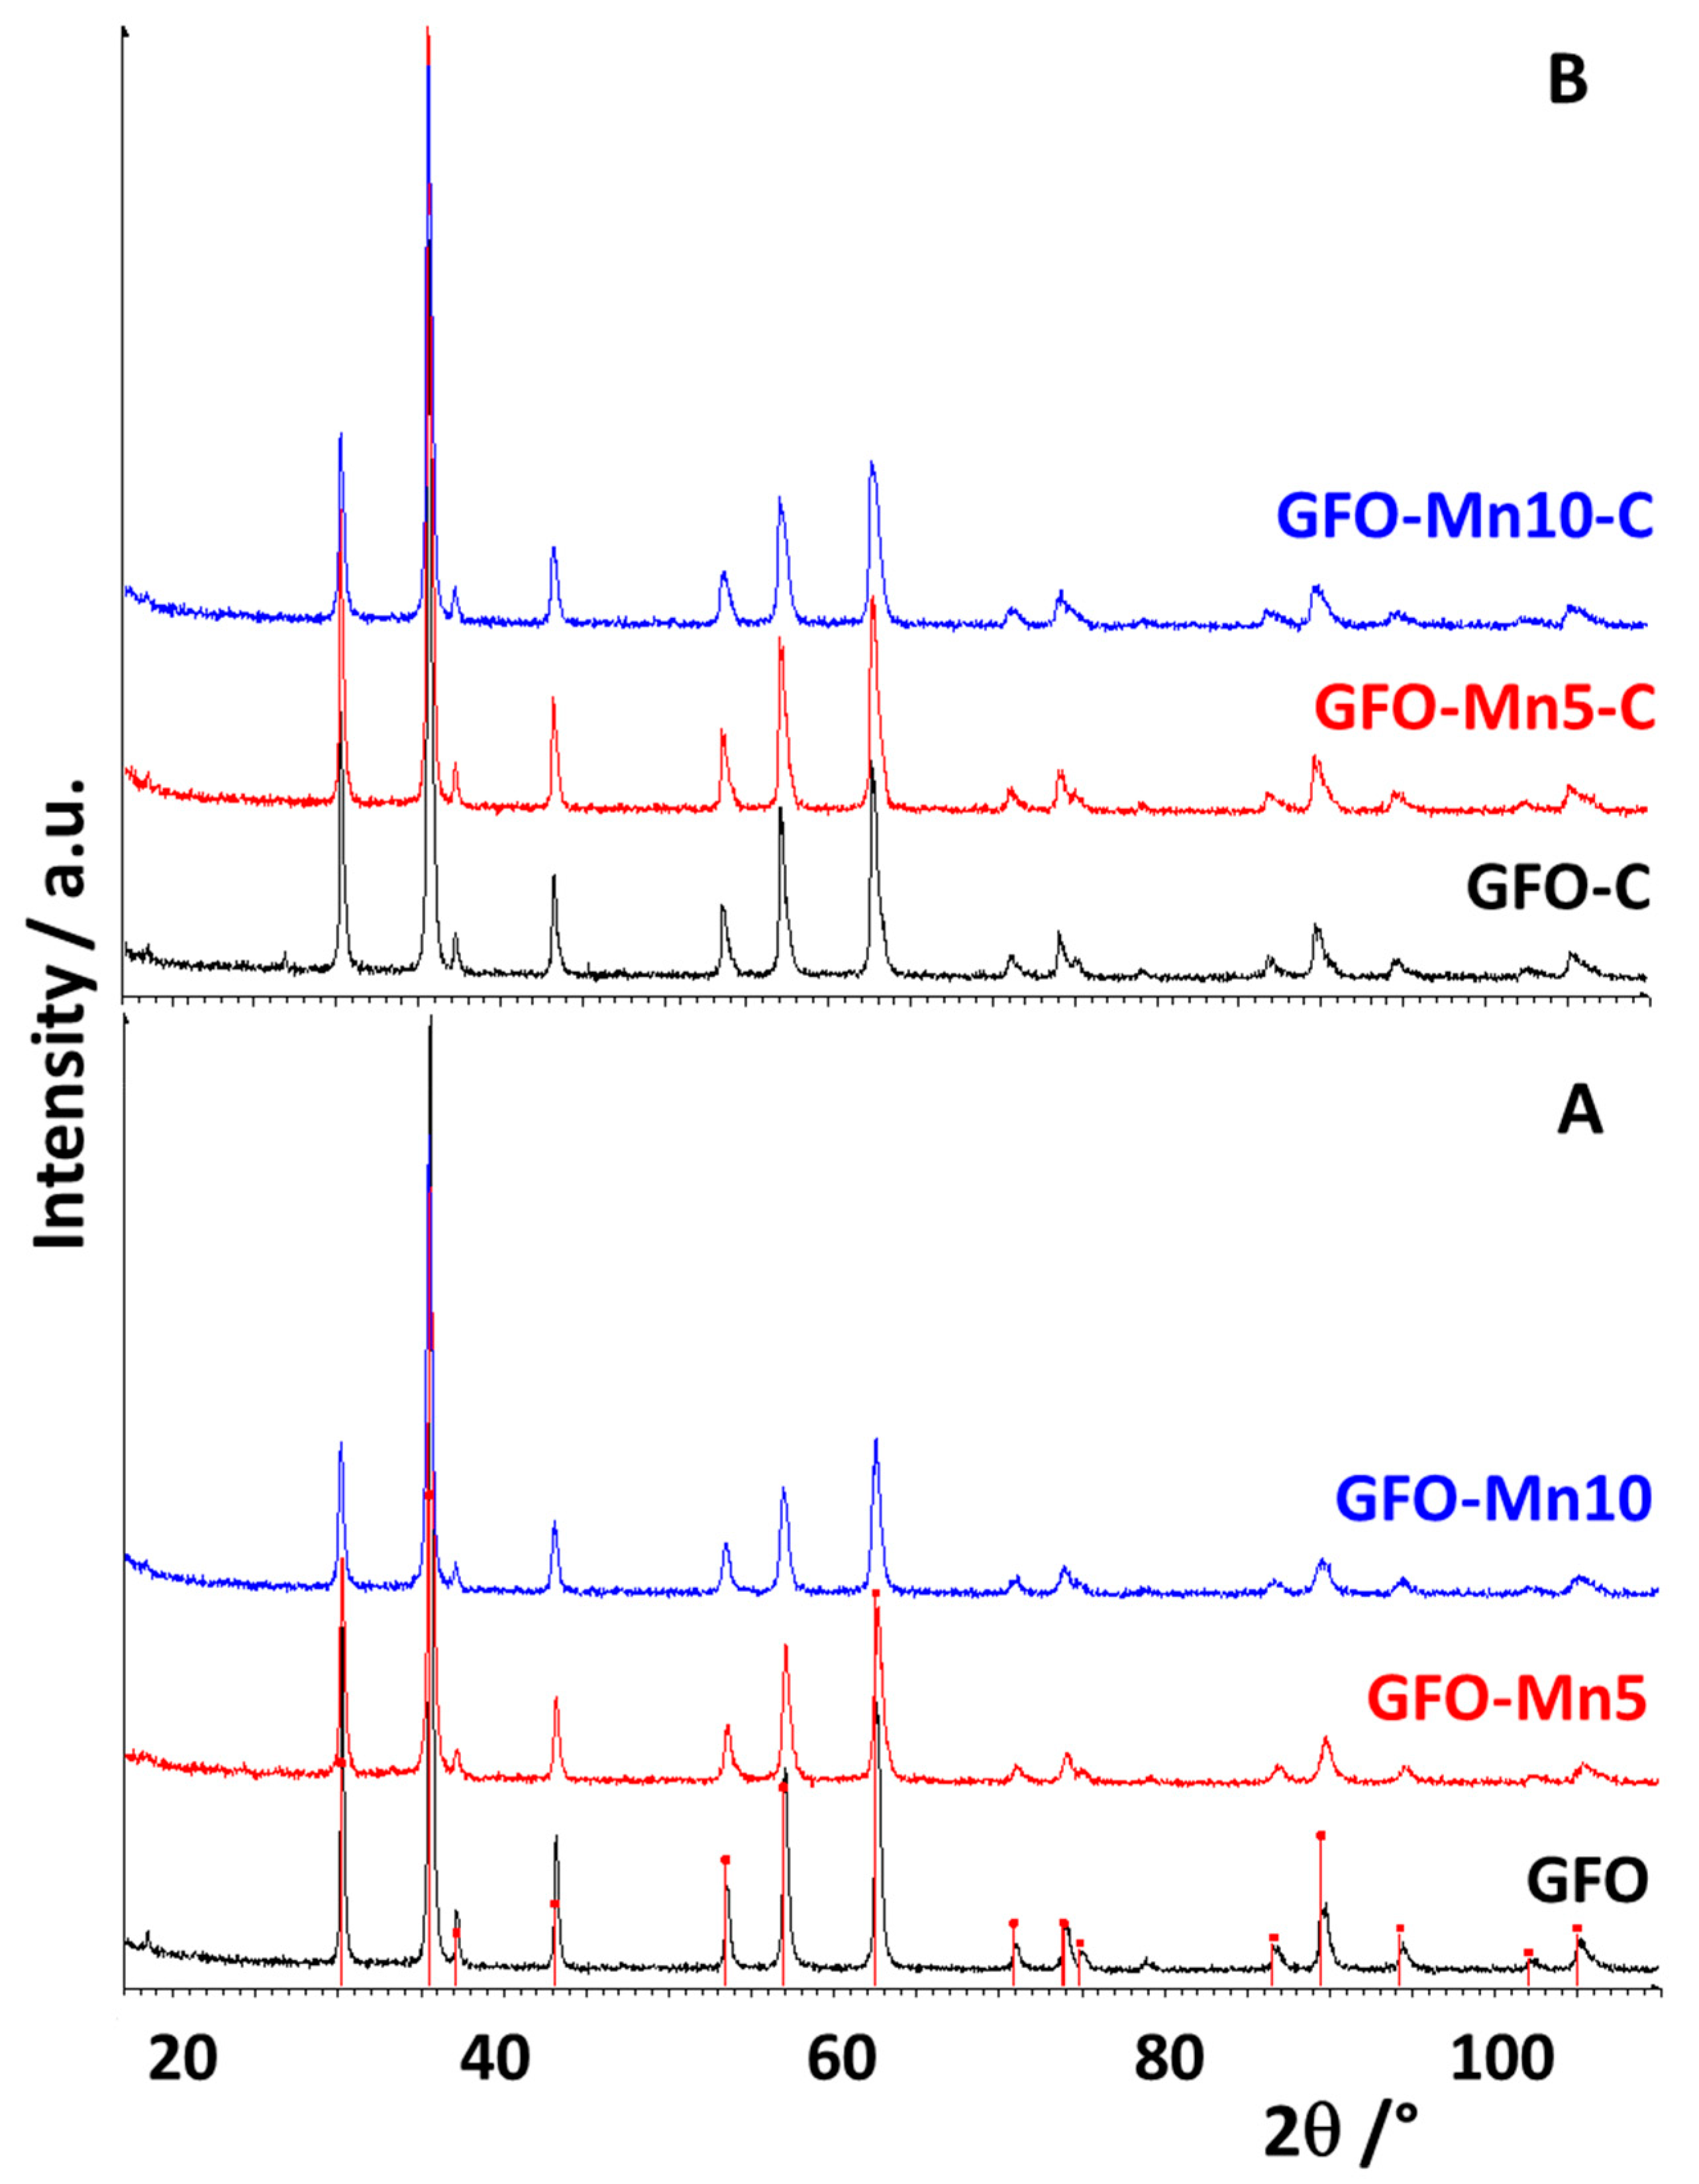
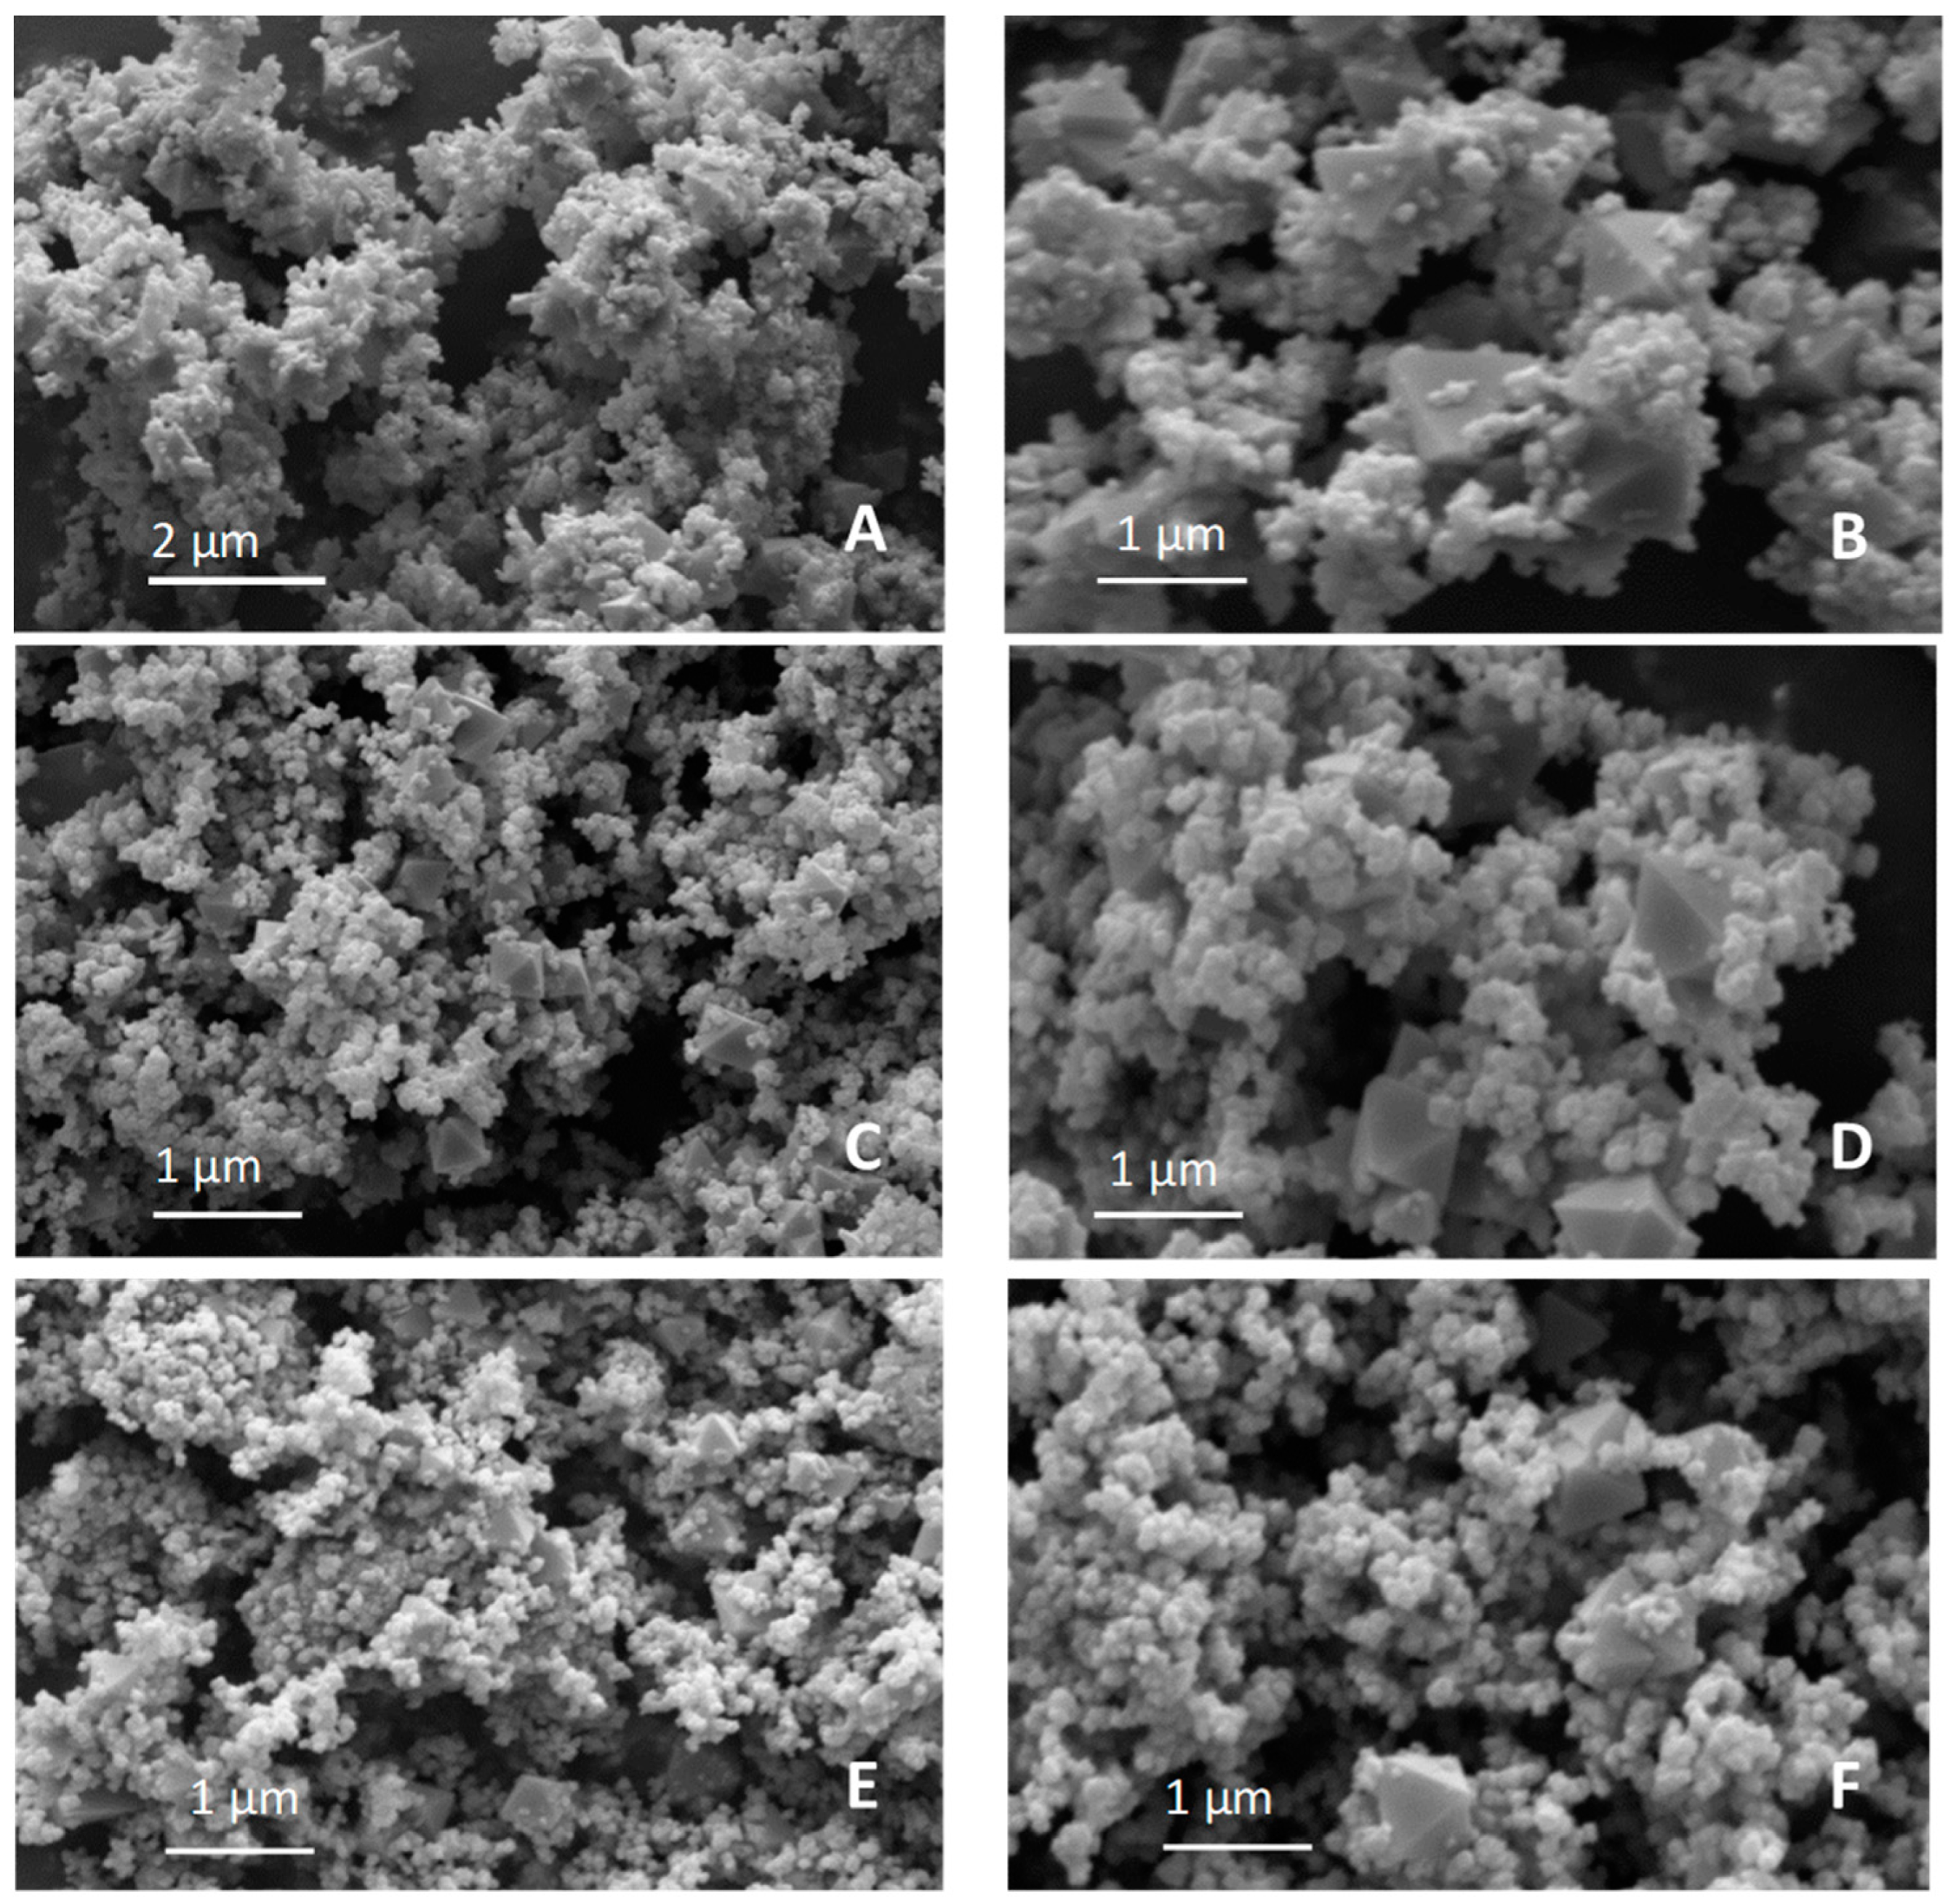
3.1. Physical–Chemical Results

The XRD patterns of the pure and doped GFO samples, before and after carbon coating, are shown in Figure 1A,B, respectively.
All the distinct reflections in the sample patterns are consistent with those expected for the cubic spinel GeFe2O4 (card N. 25-0359; Figure 1A). No changes in peak positions have been observed after the dopant addition; the small differences in the peak intensities and broadenings suggested the presence of some structural disorder. In fact, the doping can limit the grain growth and therefore hinder the crystallization of the material. However, the complete solubility of Mn in the spinel cubic structure—at least at the employed level of substitution—can be supposed, since no crystalline phase containing the doping ion was found. No structural changes were observed after the carbon coating (Figure 1B), suggesting that the carbon addition did not modify the structure of the materials, as in fact could be expected.
Rietveld refinements were carried out on the base of the known structural model of GFO to determine its main structural parameters [18].
The results are reported in Table 1. In Figure 2 the comparison between the experimental and calculated patterns of the GFO-Mn5 and GFO-Mn5-C samples, the difference curve, and the bars of the calculated peak positions are shown as an example.
The reliability of the refinements is suggested by both the good graphical comparisons (Figure 2), and the agreement indices’ values (Table 1).
The lattice parameters of the doped GFO samples are similar to those of the pure GFO, and no changes could be seen after carbon coating. The data agree with the values reported in the literature for the same material [12,14]. On the other hand, the ionic radii of Fe2+ and Mn2+ in an octahedral coordination in a high spin configuration are 0.78 Å and 0.83 Å, respectively—justifying the invariance of the lattice parameters [19].
Crystallite size values of about 30–50 nm suggest the presence of nanometric materials, in line with the low temperature used for the synthesis. The addition of dopants slightly decreased the values of the crystallite sizes due to the inhibition of grain growth as a consequence of doping. No significant variations could be observed in the crystallite size values of the carbon-coated samples (Table 1).
SEM images were collected to describe the samples’ morphology and the possible modifications introduced by doping (Figure 3).
Aggregates of particles with a prevalent spherical morphology can be observed for all the samples (Figure 3); this could be expected due to them undergoing the same hydrothermal synthesis. Moreover, some octahedral particles emerged from the aggregates, suggesting the presence of a magnetite phase related to the iron excess used during the GFO synthesis [20]. In the literature, in fact, a partial solubility of GFO and Fe3O4 was also reported for the natural mineral, often containing some amount of Fe3+ ions [10]. Similar octahedral forms were detected in the micrographs of GFO reported in other papers [16,21].
The chemical composition of the samples was analyzed by EDS microanalysis; the results are reported in Table 2 and compared with the stoichiometric values.
A good agreement is evident between the two sets of data for what concerns the Fe/Ge ratio; for the pure GFO, the value was slightly lower in comparison to the expected value. We should, however, take into account that the EDS data were acquired on limited spots of the samples and that some differences between them can be observed. The detected chemical compositions were in line with published results [21]. The Mn amount was lower in comparison to the stoichiometric value, supporting the hypothesis of the possible formation of Mn phases that are soluble in the alkali conditions used for the synthesis [22]. The distribution of the elements in the powders was verified by means of the EDS maps of the cations (Figure S1). As is well evident, all the cations were well distributed in the powders, with a slightly high concentration of iron in the octahedral particles, supporting the hypothesis that they could pertain to magnetite. The Mn dopant ion was also well distributed, confirming homogeneous doping.
The quantification of the carbon amount provided by the coating is important for the subsequent preparation of the slurries for the electrochemical measurements. The carbon content was determined by TG-DSC combined analysis (Figure S2); an amount of 4 wt% carbon was determined for the GFO-C, in agreement with the value reported by Subramanian et al. [16], by using the same coating route. The doped samples contained a slightly higher amount of carbon (around 7 wt%), probably due to their smaller sizes (Table 1). The TGA curves were over-imposable (Figure S2); after an initial small weight loss due to the release of adsorbed water, a slight raise of the weight at about 250 °C may suggest the tendency of Fe2+ to oxidize during the thermal treatment, as well as that of Mn2+ in the case of doping. As such, the huge weight loss starting at about 300 °C is due to the loss of carbon in the form of CO2, a process that is highly exothermic and rapid (Figure S2). The carbon coating was also investigated by using micro-Raman measurements (Figure S3). The typical signatures of amorphous carbon, with two broadened bands peaking at around 1350 cm−1 and 1580 cm−1 (reminiscent of the so-called D and G modes, respectively), were well-evident in all the samples. By normalizing the intensities of the reported spectra (inset, Figure S3), it is clearly shown that the carbon phase in all of the investigated samples was characterized by a similar disorder degree.

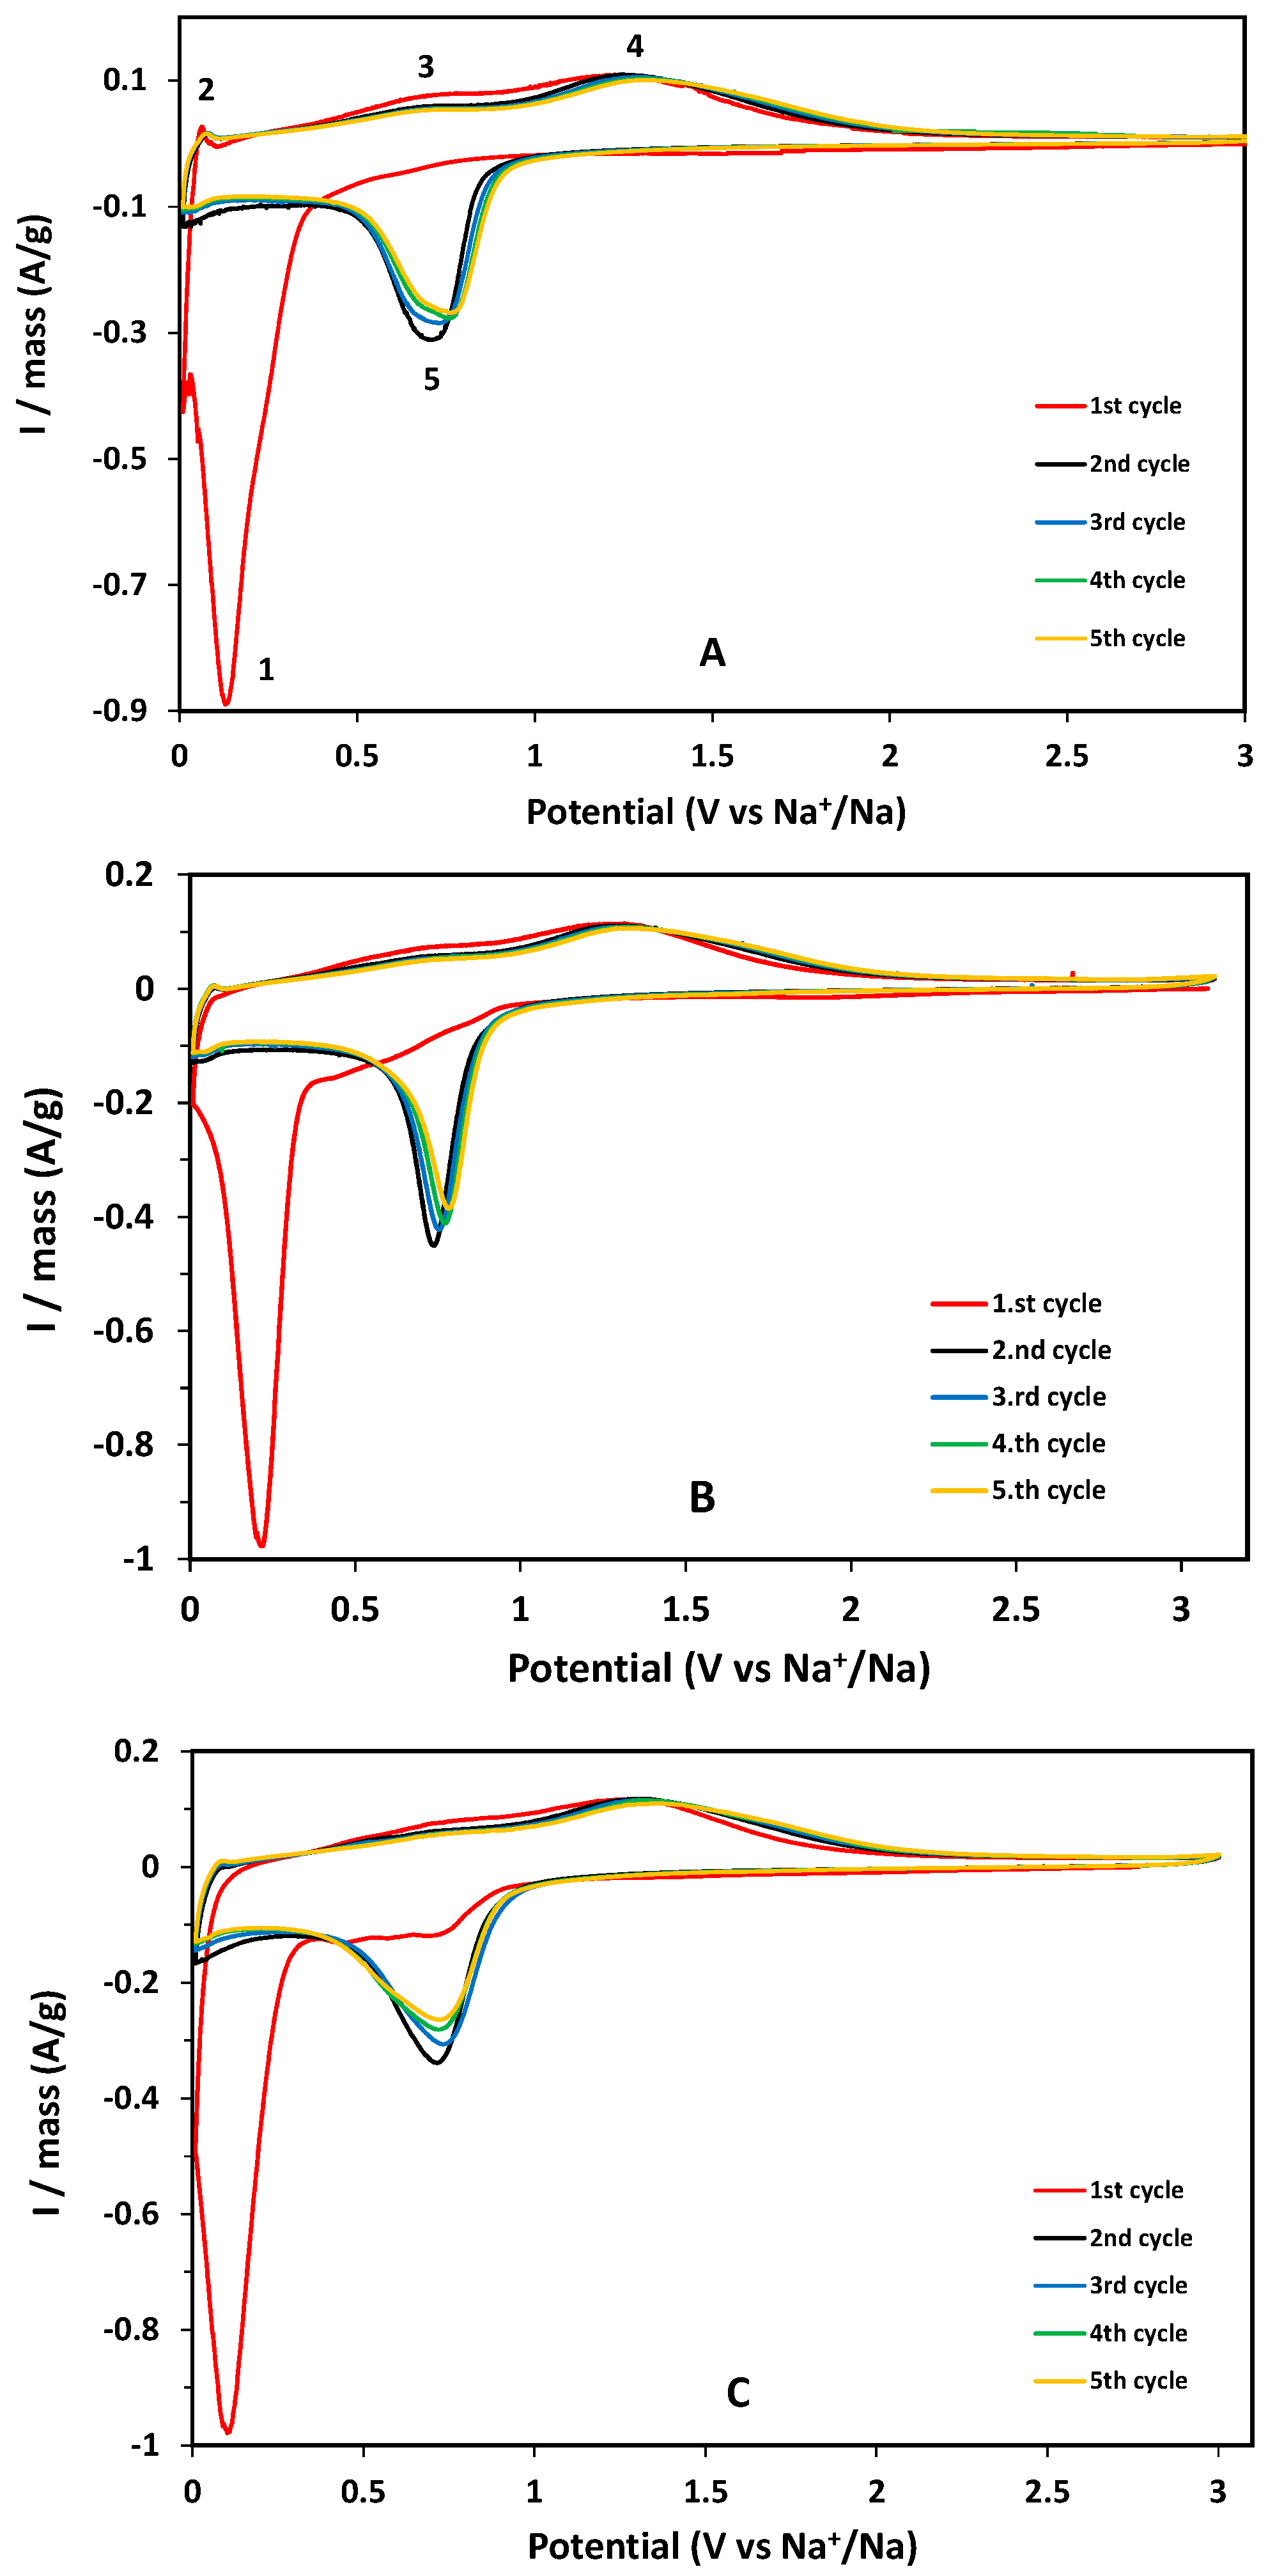
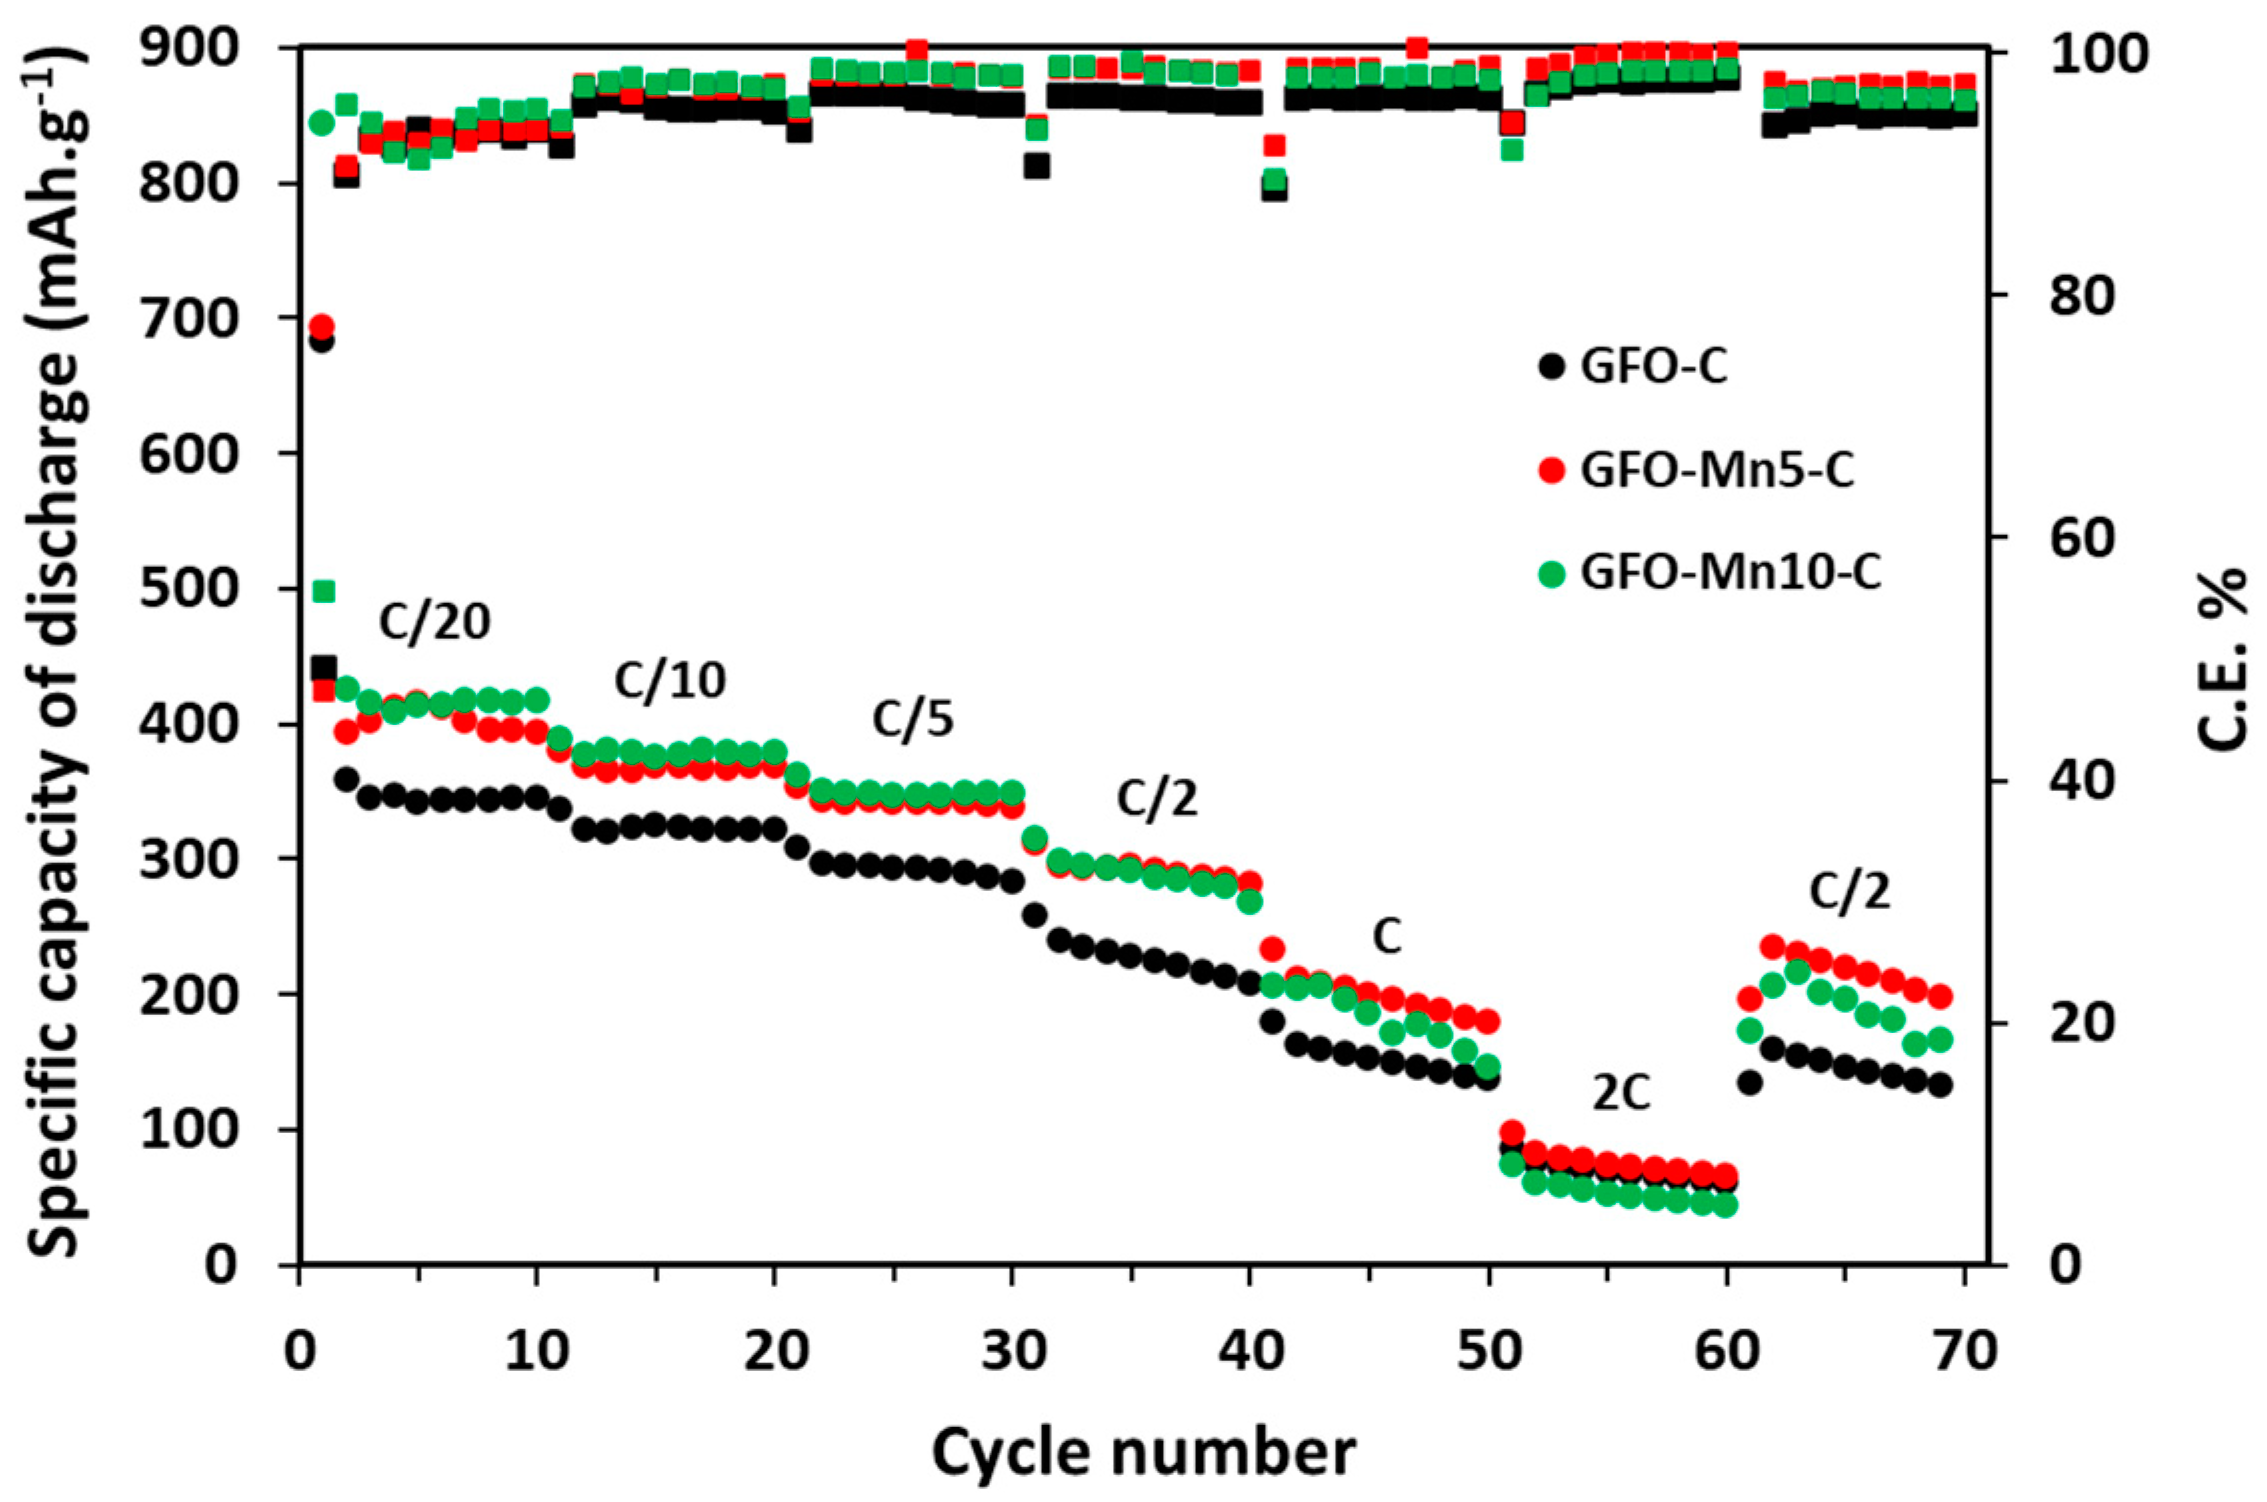
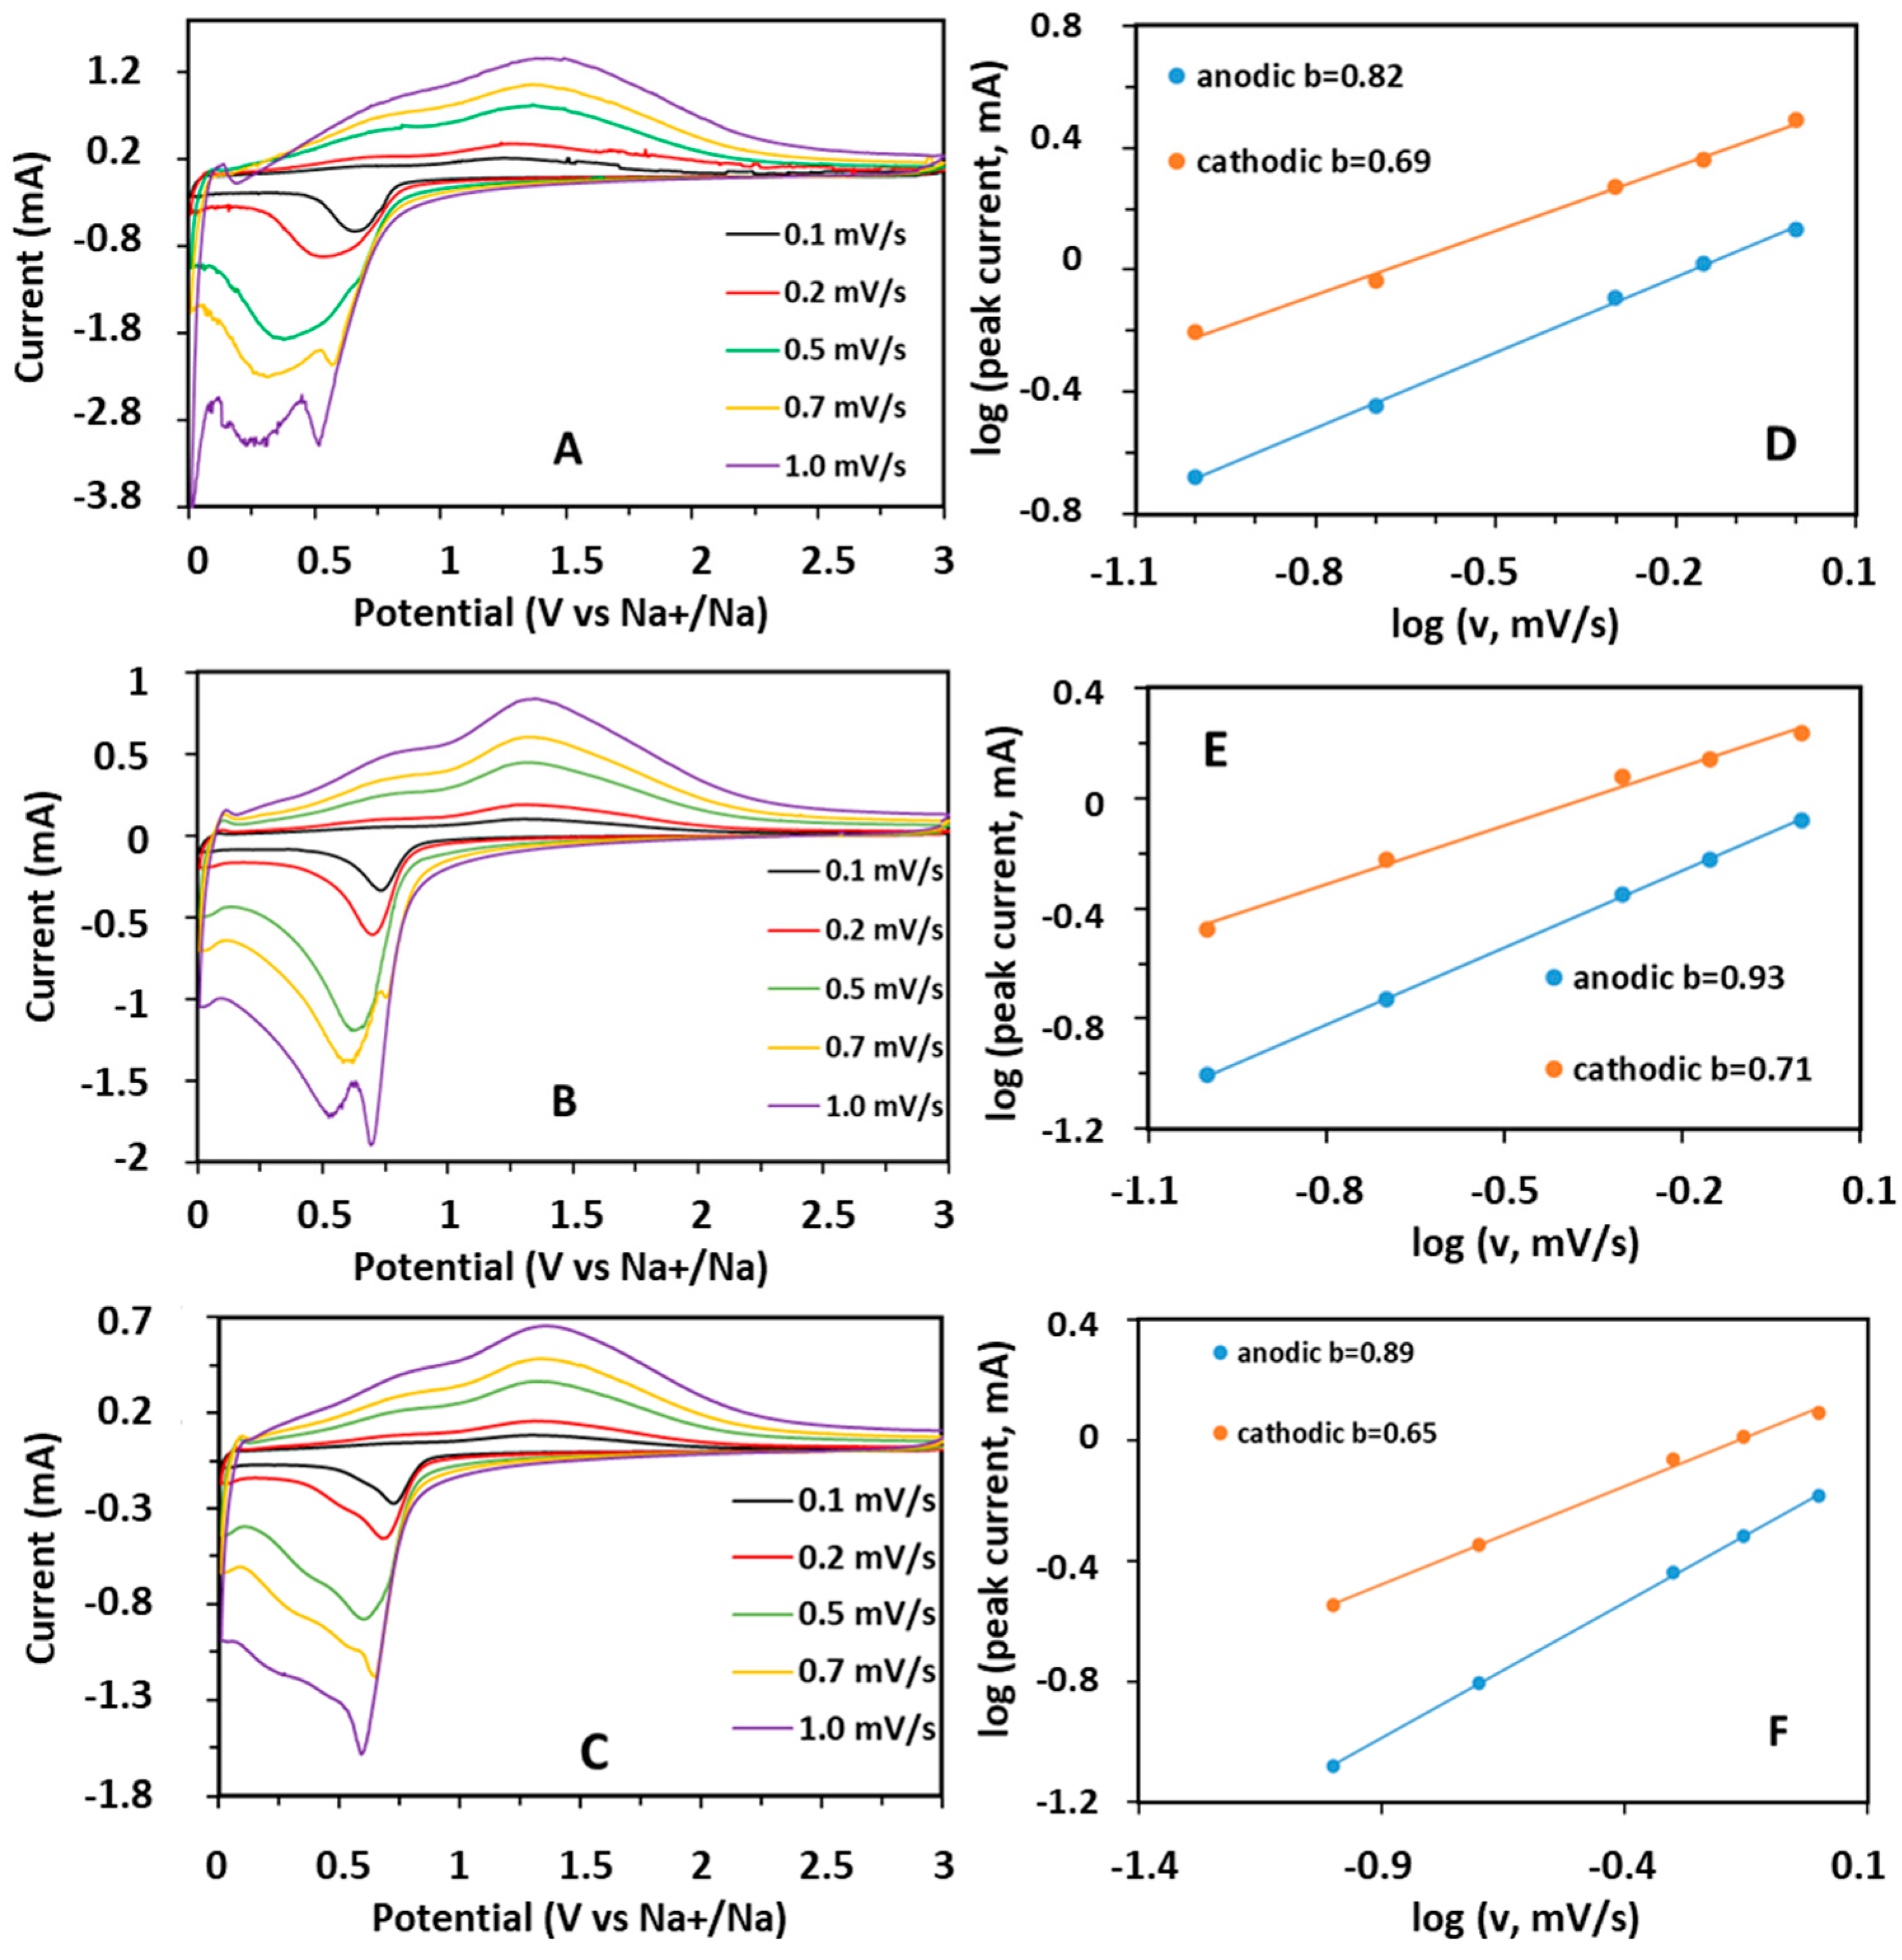
3.2. Electrochemical Results

The sodium charge storage of the GFO-carbon coated samples was investigated by cyclic voltammetry analysis, performed in the potential range 0.01–3.0 V at 0.1 mV s−1 (Figure 4).
In the CV first cycle of the GFO-C sample, a broad reduction peak near 0 V (1, see Figure 4A), corresponding to the irreversible reduction of GeFe2O4 to its individual components (Equation (1), Introduction) and to the alloying process of Ge (Equation (2), Introduction), could be seen. Furthermore, during the first discharge, a significant current contribution was provided by the SEI formation on the surface of the electrode. In the first anodic scan, the peak at about 0.1 V (2) was due to the de-alligation process of Ge, while the two oxidation peaks at about 0.77 V (3) and 1.3 V (4) can be attributed to the two-step oxidation process of Fe to Fe2+ and Fe3+ (Equation (3), Introduction). In the second and subsequent cycles, the reduction peak at about 0.6 V (5) was due to the reduction of Fe3+ to metallic Fe, on the base of the conversion reaction—to which corresponds the oxidation peak at about 1.3 V [16]. The doped samples exhibited CV curves similar to that of the pure sample, suggesting the same redox phenomena.
Galvanostatic cycling at different C rates was performed between C/20 and 2C to investigate the electrochemical performance of GFO as a function of current densities (Figure 5).
In the first cycle at C/20 (Figure 5), all the samples showed high specific discharge capacities (between 843 mAh/g and 683 mAh/g) due to the irreversible decomposition reaction of the GeFe2O4 spinel along with the SEI formation (see also CV results). Indeed, in the subsequent cycles at C/20, the capacity decreased to values of between 390 mAh/g and 323 mAh/g, in line with the values reported in published papers [16,17]. Good electrochemical performances were found at low C-rates (up to C/5) for all the samples, with the doped samples outperforming the pure sample. The capacity values were stable during cycling, suggesting a good structural stability. The capacities slightly decreased for all the samples passing to C/2, occurring in a more evident way for GFO-C. However, at 1C, values of about 199 mAh/g and 186 mAh/g were again provided by GFO-Mn5-C and GFO-Mn10-C, while the GFO-C sample had lower values. At 2C, all the samples showed low capacities of about 70 mAh/g. There could be an important voltage hysteresis between the charge and discharge steps and a non-satisfactory high-rate behavior, particularly for the materials undergoing crystallographic phase transformations during electrochemical cycling. The samples, probably due to some structural instability, did not recover their initial capacities when the current returned to C/2. The low Coulombic Efficiency (C.E.) of about 93%, detected in the first cycles at C/20 and due to the irreversible conversion of GFO into its components and to other side reactions, increased by increasing the C rate up to 99% and 98% at 2C for GFO-Mn5-C and GFO-Mn10-C, respectively. The GFO-C sample had instead the lowest value of around 96%. By returning to C/2, the C.E. values had been lowered to 97% for the Mn-doped samples and 94% for the pure sample.
To explain the galvanostatic cycling results, CV curves were also obtained for all the samples at increasing sweep rates from 0.1 mV/s to 1.0 mV/s (Figure 6A–C).
For all the samples, the peak intensities and broadening increased by increasing the scan rate, as expected. The anodic peak positions did not change by increasing the sweep rates, while the cathodic positions shifted to lower potentials, probably due to the polarization of the electrode at increasing sweep rates [23]. Figure 6D–F illustrates the linear relationship between the peak current and scan rates, which can provide information concerning the prevalent characteristics of the electrochemical reaction, i.e., if the mechanism is a solid phase diffusion-controlled or surface-confined charge-transfer. The pseudocapacitive contribution for the different samples has been estimated by considering the relationship:
Ip = avb
where a and b represent variable parameters. For b = 1, a 100% capacitive behavior is present, while b = 0.5 indicates a 100% diffusion-controlled behavior. To calculate the b values (Figure 6D–F), the equation can be transformed into:
log Ip = log a + b log v
The determined b values suggested a prevalence of capacitive contribution, particularly for the anodic part of the curve. This observation agrees with the tendency of the peaks to maintain the original position by increasing the sweep rates, as occurs in the presence of pseudocapacitance [23]. For the cathodic part, the b values were lower, suggesting that a diffusive contribution cannot be excluded.
The increase in the scan rate caused peculiar behavior in the cathodic part of the voltammograms (Figure 6A–C): the separation of the broad peak at about 0.6 V into two distinguished contributions was well evident for the GFO-C and GFO-Mn5-C. It could be suggested that the narrow peak was due to a diffusion limited reaction, while the broader peak at about 0.25 V was due to a prevalent pseudocapacitive effect, caused by a faradaic reaction. The capacitive contribution could be responsible for the performance at high C rates, which was in fact slightly lower for the GFO-Mn10-C sample, while the diffusive contribution—more evident in the doped samples—could be responsible for the better performances of these samples at low C rates. However, to prove the hypothesis concerning this peculiar phenomenon, other kind of measurements will be necessary, which could be the aim of another specific work.
The cycling stability of all the electrodes was evaluated during long-term cycling at C/10 (Figure 7).
Mn doping seemed to be useful for ensuring slightly higher discharge capacity values for at least the first 20 cycles (375 mAh/g in comparison to the 358 mAh/g of GFO-C). Furthermore, an improved cycling stability could be observed, with a discharge capacity of 159 mAh/g and 129 mAh/g after 60 cycles for the GFO-Mn5-C and GFO-Mn10-C, respectively. Although decreasing trends in these capacities were evident, the effect of Mn doping appeared to be beneficial for electrode structural stability during long-term cycling.
The coulombic efficiency after the first 60 cycles of the GFO-Mn10-C was very good (99.12%), if compared to those of the GFO-C (94.31%) and GFO-Mn5-C (91.2%). For subsequent cycles, the coulombic efficiencies were about 98% for both the Mn-doped samples.
These original preliminary electrochemical results concerning the effect of doping on GeFe2O4 performance are good, but they could possibly be improved—for example, by properly tuning the carbon coating, which in this case was obtained by the hydrothermal method. We think that the coating could have accelerated the aggregation of the materials, and so in part nullifying the carbon’s benefits. Another possible strategy for obtaining the coating could be the use of an in situ method, i.e., during the synthesis of the materials—possibly allowing a more efficient coating of single particles and also reducing aggregation.

4. Conclusions

Mn-doped GeFe2O4 samples were successfully prepared by the hydrothermal method and were properly carbon-coated. The Mn addition (up to 10%) did not change either the spinel cubic structure, or the external morphology of the particles. The Mn presence was beneficial for the electrochemical performance because the capacities increased, particularly at low C rates, as well as the long-term cycling stability, because the doped samples were able sustain a high number of cycles with respect to the pure sample. These preliminary results are encouraging. A carbon coating with different characteristics, obtained for example in situ, as well as a different engineering of the particle morphology or the use of other kind of dopant ions—for example Sn or other transition metals—could allow for the improvement of the electrochemical performance of this interesting conversion-alloy spinel phase.

Supplementary Materials

The following supporting information can be downloaded at: https://www.mdpi.com/article/10.3390/batteries10020048/s1, Figure S1: SEM images and corresponding EDS maps for Ge (green), Fe (red), and Mn (blue) acquired on the three prepared samples. Figure S2: TG/DSC measurements, from top to bottom, of GFO-C, GFO-Mn5-C and GFO-Mn10-C samples. Figure S3: Micro-Raman spectra of GFO coated samples. In the inset, the comparison among the normalized spectra is also shown.

Author Contributions

Conceptualization: M.B., M.A. and I.Q.; Methodology: M.A. and W.R.; Investigation: M.A., C.M. and V.B.; Resources: M.B. and I.Q.; Visualization: M.A. and M.B.; Writing—original draft preparation: M.A.; Writing—review and editing: I.Q., M.B., C.M. and V.B.; Supervision: M.B. All authors have read and agreed to the published version of the manuscript.

Funding

This research received no external funding.

Data Availability Statement

The raw data supporting the conclusions of this article will be made available by the authors on request.

Acknowledgments

The authors thank Benedetta Albini for the micro-Raman measurements and Alessandro Girella for the EDS maps. M.B., M.A., W.R., C.M. and V.B. acknowledge support from the Ministero dell’Università e della Ricerca (MUR) and the University of Pavia through the program“Dipartimenti di Eccellenza 2023–2027”.

Conflicts of Interest

The authors declare no conflict of interest.

References

  1. Yabuuchi, N.; Kubota, K.; Dahbi, M.; Komaba, S. Research Development on Sodium-Ion Batteries. Chem. Rev. 2014, 114, 11636–11682. [Google Scholar] [CrossRef]
  2. Zheng, L.; Zhang, Y.; Yang, S.; Shao, J.; Guo, Z. Recent progress on sodium ion batteries: Potential high-performance anodes. Energy Environ. Sci. 2018, 11, 2310–2340. [Google Scholar]
  3. Kim, H.; Kim, D.I.; Yoon, W.S. Challenges and Design Strategies for Conversion-Based Anode Materials for Lithium- and Sodium-Ion Batteries. J. Electrochem. Sci. Technol. 2022, 13, 32–53. [Google Scholar] [CrossRef]
  4. Mu, J.J.; Liu, Z.M.; Lai, Q.S.; Wang, D.; Gao, X.W.; Yang, D.R.; Chen, H.; Luo, W.B. An industrial pathway to emerging presodiation strategies for increasing the reversible ions in sodium-ion batteries and capacitors. Energy Mater 2022, 2, 200043. [Google Scholar] [CrossRef]
  5. Chen, T.; Ouyang, B.; Fan, X.; Zhou, W.; Liu, W.; Liu, K. Oxide cathodes for sodium-ion batteries: Designs, challenges, and perspectives. Carbon Energy 2022, 4, 170–199. [Google Scholar] [CrossRef]
  6. Prajapati, A.K.; Bhatnagar, A. A review on anode materials for lithium/sodium-ion batteries. J. Energy Chem. 2023, 83, 509–540. [Google Scholar] [CrossRef]
  7. Lao, M.; Zhang, Y.; Luo, W.; Yan, Q.; Sun, W.; Dou, S.X. Alloy-Based Anode Materials toward Advanced Sodium-Ion Batteries. Adv. Mater. 2017, 29, 1700622. [Google Scholar] [CrossRef]
  8. Qiao, S.; Zhou, Q.; Ma, M.; Liu, H.K.; Dou, S.X.; Chong, S. Advanced Anode Materials for Rechargeable Sodium-Ion Batteries. ACS Nano 2023, 17, 11220–11252. [Google Scholar] [CrossRef]
  9. Bini, M.; Ambrosetti, M.; Spada, D. ZnFe2O4, a green and high-capacity anode material for lithium-ion batteries: A review. Appl. Sci. 2021, 11, 11713. [Google Scholar] [CrossRef]
  10. Ambrosetti, M.; Bini, M. The Renewed Interest on Brunogeierite, GeFe2O4, a Rare Mineral of Germanium: A Review. Molecules 2022, 27, 8484. [Google Scholar] [CrossRef]
  11. Fang, L.; Bahlawane, N.; Sun, W.; Pan, H.; Xu, B.B.; Yan, M.; Jiang, Y. Conversion-Alloying Anode Materials for Sodium Ion Batteries. Small 2021, 17, 2101137. [Google Scholar] [CrossRef]
  12. Karuppiah, D.; Palanisamy, R.; Rengapillai, S.; Ponnaiah, A.; Marimuthu, S. Effect of Tungsten and Carbon in Germanium Oxide as a High-Performance Electrode for Energy Storage Applications. ACS Appl. Energy Mater. 2021, 4, 9692–9700. [Google Scholar] [CrossRef]
  13. Quinzeni, I.; Berbenni, V.; Capsoni, D.; Bini, M. Ca- and Al-doped ZnFe2O4 nanoparticles as possible anode materials. J. Solid State Electrochem. 2018, 22, 2013–2024. [Google Scholar] [CrossRef]
  14. Subramanian, Y.; Park, M.S.; Kumar, V.G.; Lee, Y.S.; Kim, D.W. Electrochemical Performance of M2GeO4 (M = Co, Fe and Ni) as Anode Materials with High Capacity for Lithium-Ion Batteries. J. Electrochem. Sci. Technol. 2017, 8, 323–330. [Google Scholar]
  15. Jin, S.; Wang, C. Synthesis and first investigation of excellent lithium storage performances of Fe2GeO4/reduced graphene oxide nanocomposite. Nano Energy 2014, 7, 63–71. [Google Scholar] [CrossRef]
  16. Subramanian, Y.; Park, M.S.; Veerasubramani, G.K.; Lee, Y.S.; Kim, D.W. Synthesis and electrochemical performance of carbon-coated Fe2GeO4 as an anode material for sodium-ion batteries. Mat. Chem. Phys. 2019, 224, 129–136. [Google Scholar] [CrossRef]
  17. Han, J.; Qin, J.; Guo, L.; Qin, K.; Zhao, N.; Shi, C.; Liu, E.; He, F.; Ma, L.; He, C. Ultrasmall Fe2GeO4 nanodots anchored on interconnected carbon nanosheets as high-performance anode materials for lithium and sodium ion batteries. Appl. Surf. Sci. 2018, 427, 670–679. [Google Scholar] [CrossRef]
  18. Welch, M.D.; Cooper, M.A.; Hawthorne, F.C. The crystal structure of brunogeierite, Fe2GeO4 spinel. Mineral. Mag. 2001, 65, 441–444. [Google Scholar] [CrossRef]
  19. Shannon, R.D. Revised effective ionic radii and systematic studies of interatomic distances in halides and chaleogenides. Acta Cryst. 1976, A32, 751. [Google Scholar] [CrossRef]
  20. Zhao, L.; Zhang, H.; Xing, Y.; Song, S.; Yu, S.; Shi, W.; Guo, X.; Yang, J.; Lei, Y.; Cao, F. Morphology-Controlled Synthesis of Magnetites with Nanoporous Structures and Excellent Magnetic Properties. Chem. Mater. 2008, 20, 198–204. [Google Scholar] [CrossRef]
  21. Choi, H.; Surendran, S.; Kim, D.; Lim, Y.; Lim, J.; Park, J.; Kim, J.K.; Han, M.K.; Sim, U. Boosting eco-friendly hydrogen generation by urea-assisted water electrolysis using spinel M2GeO4 (M = Fe, Co) as an active electrocatalyst. Environ. Sci. Nano 2021, 8, 3110–3121. [Google Scholar] [CrossRef]
  22. Kozawa, A.; Kalnoki-Kis, T.; Yeager, J.F. Solubilities of Mn(II) and Mn(III) Ions in Concentrated Alkaline Solutions. J. Electrochem. Soc. 1966, 113, 405. [Google Scholar] [CrossRef]
  23. Augustyn, V.; Simon, P.; Dunn, B. Pseudocapacitive oxide materials for high-rate electrochemical energy storage. Energy Environ. Sci. 2014, 7, 1597. [Google Scholar] [CrossRef]
Figure 1. XRD patterns of pure and doped GFO samples before (A) and after (B) carbon coating. In (A), the red bars represent the expected peak positions of cubic GeFe2O4 (card N. 25-0359).
Batteries 10 00048 g001
Figure 2. Rietveld refinement for GFO-Mn5 (A) and GFO-Mn5-C (B) sample patterns. The experimental (blue) and calculated (red) patterns are compared; the difference curve (grey) and the vertical bars of the calculated peak positions are also reported.
Batteries 10 00048 g002
Figure 3. SEM micrographs of (A,B) GFO, (C,D) GFO-Mn5, and (E,F) GFO-Mn10 samples.
Batteries 10 00048 g003
Figure 4. CV curves of the carbon-coated GFO samples: (A) GFO-C, (B) GFO-Mn5-C, and (C) GFO-Mn10-C. The numbers in the panel (A) mark the main redox phenomena (see text).
Batteries 10 00048 g004
Figure 5. Galvanostatic cycling of the carbon-coated samples at different C rates. The Coulombic Efficiency (C.E.) is also reported.
Batteries 10 00048 g005
Figure 6. Cyclic voltammograms at sweep rates of 0.1 to 1 mV/s and the calculations of b values through the linear relationship between Ip and ν for GFO-C (A,D), GFO-Mn5-C (B,E), and GFO-Mn10-C (C,F) samples.
Batteries 10 00048 g006
Figure 7. Long-term cycling at 0.1 C for all the samples. The Coulombic efficiencies are also reported.
Batteries 10 00048 g007
Table 1. Main structural parameters obtained from the Rietveld refinements for all the synthesized samples. The agreement indices Rwp and GoF are also reported.
GFOGFO-Mn5GFO-Mn10GFO-CGFO-Mn5-CGFO-Mn10-C
a/Å8.4016 (1)8.3874 (2)8.4000 (4)8.3928 (12)8.3931 (10)8.3889 (9)
Cry size (nm)55.8 (3)34.3 (2)32.3 (4)40.4(2)39.0 (2)30.0 (2)
x(O)0.249 (8)0.249 (8)0.251 (7)0.249 (12)0.249 (9)0.251 (9)
Rwp/GoF12/1.511/1.411/1.415/1.816/1.914/1.7
Table 2. Sample stoichiometries derived from EDS analysis. The data are an average of the results from different acquisitions in three points of interest.
SamplesFe/Ge StoichiometricFe/Ge from EDS% Mn Stoichiometric% Mn from EDS
GFO32.60--
GFO-Mn533.0953.37
GFO-Mn1032.87106.67
Disclaimer/Publisher’s Note: The statements, opinions and data contained in all publications are solely those of the individual author(s) and contributor(s) and not of MDPI and/or the editor(s). MDPI and/or the editor(s) disclaim responsibility for any injury to people or property resulting from any ideas, methods, instructions or products referred to in the content.

