Abstract
Battery management systems (BMSs) play a vital role in understanding battery performance under extreme conditions such as high C-rate testing, where rapid charge or discharge is applied to batteries. This study presents a novel BMS tailored for continuous monitoring, transmission, and storage of essential parameters such as voltage, current, and temperature in an NCA 18650 4S lithium-ion battery (LIB) pack during high C-rate testing. By incorporating deep learning, our BMS monitors external battery parameters and predicts LIB’s health in terms of discharge capacity. Two experiments were conducted: a static experiment to validate the functionality of BMS, and an in operando experiment on an electrically propelled vehicle to assess real-world performance under high C-rate abuse testing with vibration. It was found that the external surface temperatures peaked at 55 °C during in operando flight, which was higher than that during static testing. During testing, the deep learning capacity estimation algorithm detected a mean capacity deviation of 0.04 Ah, showing an accurate state of health (SOH) by predicting the capacity of the battery. Our BMS demonstrated effective data collection and predictive capabilities, mirroring real-world conditions during abuse testing.
1. Introduction
The importance of LIBs and their associated technologies cannot be overstated in the current technological landscape. Diverse systems, ranging from electric vehicles and aerial drones to portable electronic devices, rely extensively on the safe operation of LIB technology such as avoiding fire and thermal runaway, etc. [1]. LIBs offer high energy density, long cycle life, fast charging, low self-discharge rates, a wide operating temperature range, versatility in design, reduced maintenance needs, and environmental friendliness compared to conventional rechargeable battery technologies such as nickel–metal hydride (NiMH), and nickel–cadmium (NiCd) batteries, etc. [2]. LIBs present a significant challenge due to their widespread applications. The aging of LIBs decreases their ability to store energy and provide power for applications. Therefore, state of health (SOH) is an important parameter for determining battery aging [3]. Many challenges are faced in the accurate estimation of SOH due to internal battery chemistry and the difficulty in measuring individual parameters such as voltage, current, temperature, and capacity [4]. This underscores the importance of precise sensing and monitoring mechanisms to safeguard durability and dependability [5]. Battery management systems (BMSs) play a key role in accurately sensing and monitoring battery parameters, ensuring that the battery operates safely for longevity and reliability [6].
The design of a BMS is historically application-specific and closely tied to the specific battery or cells employed, the power demands from the system, and the desired level of complexity [7]. In addition to the SOH of the battery, the state of charge (SOC) and remaining useful life (RUL) are common indicators of battery health [8]. Often, these indicators are derived from proprietary data acquisition (DAQ) setups employed for data collection, which can restrict flexibility and introduce logistical complexities to connectivity. DAQ configurations for LIBs can provide essential data such as voltage, current, and temperature for deep learning (DL) applications, but often suffer from being bulky, expensive, and tailored to specific research batteries or battery packs. Frequently, there is an insufficient description of the costs involved in data collection. However, DAQ collects the data required to calculate the battery performance parameters. DAQ also provides flexibility in collecting a wider range of data for various applications. Integrating DL techniques with advanced BMS presents a promising approach for the early prediction of battery performance, overcoming the challenges associated with data collection methods, and offering scalability for diverse applications.
To explore the use of DL in the early validation prediction of battery performance, Kunz et al. [9] utilized a dataset gathered from a Maccor series 4000 tester, an expensive and highly accurate battery test system capable of driving voltages and currents, as well as accurately reporting values within ±0.02% and ±0.05% of the full-scale range. The temperature data were gathered, but no specific details were given on the type of DAQ used or the data rate. Huang et al. [10] describe a novel extended Kalman filter (EKF) intent on improving SOC or SOH estimation performance using a Keithley 2461 source meter unit to measure cell voltage and currents. A thermocouple data logger was used for temperature data collection, with no specifics given about sensors except a mention of K-type thermocouples. Continuing the recent trend of data logging setups for DL data, Gasper et al. [11] developed a machine learning (ML) method using massive amounts of data for battery health prediction with electrochemical impedance spectroscopy (EIS). The dataset utilized by Gasper et al. [11] was obtained from another study by Smith et al. [12], which focused on a reduced-order LIB life model. This dataset, used for both modern reduced-order and ML models, was captured with a Fujitsu TNW 5 V, 360 A battery cycler. While such sophisticated battery testing systems provide highly accurate data for DL and ML applications, they pose a significant challenge for operando studies owing to their size, cost, and complexity. Measurement of the surface temperature of LIBs is crucial because of its direct correlation with their safety and performance [13]. Elevated temperatures can accelerate the degradation processes, increase the risk of thermal runaway, and compromise the overall stability of the battery system [13]. Monitoring and controlling the surface temperature is essential to prevent overheating and mitigate the potential hazards associated with LIBs [14]. With limitations imposed by computational power and storage, a compact design using a single integrated circuit is needed with the possible integration of cloud-based measurements [15]. A modern BMS is also a critical and underutilized repository of battery data that can be valuable for DL applications.
In one study, Li et al. [16] developed a temperature-based BMS using linear regression to predict and prevent over-discharge in LIBs. Their setup utilized commercially available prismatic cells with lithium cobalt oxide (LCO) cathode, cycled using an eight-channel battery analyzer (BAn). The external temperatures were monitored using a resistance temperature detector (RTD) with a DAQ module. This setup successfully detected and prevented over-discharge within 0.1 V of the cutoff voltage. Jones et al. [17] developed a method using Gaussian process regression (GPR) to predict the discharge capacity of LIBs after nail puncture, utilizing incremental capacity analysis data. Their approach achieved high accuracy in forecasting battery performance under damage conditions, with a mean coefficient of determination of 0.923. This study showcases how machine learning algorithms can be effectively applied to complex battery systems, particularly in scenarios involving abuse of the battery.
In a separate study, Jia et al. [18] examined ML-driven prognostication of SOC, SOH, and RUL by employing a GPR ML model. Nizam et al. [19] and other researchers elaborate on a spectrum of ML techniques for SOC estimation. Patil et al. [20] presented an online RUL estimation technique that extracts pivotal data features, followed by algorithmic classification and prediction using a support vector machine-based ML model. Wang et al. [21] discuss a plethora of conventional methods for predicting RUL, encompassing both ML and non-ML paradigms. Sheng et al. [22] employed transfer and ensemble learning to predict capacity with lesser cycling data. Jinpeng et al. [23] utilized convolutional neural network short-term charging data to estimate maximum and remaining capacities. More information on the development of ML algorithms for battery life predictions can be found in our previous research [24]. However, there remains a critical gap in the development of practical, real-time BMS that can operate under high C-rate discharge conditions and integrate with advanced ML-based prediction models in real time.
Along with the SOH, the SOC, RUL, and the C-rate are also important parameters for the performance of LIBs. C-rate is the ratio of battery current to the rated capacity. An increase in the C-rate of the battery causes a capacity fade or increase in battery degradation and a reduction in time to complete one full charge or discharge cycle [25]. Such increases in the C-rate are often required for applications like aviation [26], electric vehicle charging, etc. [27,28]. Ouyang et al. [29] performed testing on overcharge and over-discharge rates to investigate the fire and thermal characteristics of batteries. It was observed that the surface temperature of the battery increases with an increase in the C-rate. Previous work on high C-rates has also involved the development of accelerated degradation models of batteries [20]. In the DL domain, data holds paramount importance. However, current data collection methods often face challenges such as complex setups and sensor accuracy ambiguities. A necessity has emerged to develop an innovative, portable BMS framework for collecting voltage, current, and temperature data in a versatile range of applications like high C-rates, encompassing both stationary battery loads and dynamic mobile systems. A modular in-operando system that incorporates a BMS with DL that integrates with modern cloud data can ensure scalability and flexibility to adapt to the evolving technological needs of systems based on LIBs.
In this work, we present a comprehensive framework for a BMS capable of meeting electric propulsion-specific requirements of in-operando monitoring while integrating a capacity degradation network (CD-Net) DL model developed previously, which uses only four historical data points to predict the upcoming cycle capacity with higher accuracy and lower computational power [24] than support vector regression, Bayesian regression, and GPR methods. The next section outlines the general design and key components of such a system, followed by a detailed explanation of the specific components leading to a proof-of-concept hardware system demonstration with 42 standard charge-discharge cycles and 20 in-operando charge-discharge cycles [4,30]. Subsequently, an experimental setup is described for deploying a DL SOH estimation model that can be used for both static battery packs and electric propulsion systems. Outcomes demonstrate high-quality data capture and successful integration of DL models with the collected data. Finally, comparisons between BMS data and secondary DAQ source-based data are presented to validate the efficiency of the DL-based BMS solution. This approach contributes to BMS development as well as facilitates accurate integration with edge and cloud platforms, incorporating DL or ML models.
2. Development of BMS
A printed circuit board was developed for the proposed BMS, focusing on collecting essential data for battery health prediction and initiating actions based on predictions. The developed BMS used the in operando data for modern battery health prediction including battery voltage, current, and temperature [18,31]. The collected data were then fed to a DL model for the live prediction of the battery health. The development process is described in brief in the following sections.
2.1. Sensor Measurement
Accurate measurement of current and temperature is essential for the safe and efficient operation of electric propulsion systems [31]. This section explores methodologies for current, voltage, and temperature measurement in battery applications. The enhancements were also highlighted to improve measurement accuracy and accommodate real-time scenarios. Through these efforts, we aim to ensure precise and reliable monitoring of critical parameters crucial for battery system performance and safety.
2.1.1. Current and Voltage Measurement
The current measurement was performed using a shunt resistor inserted into the current path called a high-side current sensor. It measures the current between the positive terminal of the power supply to the load. A current–voltage sensor INA219 was chosen due to its extensive monitoring capabilities, including the ability to handle variable pack voltages, extreme high and low voltages of the battery (from 0 to 26 V), and a standard current measurement range of ±3.2 A; the chosen sensor provides current resolution of 8 mA and uses inter-integrated circuit communication [32,33]. To accommodate real-time scenarios where the current discharge from the battery exceeds ±3.2 A, the default 0.1 Ω current shunt resistor was substituted with a 0.01 Ω resistor. This adjustment enabled the system to accommodate a maximum current range of ±32 A. The current–voltage sensor’s maximum voltage differential of 0.32 V drove the choice of the 0.01 Ω resistor, corresponding to a maximum current range of ±32 A when divided by the voltage differential according to Equations (1)–(4). A Datasheet of the INA 219 current and voltage sensor was used for programming this sensor to develop our BMS.
2.1.2. Temperature Measurement
Temperature measurement for battery applications utilizes sensors that change resistance with temperature. Common sensor types include thermistors, thermocouples, and RTDs. RTDs are widely used to measure battery temperatures due to their accuracy [17,34]. In this study, PT100 Adafruit MAX31865 sensor breakout boards were chosen due to their low power consumption (1.6 μW to 1.8 mW) including 2, 3, and 4 wire compatibility with high accuracy and stability [35]. The relation between the resistance of the temperature sensor and the temperature was obtained based on Callendar–van Dusen’s equation [36], as shown in Equation (5):
where, R0 = 100 Ω (resistance at 0 °C) and α = 3.90830 × 10⁻³, β = −5.775 × 10⁻⁷. Five temperature sensor breakout boards were used, with one attached to each battery cell represented in Figure 1 and an additional sensor on board for ambient temperature monitoring. This setup was calibrated by comparing the ambient temperature of the room to the ambient temperature collected by the sensor.
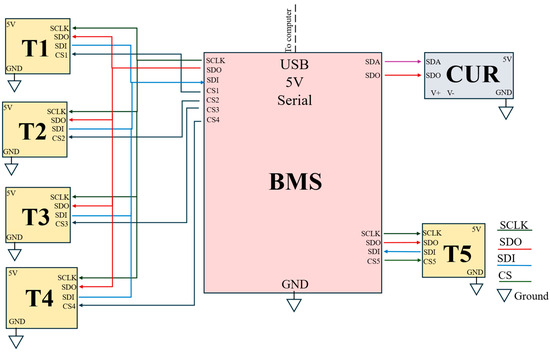
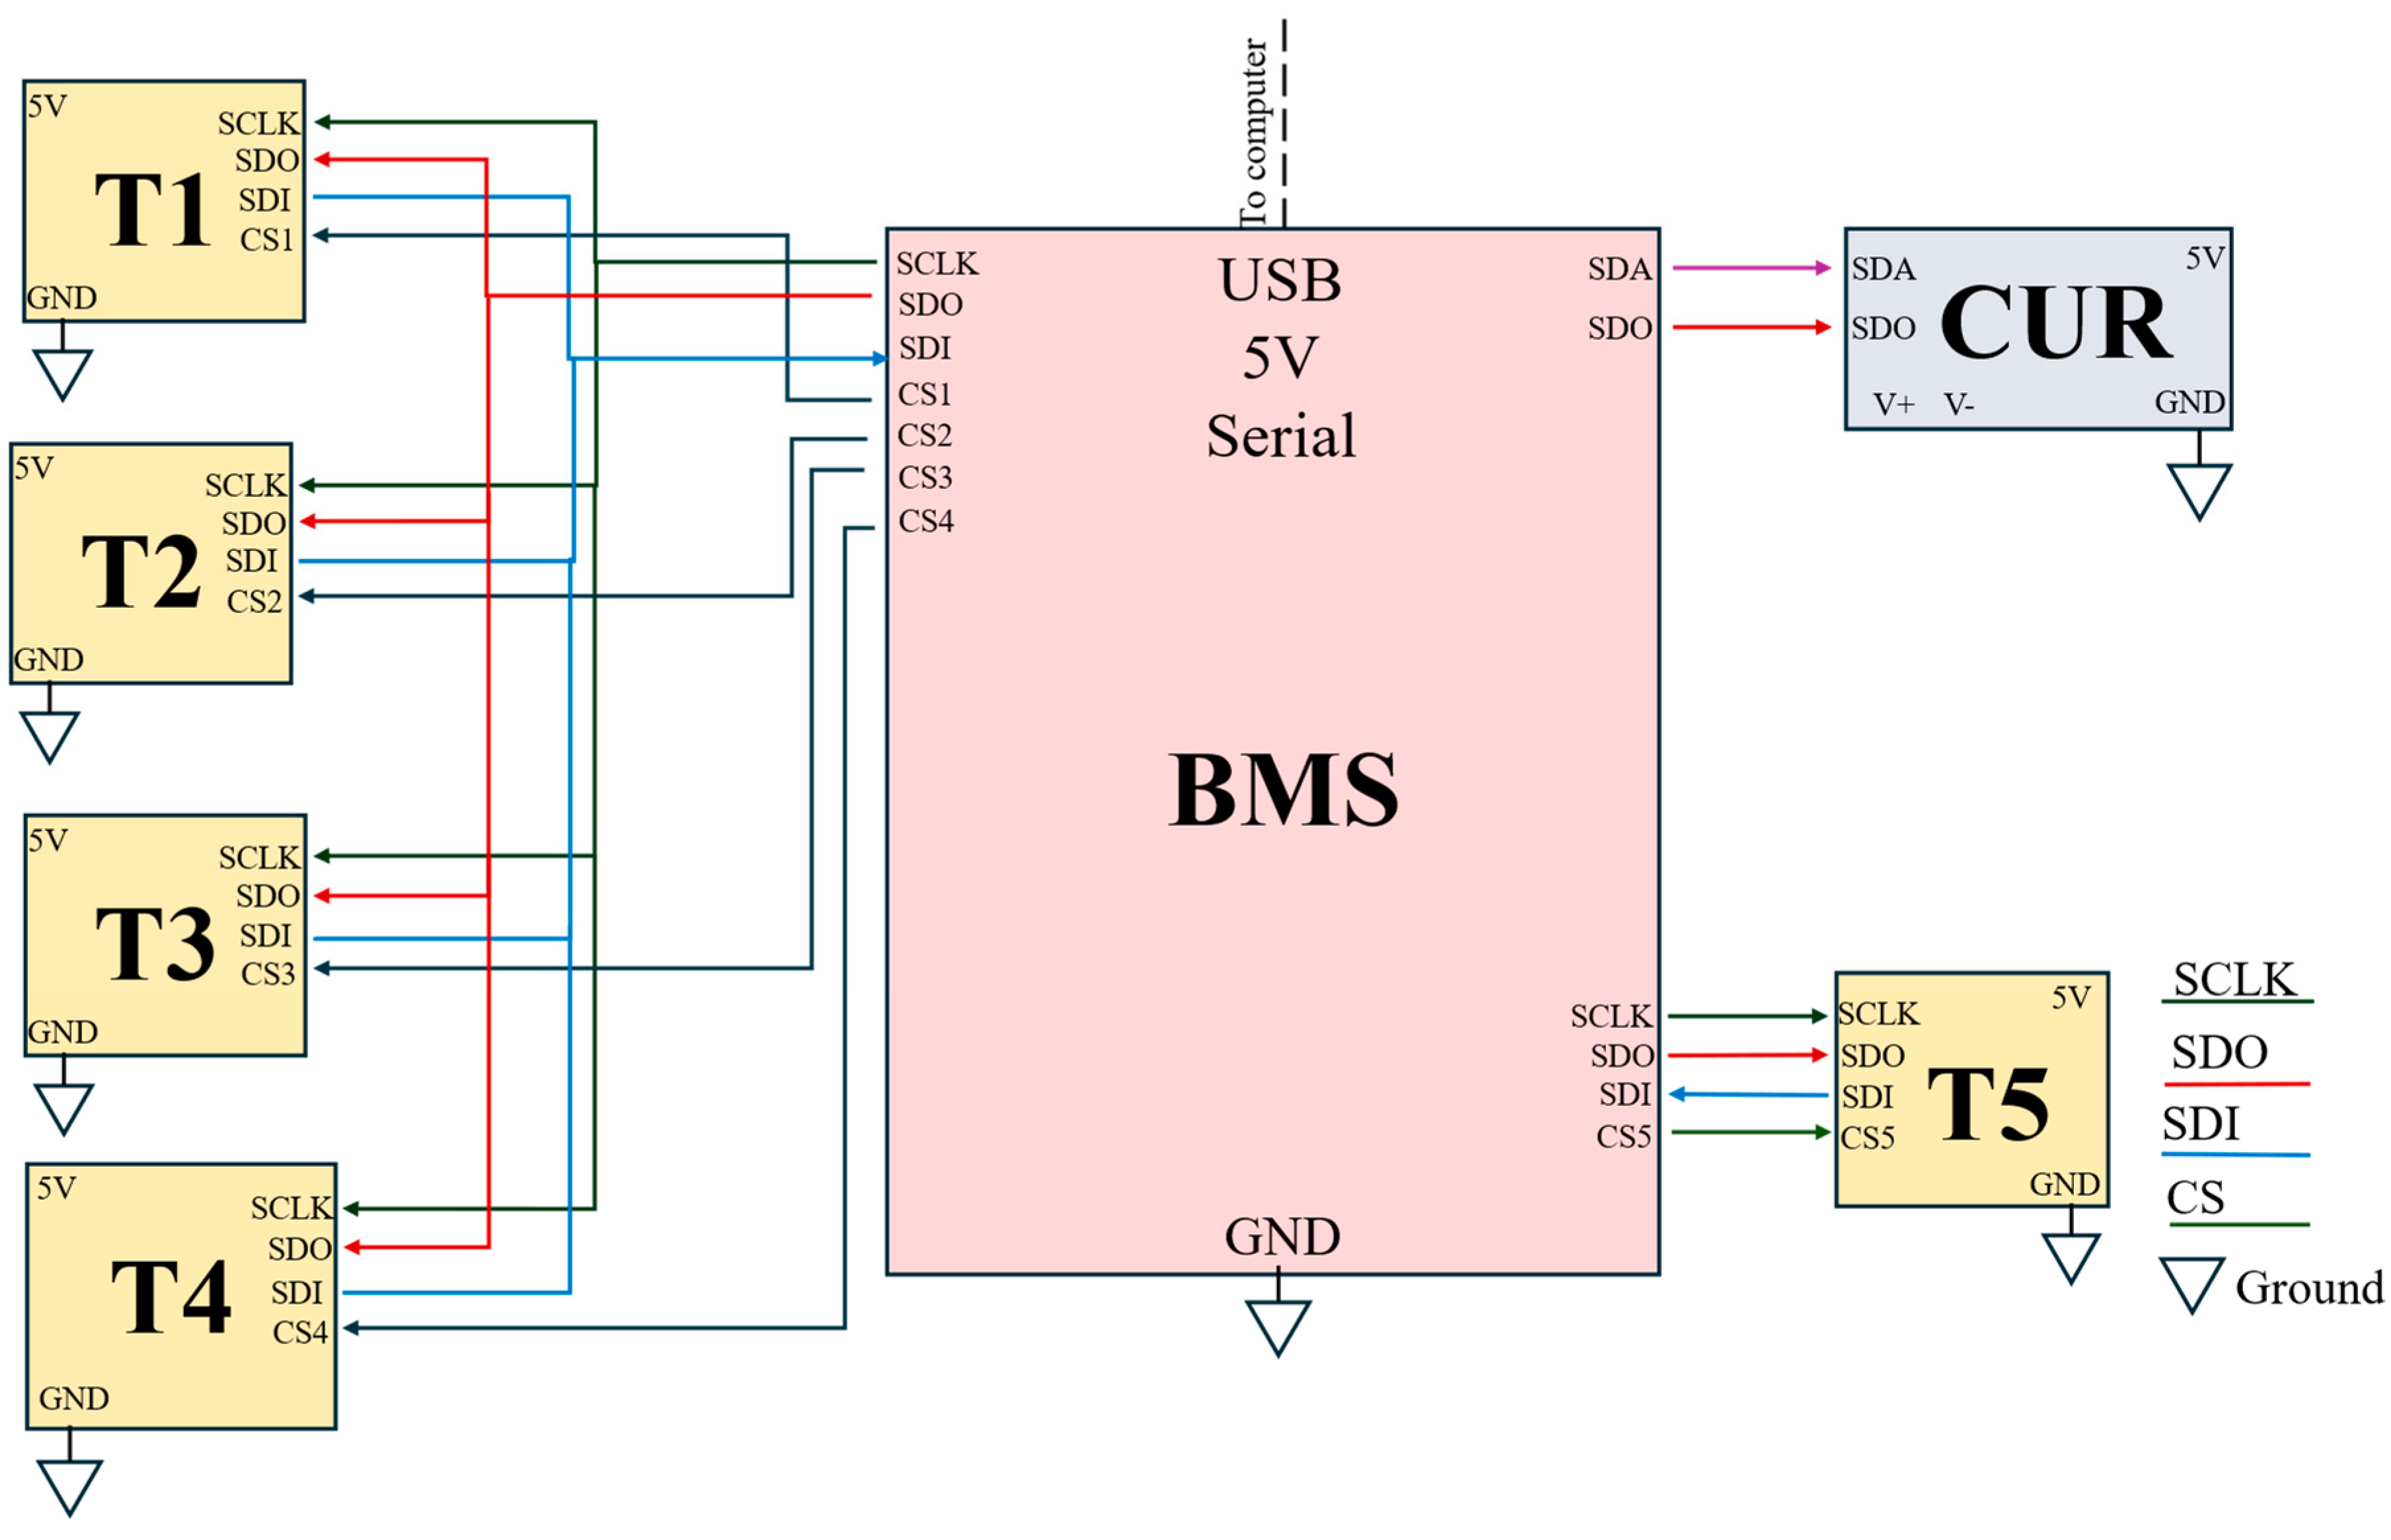
Figure 1.
A detailed schematic of the BMS sensor network, illustrating the integration of current, voltage, and temperature sensors with a microcontroller and communication module for real-time monitoring and data transmission.
2.2. Device Control
An Arduino Uno Rev 2 Wi-Fi circuit board, equipped with the ATmega4809 microcontroller, was chosen due to its data logging, pre-processing, and transmission capabilities [37]. It had a clock speed of 16 MHz with 48 kB of flash memory and Electrically Erasable Programmable Read-Only Memory (EEPROM) of 256 Bytes providing 16 digital input and output pins. This device managed a network of sensors, including ‘temperature sensors’ and ‘current and voltage monitor sensors’ (obtained from Adafruit Industries). Its internal 5 V regulator, with a maximum current output of 0.8 A, was used to satisfy the input current and voltage requirements of the sensor network. Table 1 provides a detailed overview of the various connections made using an Arduino board with various sensors, as also depicted in Figure 1. This setup has five different temperature sensors for collecting four cell surface temperatures and one ambient temperature. Serial clock (SCLK), serial data out (SDO), serial data in (SDI), and chip select (CS) were all signals utilized in the serial peripheral interface (SPI) protocol to connect the sensors to the microcontroller. Table 2 gives information on the required power for these sensors and their usage in collecting parameters like voltage, current, and temperature.

Table 1.
Description of the electrical terminals on the sensor network wiring harness.
Table 2.
Current and operating voltage requirements of the sensor network used in the development of BMS in this study.
2.3. SOH Estimation on BMS
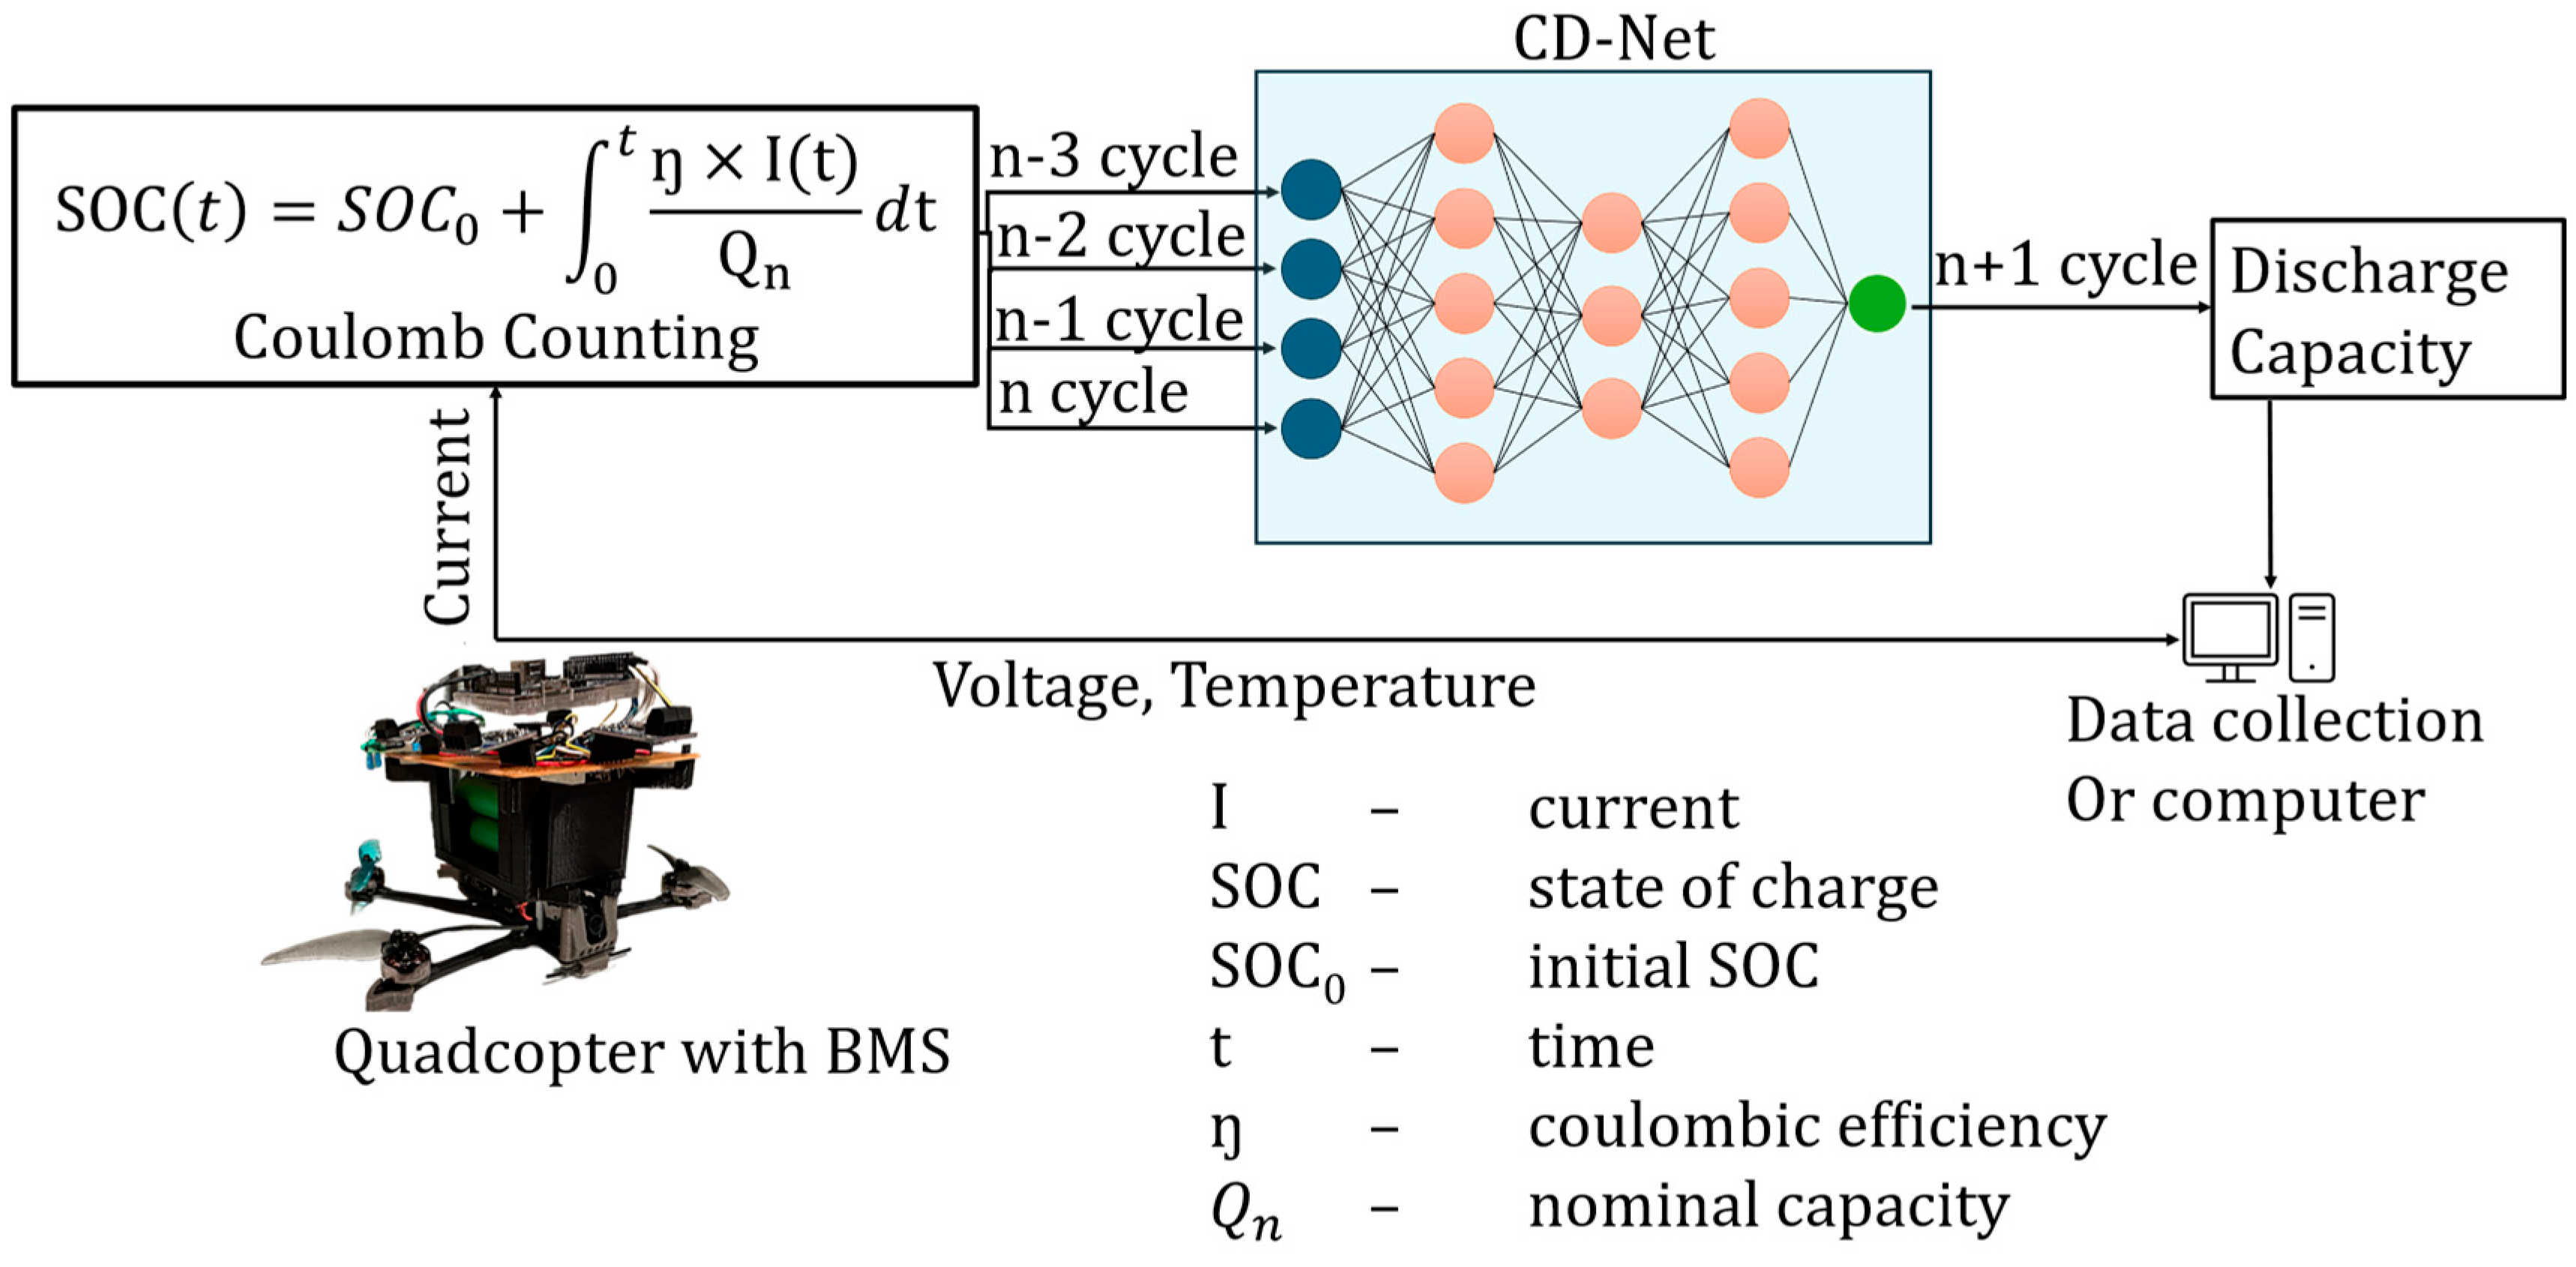
Voltage and temperature collected by the BMS are transferred to the computer or data collection facility. The current collected by the BMS was used to calculate the SOC of the battery by using the coulomb counting method, as shown in Figure 2. The data collected by the BMS are transferred via a wired transfer method due to its high-speed communication between the BMS and computer for the prediction of capacity. Coulomb counting [38] uses the initial capacity (Qn) provided in the data sheet of the battery pack (also mentioned in Table 3) along with the continuous current flowing into the battery pack to calculate the SOC. The SOC of each cycle along with the nominal capacity and cell chemistry fed into the CD-Net model [24] developed in-house by Sudarshan et al. are used for predicting the upcoming cycle discharge capacity. A combination of a five-layer autoencoder with a structure of 10 × 4 × 1 × 4 × 10 neurons and a two-layer perceptron was used in the CD-Net model. The model was optimized over 20 epochs using Adam’s optimizer with 1 × 10⁻⁴ learning rate. Four cycles of historical data were fed into the CD-Net, and using an encoder–decoder, the noise in the data was removed to highlight the temporal vectors responsible for the degradation of the battery. A rectified linear activation function with mean squared error as a loss function was used in the CD-Net model for better predictions. This model has already been tested on the NASA Prognostics Center of Excellence dataset and Sandia National Lab dataset in [24]. The maximum capacity of the upcoming cycle predicted by the CD-Net model is used to calculate the SOH, a ratio of the predicted maximum capacity to the nominal battery capacity.
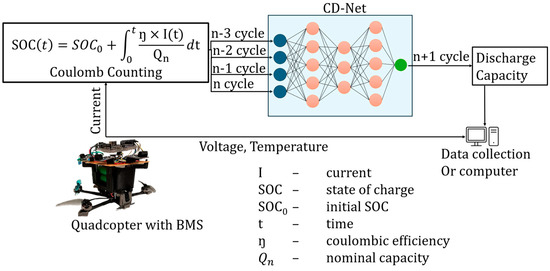
Figure 2.
A drone with the BMS on top stores the voltage, temperature, and current. Current was also used to calculate the SOC of the battery, which helps to predict the discharge capacity by using CD-Net.
Table 3.
Specifications of the individual cells in the LIB battery pack used in this study.
3. Experimental Setup
Tests were conducted on an 18650 Sony VTC 6 battery pack with 4 cells in series. The specifications of the individual cell are listed in Table 3. The NCA cells were selected due to their higher risk of thermal runaway when compared to other cell chemistries such as lithium cobalt oxide (LCO) or lithium iron phosphate (LFP) [39]. The battery pack had a capacity of 3 Ah with a maximum voltage of 16.8 V. Each cell weighed approximately 46.4 ± 1.5 g, and the entire battery pack weighed 195 ± 3 g. Each cell was considered fully charged when the voltage reached 4.2 V, and fully discharged it reached 2.5 V. According to the datasheet, a standard cycle was defined as charging the battery under CCCV at 3 A of current followed by 0.167 h rest and discharging under constant current discharge at 3 A of current followed by 1.0 h rest.
3.1. On-Ground Testing
On-ground tests were conducted to analyze the performance of newly developed BMS before deploying it in electric propulsion vehicles. The on-ground tests involved applying a load to the battery, allowing it to charge and discharge by connecting the BMS between the battery pack and the BAn, as shown in Figure 3b. The NEWARE Powerwall CT-4004-20V20A system BAn, capable of charging and discharging up to a combined 20 V and 20 A, was used as a load during on-ground testing. The voltage, current of the battery pack, and surface temperature of each cell were monitored, and the BMS logged the data. To place the RTD on the battery, the protective film of the battery was removed at the center of the 18650 cell, and the orientation of the battery pack was noted to maintain consistency in recording surface temperature, as shown in Figure 3d. Additionally, the voltage and applied current on the battery pack were collected by the BAn. Following the standard cycling on the battery pack, 42 cycles were performed to check the performance of the newly developed BMS. The cycling pattern was similar to certification experiment bed by NASA for small satellites [40].
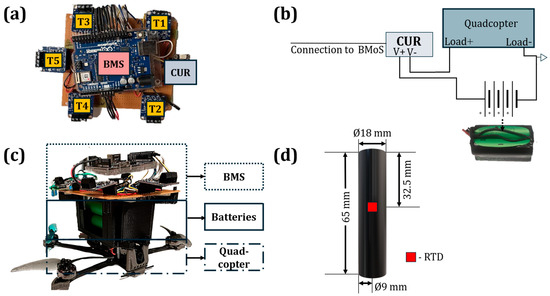
Figure 3.
Overview of the experimental setup designed in-house: (a) top view of BMS with all the sensors used in these experiments, (b) schematic representation of BMS and quadcopter connectivity with batteries, (c) in operando experimental setup of quadcopter along with batteries and BMS, and (d) 18650 NCA batteries used in batteries where RTD is placed in the middle of the surface.
3.2. In-Air Testing
After performing the on-ground experiments, real-time in-air testing was conducted for 20 charge-discharge cycles. This testing was conducted to gather data under high discharge rates. Real-time data were collected using an electric propulsion vehicle or quadcopter (a FLYWOO Explorer), with 2750 kV motors that can spin 2750 RPM per volt. The quadcopter includes a GOKU GN405 Nano flight controller with an Atomic 5.8 GHz antenna for point-to-point communication. Without the battery, the quadcopter weighs 162.8 ± 2 g. The quadcopter was chosen for its real-world usage and ability to draw high currents from the battery pack [41]. The battery pack was installed in a 3D-printed mounting frame to support the BMS on top, as seen in Figure 3c. The BMS weighed 113 ± 2 g. The battery charging protocol remained consistent with the on-ground procedure, utilizing the datasheet of the battery pack. After each charging cycle, approximately 0.167 h were required to prepare for in-air discharge. Unlike the controlled discharge patterns employed during ground testing, the in-air discharge cycles were randomized to simulate real-world variations. The quadcopter flew approximately 1 foot above ground level during discharge. When the BMS indicated that the battery voltage had reached 10 V, the in-air discharge was stopped. After a 0.167 h rest period, a charging cycle was performed.
4. Results and Discussion
The following section discusses the results and key findings obtained using the newly developed BMS, including CD-Net model predictions. Using the previous experimental setup for on-ground and in-air experiments, the newly developed BMS collected data from both stationary and dynamic battery loads. The newly developed BMS seamlessly integrates DL models like CD-Net, providing significant flexibility to adapt to evolving technological needs.
4.1. On-Ground Voltage Profile Measurements
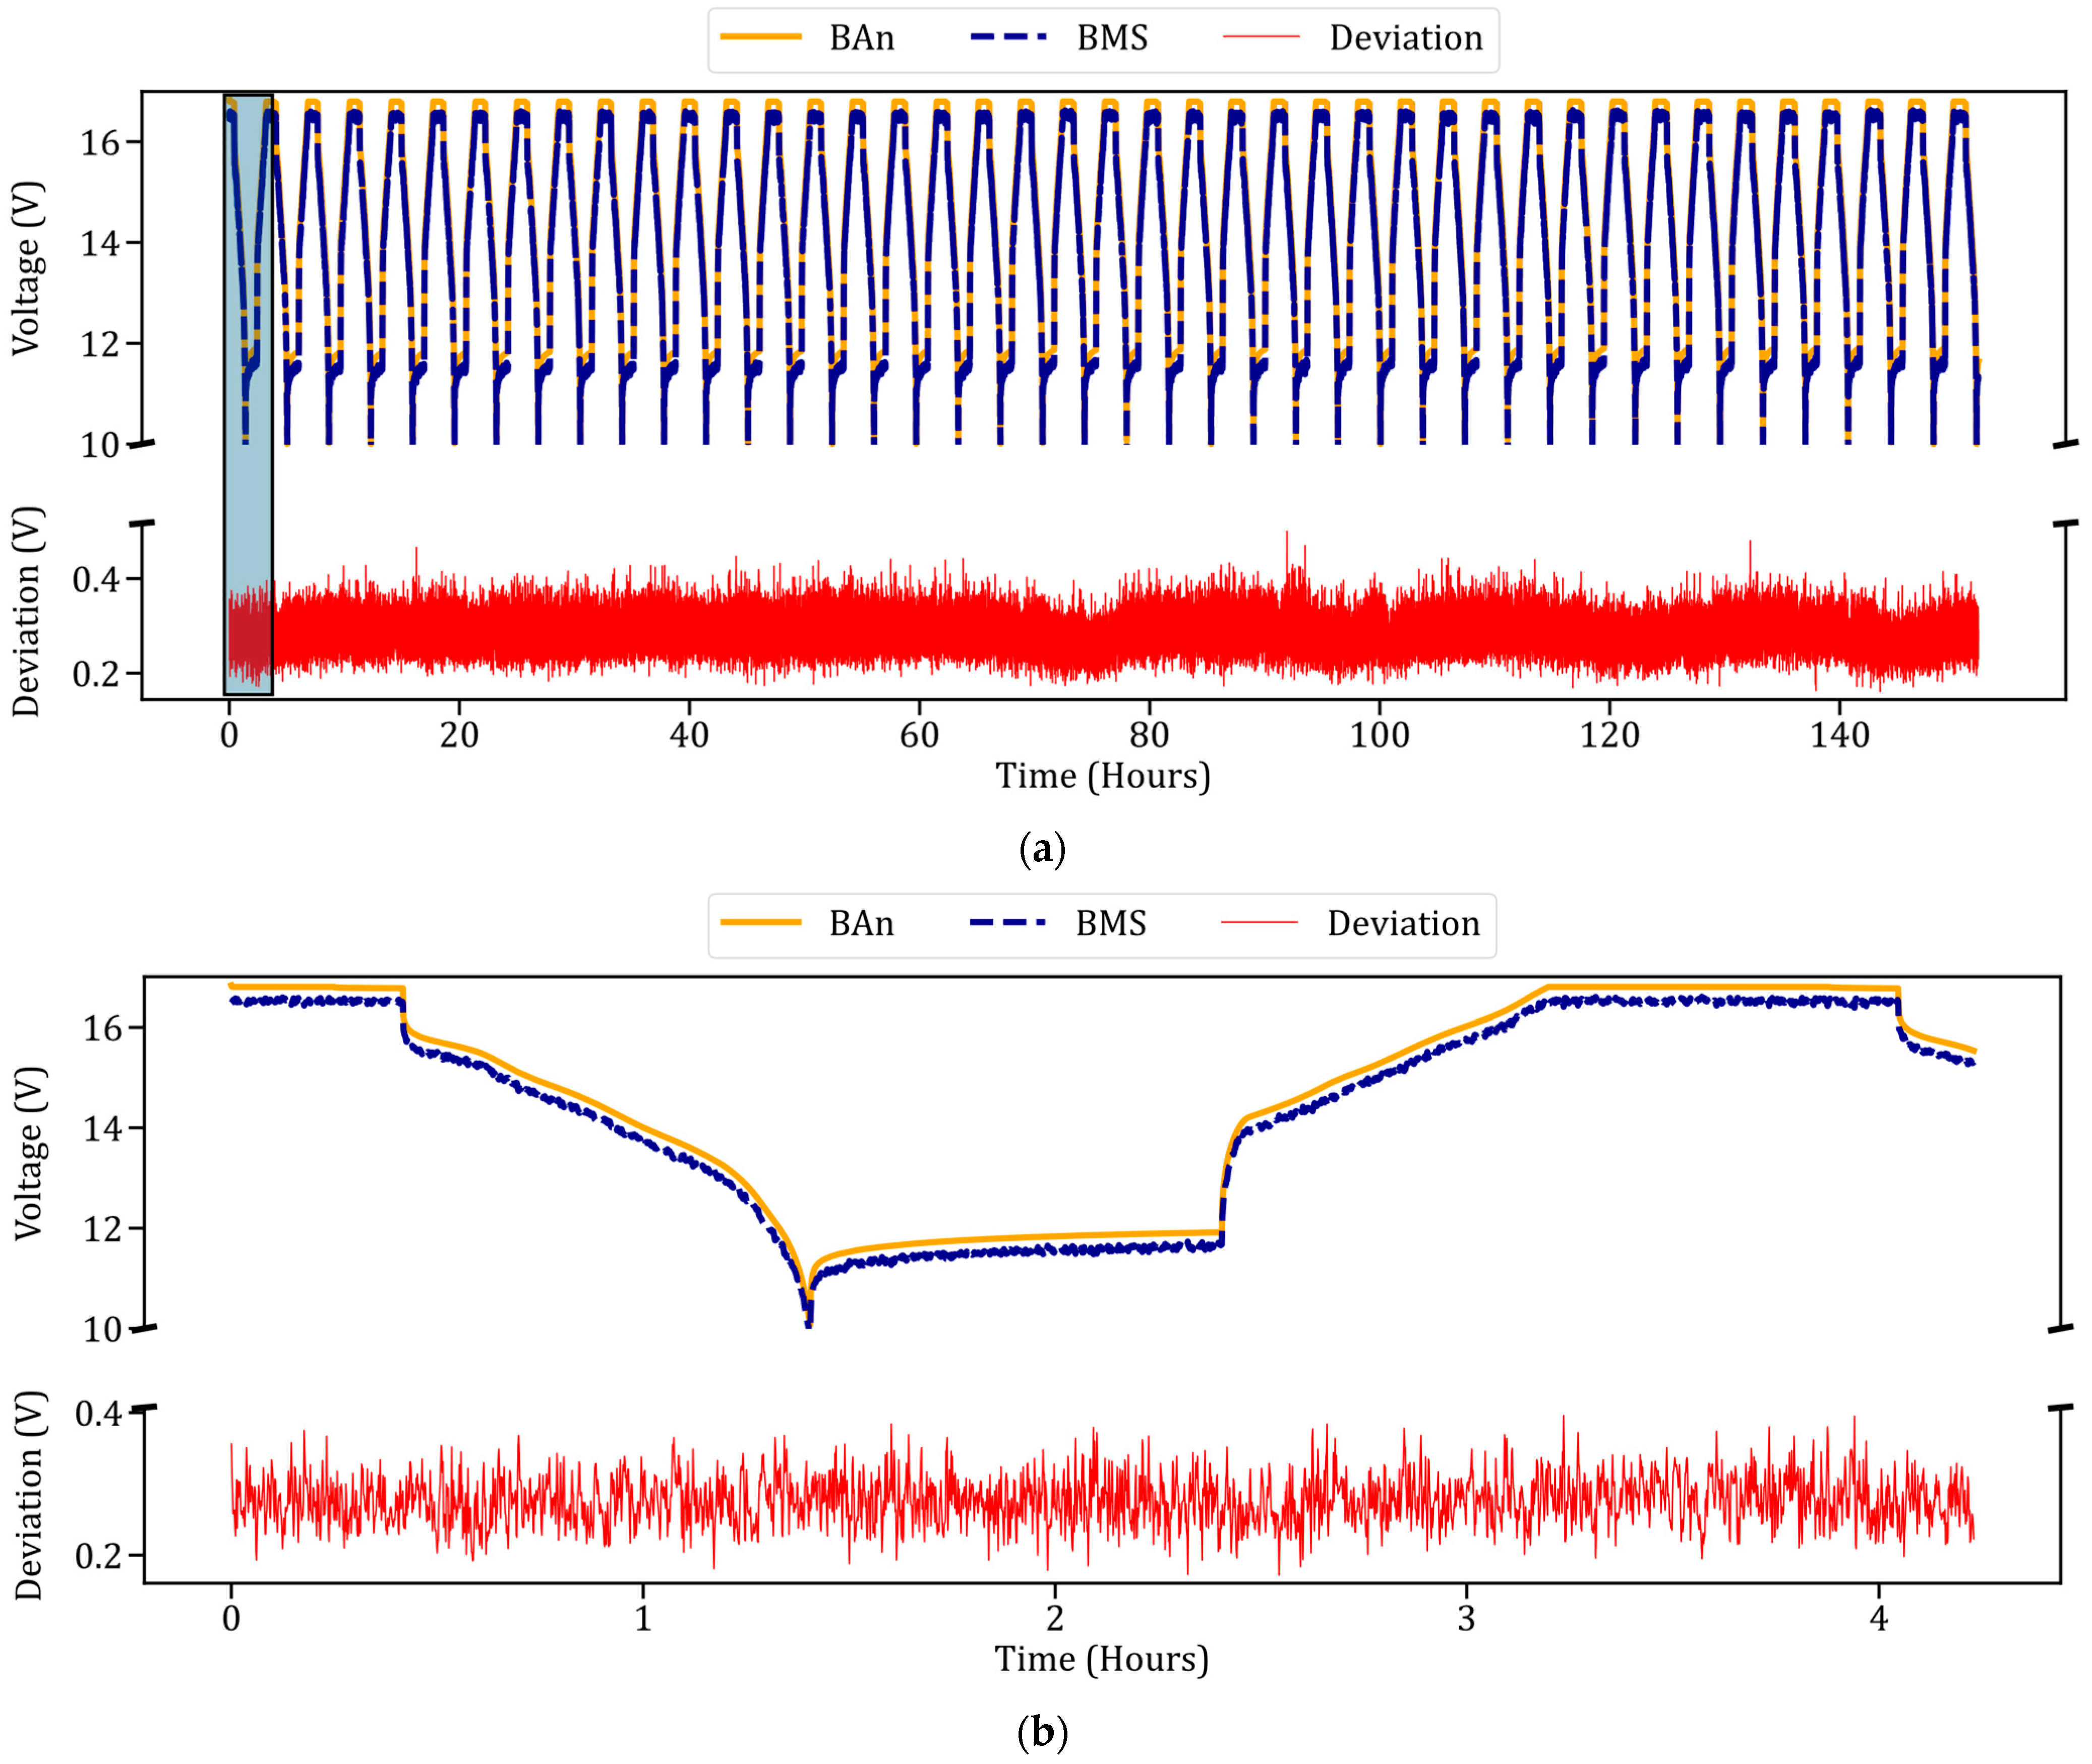
Figure 4a illustrates voltage versus time data for 42 cycles of charging and discharging from both the BAn and the newly developed BMS. Each cycle consisted of approximately 1.5 ± 0.2 h of charging, followed by 1.0 ± 0.2 h of discharging. During the discharging phase, as depicted in Figure 4b, the voltage initially decreased rapidly before transitioning to a slower decline, consistent with the findings of Chin et al. [42] and Huang et al. [43]. Subsequently, the constant current charging phase led to a logarithmic increase in voltage, followed by a constant voltage charging period lasting over 0.5 ± 0.1 h. The voltage data acquired by the BMS closely match those of the BAn, although a slight initial lag was observed in the BMS data, which subsequently converged with the BAn readings. The constant voltage portion of the discharge curve can be further investigated to establish a direct correlation with the SOH of batteries [44]. Differences in the voltage reading occur due to the 5-second data transfer rate of the BMS and a delay in the internal clock for both systems. The BMS operates on the battery’s power, unlike the BAn, which uses an external power source that causes the initial lag. The observed average deviation of 0.2 V between the BMS and BAn, along with the logarithmic curve during the constant current phase, indicates a close match. The study by Fleischer et al. [45] observed an accuracy error of just above 0.05 ± 0.01 V while performing on-ground tests with a hardware-in-the-loop (HIL) simulator. Overall, the results suggested good alignment, with minor variations attributed to the power source and internal clock discrepancies between the BMS and BAn.
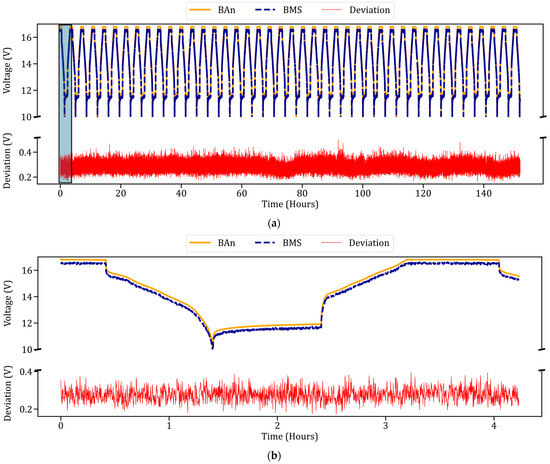
Figure 4.
A comparison of voltage readings collected from both BMS and BAn. (a) Voltage data for 42 cycles, highlighting the deviations between 0.2 V and 0.4 V. This indicates a close match between the BMS and BAn data. (b) The first cycle data, illustrating the discharging and charging profiles. Random deviations in voltage are shown compared to the BAn readings.
4.2. On-Ground Current Profile Measurements
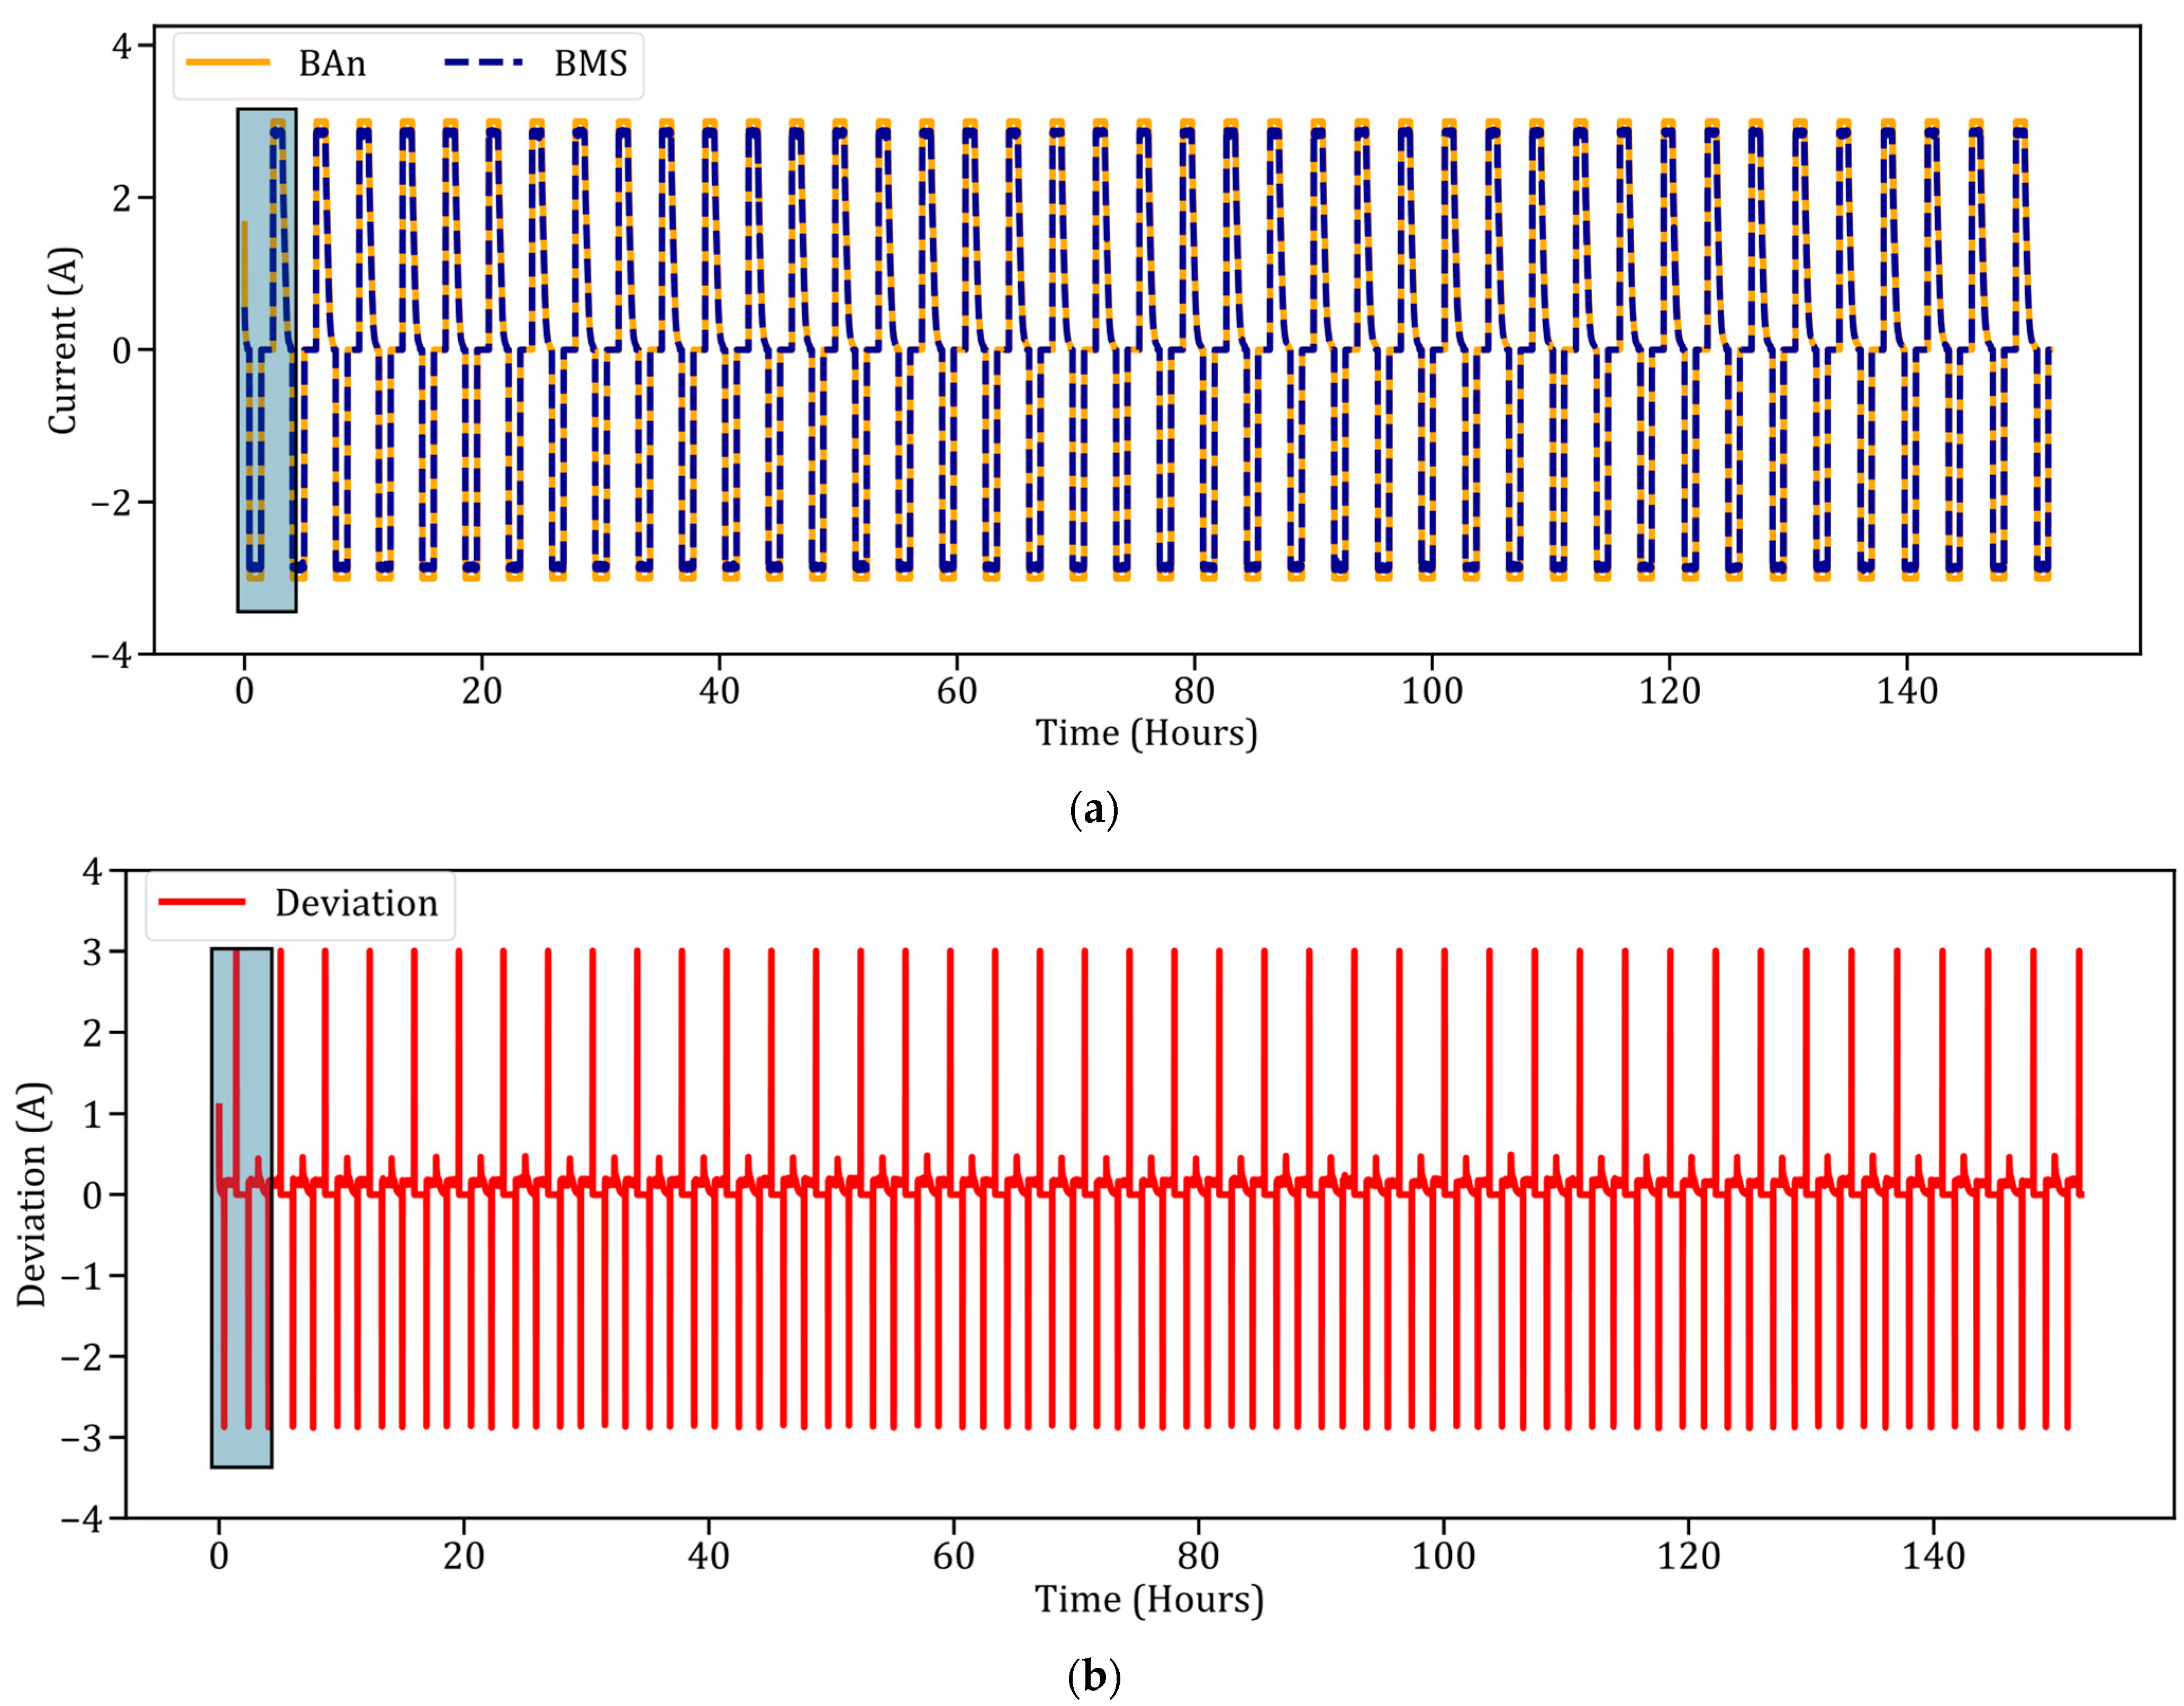
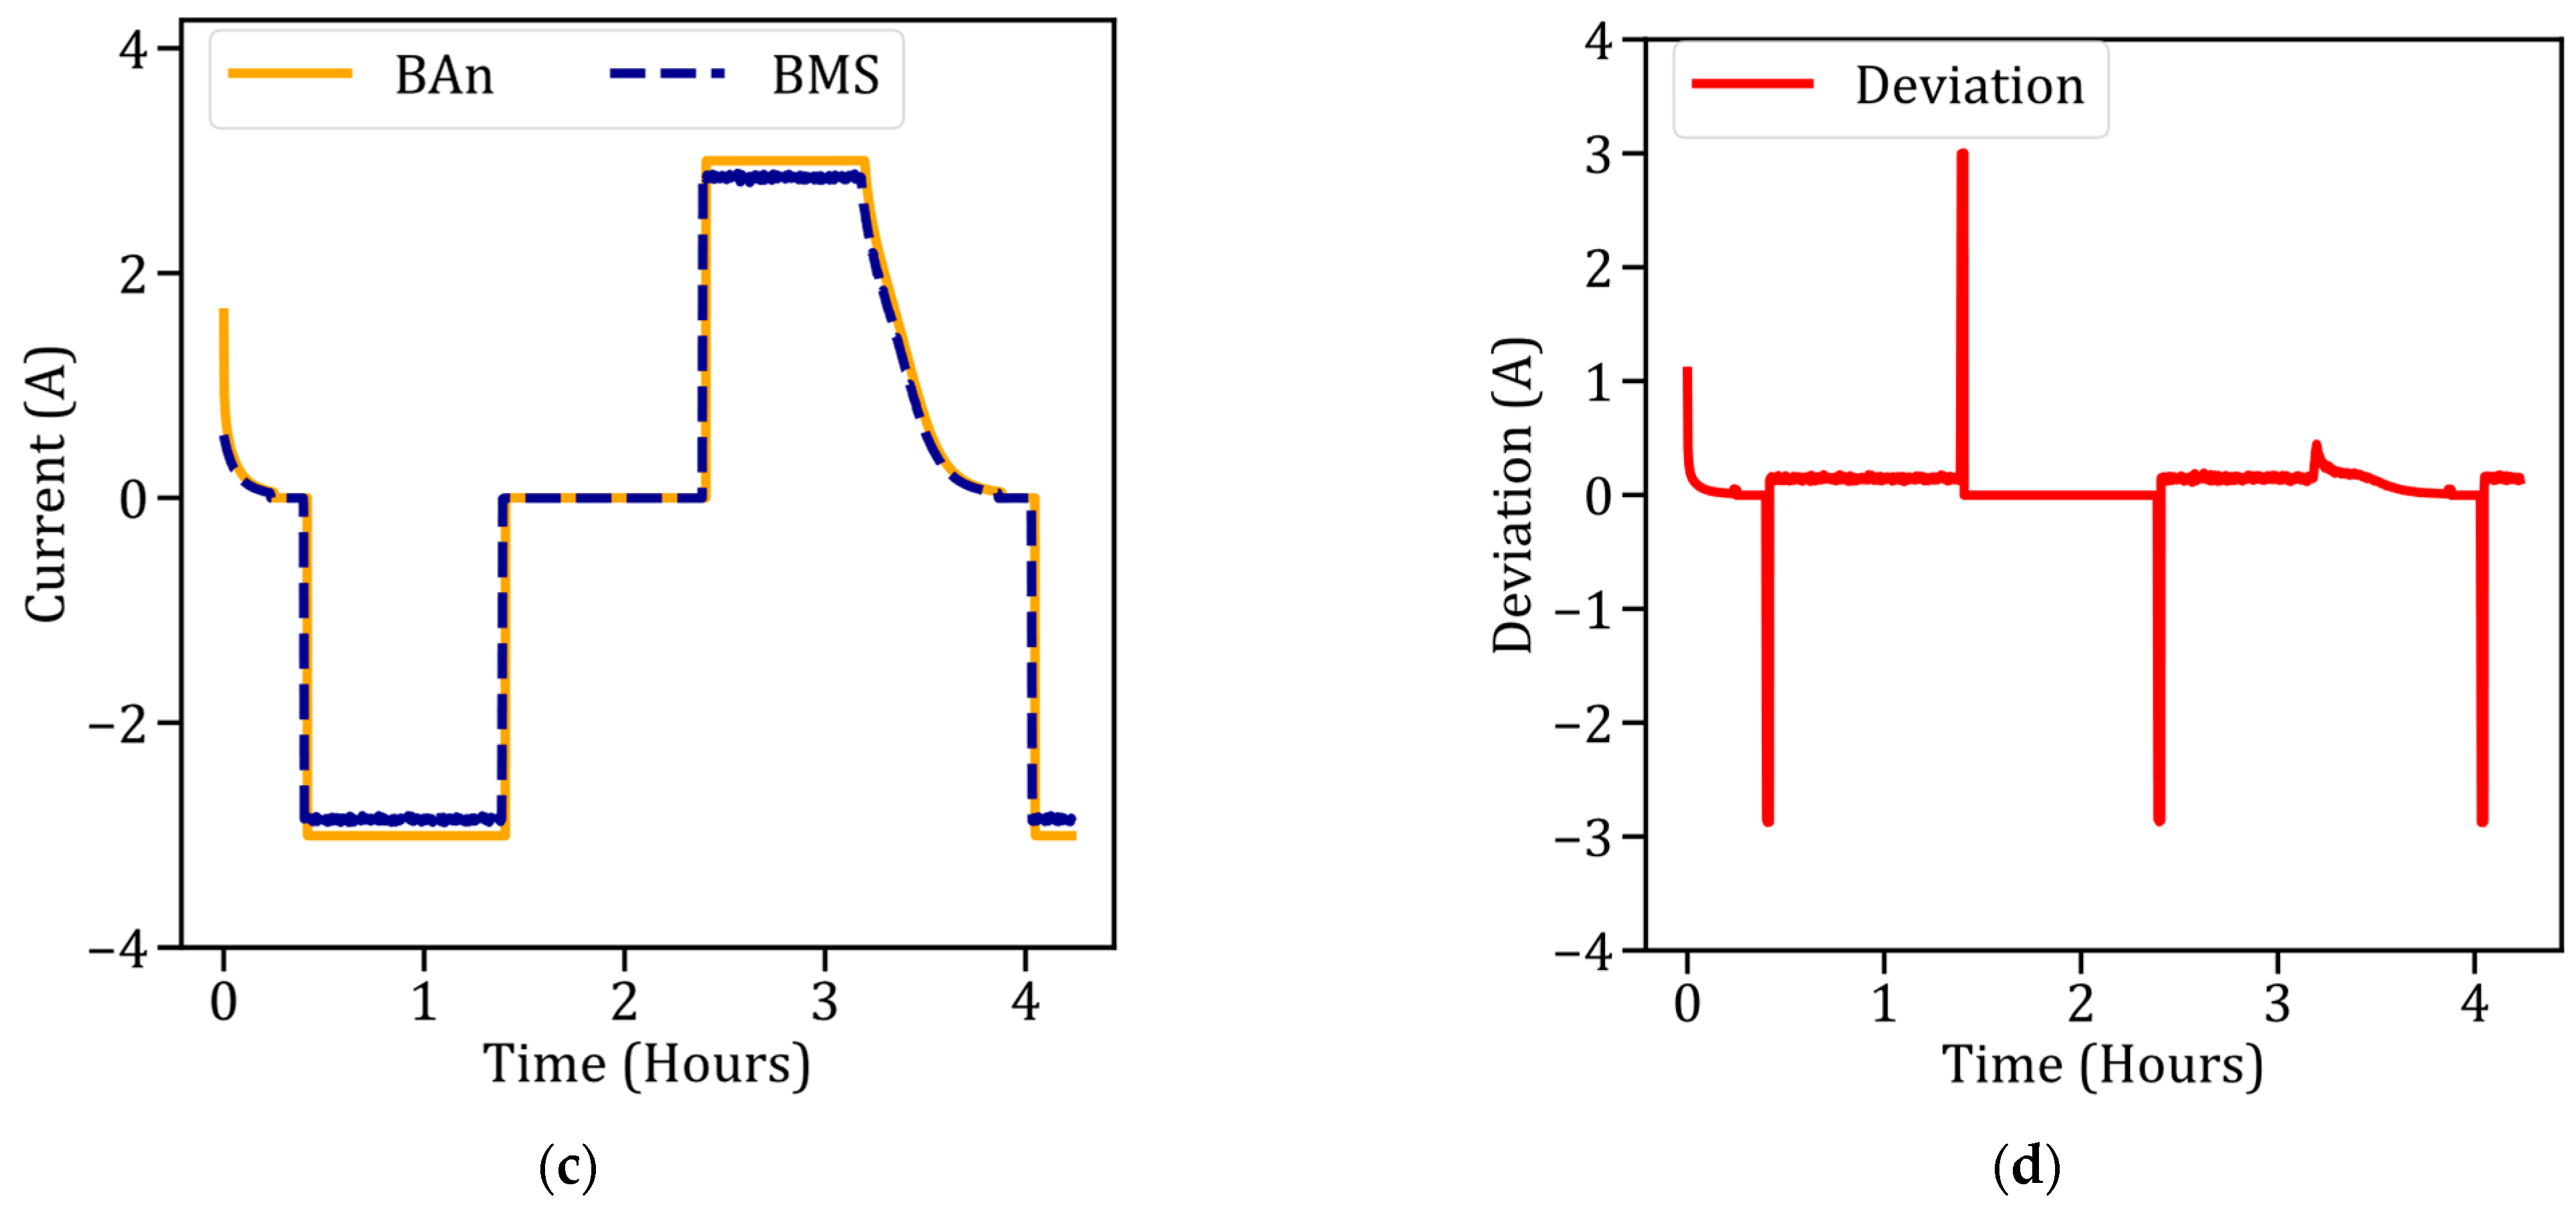
Figure 5a illustrates the current flowing through the BAn during 42 cycles of on-ground testing. Figure 5a,b show the initial cycle’s current data from both the BAn and the BMS, as well as the deviation between them. The negative values in the figure represent the current drawn from the battery during discharge. The BAn draws a current up to −3 A during the constant current phase of discharge. The BMS data showed a good match with the BAn data. After discharging at −3 A for 1.0 ± 0.2 h, the current drawn dropped to 0 A for the 1.0 h of rest. The current increased to +3 A to charge the battery during the constant current phase, consistent with the findings of Chin et al. [42]. The constant current charging phase lasted around 0.5 ± 0.1 h. The constant voltage charging began after the constant current charging phase. The negative slope after each constant current charging phase represents the constant voltage charge of the battery. During this constant voltage charge, the current supplied to the battery gradually decreased as the voltage increased to 16.8 V in the battery.
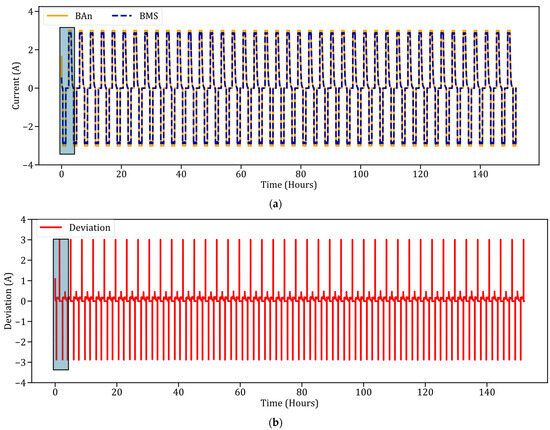

Figure 5.
Current data comparison between BAn and BMS across multiple cycles; (a) current data over 42 cycles for both BAn and BMS, showing consistent overall trends; (b) deviations between BAn and BMS, ranging from −3 A to +3 A, mainly during phase transitions from constant current to constant voltage or rest; (c) initial cycle comparison, showing a close match between BAn and BMS; (d) deviations during the initial cycle, with the highest deviations occurring during phase shifts.
Data collected from the BMS showed close agreement. However, in the part where the current skipped before each constant current phase, the BMS was delayed in reading these values, causing deviations higher than 0.25 A in certain instances, as shown in Figure 5b. The highest voltage deviations were observed when the charging phase shifted from constant current to constant voltage. The current readings were more accurate than the voltage readings from the BMS with a lower average deviation of 0.077 A. However, when the data points with deviations greater than 0.25 A were removed, the average deviation dropped to 0.058 A. This was due to the lower shunt resistance used to measure the voltage drop, which relates to the current via Ohm’s law.
4.3. On-Ground Temperature Profile Measurements
Four surface temperatures were collected to monitor the rise in temperature of each cell throughout all 42 cycles.
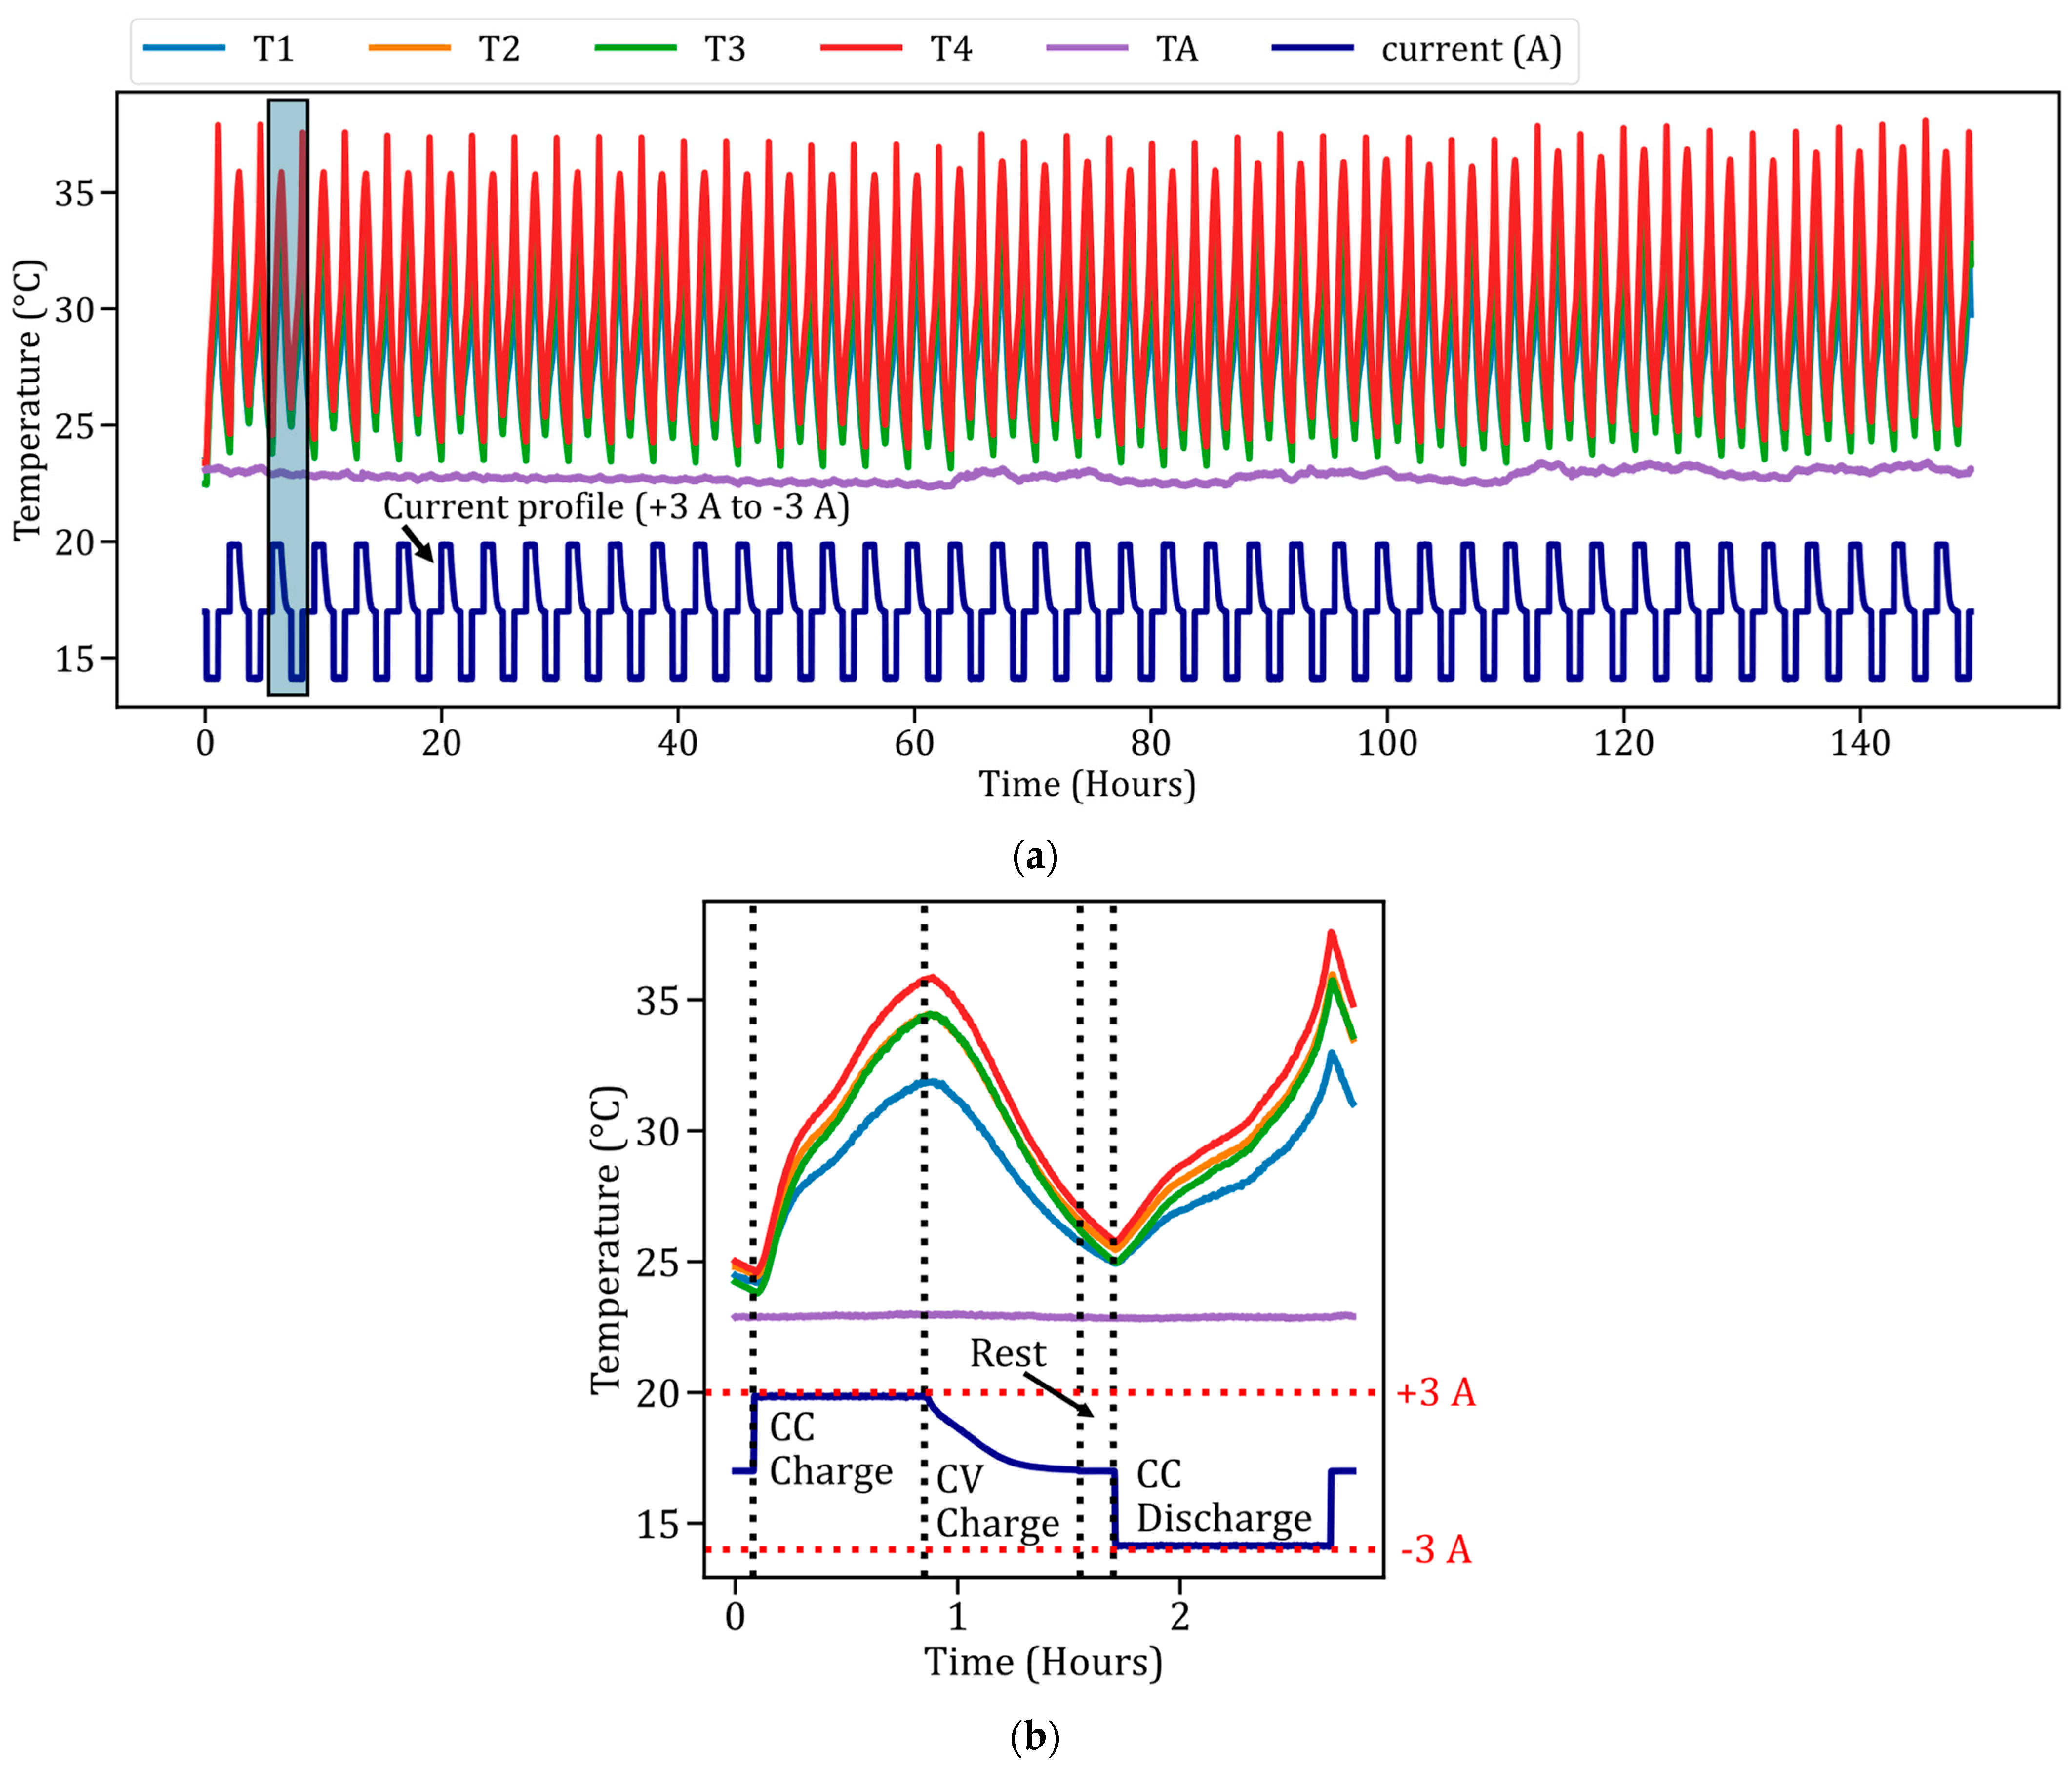
A rapid surface temperature increase was observed during the cycling of the battery for each cell. Similar observations were made by Chin et al. [42] and Tarascon et al. [2]. In Figure 6a, during the first cycle, each cell was at room temperature (24 ± 0.3 °C (TA)) before the on-ground experiments began. After the on-ground experiments commenced, there was a gradual rise in temperature due to the constant current charging of the battery pack, as shown in Figure 6b. Starting from room temperature, the surface temperature reached just above 32 ± 0.3 °C for each cell in the battery pack by the end of the constant current charge. A decrease in the surface temperature was then observed due to the constant voltage charge, followed by a 0.167 h rest. Subsequently, constant current discharge was applied to the battery by the BAn, causing the temperature to rise to 37 ± 0.3 °C. The constant voltage charging phase caused the surface temperature to gradually decrease, which was similar to the observations made by Chen et al. [46]. After that, 1.0 h of rest was provided; at this time, the surface temperature of the battery dropped to room temperature. The highest temperatures were observed at the end of each constant current phase of the batteries. These observations were consistent with all the cycles performed on the ground, as shown in Figure 6a.
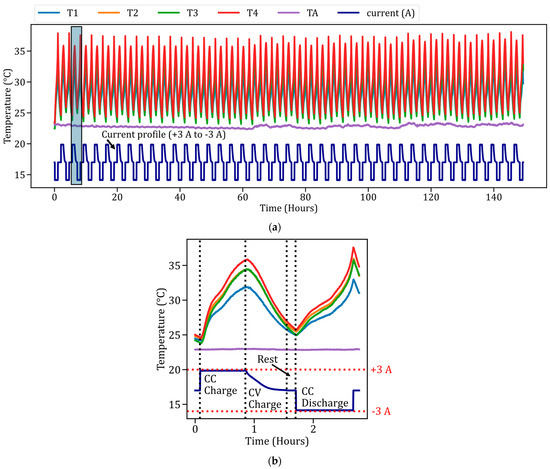
Figure 6.
Surface temperature data for a 4-cell NCA battery pack, with ambient temperature (TA) logged by BMS. (a) Data of 42 cycles performed on the ground. A repeated pattern is observed, with T4 reaching the highest temperature of 38 °C. (b) The third complete cycle performed on the ground. Temperature peaks are observed at the end of the constant current phases for both charging and discharging.
The surface temperature of cell 4 was observed to be comparatively higher than the other three cells in the battery pack, as shown in Figure 6a. This could be due to various factors such as battery aging, changes in the SOC, and other influences [47]. Thermal variation within a cell impacts the overall battery pack, causing different charging or discharging behaviors which can lead to an electrically unbalanced battery pack [48] and variable power capabilities in each cell [49]. The BMS detects and displays the temperature differences in each cell. Early detection of thermal issues in the battery enables timely cell replacement or the implementation of appropriate thermal management strategies, preventing premature failure and extending the overall battery life.
4.4. In-Air Current and Voltage Profile Measurements
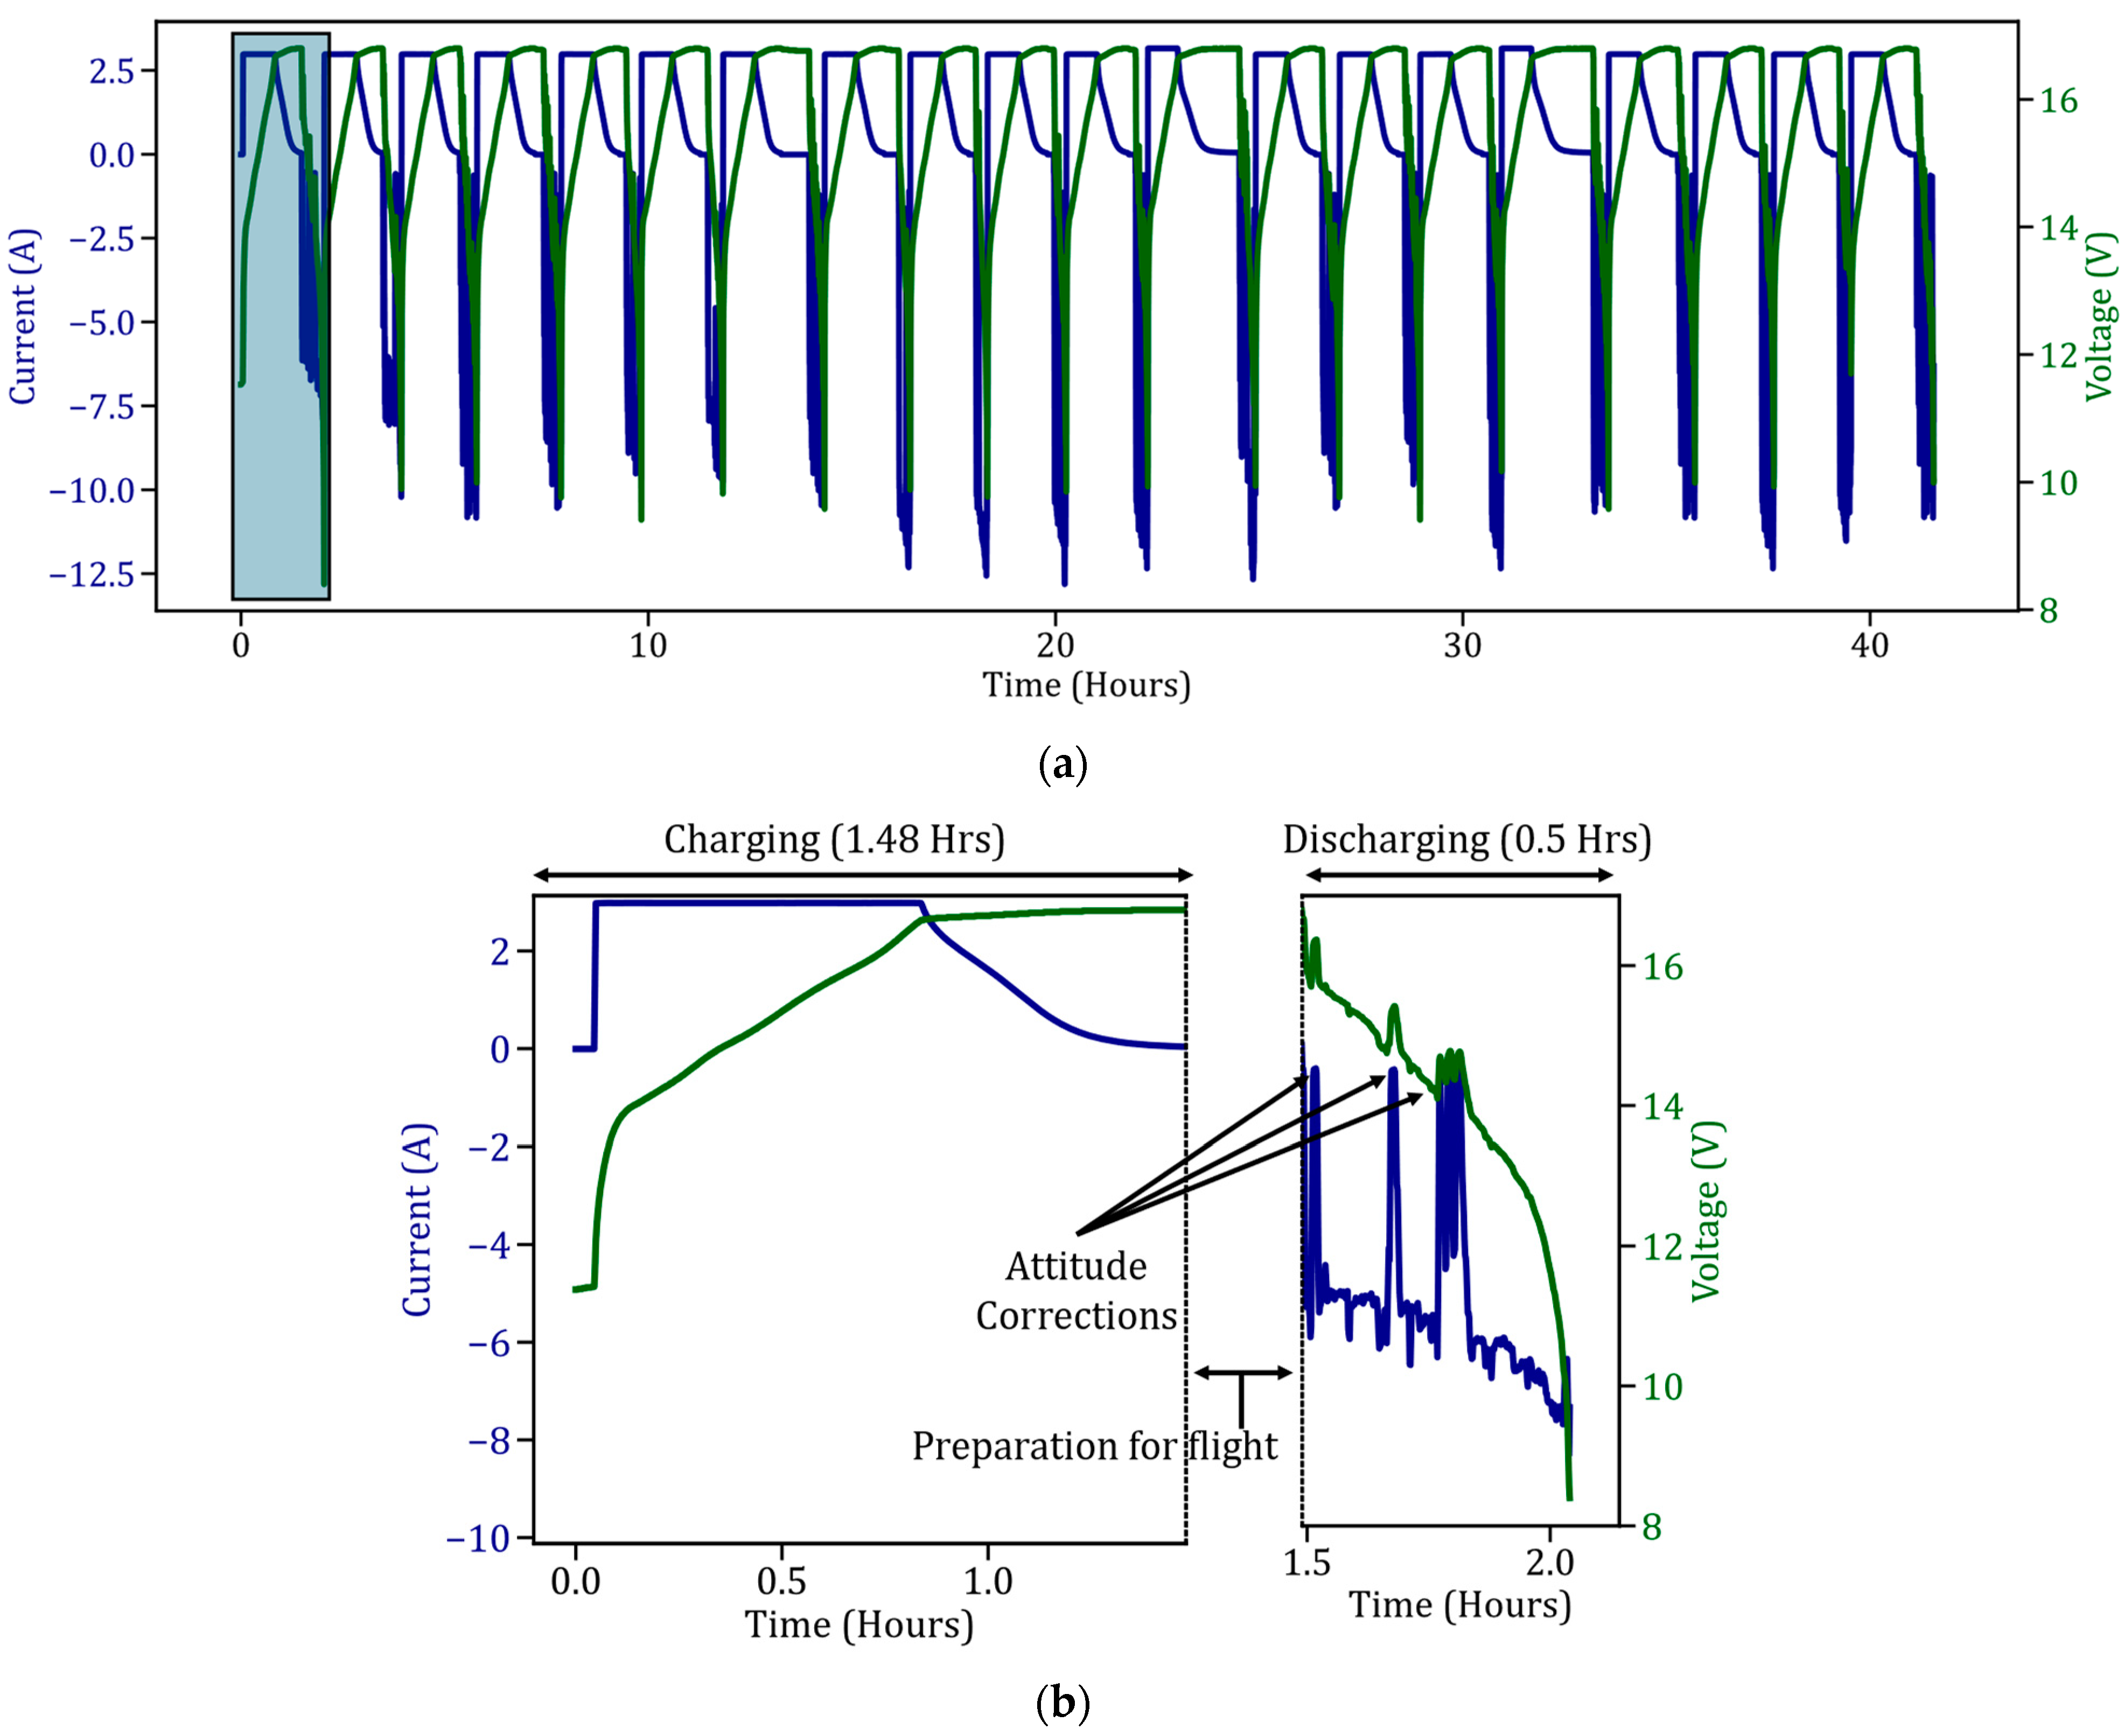
Figure 7 illustrates the current and voltage readings collected by the newly developed BMS during in-air testing. For each in-air cycle, the current drawn by the quadcopter varied randomly based on the power needs of the quadcopter, as shown in Figure 7a. As depicted in Figure 7b, the charging of the LIB was conducted on the ground, similar to the process in Figure 4. Figure 7b represents the first cycle of in-air testing. At the end of the charge, 0.167 ± 0.03 h were required to prepare for the flight, which included integrating the BMS with the quadcopter and setting up the flight station, as shown in Figure 3c.
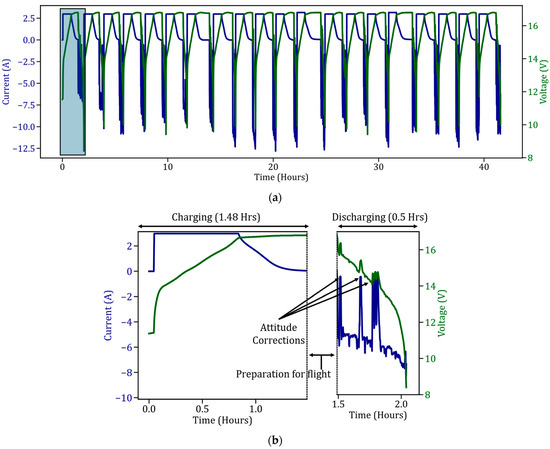
Figure 7.
Current and voltage data collected by BMS during random flight patterns of the drone. (a) The current and voltage over 20 cycles performed by the drone. The battery pack provides variable discharge current necessary for flight. (b) One discharge cycle during flight (the first of 20 cycles). During this cycle, the current discharges at higher C-rates in real-time, while the voltage drops from 16.8 V to 10 V. Note that each discharge cycle lasts less than an hour.
At the beginning of the flight, the current drawn from the battery increased sharply until it reached the required power for the electrically propelled quadcopter, which in this case was approximately −6 A. Once the required power was reached, the current drawn remained relatively consistent, with slight fluctuations during the flight to maintain the quadcopter’s attitude and altitude. At around 0.167 h, the current drawn dropped rapidly to zero due to a temporary cut-off in power to adjust the flight’s attitude. Upon restarting the experiment, the current drawn increased again, reaching 9 A. The spikes in the current profile before the end of the experiment were due to corrections made to the quadcopter’s attitude. The rise in voltage observed during these attitude corrections was considered an outlier in the data.
The current drawn by the quadcopter to maintain attitude and altitude increased over the 20 cycles conducted in-air, as shown in Figure 7a. The discharge current started at a maximum of −10 A for the first experiment and increased over time, reaching the highest discharge current of 13 A by the ninth in-air cycle. For the last 14 cycles, the current drawn from the battery was consistently above 11 A. The current drawn from the batteries during in-air testing occurred at higher C-rates compared to the on-ground experiments, and the BMS could record these high C-rate currents accurately drawn from the batteries, which were higher C-rates than the on-ground experiments. The BMS could record the currents at high C-rates.
4.5. In-Air Temperature Profile Measurements
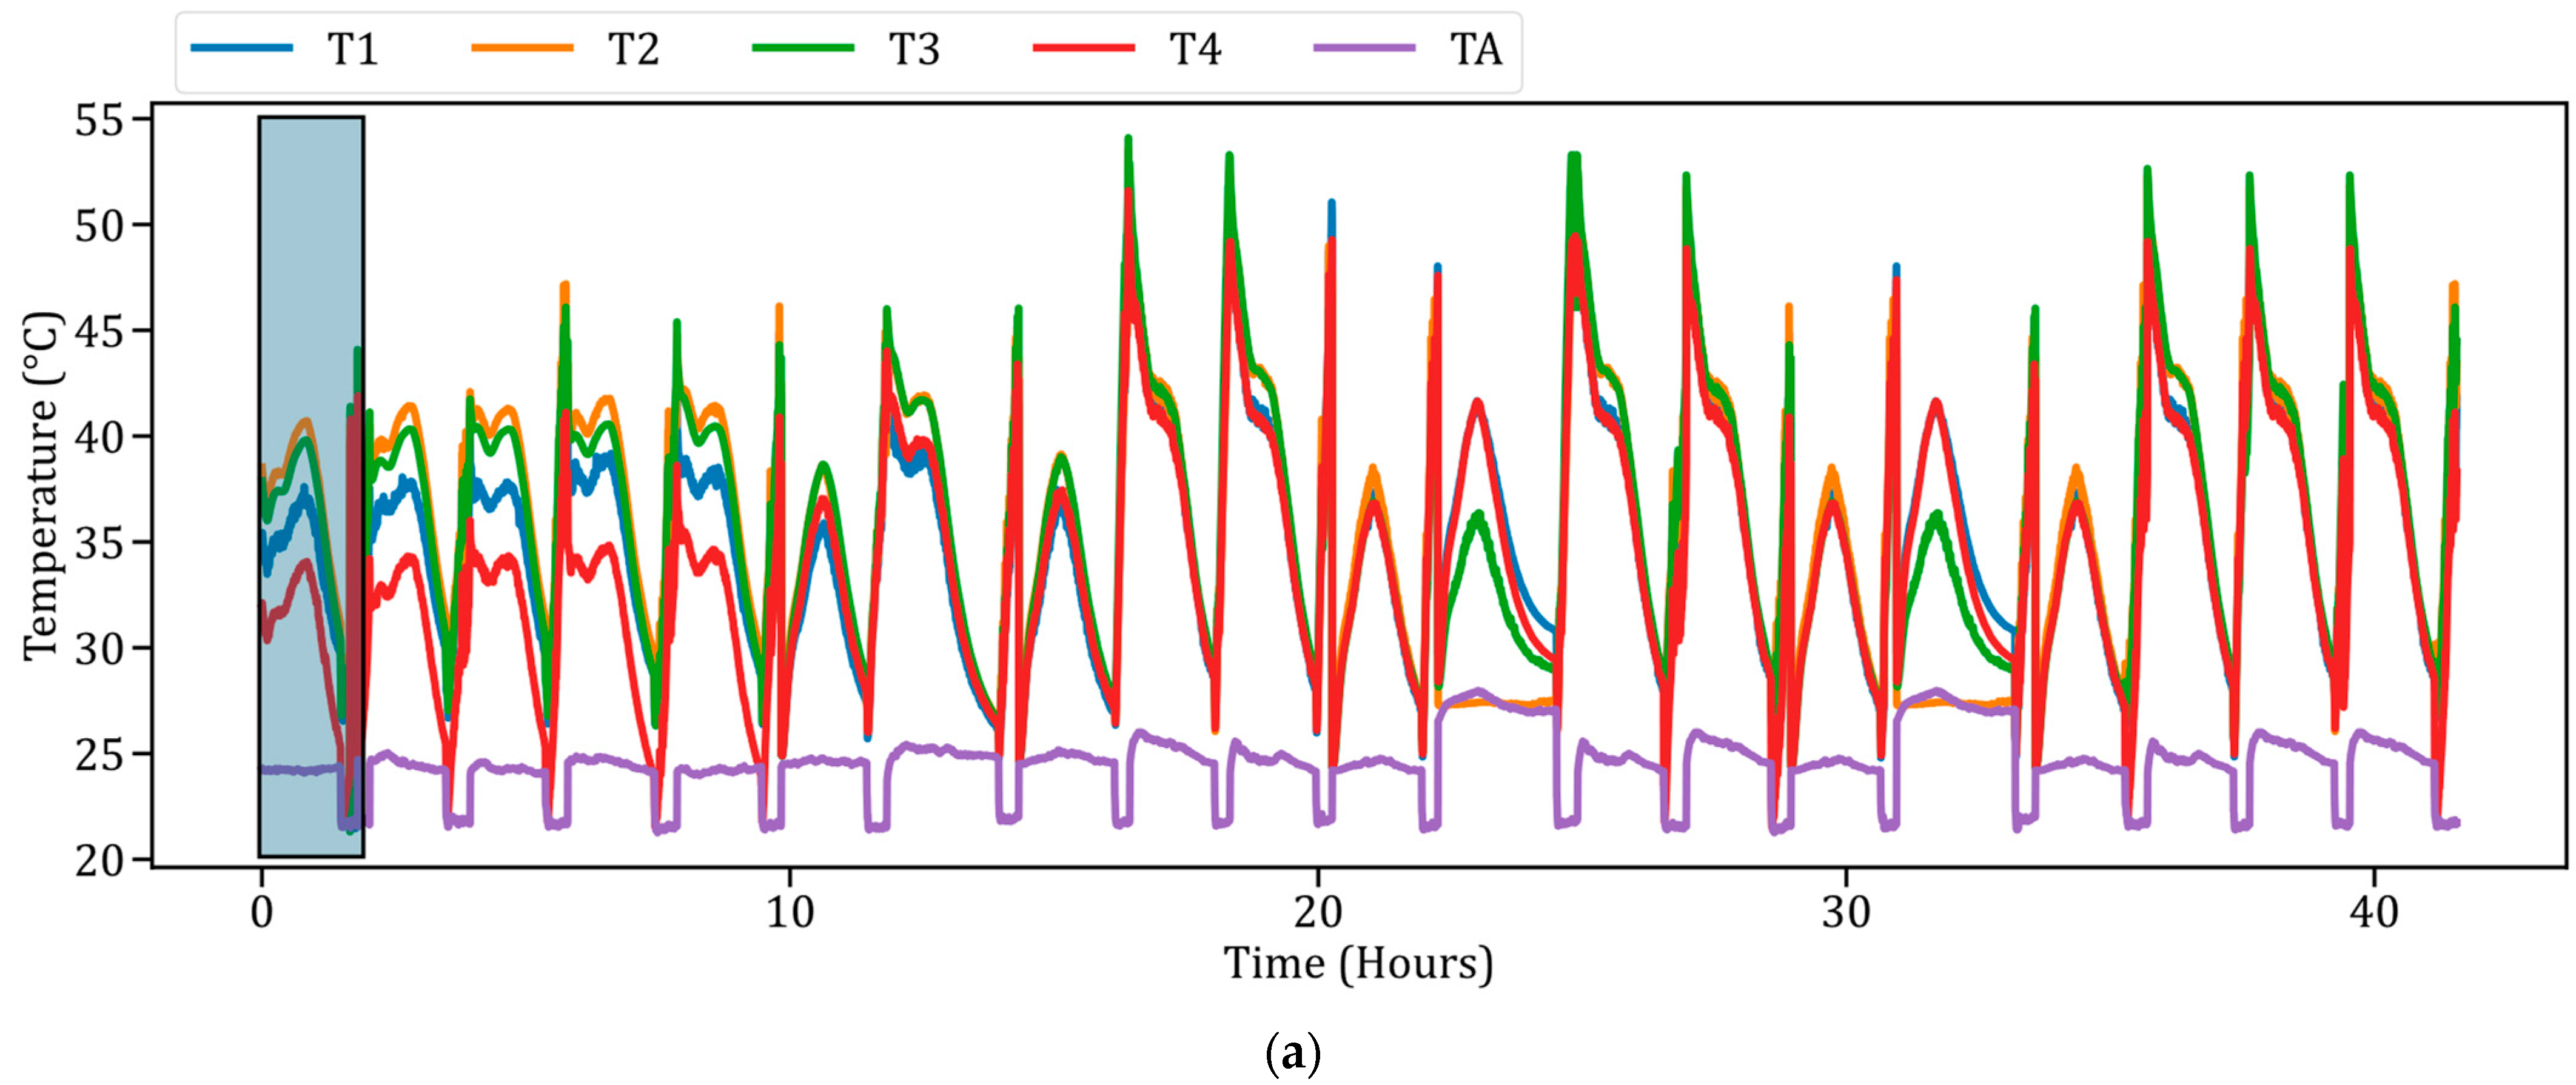
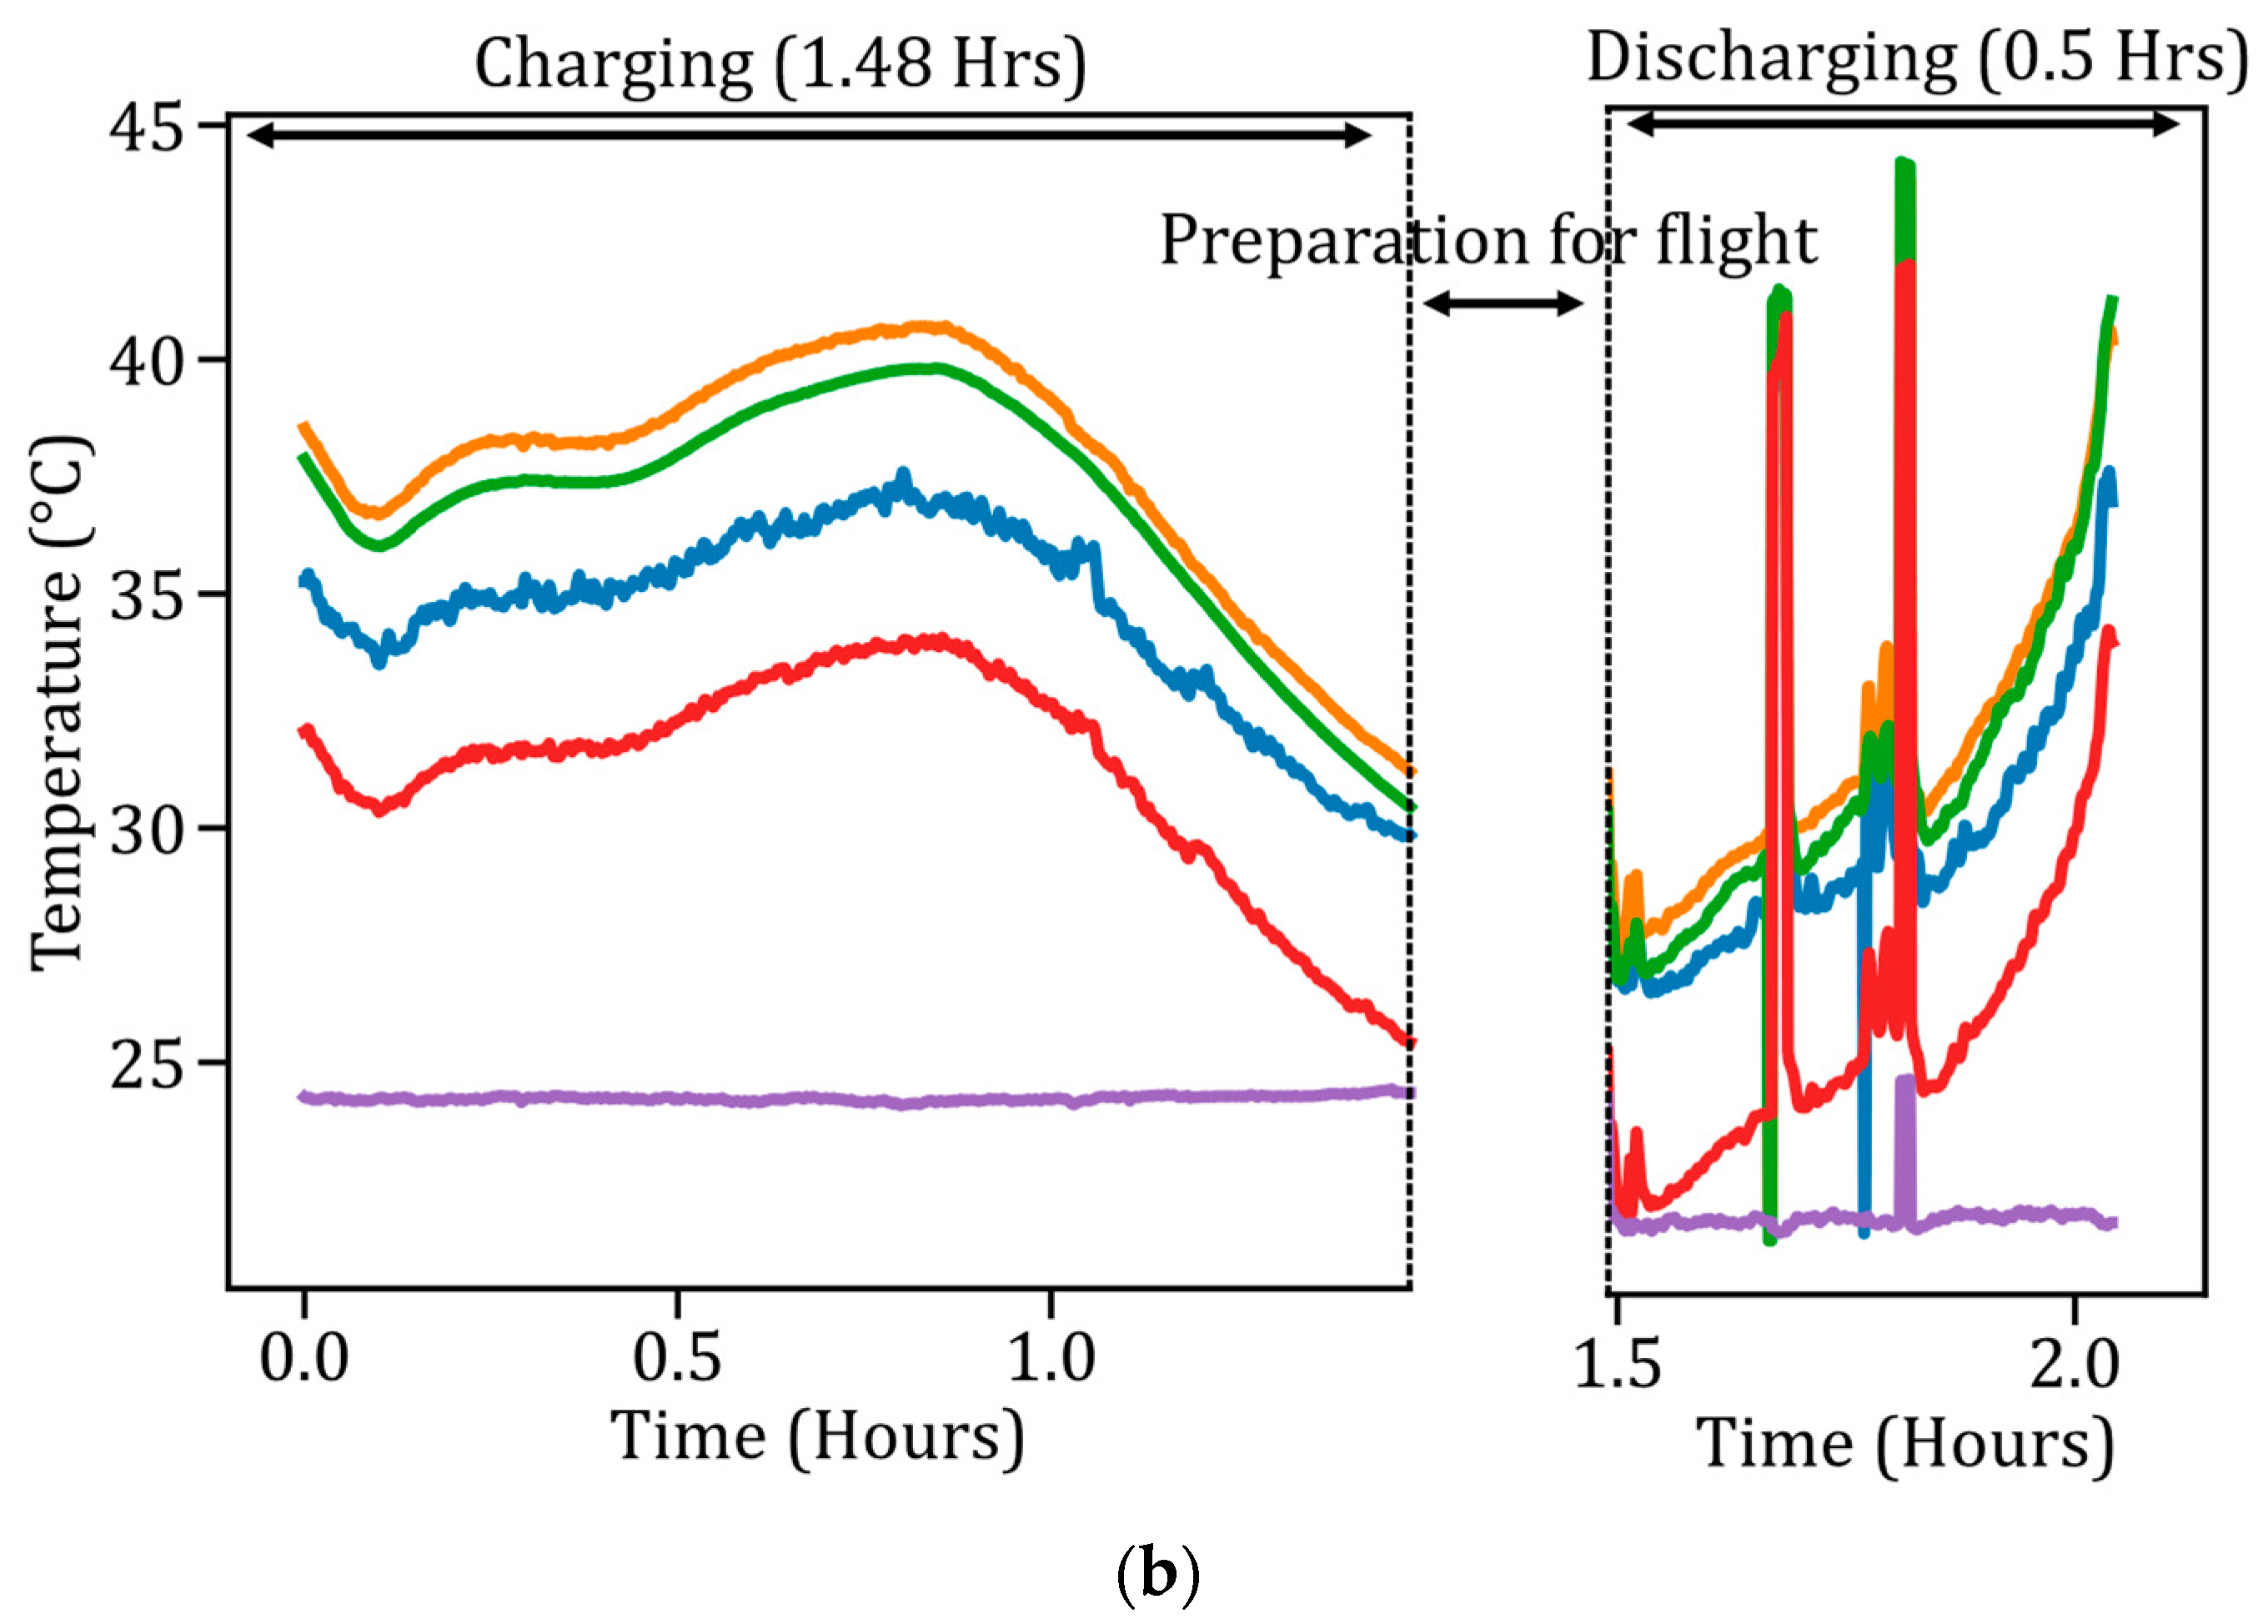
Figure 8 shows the surface temperature of each cell in the battery pack during in-air experiments. Figure 8b specifically displays the temperature of each cell during the first in-air cycle. As the initial cell temperature starts below 40 °C, a reduction in surface temperature is observed during the charging of the LIB. During discharge in the air (Figure 8b), a dip in ambient temperature occurs due to air flowing around the cells. The surface temperature gradually increases during discharge, reaching a peak of around 43 ± 0.3 °C.
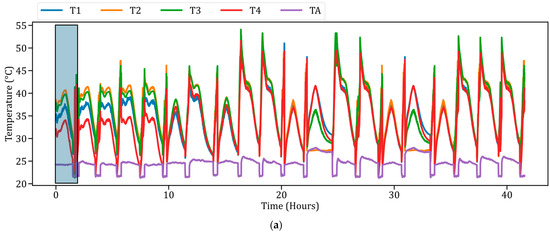
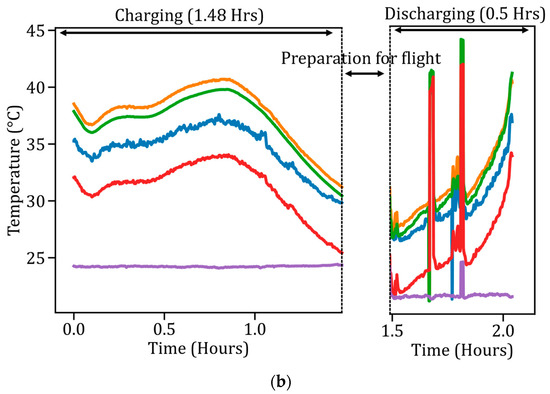
Figure 8.
Surface temperature data collected by BMS during random flight patterns of the drone, incorporating ambient temperature (TA) using a 4-cell LIB pack. (a) A consistent pattern across 20 cycles performed by the drone. TA dips during flight, and each cell exhibits varying temperatures. (b) One discharge cycle while flying. It shows an increase in temperature over time, with the discharge cycle lasting less than an hour.
On the ground, the maximum temperature reached was approximately 39 °C, indicating a 6.5 ± 0.3 °C rise in surface temperature during in-air discharge. This temperature increase is attributed to the high C-rate discharge performed in the air. Sudden spikes in temperature at 0.167 h and after 0.33 h were caused by attitude corrections. T4 in Figure 8a,b showed lower temperatures compared to the other cells, likely due to cell imbalance in the battery pack [29,47].
Compared to the BMS developed by Li et al. [50], the proposed BMS achieves higher C-rates with in-air data, indicating varied temperatures among the cells in the battery pack. As shown in Figure 8a, during the first five cycles, T2 exhibited a higher temperature than the other cells. After the fifth cycle, T3 showed a greater increase in temperature compared to T2. Temperature peaks were first observed in the seventh in-air cycle because the current exceeded a 4C discharge rate for the first time within the 20 cycles. Notably, the highest temperature reached was around 55 °C, which is 16 ± 0.5 °C higher than the peak temperature observed on the ground, and 10 ± 0.5 °C higher than the first in-air cycle. Overall, temperatures observed during in-air experiments were higher than those recorded during on-ground experiments.
4.6. Deep Learning Integration with BMS
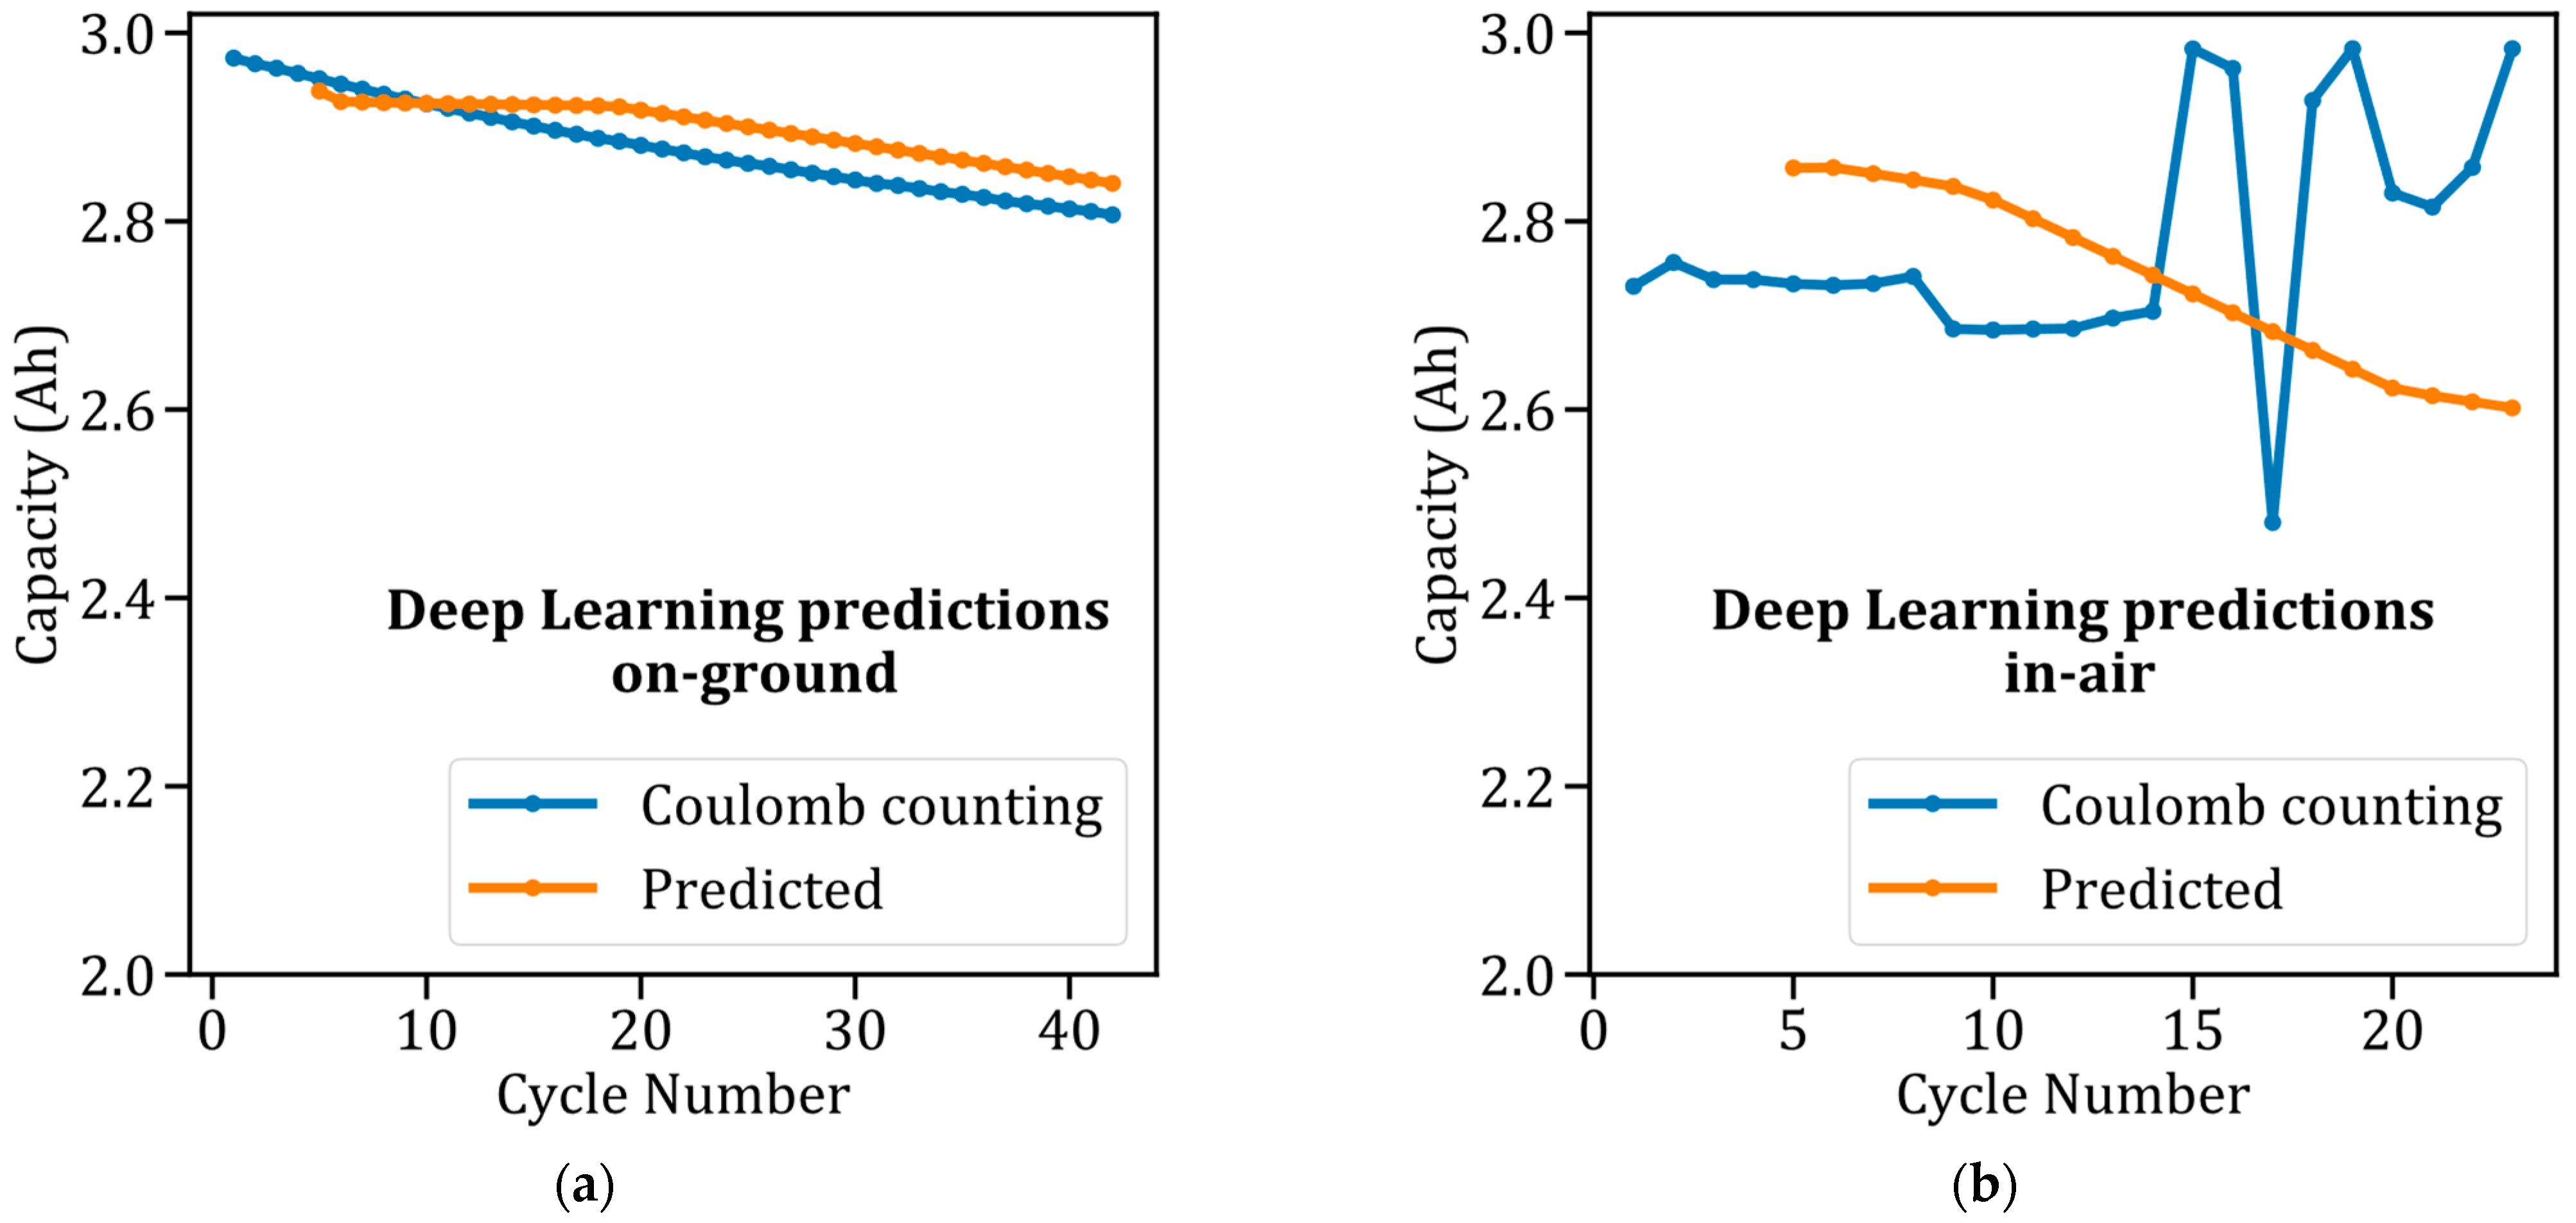
Data collected from BAn and BMS were used to calculate the discharge capacity of the battery over each cycle. Less capacity loss was observed over the 42 cycles conducted on-ground, as seen in Figure 9a. Figure 9a illustrates the maximum discharge capacity noted in each cycle performed on-ground. The blue line represents the capacity calculated using coulomb counting on-ground [38]. In the initial cycle, the battery capacity experienced a rise due to instability in the early cycles of the battery [51]. From the second cycle onward, the battery capacity gradually decreased over the cycles. At the end of the 20th cycle, the capacity of the battery was 2.84 Ah. Building upon Li et al. [50] and Shi et al. [52], the proposed BMS demonstrates the successful integration of CD-Net for real-time battery capacity prediction. Capacity predictions started from the 5th cycle, at 2.92 Ah, whereas the coulomb counting capacity recorded by the BMS for the 5th cycle was 2.95 Ah. The capacity showed a gradual drop over the cycles, with predictions from the model remaining consistent with BMS capacity, exhibiting a difference of around 0.030 Ah at the 20th cycle. This information can be further used to predict the approximate SOH of the battery for that cycle [24]. As observed in Figure 9b, the discharge coulomb counting capacity of the battery during flying tests was more unstable than the on-ground tests. This instability in coulomb counting can be attributed to various factors such as temperature rise, and variable current discharge rates [21] similar variations were noted by Kong et al. [53]. The mean difference between the calculated coulomb counting capacity and the predicted capacity observed in air was 0.046 Ah. Despite fluctuations encountered while collecting the in-air data, due to several factors such as temperature rise and current fluctuations throughout cycling, the CD-Net model was able to predict the upcoming cycle capacity. Predicting upcoming cycle capacity helps in the development of the BMS by establishing a threshold of predicted capacity before the battery reaches its EOL.

Figure 9.
Capacity predictions made by the CD-Net model using data collected from BMS. (a) Predictions based on on-ground experiments. The model demonstrates accurate capacity predictions over multiple cycles. (b) Predictions while flying on a drone. Capacity becomes unstable after 4 cycles, yet the model still provides improved predictions compared to previous methods.
5. Conclusions
In operando data collection from an electrically propelled vehicle needs a portable BMS capable of operating under abusive conditions, such as high C-rate discharge in LIBs. In this study, a novel BMS architecture was proposed to record, transmit, and receive data using edge and cloud frameworks that can handle high C-rate discharges. This BMS architecture builds upon traditional systems by replacing the conventional approach that relies on a CAN bus and an edge computer [54].
Two types of tests have been performed: on-ground tests and in-air or in operando tests. The highest surface temperature, both on-ground and in-air, was observed at the end of the constant current phase of discharge. In-air tests exhibited an increased surface temperature of the battery, including a differential temperature between each cell in the battery pack, with the maximum surface temperature reaching close to 55 °C. This increase may be attributed to factors such as aging, SOC changes, and many more. However, such a significant increase in surface temperature can eventually lead to the failure of that cell or even the entire battery pack. Throughout the 42 cycles performed on-ground and the 20 cycles conducted in-air, the surface temperature increased over the cycles.
Using the collected data, the CD-Net was deployed in operando to predict the SOH of the battery. The model’s capacity prediction for the upcoming cycle was consistent during on-ground testing, with a mean deviation of −0.026 Ah. However, during in-air collection, the predictions exhibited a mean difference of 0.046 Ah, despite fluctuations in capacity measured by the coulomb counting method. Within the threshold range of the current–voltage sensor (±32 A), the BMS was able to perform data collection effectively.
Future works include increasing the volume of data collected to observe the temperature differential and make changes to the battery pack. To make electric propulsion more sustainable, batteries need to be monitored using the latest DL models integrated into BMSs with edge and cloud support.
Author Contributions
J.V.R.V.: Conceptualization, Methodology, Investigation, Data Curation, Visualization, Validation, Formal Analysis, Writing—Original Draft, Writing—Review and Editing; A.S.: Conceptualization, Methodology, Investigation, Visualization, Writing—Original Draft; M.S. (Meghana Sudarshan): Methodology, Investigation, Software, Data Curation, Writing—Review and Editing; M.S. (Mahavir Singh): Methodology, Visualization, Validation, Formal Analysis, Writing—Original Draft, Writing—Review and Editing; V.T.: Conceptualization, Investigation, Visualization, Validation, Formal Analysis, Writing—Review and Editing, Resources, Supervision, Project Administration, Funding Acquisition. All authors have read and agreed to the published version of the manuscript.
Funding
This research was funded by the Office of Naval Research for the financial support grant N00014-22-1-2079 (program manager Corey Love), the School of Aeronautics and Astronautics.
Data Availability Statement
Data will be made available on request.
Conflicts of Interest
The authors declare no conflicts of interest.
References
- Scrosati, B.; Garche, J. Lithium batteries: Status, prospects and future. J. Power Sources 2010, 195, 2419–2430. [Google Scholar] [CrossRef]
- Tarascon, J.M.; Armand, M. Issues and challenges facing rechargeable lithium batteries. Nature 2001, 414, 359–367. [Google Scholar] [CrossRef]
- Xiong, R.; Li, L.; Tian, J. Towards a smarter battery management system: A critical review on battery state of health monitoring methods. J. Power Sources 2018, 405, 18–29. [Google Scholar] [CrossRef]
- Pradhan, S.K.; Chakraborty, B. Battery management strategies: An essential review for battery state of health monitoring techniques. J. Energy Storage 2022, 51, 104427. [Google Scholar] [CrossRef]
- Peng, P.; Jiang, F. Thermal safety of lithium-ion batteries with various cathode materials: A numerical study. Int. J. Heat. Mass. Transf. 2016, 103, 1008–1016. [Google Scholar] [CrossRef]
- Vezzini, A. Lithium-Ion Battery Management. In Lithium-Ion Batteries; Elsevier: Amsterdam, The Netherlands, 2014; pp. 345–360. [Google Scholar]
- Lelie, M.; Braun, T.; Knips, M.; Nordmann, H.; Ringbeck, F.; Zappen, H.; Sauer, D.U. Battery Management System Hardware Concepts: An Overview. Appl. Sci. 2018, 8, 534. [Google Scholar] [CrossRef]
- Hasib, S.A.; Islam, S.; Chakrabortty, R.K.; Ryan, M.J.; Saha, D.K.; Ahamed, M.H.; Moyeen, S.I.; Das, S.K.; Ali, M.F.; Islam, M.R.; et al. A Comprehensive Review of Available Battery Datasets, RUL Prediction Approaches, and Advanced Battery Management. IEEE Access 2021, 9, 86166–86193. [Google Scholar] [CrossRef]
- Kunz, M.R.; Dufek, E.J.; Yi, Z.; Gering, K.L.; Shirk, M.G.; Smith, K.; Chen, B.; Wang, Q.; Gasper, P.; Bewley, R.L.; et al. Early Battery Performance Prediction for Mixed Use Charging Profiles Using Hierarchal Machine Learning. Batter. Supercaps 2021, 4, 1186–1196. [Google Scholar] [CrossRef]
- Huang, Z.; Best, M.; Knowles, J.; Fly, A. Adaptive Piecewise Equivalent Circuit Model with SOC/SOH Estimation Based on Extended Kalman Filter. IEEE Trans. Energy Convers. 2023, 38, 959–970. [Google Scholar] [CrossRef]
- Gasper, P.; Schiek, A.; Smith, K.; Shimonishi, Y.; Yoshida, S. Predicting battery capacity from impedance at varying temperature and state of charge using machine learning. Cell Rep. Phys. Sci. 2022, 3, 101184. [Google Scholar] [CrossRef]
- Smith, K.; Gasper, P.; Colclasure, A.M.; Shimonishi, Y.; Yoshida, S. Lithium-Ion Battery Life Model with Electrode Cracking and Early-Life Break-in Processes. J. Electrochem. Soc. 2021, 168, 100530. [Google Scholar] [CrossRef]
- Raijmakers, L.H.J.; Danilov, D.L.; Eichel, R.A.; Notten, P.H.L. A review on various temperature-indication methods for Li-ion batteries. Appl. Energy 2019, 240, 918–945. [Google Scholar] [CrossRef]
- Rao, Z.; Lyu, P.; Du, P.; He, D.; Huo, Y.; Liu, C. Thermal safety and thermal management of batteries. Battery Energy 2022, 1, 20210019. [Google Scholar] [CrossRef]
- Tran, M.K.; Panchal, S.; Khang, T.D.; Panchal, K.; Fraser, R.; Fowler, M. Concept Review of a Cloud-Based Smart Battery Management System for Lithium-Ion Batteries: Feasibility, Logistics, and Functionality. Batteries 2022, 8, 19. [Google Scholar] [CrossRef]
- Li, B.; Jones, C.M.; Tomar, V. Overdischarge Detection and Prevention with Temperature Monitoring of Li-Ion Batteries and Linear Regression-Based Machine Learning. J. Electrochem. Energy Convers. Storage 2021, 18, 040905. [Google Scholar] [CrossRef]
- Jones, C.; Sudarshan, M.; Tomar, V. Predicting the discharge capacity of a lithium-ion battery after nail puncture using a Gaussian process regression with incremental capacity analysis. Energy 2023, 285, 129364. [Google Scholar] [CrossRef]
- Jia, J.; Liang, J.; Shi, Y.; Wen, J.; Pang, X.; Zeng, J. SOH and RUL Prediction of Lithium-Ion Batteries Based on Gaussian Process Regression with Indirect Health Indicators. Energies 2020, 13, 375. [Google Scholar] [CrossRef]
- Nizam, M.; Maghfiroh, H.; Rosadi, R.A.; Kusumaputri, K.D.U. Battery management system design (BMS) for lithium ion batteries. In AIP Conference Proceedings; AIP Publishing: Melville, NY, USA, 2020; p. 030157. [Google Scholar]
- Patil, M.A.; Tagade, P.; Hariharan, K.S.; Kolake, S.M.; Song, T.; Yeo, T.; Doo, S. A novel multistage Support Vector Machine based approach for Li ion battery remaining useful life estimation. Appl. Energy 2015, 159, 285–297. [Google Scholar] [CrossRef]
- Wang, S.; Jin, S.; Deng, D.; Fernandez, C. A Critical Review of Online Battery Remaining Useful Lifetime Prediction Methods. Front. Mech. Eng. 2021, 7, 719718. [Google Scholar] [CrossRef]
- Shen, S.; Sadoughi, M.; Li, M.; Wang, Z.; Hu, C. Deep convolutional neural networks with ensemble learning and transfer learning for capacity estimation of lithium-ion batteries. Appl. Energy 2020, 260, 114296. [Google Scholar] [CrossRef]
- Tian, J.; Xiong, R.; Shen, W.; Lu, J.; Sun, F. Flexible battery state of health and state of charge estimation using partial charging data and deep learning. Energy Storage Mater. 2022, 51, 372–381. [Google Scholar] [CrossRef]
- Sudarshan, M.; Serov, A.; Jones, C.; Ayalasomayajula, S.M.; García, R.E.; Tomar, V. Data-driven autoencoder neural network for onboard BMS Lithium-ion battery degradation prediction. J. Energy Storage 2024, 82, 110575. [Google Scholar] [CrossRef]
- Saxena, S.; Xing, Y.; Kwon, D.; Pecht, M. Accelerated degradation model for C-rate loading of lithium-ion batteries. Int. J. Electr. Power Energy Syst. 2019, 107, 438–445. [Google Scholar] [CrossRef]
- Sripad, S.; Bills, A.; Viswanathan, V. A review of safety considerations for batteries in aircraft with electric propulsion. MRS Bull. 2021, 46, 435–442. [Google Scholar] [CrossRef]
- Li, M.; Feng, M.; Luo, D.; Chen, Z. Fast Charging Li-Ion Batteries for a New Era of Electric Vehicles. Cell Rep. Phys. Sci. 2020, 1, 100212. [Google Scholar] [CrossRef]
- Tomaszewska, A.; Chu, Z.; Feng, X.; O’Kane, S.; Liu, X.; Chen, J.; Ji, C.; Endler, E.; Li, R.; Liu, L.; et al. Lithium-ion battery fast charging: A review. eTransportation 2019, 1, 100011. [Google Scholar] [CrossRef]
- Ouyang, D.; Chen, M.; Liu, J.; Wei, R.; Weng, J.; Wang, J. Investigation of a commercial lithium-ion battery under overcharge/over-discharge failure conditions. RSC Adv. 2018, 8, 33414–33424. [Google Scholar] [CrossRef] [PubMed]
- Selvabharathi, D.; Muruganantham, N. Experimental analysis on battery based health monitoring system for electric vehicle. Mater. Today Proc. 2021, 45, 1552–1558. [Google Scholar] [CrossRef]
- Jinasena, A.; Spitthoff, L.; Wahl, M.S.; Lamb, J.J.; Shearing, P.R.; Strømman, A.H.; Burheim, O.S. Online Internal Temperature Sensors in Lithium-Ion Batteries: State-of-the-Art and Future Trends. Front. Chem. Eng. 2022, 4, 804704. [Google Scholar] [CrossRef]
- Maroșan, A.; Constantin, G.; Gîrjob, C.E.; Chicea, A.L.; Crenganis, M. Real Time Data Acquisition of Low-Cost Current Sensors Acs712-05 and Ina219 Using Raspberry Pi, Daqcplate and Node-Red. Proc. Manuf. Syst. 2023, 18, 51–59. [Google Scholar]
- Setiawan, B.J. Design and Build Voltage and Current Monitoring Parameters Device of Rechargeable Batteries in Real-Time Using the INA219 GY-219 Sensor. J. Energy Mater. Instrum. Technol. 2023, 4, 58–71. [Google Scholar] [CrossRef]
- Li, B.; Jones, C.M.; Adams, T.E.; Tomar, V. Sensor based in-operando lithium-ion battery monitoring in dynamic service environment. J. Power Sources 2021, 486, 229349. [Google Scholar] [CrossRef]
- Anjali, R.; Deepak, Y. Evaluating Wiring Configurations for RTD Sensor in Temperature Measurement. I-Manager’s J. Electron. Eng. 2019, 10, 1. [Google Scholar] [CrossRef]
- Sarkar, S. Platinum RTD sensor based multi-channel high-precision temperature measurement system for temperature range −100 °C to +100 °C using single quartic function. Cogent Eng. 2018, 5, 1558687. [Google Scholar] [CrossRef]
- Gridling, G.; Weiss, B. Introduction to Microcontrollers; Vienna University of Technology Institute of Computer Engineering Embedded Computing Systems Group: Vienna, Austria, 2007. [Google Scholar]
- Movassagh, K.; Raihan, A.; Balasingam, B.; Pattipati, K. A Critical Look at Coulomb Counting Approach for State of Charge Estimation in Batteries. Energies 2021, 14, 4074. [Google Scholar] [CrossRef]
- Duh, Y.S.; Sun, Y.; Lin, X.; Zheng, J.; Wang, M.; Wang, Y.; Lin, X.; Jiang, X.; Zheng, Z.; Zheng, S.; et al. Characterization on thermal runaway of commercial 18650 lithium-ion batteries used in electric vehicles: A review. J. Energy Storage 2021, 41, 102888. [Google Scholar] [CrossRef]
- Cameron, Z.; Kulkarni, C.S.; Luna, A.G.; Goebel, K.; Poll, S. A battery certification testbed for small satellite missions. In Proceedings of the 2015 IEEE AUTOTESTCON, National Harbor, MD, USA, 2–5 November 2015; pp. 162–168. [Google Scholar]
- Perreault, M.; Behdinan, K. Delivery Drone Driving Cycle. IEEE Trans. Veh. Technol. 2021, 70, 1146–1156. [Google Scholar] [CrossRef]
- Chin, K.B.; Brandon, E.J.; Bugga, R.V.; Smart, M.C.; Jones, S.C.; Krause, F.C.; West, W.C.; Bolotin, G.G. Energy Storage Technologies for Small Satellite Applications. Proc. IEEE 2018, 106, 419–428. [Google Scholar] [CrossRef]
- Huang, D.; Becerra, V.; Ma, H.; Simandjuntak, S.; Fraess-Ehrfeld, A. An Intelligent BMS for Drone-Based Inspection of Offshore Wind Turbines. In Proceedings of the 2022 International Conference on Unmanned Aircraft Systems (ICUAS), Dubrovnik, Croatia, 21–24 June 2022; pp. 1210–1218. [Google Scholar]
- Ruan, H.; He, H.; Wei, Z.; Quan, Z.; Li, Y. State of Health Estimation of Lithium-Ion Battery Based on Constant-Voltage Charging Reconstruction. IEEE J. Emerg. Sel. Top. Power Electron. 2023, 11, 4393–4402. [Google Scholar] [CrossRef]
- Fleischer, C.; Sauer, D.U.; Barreras, J.V.; Schaltz, E.; Christensen, A.E. Development of software and strategies for Battery Management System testing on HIL simulator. In Proceedings of the 2016 Eleventh International Conference on Ecological Vehicles and Renewable Energies (EVER), Monte Carlo, Monaco, 6–8 April 2016. pp. 1–12.
- Chen, Y.S.; Hu, C.C.; Li, Y.Y. The importance of heat evolution during the overcharge process and the protection mechanism of electrolyte additives for prismatic lithium ion batteries. J. Power Sources 2008, 181, 69–73. [Google Scholar] [CrossRef]
- Spitthoff, L.; Shearing, P.R.; Burheim, O.S. Temperature, Ageing and Thermal Management of Lithium-Ion Batteries. Energies 2021, 14, 1248. [Google Scholar] [CrossRef]
- Pesaran, A.A. Battery Thermal Management in EVs and HEVs: Issues and Solutions. Battery Man 2001, 43, 34–49. [Google Scholar]
- Alipour, M.; Ziebert, C.; Conte, F.V.; Kizilel, R. A Review on Temperature-Dependent Electrochemical Properties, Aging, and Performance of Lithium-Ion Cells. Batteries 2020, 6, 35. [Google Scholar] [CrossRef]
- Li, W.; Rentemeister, M.; Badeda, J.; Jöst, D.; Schulte, D.; Sauer, D.U. Digital twin for battery systems: Cloud battery management system with online state-of-charge and state-of-health estimation. J. Energy Storage 2020, 30, 101557. [Google Scholar] [CrossRef]
- Johnson, C.S.; Li, N.; Lefief, C.; Thackeray, M.M. Anomalous capacity and cycling stability of xLi2MnO3·(1−x)LiMO2 electrodes (M = Mn, Ni, Co) in lithium batteries at 50 °C. Electrochem. Commun. 2007, 9, 787–795. [Google Scholar] [CrossRef]
- Shi, D.; Zhao, J.; Eze, C.; Wang, Z.; Wang, J.; Lian, Y.; Burke, A.F. Cloud-Based Artificial Intelligence Framework for Battery Management System. Energies 2023, 16, 4403. [Google Scholar] [CrossRef]
- Ng, K.S.; Moo, C.S.; Chen, Y.P.; Hsieh, Y.C. Enhanced coulomb counting method for estimating state-of-charge and state-of-health of lithium-ion batteries. Appl. Energy 2009, 86, 1506–1511. [Google Scholar] [CrossRef]
- Krishna, T.N.V.; Kumar, S.V.S.V.P.D.; Srinivasa Rao, S.; Chang, L. Powering the Future: Advanced Battery Management Systems (BMS) for Electric Vehicles. Energies 2024, 17, 3360. [Google Scholar] [CrossRef]

Disclaimer/Publisher’s Note: The statements, opinions and data contained in all publications are solely those of the individual author(s) and contributor(s) and not of MDPI and/or the editor(s). MDPI and/or the editor(s) disclaim responsibility for any injury to people or property resulting from any ideas, methods, instructions or products referred to in the content. |
© 2024 by the authors. Licensee MDPI, Basel, Switzerland. This article is an open access article distributed under the terms and conditions of the Creative Commons Attribution (CC BY) license (https://creativecommons.org/licenses/by/4.0/).