Article

Impact of Laser Ablation Strategies on Electrochemical Performances of 3D Batteries Containing Aqueous Acid Processed Li(Ni0.6Mn0.2Co0.2)O2 Cathodes with High Mass Loading

Institute for Applied Materials-Applied Materials Physics (IAM-AWP), Karlsruhe Institute of Technology (KIT), Hermann-von-Helmholtz-Platz 1, 76344 Eggenstein-Leopoldshafen, Germany
*
Author to whom correspondence should be addressed.
Batteries 2024, 10(10), 354; https://doi.org/10.3390/batteries10100354
Submission received: 29 August 2024 / Revised: 30 September 2024 / Accepted: 9 October 2024 / Published: 10 October 2024

Abstract

:
Lithium-ion batteries are currently one of the most important energy storage devices for various applications. However, it remains a great challenge to achieve both high energy density and high-power density while reducing the production costs. Cells with three-dimensional electrodes realized by laser ablation are proven to have enhanced electrochemical performance compared to those with conventional two-dimensional electrodes, especially at fast charging/discharging. Nevertheless, laser structuring of electrodes is still limited in terms of achievable processing speed, and the upscaling of the laser structuring process is of great importance to gain a high technology readiness level. In the presented research, the impact of different laser structuring strategies on the electro-chemical performance was investigated on aqueous processed Li(Ni0.6Mn0.2Co0.2)O2 cathodes with acid addition during the slurry mixing process. Rate capability analyses of cells with laser structured aqueous processed electrodes exhibited enhanced performance with capacity increases of up to 60 mAh/g at high current density, while a 65% decrease in ionic resistance was observed for cells with laser structured electrodes. In addition, pouch cells with laser structured acid-added electrodes maintained 29–38% higher cell capacity after 500 cycles and their end-of-life was extended by a factor of about 4 in contrast to the reference cells with two-dimensional electrodes containing common organic solvent processed polyvinylidene fluoride binder.

Graphical Abstract

1. Introduction

Lithium-ion batteries (LIBs) have been widely used for battery electric vehicles (BEV) due to their higher energy and power density in comparison to other battery-types such as lead-acid or sodium-/potassium-ion [1,2]. However, major issues, such as range anxiety, high purchase costs, and insufficient charging infrastructures, are so far limiting the market penetration of BEV [3,4]. Thus, the development of high power and high energy batteries at reduced production costs is becoming more significant for the battery industry [5].
Battery cells with high power density can be obtained by using thin-film electrodes, while cells with high energy density can be achieved by employing thick-film electrodes with thicknesses greater than 100 µm, which can lower the cost by 60% at battery level, since the share of inactive components is reduced [6]. Numerical modeling showed that, with increasing cathode thicknesses from 60 to over 200 µm, the energy density at cell level increased at C/5. However, it dropped rapidly at C-rates higher than 1C once a critical thickness was reached [7,8]. The capacity fade is mainly due to accumulated cell polarization and local material degradation, which result in an increase of charge transfer resistance [8,9].
In contrast to the state-of-the-art cathode production using N-methl-2-pyrrolidone (NMP) as organic solvent, aqueous slurry preparation has great potential due to its low material cost, reduced drying time, and safe production, while reducing the environmental impact and eliminating the need for expensive organic solvent recycling [6,10]. For instance, the drying of water-based electrodes is 4.5 times faster compared to NMP-based electrodes, and the total energy required for processing is reduced by almost a factor of 10 [11]. Besides, the life-cycle CO2 emissions for the production of a battery pack with 10 kWh can be reduced by 23% by substituting NMP-based processing with aqueous processing [12]. However, the cracking of electrodes during drying was reported due to the higher surface tension of water compared to NMP [13]. Furthermore, a drawback of aqueous processing is the reactivity of active materials upon contact with water, which leads to phase transitions at the surface of the active materials [14], as well as the formation of a reaction layer consisting of Li2CO3 and LiOH, with a thickness of about 10 nm, at the surface of the active material within a few minutes [15,16]. Another aspect is the slurry pH increase due to the Li leaching [17], which leads to the chemical corrosion of the aluminum (Al) current collector along with hydrogen gas formation during the slurry coating process [18,19]. One practical solution is pH adjustment during the slurry mixing process. Formic acid [20], acetic acid [21], phosphoric acid (PA) [20], Li-polyacrylate (LiPAA) [21], and Li2SO4 [22] were reported as pH modifiers for cathode slurries. Some studies have shown that the addition of PA in slurries containing different Li(NixMnyCo1–x–y)O2 (NMC) materials led to a significant enhancement in electrochemical performance [23,24,25,26,27]. Thus, on the one hand, PA can adjust the slurry pH value and prevents chemical corrosion between the slurry and the Al current collector; on the other hand, it can also stabilize the interphase of NMC particles in contact with water, which is due to the formation of a protective phosphate layer, as confirmed for Li(Ni1/3Mn1/3Co1/3)O2 (NMC 111) [20] and Li(Ni0.6Mn0.2Co0.2)O2 (NMC 622) [25,28].
Three-dimensional (3D) electrode architectures with different patterns were generated in electrodes having various types of active materials. Line structures ablated in electrodes by using laser ablation can accelerate the wettability of electrodes with liquid electrolyte [29,30,31]. Furthermore, they enhance the electrochemical performance, such as rate capability, at C-rates higher than 1C and battery lifetime for cells containing, LiCoO2 [32], NMC 622 [28,33,34], Li(Ni0.8Mn0.1Co0.1)O2 NMC 811 [35], and graphite [36,37] or anodes containing silicon mixed with graphite [36,38]. In addition, hole structures have also been applied for the structuring of LFP [39] cathode and graphite anodes [40,41,42,43]. Furthermore, our recent studies found that, for cells containing graphite anodes and NMC 622 cathodes, despite the same mass loss, electrodes with line-based patterns, such as line, grid, and hexagonal line pattern exhibited higher rate capability and reduced lithium plating compared to those with hole patterns [44,45], which is due to the capillary structures which accelerate and homogenize wetting of electrodes with liquid electrolyte during cell assembly and enable continuous re-wetting of electrodes during cell operation [29].
However, the processing speed of laser structuring still does not match the coating speed of production lines in the battery industry and thus the upscaling of the laser structuring process is of high importance. In recent studies, different approaches have been reported to upscale the laser structuring process, such as increasing the laser power (or laser fluence) [46], applying polygon scan units [47], using roll-to-roll processing with hollow cylinders [48], or using diffractive optical elements (DOEs) to split the laser beam into multiple beamlets gaining a higher ablation efficiency [43]. In a first approach, simply increasing the laser fluence results in a higher ablation rate, so that fewer laser scans are required to obtain the same structure depths. In other words, the laser processing time is reduced. However, there is still a lack of in-depth research investigating the effect of increasing laser fluence on the electrochemical performance of the electrodes.
In the present work, aqueous processed thick-film NMC 622 cathodes with phosphoric acid addition during slurry mixing were prepared, which represent environmentally friendly and cost-effective cathode manufacturing. Meanwhile, NMC 622 cathodes with PVDF as binder were prepared to represent electrodes manufactured with state-of-the-art technology. Subsequently, with respect to the upscaling of the laser structuring process, we varied average laser power and laser scan strategy and analyzed their impact on the morphological properties and electrochemical performance of aqueous processed NMC 622 cathodes. The resulting active mass losses were kept similar by applying different laser scan strategies. Afterwards, the laser structured NMC 622 cathodes were assembled in coin cells (half-cells) vs. Li and in pouch cells (full-cells) vs. structured graphite anodes. Rate capability and lifetime analyses were performed, while electrochemical impedance spectroscopy (EIS) was applied to investigate the tortuosity and the ionic resistance of NMC 622 cathodes using symmetrical cells and the charge transfer resistance increase of pouch cells during lifetime analyses.

2. Materials and Methods

2.1. Electrode Preparation

Commercially available polycrystalline NMC 622 powder (BASF SE, Ludwigshafen, Germany) with a median particle size of 8.7 µm was used as active material for the cathode slurry preparation, while C-NERGY Super C65 (Imerys G and C, Willebroek, Belgium) and KS6L graphite (Imerys G and C, Bodio, Switzerland) were applied as conductive agent and compaction aid. Solef 5130 PVDF powder (Solvay Specialty Polymers, Brussel, Belgium) was dissolved in NMP solvent (Merck KGaA, Darmstadt, Germany) with a weight ratio of 1:10 prior to the mixing process, while 5 wt% Na-carboxymethyl cellulose (Na-CMC, CRT 2000PA, Doe Wollf Cellulosic, Bomlitz, Germany) solution was prepared for the aqueous slurry.
For aqueous cathode slurry processing, NMC 622 powder was mixed with Super C65 carbon black and was added into the Na-CMC solution using a lab-scale dissolver (VMA-Getzmann, Reichshof, Germany) at a rotation speed of 2000 rpm for 20 min. Subsequently, phosphoric acid (Merck KGaA, Darmstadt, Germany) was added into the slurry. The slurry pH value was adjusted to 9.2, since no obvious chemical corrosion between the slurry and the Al current collector was observed in the pH range of 9–10 [49]. Afterwards, the slurries were homogenized under atmospheric pressure at 2000 rpm for 90 min, and the container was water-cooled to 20 °C persistently. Finally, shear sensitive latex binder TRD 202A (JSR Micro NV, Leuven, Belgium) was added into the slurry and the slurry was further mixed using 500 rpm for 3 min under vacuum. The mass ratio of each component was set to NMC 622: carbon black: Na-CMC: TRD 202A = 92.6:2.8:1.8:2.8. The solid content of aqueous NMC 622 slurry was 57 wt%. For the NMP-based cathode slurry, NMC 622 powder, Super C65, and KS6L graphite were mixed together and added into PVDF solution with a mass ratio of 92:3:2:3 (NMC 622:Super C65:KS6L:PVDF). The slurry was dispersed using a centrifugal mixer (SpeedMixer DAC 150 SP, Hauschild and Co., Hamm, Germany) at 1000 to 3000 rpm for 1.5 h. The solid content of the NMP-based NMC 622 slurry was adjusted to 67%.
As for the anode slurry preparation, synthetic graphite powder SPGPT808 (Targray, Kirkland, QC, Canada) with a median diameter of 4.9 µm and Super C65 (MTI Corporation, Richmond, CA, USA) were used as active material and conductive agent, respectively. The graphite and conductive agent were added into the Na-CMC solution and dispersed using a lab-scale dissolver (VD-10 XP, DISTECH, Kirchen, Germany) at 2500 rpm for 1.5 h. Subsequently, shear-sensitive styrene-butadiene rubber (SBR, MTI Corporation, Richmond, CA, USA) was added at 500 rpm and mixed for 3 min. The mass ratio of each component of the anode slurry was set to graphite: conductive agent: Na-CMC:SBR = 93:1.3:1.87:3.73, while the solid content was adjusted to 43 wt%.
All slurries were tape-cast with a doctor blade ZUA 2000.100 (Proceq, Schwerzenbach, Switzerland) onto a current collector (Al foil with a thickness of 20 µm for the cathode and copper (Cu) with a thickness of 9 µm for the anode), which was fixed on a laboratory coater MSK-AFA-L800-LD (MTI Corporation, Richmond, CA, USA) equipped with a vacuum table. A coating speed of 5 mm/s was applied, while the film thickness was adjusted by varying the gap of the doctor blade. After casting, all aqueous slurries were dried at room temperature (20 °C), while the NMC 622 cathode slurry with PVDF binder was dried at an elevated temperature of 75 °C for 2.5 h. After drying, the cathodes and anodes were calendared using an electric calendaring machine MSK-2150 (MTI Corporation, Richmond, CA, USA) at room temperature with a constant feeding speed of 35 mm/s. The average porosities of cathodes and anodes were adjusted to 35% and 40%, respectively, which were determined by the weight percentage and density of each component [33].

2.2. Laser Structuring Process

A pulsed fiber laser (Tangerine, Amplitude Systèmes, Pessac, France) operating at a wavelength of 515 nm with a maximal average laser power of 12 W and a pulse duration of 380 fs was used for the structuring and cutting of NMC 622 cathodes. In order to investigate the impact of the laser fluence (or average laser power) on cell performance, two strategies were adopted. The first strategy was to apply a laser power of 5.0 W, while the second strategy was to adjust the channel width by using multiple scans with an offset, keeping the average laser power at 2.5 W, as illustrated in Figure 1. By adjusting the offset distance, the mass loss of the laser structured electrodes can be kept at a similar value compared to the electrodes structured at various laser powers.
The laser parameters for the structuring of NMC 622 cathodes and graphite anodes are listed in Table 1. Line structures with 200 µm pitch (the distance between adjacent groove structures) were generated in NMC 622 thick-film electrodes, since our previous study revealed that the rate capability was enhanced with decreasing pitch from 600 to 200 µm [33]. For the laser structuring of graphite anodes, a pulsed slab laser (FX600, Edgewave, Würselen, Germany) operating at a wavelength of 1030 nm and a pulse duration of 600 fs implemented in a laser micromachining system (MSV203, M-Solv Ltd., Oxford, UK) was used. The laser line energy shown in Table 1 is the ratio of average laser power and scanning speed. In addition, the line pitch for graphite anodes was adjusted to 350 µm in order to achieve a similar N/P ratio (the areal capacity of anode divided by that of cathode) in pouch cells containing different types of cathodes and anodes.

2.3. Cell Assembly and Electrochemical Analyses

NMC 622 cathodes were cut into circular samples with a diameter of 12 mm and dried at 130 °C for 12 h under vacuum at 0 bar. After final drying, the electrodes were transferred to an argon-filled glove box (LAB master pro sp, M. Braun, Garching, Germany) with H2O < 0.1 ppm and O2 < 0.1 ppm. NMC 622 cathodes were assembled vs. Li foil (Merck, Darmstadt, Germany) with a thickness of 0.25 mm in CR2032 coin cells (half-cells). A total amount of 120 µL electrolyte (Solvionic, Toulouse, France) consisted of 1.3 M LiPF6 in ethylene carbonate (EC) and ethyl methyl carbonate (EMC) with EC:EMC = 3:7 (mass ratio) plus 5 wt% additive of fluoroethylene carbonate (FEC) was added to each coin cell. A polypropylene (PP) separator foil (Celgard 2500, MTI Corporation, Richmond, CA, USA) with a thickness of 25 µm was placed between NMC 622 cathode and Li foil. All cell components were crimped using an electric crimper (MSK-160E, MTI Corporation, Richmond, CA, USA) at 0.8 t after stacking and the cells were stored at room temperature for 24 h to ensure a complete wetting of separator and cathode with liquid electrolyte.
For pouch cell assembly, NMC 622 cathodes and graphite anodes were laser cut into electrodes with an area of 45 × 45 mm2 and 49 × 49 mm2, respectively. The terminals of the cathodes and anodes were subsequently welded to an Al- and a Ni-tab, respectively, by using an ultrasonic welding machine (DS20-B, Schunk, Heuchelheim an der Lahn, Germany). The electrodes and PP separator with an area of 60 × 60 mm2 were subsequently dried under vacuum (−1 bar) at 60 °C for 24 h to eliminate residual water from the electrodes and separator. All the components were stacked in the cathode/separator/anode sequence. Afterwards, the stack was sealed in an Al laminated pouch case (MTI Corporation, Richmond, CA, USA) consisting of polyamide/Al/polypropylene (each with adhesive layers in between) with an opening on one side, and 1.1 mL of the same type of electrolyte used for coin cells was injected into each pouch cell. After 30 min of wetting, the final sealing process with evacuation was performed to completely seal the pouch bag. Finally, all pouch cells were stored at 20 °C for 20 h prior to electrochemical analyses.
Rate capability analyses were carried out with a battery cycler (BT2000, Arbin Instruments, College Station, TX, USA). A “constant current–constant voltage” (CCCV) protocol for charging was applied for each studied C-rate, while only constant current (CC) was used for discharging. The voltage window applied for half-cells was 3.0–4.3 V, while for pouch cells, the operating voltage window was 3.0–4.2 V. At the beginning, 3 cycles at C/20 (with C/50 as cut-off current during constant voltage phase) were performed as formation step, followed by raising C-rates from C/10 to 3C. A degassing process of the pouch cells was conducted after the first C/20 cycle. Finally, 5 cycles at C/5 were applied for coin cells to study possible capacity loss after cycling at high currents. In addition, symmetrical protocol was applied, which means that the currents for charging and discharging were the same. After rate capability analyses, half-cells and pouch cells were cycled at C/2 to study their long-term cycling performance.
A battery cycler (BCS-810, Biologic, Seyssinet-Pariset, France) was used for electrochemical impedance spectroscopy (EIS) on pouch cells and symmetrical coin cells. EIS analyses on pouch cells were performed at 3.6 V (50% state-of-charge, SoC) after the rate capability analyses and after every 100 cycles at C/2 during lifetime analyses. For symmetrical coin cells and pouch cells, a 10 mV voltage amplitude was applied, while the scanning frequency range was set from 10 mHz to 10 kHz. The EIS data were analyzed and fitted using analyzation software (ZView 2 Version 3.2, Scribner LLC, Southern Pines, NC, USA).

3. Results and Discussion

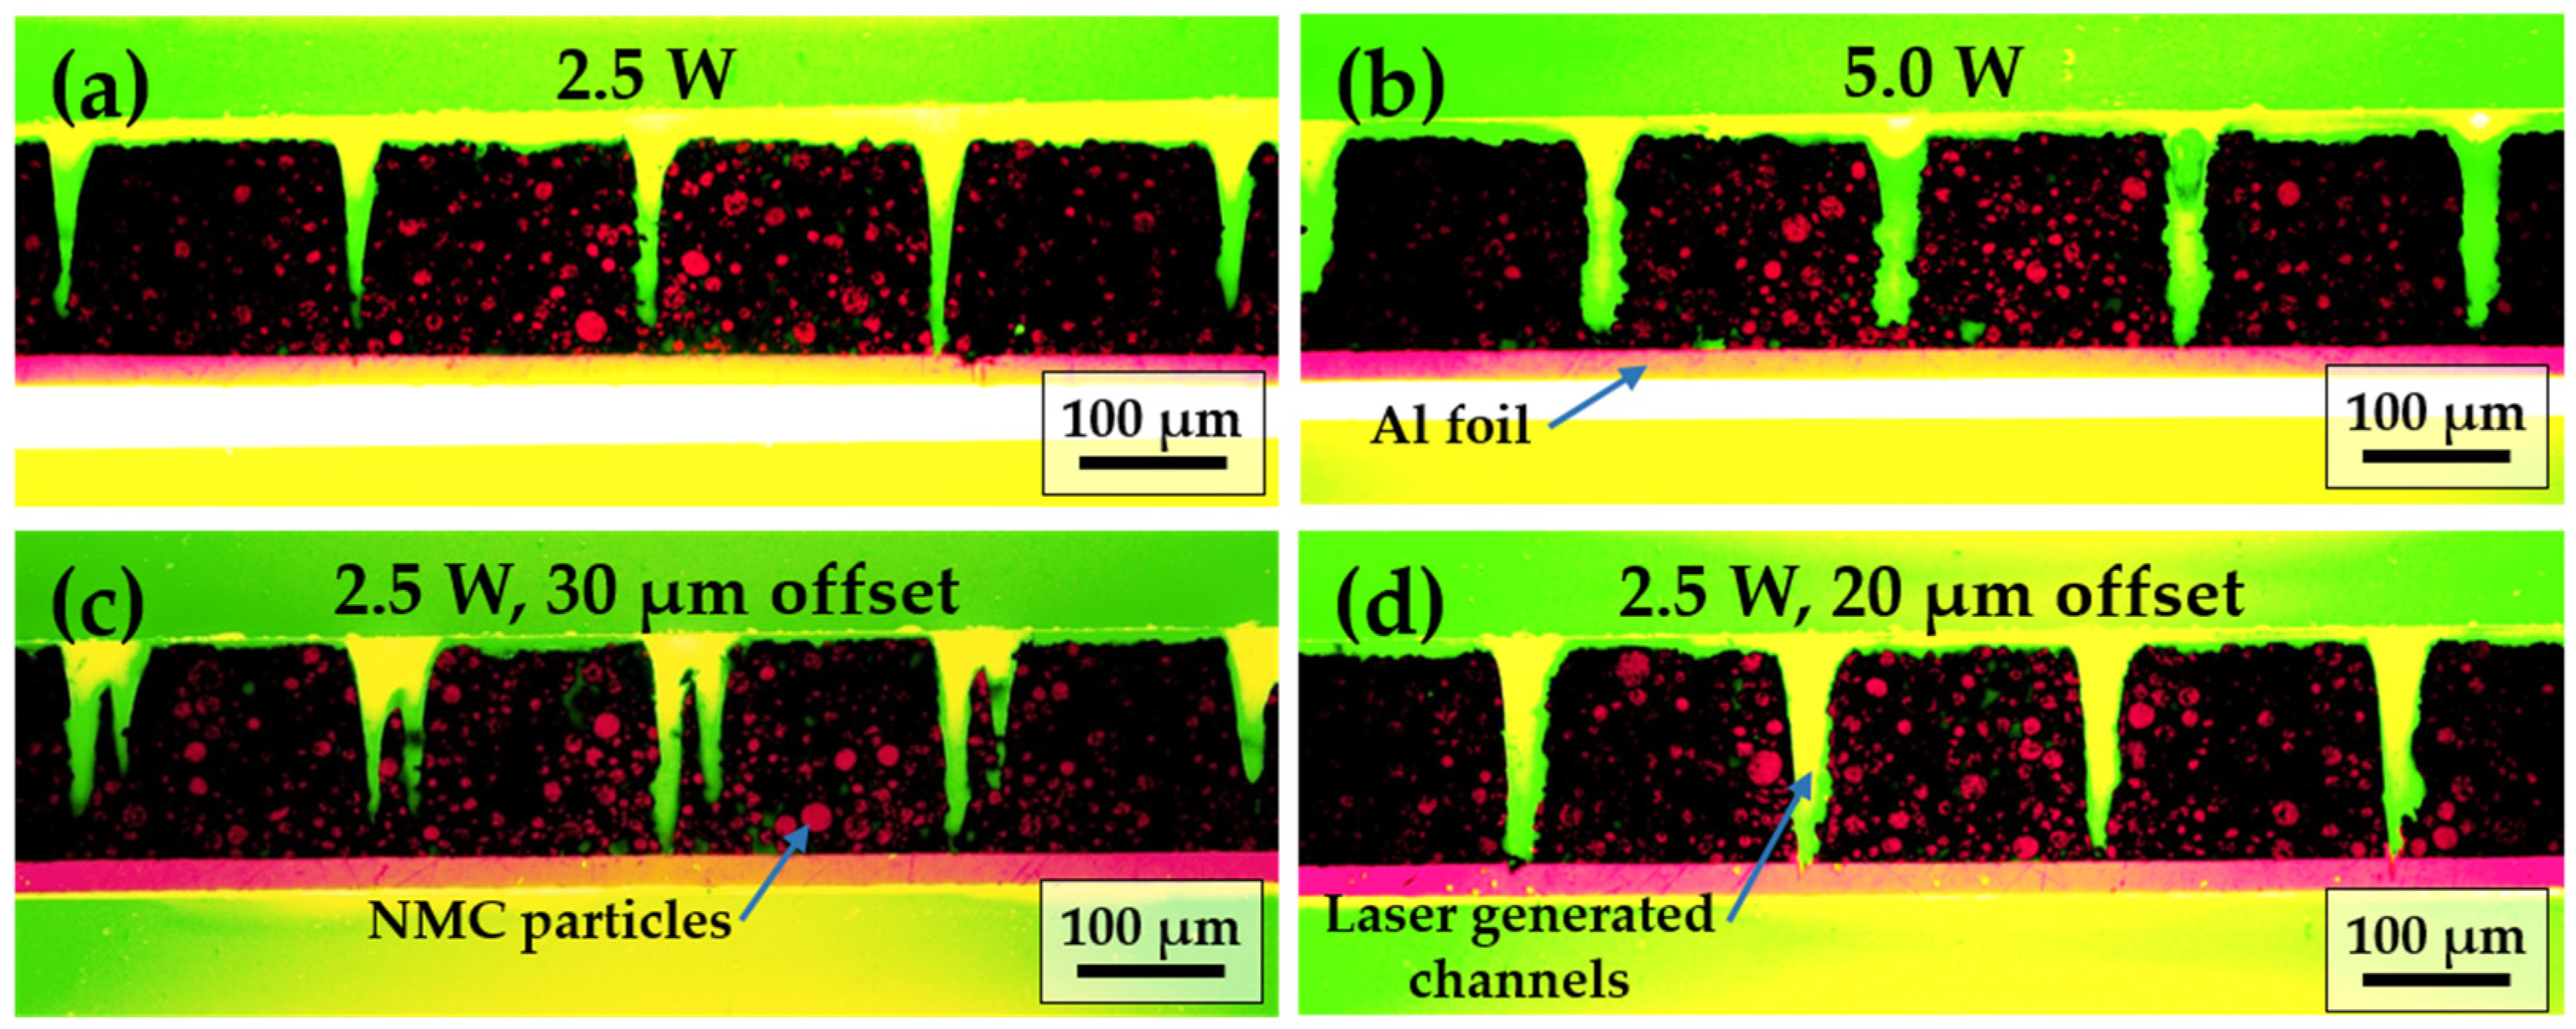
3.1. Electrodes and Laser Structuring Parameters

Thick-film NMC 622 cathodes prepared in the present work have higher areal loading than the state-of-the-art cathodes (23–27 mg/cm2) [50,51], while the aqueous processed thick-film graphite anodes with two different thicknesses were manufactured, which served as counter electrodes vs. NMC 622 cathodes in full-cells. Graphite anodes with two real loadings are needed to ensure a similar N/P ratio for the cells with PVDF-based or aqueous processed NMC 622 cathodes. Although NMC 622 cathodes with different binders had a similar mass loading of around 35 mg/cm2, the aqueous processed cathodes showed a lower specific discharge capacity of 166 mAh/g compared to the reference cathodes with PVDF binder (172 mAh/g). This is due to the Li-leaching from the NMC 622 surface during the aqueous mixing process [14]. Thus, cathodes with PA addition showed similar active mass loading but lower areal capacity in contrast to the reference cathodes with PVDF binder. The details of all electrodes are listed in Table 2.
Aqueous processed thick-film NMC 622 cathodes with PA addition were structured using different average laser powers and laser scans, their cross sectional views (Figure 2) obtained from metallographic samples prepared with resin, hardener, and a fluorescent additive, as illustrated elsewhere [49]. The green part is the resin containing fluorescent additive, while the NMC 622 particles and Al foil are shown in red. With increasing laser power from 2.5 to 5.0 W, i.e., with increasing line energy from 5 to 10 J/m, the maximum groove width near the electrode surface increased from 30 to 43 µm, as shown in Figure 2a,b, whereas the full-width-at-half-maximum (FWHM) increased from 13 to 26 µm. This is similar to our published results on the laser structuring of graphite anodes, where a linear increase in ablation depth with increasing line energy from 5 to 25 J/m was found [52]. The channel geometry changed from V-shapes (with sidewalls at about 6° to the vertical) to approximately rectangular shape with increasing laser line energy. Furthermore, the aspect ratio (the quotient of film thickness and FWHM) was reduced from 11.5 to 5.7 with increasing average laser power. Besides, the resulting active mass loss increased from 4% to 9% as summarized in Table 3. Due to economic reasons, a mass loss significantly higher than 10% should be avoided, especially for the cathode material, which in general is more expensive than the anode material and other cell components [53]. However, the laser processing time is significantly shorter due to the reduction of the number of laser scans from 13 to 7, which means that the ablation depth per laser scan increased from 11 to 21 µm with increasing average laser power from 2.5 to 5.0 W. The width and ablation depth increased with increasing laser power, while low laser power and multi-laser scans were effective in achieving groove structures with high aspect ratios. A similar conclusion was also drawn in the study of the laser structuring of LFP cathodes [46]. In addition, the reference NMC 622 cathodes with PVDF binder were laser structured using a line pitch of 200 µm and an average laser power of 2.5 W, resulting in a mass loss of 3.4%.
Figure 2c,d exhibit the outcome of the second laser structuring strategy, which is to adjust the channel width by using multiple scans with offset, while keeping the average laser power constant. Four different offset distances varying from 30 to 10 µm were applied. Since the laser spot size was 29 µm, these four offsets correspond to hatch overlaps ranging from 0% to 66%. When the offset was set to 30 µm (0% overlap), the grooves generated by the two laser structuring processes were not completely connected to each other, resulting in a Π-shaped structure (Figure 2c). As the offset was reduced, the channels emerged, and the total channel width was increased in comparison to the single laser scan with the same average laser power. However, when the offset was reduced to 15 and 10 µm, the channel width was decreased, while the ablation depth was increased, affecting the Al current collector, as marked in Figure S1a,b by dashed circles. To avoid the ablation of current collector material, an offset of 20 µm (31% hatch overlap) was applied. Besides, an angle of 6° between the sidewalls and the vertical was maintained by applying 5 J/m laser line energy with/without offset scans.
Furthermore, the surface topography of the sidewalls of groove structures using different laser power was analyzed. Scanning electron microscopy (SEM) (Figure S2a) reveals that the entire surface of the sidewalls of the structured cathodes is smooth and polished using 2.5 W laser power (laser peak fluence of 1.5 J/cm2), while energy dispersive X-ray (EDX) analysis (Figure S2b,c) shows a homogenous distribution of elements attributed to NMC 622. This indicates a homogenous laser ablation regardless of the ablation depth, and the composite electrode was uniformly ablated along the laser scan route. However, as the laser power increased to 5.0 W (laser peak fluence of 3.0 J/cm2), a heterogeneity in topography appeared on the sidewall surface: numerous intact, unaffected secondary NMC 622 particles were observed near the current collector, and cavities also appeared in these areas (Figure S3). The different topography of sidewalls may result from surface modification by interaction between laser-induced plasma and electrode materials along the surface of laser-generated channels. The plasma temperature increases with increasing laser fluence [54], and the electrode material attached to the channel geometry may face an increased temperature due to plasma interaction. However, no melt formation near the channel was detected in all laser-structured NMC 622 cathodes. The increased temperature may lead to selective ablation of binder and conductive agent in NMC 622 cathodes, which can be verified by the existence of cavities in Figure S3b. Similar results were reported in composite LiCoO2 electrode using fs-laser ablation [32] or in NMC 111 electrode with surface treatment using infrared (IR)-laser radiation [55].
Figure S4 shows the cross-sectional view of a laser structured graphite anode. Compared to the groove structures in NMC 622 cathodes having a V-shape with wider opening near the electrode surface, laser structured graphite anodes provide more rectangular-type channels.

3.2. Electrochemical Analyses

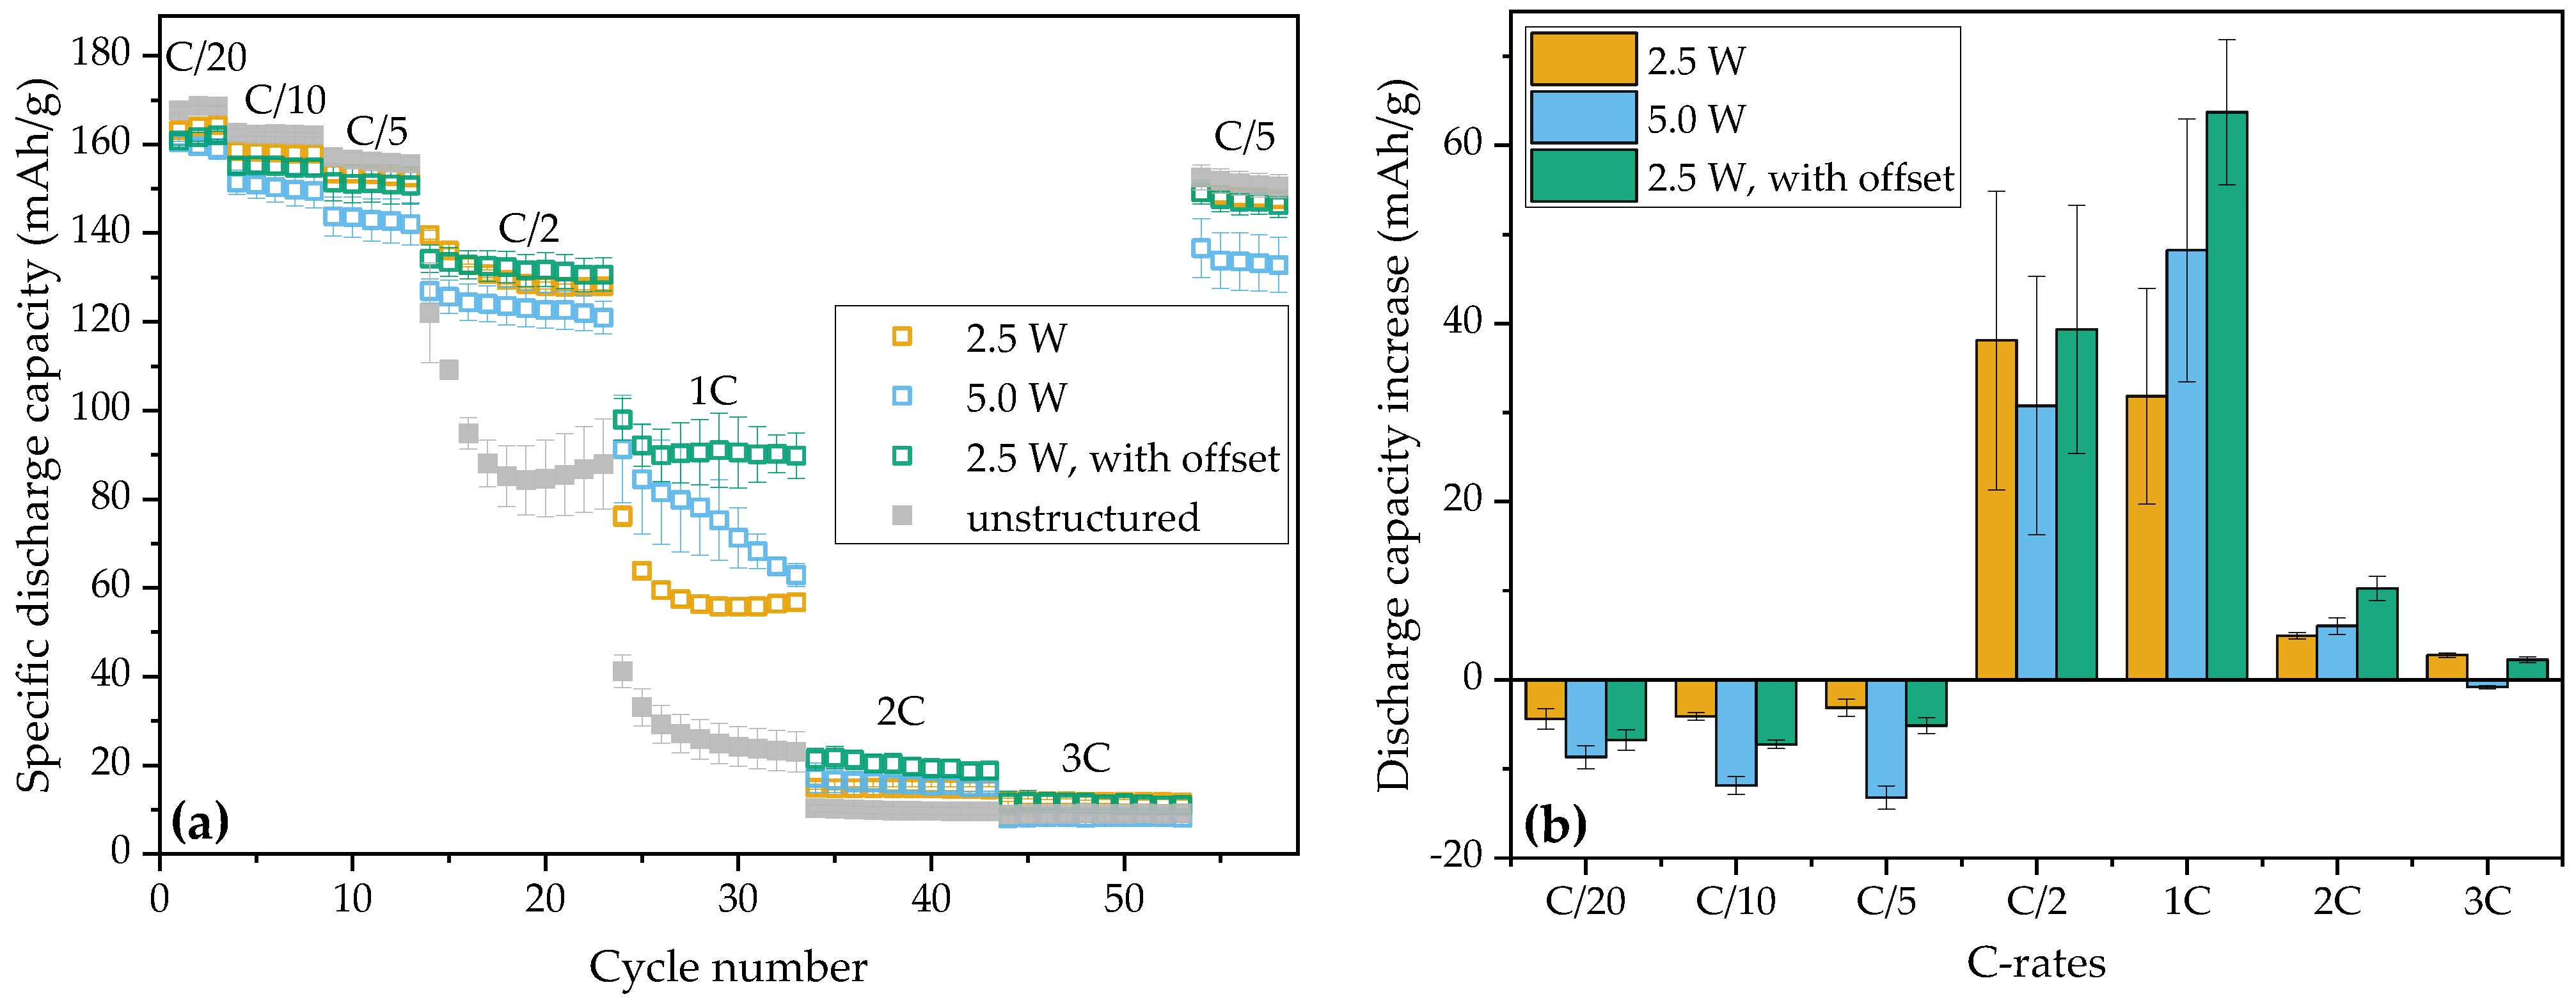
3.2.1. Coin Cells (Half-Cells and Symmetric Cells)

Figure 3a shows the rate capability of coin cells (half-cells) made of laser structured thick-film NMC 622 electrodes prepared aqueously with PA addition using different laser structuring strategies. The error bars were obtained from the standard deviation of the specific capacities of three cells with the same type of cathodes at different C-rates. At the first C/20 cycle, cells with unstructured cathodes achieved the highest initial capacity of 168 mAh/g, while those containing cathodes structured at high average laser power or with offset scans had a similar discharge capacity of 160 mAh/g. The cells with single scan (without offset) structured electrodes achieved the second highest capacity of 163 mAh/g. Nevertheless, all cells showed a similar initial coulombic efficiency (CE) of 86%. As the C-rate increased from C/10 to C/2, cells with 5.0 W structured electrodes exhibited the lowest capacity compared to other cells with laser structured electrodes at other structuring parameters. Especially at C/10 and C/5, the capacity decrease of cells with this type of electrodes was significantly higher. As C-rates increased from C/2 to 2C, cells with laser structured electrodes showed a capacity increase of 5–64 mAh/g in comparison to the reference cells with unstructured electrodes, as shown in Figure 3b. The increase in capacity was based on the difference between the average specific discharge capacities of the cells with laser structured electrodes and those with unstructured electrodes, while the error bars were determined based on the uncertainty propagation theory [56]. In particular, the cells containing structured electrodes with 2.5 W and offset scans exhibited the highest capacity of 39 and 64 mAh/g at C/2 and 1C, respectively. In contrast, cells with electrodes structured at 5.0 W showed lower capacity increase at C/2 to 2C compared to cells with cathodes structured at 2.5 W and offset scans. Besides, they retained lower discharge capacity at 3C compared to the reference cells with unstructured aqueous processed electrodes.
The capacity retention of cells with different types of cathodes is calculated by dividing the average capacity of the last five C/5 cycles by those of the first five C/5 cycles. The cells with NMC 622 cathodes structured at 2.5 W with offset scans exhibited the highest capacity retention of 97.6 ± 0.9%, while the cells with electrodes structured at 5.0 W had the lowest capacity retention of 93.7 ± 1.5%. The cells with other two types of NMC 622 cathodes showed a similar capacity retention of 96.9%.
Our previous study found that, for cells containing NMC 622 electrodes with 150 µm thickness, the discharge capacity increased at C-rates larger than C/2 with decreasing structure pitch. In other words, it is assumed that, with increasing mass loss of the laser structured electrodes, an enhanced rate capability at high C-rates should be achieved [33]. However, the electrode mass losses due to laser ablation with 5.0 W and 2.5 W with offset scans were similar, but the cells containing electrodes with former structuring strategy displayed less capacity in rate capability.
The same types of cathode, as well as the reference cathodes with PVDF binder, were assembled in symmetrical cells in order to determine their ionic resistance using EIS analyses [57]. The Faradaic processes can be inhibited by using fully lithiated electrodes in blocking condition [57]. The equivalent circuit for EIS data fitting (Figure 4a) consists of a resistor and a generalized finite Warburg element, which was applied in another study [58], and the resistor describes all ohmic resistance in the cell, while the generalized Warburg element is used to represent the porous electrodes. For cells with aqueous processed electrodes, the ones containing unstructured cathodes (“PA, US”) exhibited the highest ionic resistance of 70.5 ± 1.0 Ω cm2 (Figure 4b), followed by those with 2.5 W structured cathodes (“PA, 2.5 W”) of 34.5 ± 0.4 Ω cm2. The cells having structured electrodes with 5.0 W (“PA, 5.0 W”) and 2.5 W offset scans (“PA, 2.5 W, offset”) exhibited around 25 Ω cm2 ionic resistance, which is 65% lower compared to those with unstructured electrodes. Similar results were reported by Park et al. [32], where 42% and 38% ionic resistance decrease in symmetrical cells containing laser structured LiCoO2 cathodes and graphite anodes was observed, respectively. Around a 20% decrease in ionic resistance of laser structured graphite with line structures in comparison to unstructured ones with the same areal capacity was also reported in our previous work [45]. Compared to cells with aqueous processed cathodes, those having unstructured electrodes with PVDF binder (Ref. PVDF, US) showed lower ionic resistance of 41.0 ± 0.2 Ω cm2, while the lowest resistance of 21.6 ± 0.3 Ω cm2 was measured for the cells containing structured cathodes with PVDF binder (“Ref. PVDF, 2.5 W”). The tortuosity of different cathodes was determined according to the equation shown in ref. [59], while the ionic conductivity of the electrolyte used in this work was assumed to be 7.8 mS/cm, according to the study of Landesfeind et al. [60]. The “PA, US” cathodes had a higher tortuosity of 6.5 ± 0.3, while the “Ref. PVDF, US” electrodes showed a reduced tortuosity of 3.7 ± 0.1.
The decrease in capacity of cells containing aqueous processed NMC 622 cathodes compared to the reference cells with PVDF-based cathodes can be compensated by applying 3D architectures generated by laser ablation. The cells with “PA, 2.5 W, offset” NMC 622 cathodes delivered the highest discharge capacity at C/2 to 3C and the highest capacity retention in rate capability analyses compared to cells with other types of electrodes. This indicates that channel geometry plays an important role in the enhancement of the electrochemical performance of cells with 3D electrodes. It is obvious that the channel geometry impacts the tortuosity of the electrode (Figure 4a). In addition, the electrolyte wetting in 3D electrodes with narrow V-shape channels (2.5 W without offset scan) could be less effective than that in the electrodes structured with 2.5 W with offset scans or with 5.0 W. Dry regions near the current collector might appear in V-shaped channels, which would result in a lower discharge capacity. By applying offset scans, the channel geometry changes from V-shape to nearly rectangular, and the rate capability of cells with laser structured electrodes can be enhanced at high C-rates larger than C/2, while the ionic resistance is reduced by 23.5%. The defined control of wettability and tortuosity opens up new perspectives for enhancing electrochemical performance, and the channel geometry can be further tuned by combining laser structuring with multilayer electrodes [61].
In addition to the channel geometry, the applied average laser power (or laser line energy) also has an impact on the electrochemical performance of the cells with laser structured electrodes. As mentioned in Section 3.1, SEM images (Figure S2a) showed that, as the average laser power increased from 2.5 to 5.0 W, the surface of the sidewalls in laser generated grooves became more inhomogeneous. The increased average laser power leads to a selective removal of matrix composites consisting of binder and conductive agent. The ablation might affect a thin surface layer along the sidewalls of the generated grooves, and thus may result in a decrease in electrical conductivity of the NMC 622 particles distributed along the groove surface. This can also explain the observed decrease in specific discharge capacity from C/10 to 1C (Figure 3a). It is worth noting that the channel geometry affects the formation of the laser-induced plasma and that the plasma-sidewall interaction can offer the main contribution to material modifications, especially when using ultrafast laser ablation, which is well known for the “cold” nature of its material removal. Thus, the channel geometry and, in turn, the ablation or scan strategy should be very well controlled to reduce possible material modification, besides the proper selection of the used average laser power.

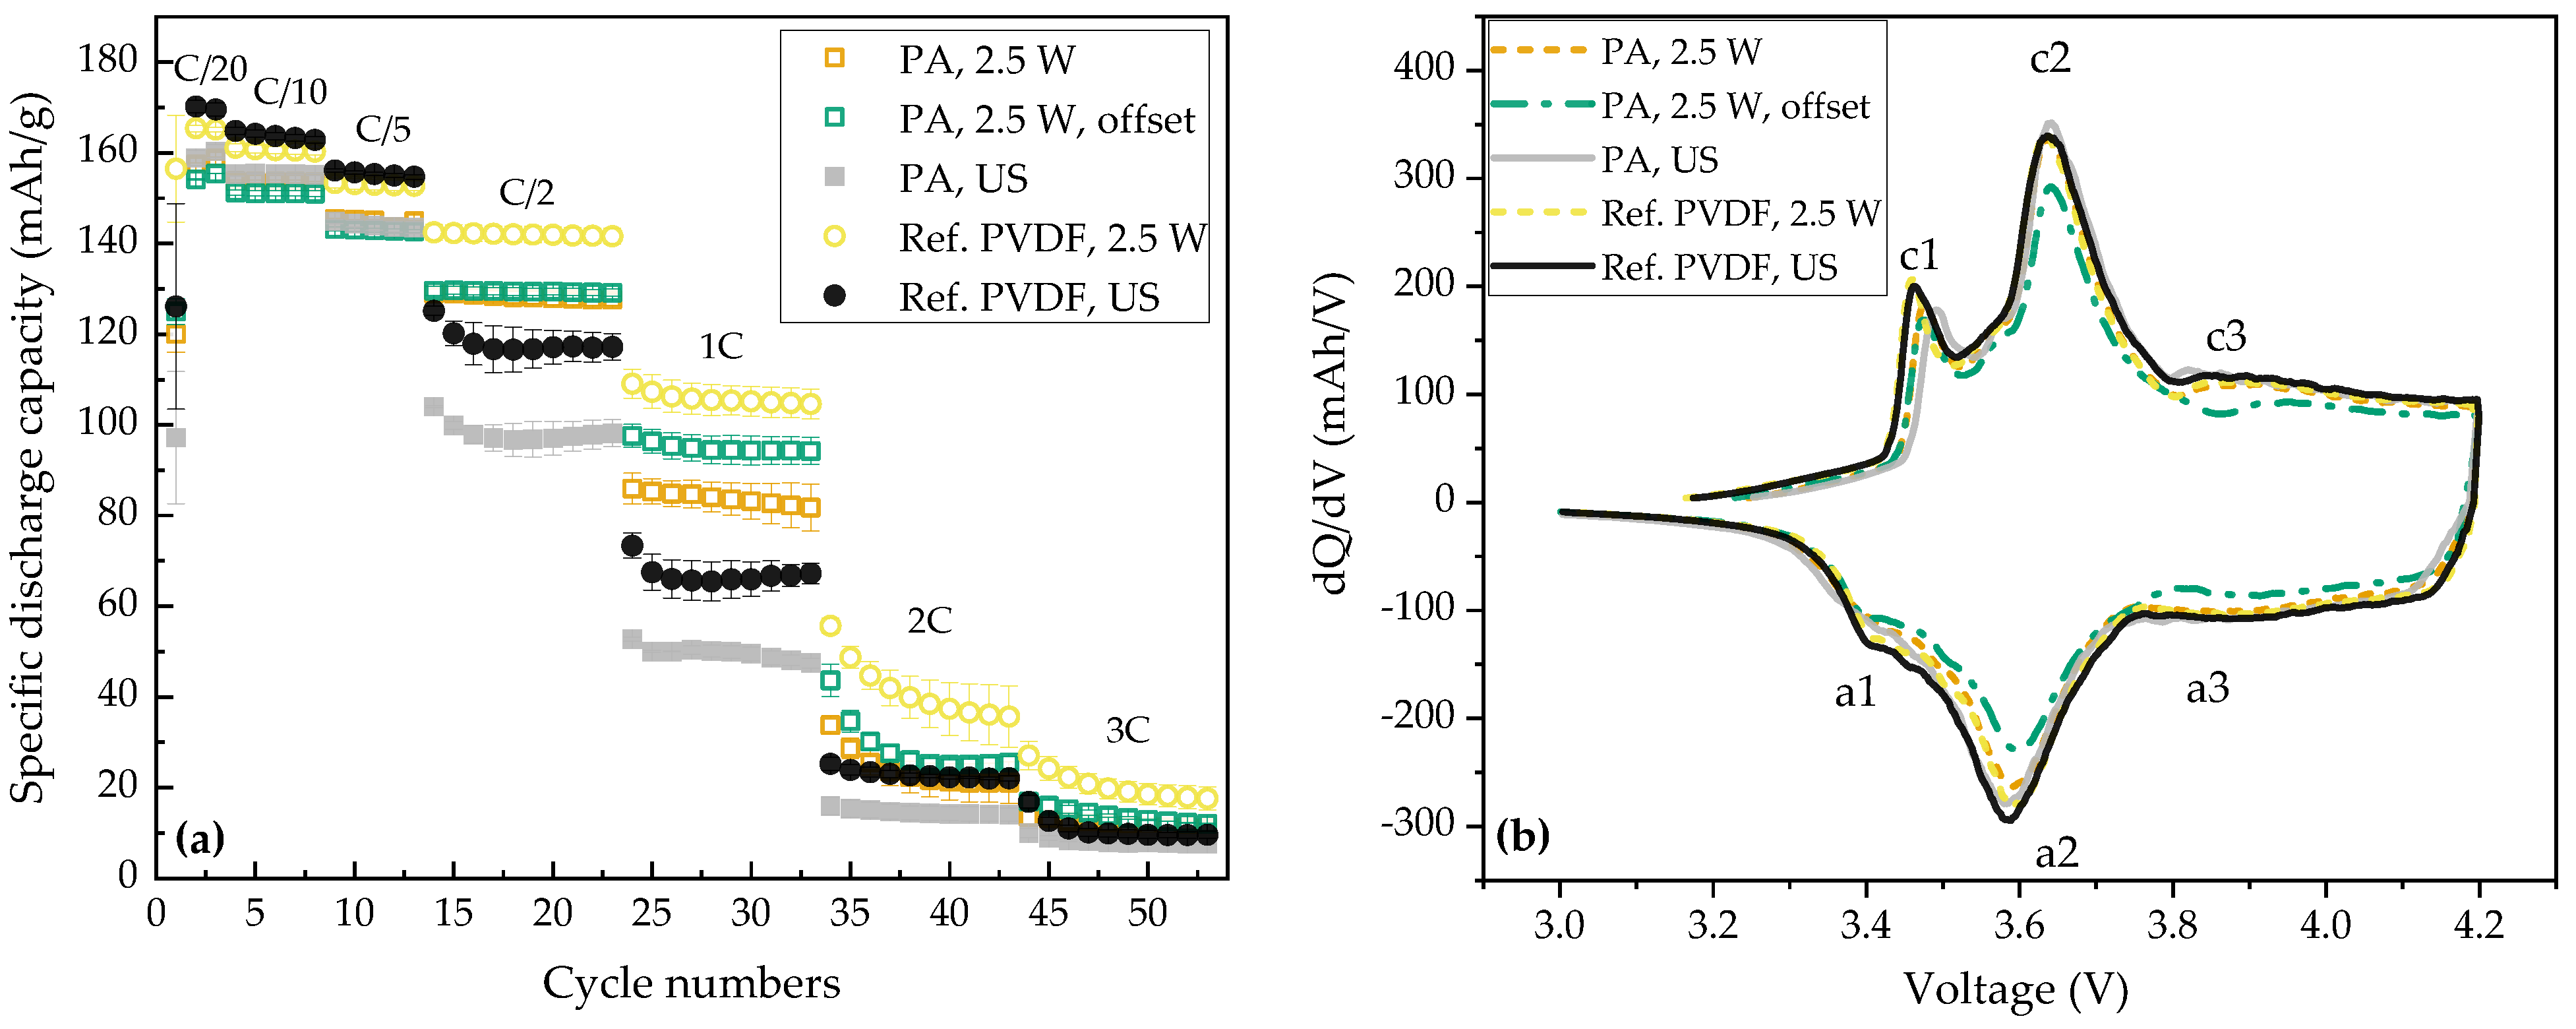
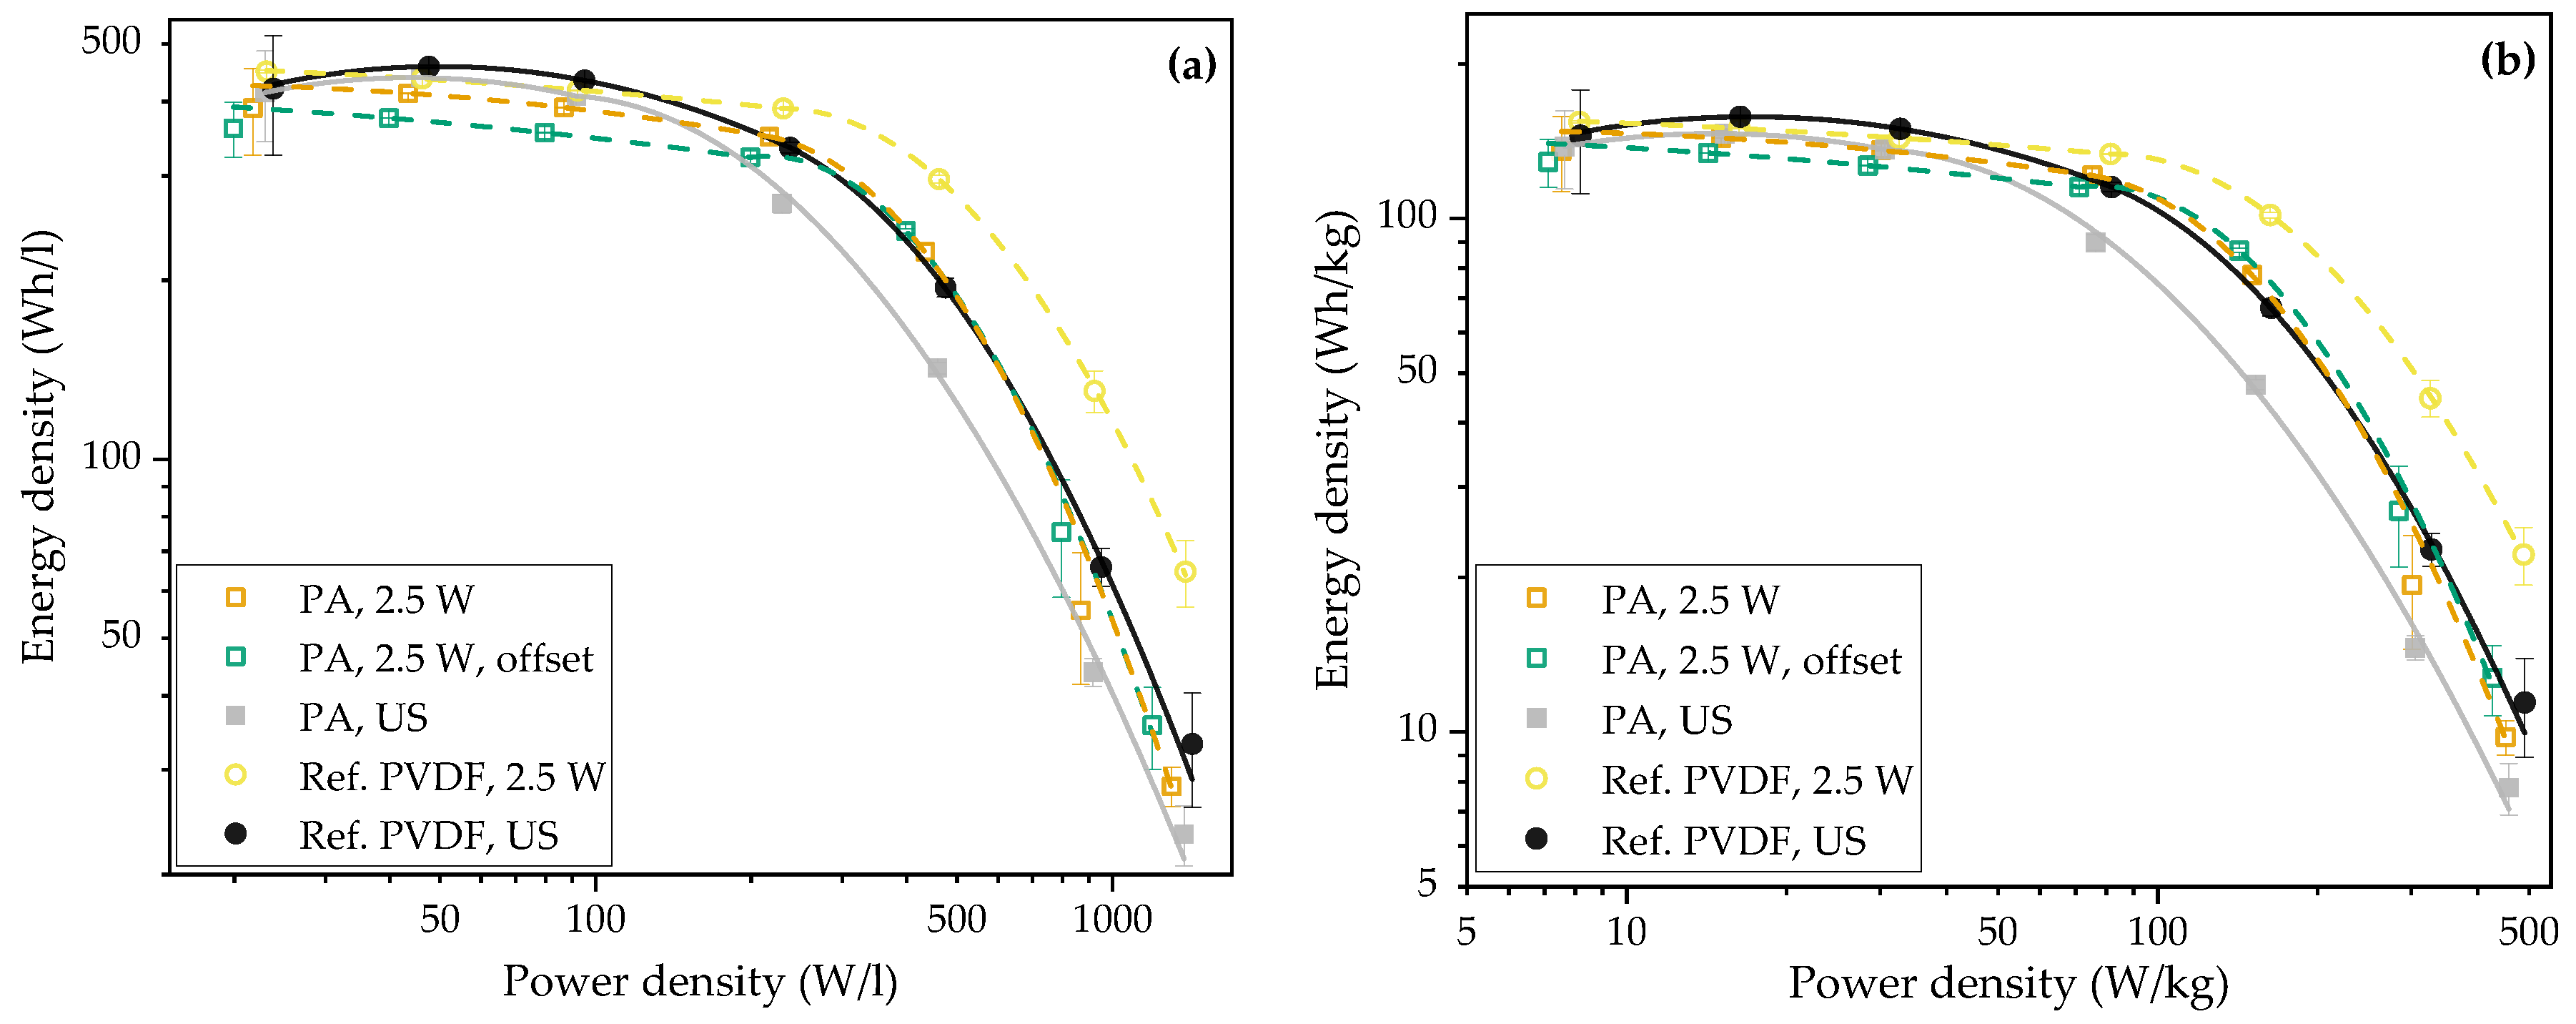
3.2.2. Pouch Cells (Full-Cells)

Although similar mass losses were achieved by applying 5.0 W average laser power or 2.5 W with offset, the latter laser structuring strategy provided the most enhanced cell performance in rate capability. Thus, this parameter set was applied for the laser structuring of aqueous processed NMC 622 cathodes for full-cells vs. graphite. In contrast, 2.5 W without offset scan was applied as “standard” laser structuring process for aqueous processed cathodes and cathodes with PVDF binder.
Rate capability analyses (Figure 5a) show that the cells with unstructured PA-added NMC 622 cathodes exhibited the lowest initial discharge capacity of 97 mAh/g, whereas those with laser structured aqueous processed NMC 622 cathodes displayed capacities of 120–125 mAh/g, which are similar to the reference cells having unstructured NMC 622 cathodes with PVDF binder (Table 4). The highest initial discharge capacity of 157 mAh/g belonged to the cells containing laser structured NMC 622 cathodes with PVDF binder. In addition, the cells with “PA, US” cathodes exhibited 30 mAh/g lower initial capacity compared to the reference cells with “Ref. PVDF, US” cathodes, which is due to the Li dissolution from the surface of NMC 622 during the slurry mixing process [17,62]. Furthermore, the initial capacity increased by 27–31 mAh/g and 36 mAh/g for cells containing laser structured aqueous processed or PVDF-based cathodes in comparison to those with unstructured electrodes, respectively. This enhancement may be due to the rapid and homogeneous electrolyte wetting in laser structured electrodes [29]. The discharge capacity in pouch cells with aqueous processed NMC electrodes also increased with increasing cycle number from the 2nd to 3rd cycle during formation. This was also observed in other studies [24,26], which may be attributed to the swapping of Li-ions from the electrolyte with part of the protons on the surface of aqueous processed NMC 622 particles [14].
The initial CE of pouch cells was lower in contrast to that of coin cells (half-cells). For instance, reference pouch cells with unstructured electrodes had an initial CE of 83.3%, whereas coin cells had an initial CE of 88.8%. This difference can be attributed to the formation of the solid–electrolyte interphase (SEI) [63]. After the first cycle, the CE increased to 99–100% for all pouch cells, indicating an adequate SEI formation on the graphite anodes and an adequate cathode–electrolyte-interphase (CEI) on the NMC 622 cathodes.
The dQ/dV plots of pouch cells with different types of electrodes from the third cycle during formation step (C/20) are displayed in Figure 5b. Three peaks were observed during charging and discharging, respectively, which are in good agreement to the literature [64,65]. The first distinct peak c1 during charging appeared at 3.46 V, followed by the main peak c2 at 3.64 V. A third peak c3 was observed at around 3.85 V, which is significantly weaker in contrast to the other peaks. During discharging, the main anodic peak a2 and the second peak a1 at 3.58 V and 3.39 V, respectively, are visible for all cells with unstructured electrodes, while the third peak a3 is weak and not obvious. The c2 peak is ascribed to the phase transition of NMC 622 from the hexagonal (H1) to the monoclinic (M) phase, while the c1 peak is associated to the lithiation of graphite (C6→LiCx), which is in good agreement with the literature [66]. The weak c3 peak is associated with the phase transition of NMC 622 from the monoclinic (M) to the hexagonal (H2) phase [66]. Thus, the addition of PA and the laser structuring do not affect the redox reaction of NMC 622 cathodes. In addition, the peak area of c2 was reported to be proportional to the total cell capacity [65,67]. In the present work, the c1 peaks exhibited similar intensity for cells with laser structured electrodes compared to those with unstructured electrodes, while the intensity of c2 peaks reduced for cells with laser structured electrodes, especially for cells containing aqueous processed cathodes. The decrease in intensity of c2 and a2 peaks for cells with laser structured electrodes with increasing mass loss in comparison to those with unstructured electrodes is coherent with the decrease in cell capacity at C/20 and C/10 (Figure S5).
At C/10 and C/5, the cells having laser structured electrodes exhibited up to 5 mAh/g lower specific discharge capacity compared to those with unstructured electrodes. The charge and discharge profiles at C/10 of pouch cells with different types of electrodes are displayed in Figure S6a,c. The IR-drops at the beginning of the discharge profiles for all cells were in the range of 0.05 V. As the C-rate increased to values larger than C/2, all cells with laser structured electrodes exhibited higher specific capacity in comparison to the cells with unstructured electrodes. For example, compared to cells with “Ref. PVDF, US” electrodes, cells with laser structured electrodes showed 25 mAh/g higher specific discharge capacity at C/2. An increase of 32 mAh/g was observed for cells with laser structured aqueous processed cathodes. The discharge profiles of pouch cells containing different types of NMC 622 cathodes at C/2 are displayed in Figure S6b,d. Compared to the cells with unstructured electrodes, the respective cells with laser structured electrodes exhibited a higher discharge plateau (or a lower charge plateau) and reached a 20–25 mAh/g higher specific capacity after discharging (or charging). This illustrates that laser structuring can reduce the cell polarization in cells containing electrodes of high mass loading. A maximal increase in discharge capacity of 44 mAh/g was found for cells with “PA, 2.5 W, offset” cathodes in contrast to cells with “PA, US” cathodes at 1C, whereas the cells with “PA, 2.5 W” cathodes showed an increase in discharge capacity of 34 mAh/g. Similarly, reference cells with “Ref. PVDF, 2.5 W” cathodes showed an increase in specific capacity of 40 mAh/g compared to those with “Ref. PVDF, US” cathodes. At 2C, pouch cells with two types of laser structured aqueous processed NMC 622 cathodes reached a similar specific capacity compared to the cells with “Ref. PVDF, US” electrodes. At the highest studied C-rate of 3C, the cells with “Ref. PVDF, 2.5 W” cathodes maintained a specific discharge capacity of 19 mAh/g, while other cells had a similar specific capacity of 8–12 mAh/g. By comparing half-cells and full-cells of the same type of cathodes, it is found that their rate capability results are comparable.
Applying aqueous processing and laser structuring decreases the overall cell capacity at low C-rates from C/20 to C/5 (Figure S5), which is due to the Li-dissolution and laser generated active material loss, respectively. However, cells with laser structured electrodes starts to show an advantage at C-rates higher than C/5. The cells with laser structured PA-added cathodes achieved a similar or higher total capacity compared to the cells with “Ref. PVDF, US” cathodes. If the C-rate was further increased to 1C, the cells with laser structured PA-added cathodes outperformed the cells with “Ref. PVDF, US” cathodes, resulting in an 11–13 mAh higher capacity.
The energy density at cell level was calculated from the rate capability analyses and plotted vs. the power density (Figure 6), which is also known as Ragone plot. The calculation of energy and power density of cells is demonstrated in Appendix A. It reveals that, for pouch cells with thick-film electrodes, both the volumetric and gravimetric energy density decrease as the power density increases. Figure 6a displays that, at power densities lower than 130 W/L, cells with unstructured thick-film electrodes achieved a higher energy density than those with laser structured electrodes. This implies that, for low power applications (C-rates below C/2), the enhancement of Li-ion diffusion in 3D structured electrodes is insufficient to compensate for the loss of active materials due to laser ablation. For the cells with aqueous processed cathodes, the crossing point, where the energy density reaches the same value for both cells with unstructured and laser structured electrodes, shifted to a higher power density as the mass loss increased. For example, the crossing point was located at 140 W/L for cells with 2.5 W structured cathodes whereas, for cells with cathodes structured at 2.5 W and offset, the point increased to 190 W/L. This suggests that, by reducing the mass loss in electrodes, laser structuring begins to show its advantages at lower power density. Moreover, for reference cells with PVDF binder, an increase in energy density of up to 110 Wh/L is observed at power density from 140 to 1300 W/L for cells with laser structured electrodes. In contrast, cells with “PA, US” cathodes exhibited the lowest energy density due to the irreversible Li-leaching during aqueous slurry preparation. However, from 220 to 600 W/L, the energy densities of the cells with laser structured aqueous processed cathodes increased to the same or higher level compared to the reference cells with “PA, US” electrodes. The same trend is observed in Figure 6b, where cells with laser structured PA-added electrodes reached a higher gravimetric energy density at 80 to 220 W/kg compared to the reference cells with unstructured PVDF-based electrodes. Besides, if only comparing cells containing aqueous processed electrodes, laser structuring can enhance the energy density in the power density range from 140 to 1300 W/L (or 40 to 450 W/kg).
Figure 7 exhibits the lifetime analyses of pouch cells, which were cycled at C/2 (charge and discharge) and, after each 100 cycles at C/2, the cells were cycled at C/5 for 3 cycles to examine the capacity retention. The cells with “Ref. PVDF, US” electrodes showed continuous specific capacity decline from 117 to 83 mAh/g, retaining 70.9% capacity after 500 cycles, whereas those containing “PA, US” electrodes showed a lower specific capacity of around 100 mAh/g at the beginning but remained 93.6% capacity after 500 cycles. The enhanced cycling stability of cells with aqueous processed NMC 622 cathodes compared to cells containing electrodes with PVDF binder was also observed in other literatures [24,68]. The enhanced lifetime of cells with PA-added cathodes indicates that phosphates formed on the surface of NMC 622 particles can stabilize the interface between NMC 622 particles and electrolyte and may hinder the dissolution of transition metal-ions during cycling [20,25].
Furthermore, in comparison to the cells with “Ref. PVDF, US” electrode, the remained total cell capacities of the cells with “PA, 2.5 W” or “PA, 2.5 W, offset” cathodes were 38% and 29% higher after 500 cycles, respectively, while the cells with “PA, US” cathodes achieved a 19% higher specific capacity. In addition, it is worth noting that the mass loading of the aqueous processed NMC 622 cathodes used in the present work is higher in comparison to the previously published references [22,24,25].
Figure S7 shows the state-of-health (SoH) of different cells during lifetime analyses, and the end-of-life (EoL), which is defined by a SoH reduction to 80%, was determined by applying a linear fit to the data. The cells with “Ref. PVDF, US” electrodes reached their EoL after 369 cycles, while the cells with “Ref. PVDF, 2.5 W” electrodes were expected to last the longest, with 1952 cycles. In contrast, cells with “PA, US” cathodes would last 1664 cycles, whereas those with “PA, 2.5 W” or “PA, 2.5 W, offset” cathodes could achieve 1480 and 1815 cycles before reaching their EoL, respectively. This indicates that, for the reference cells containing thick-film cathodes with conventional PVDF binder, laser structuring can significantly extend their EoL by a factor of 4.3. With the combination of aqueous processing of NMC 622 cathodes and laser structuring using offset scans, the EoL of cells is four times longer compared to the reference cells with unstructured PVDF-based cathodes. Additionally, tailoring the mass loss by applying offset scans allows the cycle life and cell capacity to be further adjusted to meet different requirements in practical applications.
EIS analyses were performed on pouch cells after the rate capability analyses and after every 100 cycles during lifetime analyses at an open circuit voltage (OCV) of 3.6 V, which almost corresponds to a SoC of 50% (Figure 8). The semicircles from 10 kHz to about 0.1 Hz showed a plateau-shaped form and thus did not allow a clear separation of the contribution of anode and cathode. The widening of the semicircles with increasing cycle number was also observed in other studies with half-cells [69] or full-cells [70,71] containing NMC cathodes, where the semicircles at middle frequencies correspond to the charge transfer resistance of cells. Furthermore, by comparing the semicircles before the lifetime analyses, all cells with laser structured electrodes showed a reduced semicircle in contrast to those with unstructured electrodes, indicating an overall lower charge transfer resistance in cells with laser structured electrodes.
In order to distinguish the effects from anode and cathode, an equivalent circuit with three in series connected R-CPE elements are used for the data fitting [72]. However, due to the limited frequency range, the first semicircle corresponding to the SEI formation could not be fully detected. Thus, we focus on the charge transfer processes of anode and cathode at the middle frequencies. Previous results of pouch cells using three-electrode configurations showed that the semicircle corresponding to the charge transfer resistance consisting of anode and cathode, with anode at higher frequencies and cathode at lower frequencies. [73]. The characteristic frequencies of the fitted RC circuits containing R1 and R2 were checked to ensure that the resistances were correctly matched to anode and cathode, respectively. The fitted equivalent circuit is shown in Figure 8b marked with a red rectangle.
The R1 for all cells increased with increasing cycle number (Figure 9a), and cells with PA-added electrodes exhibited 0.3–0.8 Ω lower R1 compared to the reference cells with unstructured electrodes. This may be due to the fact that the graphite anodes used for the cells with PA-added cathodes had lower mass loading compared to those for the reference cells with PVDF-based cathodes, due to the capacity loss in aqueous processed NMC 622 cathodes resulting from Li-leaching (Table 2). The cell with “Ref. PVDF, US” electrode showed an increase in R1 by 185% after 500 cycles, which is in agreement with their severe aging behavior in lifetime analyses. In addition, all pouch cells with laser structured electrodes displayed similar R1 values after 100 to 400 cycles. The R1 and R2 values of the cell with aqueous processed cathodes structured at 2.5 W after 500 cycles were unusual, which is probably due to the fact that this cell was stored at open circuit voltage for more than two weeks prior to the last EIS analysis due to a technical issue. Thus, these data points can be neglected.
In contrast to the significant increase in R1 with increasing cycle number, R2 of the reference cells with unstructured electrodes showed less than 0.1 Ω increase during the lifetime analyses (Figure 9b). This indicates that, during lifetime analyses, the ageing process is more severe on the graphite anodes than on the NMC 622 cathodes in full-cells. The cell with “PA, US” cathode showed an about 0.5 Ω higher R2 value compared to the cell with “Ref. PVDF, US” electrode. Since PA has a melting point of about 40 °C, the residual PA would be dense and highly crystallized after the drying process at 90 °C; After cell assembly, PA can cause excessive cathode-electrolyte-interphase (CEI) growth on the NMC 622 cathodes, leading to an increased charge transfer resistance [25]. In addition, the cells having aqueous processed cathodes structured with different scan strategies showed about 0.3 Ω lower R2 compared to the cell with aqueous processed unstructured electrodes, while the cell with cathode structured at 2.5 W and offset scans exhibited the lowest R2 among all cells with aqueous processed electrodes. However, the difference in R2 between the cells containing laser structured electrodes with different scanning strategies was only 0.03–0.09 Ω. Thus, both scan strategies are capable of reducing the charge transfer resistance R2 of the NMC 622 cathodes in pouch cells.

4. Conclusions

Aqueous processed phosphoric acid-added NMC 622 cathodes, as well as reference cathodes with PVDF as binder, were prepared. For both types of cathodes, a film thickness of about 150 µm was achieved, which corresponded to an active mass loading of around 35.5 mg/cm2. All aqueous processed cathodes were subsequently laser structured using two laser scan strategies, i.e., doubling the average laser power or performing offset scans. The offset was adjusted to 20 µm with 66% hatch overlap in order to generated grooves without affecting the Al current collector. A similar mass loss of 9–10% due to laser ablation was achieved by using both laser scan strategies. The cross-sectional geometry of the grooves changed from V-shape to approximately rectangular shape with increasing average laser power from 2.5 to 5.0 W (laser line energy from 5 to 10 J/m), while the aspect ratio was reduced from 11.5 to 5.7. Besides, SEM analyses revealed heterogeneity on the surface of the sidewalls of the laser generated grooves in cathodes structured at 5.0 W average laser power, which might be due to the selective ablation of binder and carbon black.
The unstructured and laser structured aqueous processed NMC 622 cathodes were assembled in half-cells vs. Li. Rate capability analyses showed that the cells having cathodes structured with offset scans reached an enhanced discharge capacity at C/2 and 1C, while the cells with structured electrodes using high laser power showed a lower capacity increase from C/2 to 2C and maintained a lower discharge capacity at 3C compared to the cells with unstructured electrodes. EIS spectra from symmetrical cells showed that, by applying both laser scan strategies, the cells with aqueous processed cathodes had 65% lower ionic resistance compared to the cells with unstructured aqueous processed electrodes. In addition, the ionic resistance can be reduced by 15 Ω cm2 for cells with laser structured aqueous processed cathodes compared to the reference cells with unstructured PVDF-based cathodes.
The channel geometry plays an important role in the enhancement of the electrochemical performance of cells with 3D electrodes. By applying offset scans, the channel geometry changes from V-shape to nearly rectangular, and the rate capability of cells with laser structured electrodes can be further enhanced at high C-rates larger than C/2, while the ionic resistance is significantly reduced by 23.5%. The channel geometry and the applied average laser power have to be controlled carefully in dependence to each other. With increasing average laser power, the temperature of the laser-induced plasma increases as the plasma propagates and expands, and thus the possible interaction of plasma with the electrode material strongly depends on the groove geometry. A selective ablation of conductive agent (and binder) along the sidewall surface of the generated grooves might cause a decrease in the electrical conductivity of the affected NMC 622 particles. However, this contribution is considered to be small and further studies are needed that take into account the holistic influence of laser parameters and their impact on channel geometry, wettability, tortuosity, and selective material modification as a function of active material type, binder type, electrode porosity, and mass loading.
Pouch cells containing thick-film aqueous processed NMC 622 cathodes combined with laser structuring with a total capacity of around 100 mAh were first characterized and compared with those containing conventional PVDF binder in this work. Rate capability analyses revealed that cells with laser structured PA-added cathodes achieved similar or higher cell capacities than the reference cells with PVDF-based cathodes, especially at high C-rates ranging from C/2 to 2C. Ragone plots indicated that laser structuring could enhance the energy density of full-cells at power densities ranging from 140 to 1300 W/L (or 40 to 450 W/kg). Furthermore, full-cells exhibited enhanced performance in lifetime analyses in comparison to the half-cells. The cells with laser structured PA-added electrodes maintained a 29–38% higher total capacity compared to the reference cells with unstructured PVDF-based cathodes after 500 cycles. Besides, the EoL of cells with PA-added cathodes can be extended by a factor of 4 by implementing electrode structuring with offset scans compared to the reference cells with PVDF binder. EIS analyses and lifetime analyses indicated that combining laser structuring with aqueous processed for thick-film NMC 622 cathodes could significantly mitigate the charge transfer resistance increase in pouch cells during cycling, thereby allowing cells to maintain a high capacity and a longer lifetime. By choosing the appropriate channel geometry tuned by laser ablation with different laser parameters and scan strategies, the cells with aqueous processed 3D NMC 622 cathodes can outperform the cells containing cathodes with PVDF binder in rate capability analyses at high rates ranging from C/2 to 2C as well as in lifetime analyses.

Supplementary Materials

The following supporting information can be downloaded at: https://www.mdpi.com/article/10.3390/batteries10100354/s1, Figure S1: Cross sectional analyses of laser structured NMC 622 cathodes with an average laser power of 2.5 W and an offset of (a) 15 µm, and (b) 10 µm. The partial ablation of Al current collector are marked by dashed circles; Figure S2: The (a) SEM image and (b) the overview of the EDX analysis performed on the sidewall of a laser generated channel in aqueous processed NMC 622 cathode using 2.5 W laser power (laser peak fluence of 1.5 J/cm2); (c) the EDX element mapping of aluminum, carbon, oxygen, nickel, manganese, and cobalt; Figure S3: The (a) SEM image and (b) the overview of the EDX analysis performed on the sidewall of a laser generated channel in aqueous processed NMC 622 cathode using 5.0 W laser power (laser peak fluence of 3.0 J/cm2); (c) the EDX element mapping of aluminum, carbon, oxygen, nickel, manganese, and cobalt; Figure S4: The (a) cross-sectional view and (b) the SEM image of the laser structured graphite anode (laser repetition rate: 1 MHz, average laser power: 37 W, scan speed: 20 m/s, laser scans: 92); Figure S5: The total discharge capacity of full-cells containing different types of electrodes with increasing C-rates from C/20 to 3C; Figure S6: Discharge profiles of the pouch cells containing unstructured and laser structured reference cathodes with PVDF binder at (a) C/10 and (b) C/2; And cells containing PA-added cathodes with unstructured and 2.5 W average laser power as well as with offset structured at (c) C/10 and (d) C/2. Figure S7: The SoH of the pouch cells containing different types of NMC 622 cathodes with/without laser structuring during lifetime analyses at C/2 without the C/5 cycles between C/2 cycles. Table S1: The mass of different types of cathodes and anodes used in pouch cells for the calculation of gravimetric energy and power density.

Author Contributions

Conceptualization, P.Z.; methodology, P.Z. and Y.S.; validation, P.Z. and Y.S.; investigation, P.Z. and Y.S.; resources, P.Z., W.P. and Y.S.; data curation, P.Z.; writing—original draft preparation, P.Z.; writing—review and editing, P.Z., W.P. and Y.S.; visualization, P.Z.; project administration, W.P.; funding acquisition, W.P. All authors have read and agreed to the published version of the manuscript.

Funding

This research was funded by the German Research Foundation (Deutsche Forschungsgemeinschaft, DFG), project HiLIB (Process upscaling of laser structured thick-film electrodes in high performance Li-ion batteries), project number 519141407.

Data Availability Statement

The original contributions presented in the study are included in the article and Supplementary Materials, further inquiries can be directed to the corresponding author.

Acknowledgments

We are grateful for the help of our colleagues A. Reif, H. Besser, M. Kapitz, and U. Rist for their assistance and support in SEM analyses, laser processing, and data processing. Special thanks is also given to our colleagues A. Meyer, N. Straßburger and C. Reinhold for fruitful discussions. We would also like to express our sincere thanks to W. Bauer and U. Kaufmann for their support in the aqueous cathode slurry mixing. We acknowledge support from the KIT-Publication Fund of the Karlsruhe Institute of Technology.

Conflicts of Interest

The authors declare no conflicts of interest.

Appendix A. The Calculation of Energy and Power Density of Pouch Cells

The calculation of the energy and power density of pouch cells containing different types of electrodes is presented in this chapter in order to obtain the Ragone plot (Figure 6). The gravimetric energy density E D g [Wh/kg] and volumetric energy density E D v [Wh/L] are calculated as follows:
E D g = Q c e l l · U O C m c e l l · 1000
E D v = Q c e l l · U O C V c e l l
where Q c e l l [Ah] is the total cell capacity, U O C [V] the open circuit voltage of the cell (3.6 V), m c e l l [g] and V c e l l [L] the total mass and volume of a unit cell, respectively. The Q c e l l is obtained from the rate capability analyses at different C-rates.
The gravimetric power density P D g [W/kg] and volumetric power density P D v [W/L] are described as follows:
P D g = I · U O C m c e l l · 1000
P D v = I · U O C V c e l l
where I [A] is applied current.
The basic unit cell is considered in this work, which can be repeated in series to achieve high capacity at the battery level in practice. The total mass of a unit cell m c e l l [g] is given as:
m c e l l = m C a t + m A n o + m S e p + m E l e 1 2 ( m A l + m C u )
where m C a t   [g] is the mass of the cathode with Al foil, m A n o [g] the mass of the anode with Cu foil, m S e p   [g] the mass of a used separator, m E l e [g] the mass of the total injected electrolyte, and m A l [g] and m C u   [g] the mass of Al and Cu current collector, respectively. The m A l and m C u were determined to be 0.120 g and 0.223 g by weighing, respectively. The m S e p was 0.043 g, while the m E l e was 1.166 g (1.1 mL). The measured m C a t and m A n o are summarized in Table S1 for cells with different types of cathodes.
The total volume of a unit cell is calculated as follows:
V c e l l = A f o o t · h C a t + h A n o + h S e p + 1 2 h A l + h C u 10000
where A f o o t [cm2] is the footprint of the pouch cell (4.9 × 4.9 cm2); h C a t [µm] and h A n o [µm] the film thickness of the cathode and anode without current collector (Table 2), respectively; h S e p [µm] the thickness of separator, h A l [µm] and h C u [µm] the thickness of Al and Cu foil. All the information can be found in Section 2.

References

  1. Kubota, K.; Dahbi, M.; Hosaka, T.; Kumakura, S.; Komaba, S. Towards K-ion and Na-ion batteries as “beyond Li-ion”. Chem. Rec. 2018, 18, 459–479. [Google Scholar] [CrossRef] [PubMed]
  2. Bashir, T.; Ismail, S.A.; Song, Y.; Irfan, R.M.; Yang, S.; Zhou, S.; Zhao, J.; Gao, L. A review of the energy storage aspects of chemical elements for lithium-ion based batteries. Energy Mater. 2021, 1, 100019. [Google Scholar] [CrossRef]
  3. Andwari, A.M.; Pesiridis, A.; Rajoo, S.; Martinez-Botas, R.; Esfahanian, V. A review of Battery Electric Vehicle technology and readiness levels. Renew. Sustain. Energy Rev. 2017, 78, 414–430. [Google Scholar] [CrossRef]
  4. Zhou, W.; Cleaver, C.J.; Dunant, C.F.; Allwood, J.M.; Lin, J. Cost, range anxiety and future electricity supply: A review of how today’s technology trends may influence the future uptake of BEVs. Renew. Sustain. Energy Rev. 2023, 173, 113074. [Google Scholar] [CrossRef]
  5. Cano, Z.P.; Banham, D.; Ye, S.; Hintennach, A.; Lu, J.; Fowler, M.; Chen, Z. Batteries and fuel cells for emerging electric vehicle markets. Nat. Energy 2018, 3, 279–289. [Google Scholar] [CrossRef]
  6. Wood, D.L., III; Li, J.; Daniel, C. Prospects for reducing the processing cost of lithium ion batteries. J. Power Sources 2015, 275, 234–242. [Google Scholar] [CrossRef]
  7. Du, Z.; Wood, D.L.; Daniel, C.; Kalnaus, S.; Li, J. Understanding limiting factors in thick electrode performance as applied to high energy density Li-ion batteries. J. Appl. Electrochem. 2017, 47, 405–415. [Google Scholar] [CrossRef]
  8. Heubner, C.; Nickol, A.; Seeba, J.; Reuber, S.; Junker, N.; Wolter, M.; Schneider, M.; Michaelis, A. Understanding thickness and porosity effects on the electrochemical performance of LiNi0.6Co0.2Mn0.2O2-based cathodes for high energy Li-ion batteries. J. Power Sources 2019, 419, 119–126. [Google Scholar] [CrossRef]
  9. Park, K.-Y.; Park, J.-W.; Seong, W.M.; Yoon, K.; Hwang, T.-H.; Ko, K.-H.; Han, J.-H.; Jaedong, Y.; Kang, K. Understanding capacity fading mechanism of thick electrodes for lithium-ion rechargeable batteries. J. Power Sources 2020, 468, 228369. [Google Scholar] [CrossRef]
  10. Hawley, W.B.; Li, J. Electrode manufacturing for lithium-ion batteries—Analysis of current and next generation processing. J. Energy Storage 2019, 25, 100862. [Google Scholar] [CrossRef]
  11. Susarla, N.; Ahmed, S.; Dees, D.W. Modeling and analysis of solvent removal during Li-ion battery electrode drying. J. Power Sources 2018, 378, 660–670. [Google Scholar] [CrossRef]
  12. Zackrisson, M.; Avellán, L.; Orlenius, J. Life cycle assessment of lithium-ion batteries for plug-in hybrid electric vehicles–Critical issues. J. Clean. Prod. 2010, 18, 1519–1529. [Google Scholar] [CrossRef]
  13. Du, Z.; Rollag, K.; Li, J.; An, S.J.; Wood, M.; Sheng, Y.; Mukherjee, P.; Daniel, C.; Wood, D., III. Enabling aqueous processing for crack-free thick electrodes. J. Power Sources 2017, 354, 200–206. [Google Scholar] [CrossRef]
  14. Shkrob, I.A.; Gilbert, J.A.; Phillips, P.J.; Klie, R.; Haasch, R.T.; Bareno, J.; Abraham, D.P. Chemical weathering of layered Ni-rich oxide electrode materials: Evidence for cation exchange. J. Electrochem. Soc. 2017, 164, A1489. [Google Scholar] [CrossRef]
  15. Park, J.h.; Park, J.k.; Lee, J.w. Stability of LiNi0.6Mn0.2Co0.2O2 as a Cathode Material for Lithium-Ion Batteries against Air and Moisture. Bull. Korean Chem. Soc. 2016, 37, 344–348. [Google Scholar] [CrossRef]
  16. Chen, Z.; Wang, J.; Huang, J.; Fu, T.; Sun, G.; Lai, S.; Zhou, R.; Li, K.; Zhao, J. The high-temperature and high-humidity storage behaviors and electrochemical degradation mechanism of LiNi0.6Co0.2Mn0.2O2 cathode material for lithium ion batteries. J. Power Sources 2017, 363, 168–176. [Google Scholar] [CrossRef]
  17. Hofmann, M.; Kapuschinski, M.; Guntow, U.; Giffin, G.A. Implications of aqueous processing for high energy density cathode materials: Part I. Ni-rich layered oxides. J. Electrochem. Soc. 2020, 167, 140512. [Google Scholar] [CrossRef]
  18. Wood, M.; Li, J.; Ruther, R.E.; Du, Z.; Self, E.C.; Meyer III, H.M.; Daniel, C.; Belharouak, I.; Wood, D.L., III. Chemical stability and long-term cell performance of low-cobalt, Ni-Rich cathodes prepared by aqueous processing for high-energy Li-Ion batteries. Energy Storage Mater. 2020, 24, 188–197. [Google Scholar] [CrossRef]
  19. Li, S.; Church, B. Effect of aqueous-based cathode slurry pH and immersion time on corrosion of aluminum current collector in lithium-ion batteries. Mater. Corros. 2016, 67, 978–987. [Google Scholar] [CrossRef]
  20. Loeffler, N.; Kim, G.T.; Mueller, F.; Diemant, T.; Kim, J.K.; Behm, R.J.; Passerini, S. In situ coating of Li[Ni0.33Mn0.33Co0.33]O2 particles to enable aqueous electrode processing. ChemSusChem 2016, 9, 1112–1117. [Google Scholar] [CrossRef]
  21. Bauer, W.; Çetinel, F.A.; Müller, M.; Kaufmann, U. Effects of pH control by acid addition at the aqueous processing of cathodes for lithium ion batteries. Electrochim. Acta 2019, 317, 112–119. [Google Scholar] [CrossRef]
  22. Heidbüchel, M.; Schultz, T.; Placke, T.; Winter, M.; Koch, N.; Schmuch, R.; Gomez-Martin, A. Enabling Aqueous Processing of Ni-Rich Layered Oxide Cathode Materials by Addition of Lithium Sulfate. ChemSusChem 2022, 16, e202202161. [Google Scholar] [CrossRef] [PubMed]
  23. Sahni, K.; Ashuri, M.; He, Q.; Sahore, R.; Bloom, I.D.; Liu, Y.; Kaduk, J.A.; Shaw, L.L. H3PO4 treatment to enhance the electrochemical properties of Li(Ni1/3Mn1/3Co1/3)O2 and Li(Ni0.5Mn0.3Co0.2)O2 cathodes. Electrochim. Acta 2019, 301, 8–22. [Google Scholar] [CrossRef]
  24. de Meatza, I.; Urdampilleta, I.; Boyano, I.; Castrillo, I.; Landa-Medrano, I.; Sananes-Israel, S.; Eguia-Barrio, A.; Palomares, V. From Lab to Manufacturing Line: Guidelines for the Development and Upscaling of Aqueous Processed NMC622 Electrodes. J. Electrochem. Soc. 2023, 170, 010527. [Google Scholar] [CrossRef]
  25. Tolchard, J.R.; Vullum, P.E.; Arstad, B.; Wagner, N.P. New insights into orthophosphoric acid assisted rapid aqueous processing of NMC622 cathodes. RSC Sustain. 2023, 1, 378–387. [Google Scholar] [CrossRef]
  26. Kukay, A.; Sahore, R.; Parejiya, A.; Hawley, W.B.; Li, J.; Wood, D.L., III. Aqueous Ni-rich-cathode dispersions processed with phosphoric acid for lithium-ion batteries with ultra-thick electrodes. J. Colloid Interface Sci. 2021, 581, 635–643. [Google Scholar] [CrossRef] [PubMed]
  27. Neidhart, L.; Fröhlich, K.; Eshraghi, N.; Cupid, D.; Winter, F.; Jahn, M. Aqueous Manufacturing of Defect-Free Thick Multi-Layer NMC811 Electrodes. Nanomaterials 2022, 12, 317. [Google Scholar] [CrossRef] [PubMed]
  28. Zhu, P.; Trouillet, V.; Heißler, S.; Pfleging, W. Laser structuring of high mass loaded and aqueous acid processed Li(Ni0.6Mn0.2Co0.2)O2 cathodes for lithium-ion batteries. J. Energy Storage 2023, 66, 107401. [Google Scholar] [CrossRef]
  29. Pfleging, W.; Pröll, J. A new approach for rapid electrolyte wetting in tape cast electrodes for lithium-ion batteries. J. Mater. Chem. A 2014, 2, 14918–14926. [Google Scholar] [CrossRef]
  30. Habedank, J.B.; Günter, F.J.; Billot, N.; Gilles, R.; Neuwirth, T.; Reinhart, G.; Zaeh, M.F. Rapid electrolyte wetting of lithium-ion batteries containing laser structured electrodes: In situ visualization by neutron radiography. Int. J. Adv. Manuf. Technol. 2019, 102, 2769–2778. [Google Scholar] [CrossRef]
  31. Berhe, M.G.; Oh, H.G.; Park, S.-K.; Mondal, M.; Lee, D. Effect of laser-induced groove morphology on the wettability and performance of Lithium-ion batteries. Mater. Des. 2023, 231, 112020. [Google Scholar] [CrossRef]
  32. Park, J.; Jeon, C.; Kim, W.; Bong, S.-J.; Jeong, S.; Kim, H.-J. Challenges, laser processing and electrochemical characteristics on application of ultra-thick electrode for high-energy lithium-ion battery. J. Power Sources 2021, 482, 228948. [Google Scholar] [CrossRef]
  33. Zhu, P.; Seifert, H.J.; Pfleging, W. The ultrafast laser ablation of Li(Ni0.6Mn0.2Co0.2)O2 electrodes with high mass loading. Appl. Sci. 2019, 9, 4067. [Google Scholar] [CrossRef]
  34. Dunlap, N.; Sulas-Kern, D.B.; Weddle, P.J.; Usseglio-Viretta, F.; Walker, P.; Todd, P.; Boone, D.; Colclasure, A.M.; Smith, K.; de Villers, B.J.T. Laser ablation of Li-ion electrodes for fast charging: Material properties, rate capability, Li plating, and wetting. J. Power Sources 2022, 537, 231464. [Google Scholar] [CrossRef]
  35. Tran, M.X.; Smyrek, P.; Park, J.; Pfleging, W.; Lee, J.K. Ultrafast-Laser Micro-Structuring of LiNi0.8Mn0.1Co0.1O2 Cathode for High-Rate Capability of Three-Dimensional Li-ion Batteries. Nanomaterials 2022, 12, 3897. [Google Scholar] [CrossRef]
  36. Zheng, Y.; Seifert, H.; Shi, H.; Zhang, Y.; Kübel, C.; Pfleging, W. 3D silicon/graphite composite electrodes for high-energy lithium-ion batteries. Electrochim. Acta 2019, 317, 502–508. [Google Scholar] [CrossRef]
  37. Dubey, R.; Zwahlen, M.D.; Shynkarenko, Y.; Yakunin, S.; Fuerst, A.; Kovalenko, M.V.; Kravchyk, K.V. Laser Patterning of High-Mass-Loading Graphite Anodes for High-Performance Li-Ion Batteries. Batter. Supercaps 2021, 4, 464–468. [Google Scholar] [CrossRef]
  38. Meyer, A.; Ball, F.; Pfleging, W. The Effect of Silicon Grade and Electrode Architecture on the Performance of Advanced Anodes for Next Generation Lithium-Ion Cells. Nanomaterials 2021, 11, 3448. [Google Scholar] [CrossRef]
  39. Tsuda, T.; Ando, N.; Matsubara, K.; Tanabe, T.; Itagaki, K.; Soma, N.; Nakamura, S.; Hayashi, N.; Gunji, T.; Ohsaka, T. Improvement of high-rate charging/discharging performance of a lithium ion battery composed of laminated LiFePO4 cathodes/graphite anodes having porous electrode structures fabricated with a pico-second pulsed laser. Electrochim. Acta 2018, 291, 267–277. [Google Scholar] [CrossRef]
  40. Habedank, J.B.; Kriegler, J.; Zaeh, M.F. Enhanced fast charging and reduced lithium-plating by laser-structured anodes for lithium-ion batteries. J. Electrochem. Soc. 2019, 166, A3940. [Google Scholar] [CrossRef]
  41. Kriegler, J.; Hille, L.; Stock, S.; Kraft, L.; Hagemeister, J.; Habedank, J.B.; Jossen, A.; Zaeh, M.F. Enhanced performance and lifetime of lithium-ion batteries by laser structuring of graphite anodes. Appl. Energy 2021, 303, 117693. [Google Scholar] [CrossRef]
  42. Hille, L.; Toepper, H.-C.; Schriever, C.; Kriegler, J.; Keilhofer, J.; Noecker, M.P.; Zaeh, M.F. Influence of Laser Structuring and Calendering of Graphite Anodes on Electrode Properties and Cell Performance. J. Electrochem. Soc. 2022, 169, 060518. [Google Scholar] [CrossRef]
  43. Hille, L.; Kriegler, J.; Oehler, A.; Chaja, M.; Wagner, S.; Zaeh, M.F. Picosecond laser structuring of graphite anodes—Ablation characteristics and process scaling. J. Laser Appl. 2023, 35, 042054. [Google Scholar] [CrossRef]
  44. Zhu, P.; Ebert, B.; Smyrek, P.; Pfleging, W. The Impact of Structural Pattern Types on the Electrochemical Performance of Ultra-Thick NMC 622 Electrodes for Lithium-Ion Batteries. Batteries 2024, 10, 58. [Google Scholar] [CrossRef]
  45. Sterzl, Y.; Pfleging, W. Optimizing Structural Patterns for 3D Electrodes in Lithium-Ion Batteries for Enhanced Fast-Charging Capability and Reduced Lithium Plating. Batteries 2024, 10, 160. [Google Scholar] [CrossRef]
  46. Park, D.; Lee, D. Effect of fluence and multi-pass on groove morphology and process efficiency of laser structuring for 3D electrodes of lithium-ion batteries. Materials 2021, 14, 1283. [Google Scholar] [CrossRef] [PubMed]
  47. Habedank, J.B.; Schwab, D.; Kiesbauer, B.; Zaeh, M.F. Paving the way for industrial ultrafast laser structuring of lithium-ion battery electrodes by increasing the scanning accuracy. J. Laser Appl. 2020, 32, 022053. [Google Scholar] [CrossRef]
  48. Yamada, M.; Soma, N.; Tsuta, M.; Nakamura, S.; Ando, N.; Matsumoto, F. Development of a roll-to-roll high-speed laser micro processing machine for preparing through-holed anodes and cathodes of lithium-ion batteries. Int. J. Extrem. Manuf. 2023, 5, 035004. [Google Scholar] [CrossRef]
  49. Zhu, P.; Han, J.; Pfleging, W. Characterization and laser structuring of aqueous processed Li(Ni0.6Mn0.2Co0.2)O2 thick-film cathodes for lithium-ion batteries. Nanomaterials 2021, 11, 1840. [Google Scholar] [CrossRef]
  50. Stock, S.; Hagemeister, J.; Grabmann, S.; Kriegler, J.; Keilhofer, J.; Ank, M.; Dickmanns, J.L.; Schreiber, M.; Konwitschny, F.; Wassiliadis, N. Cell teardown and characterization of an automotive prismatic LFP battery. Electrochim. Acta 2023, 471, 143341. [Google Scholar] [CrossRef]
  51. Ank, M.; Sommer, A.; Gamra, K.A.; Schöberl, J.; Leeb, M.; Schachtl, J.; Streidel, N.; Stock, S.; Schreiber, M.; Bilfinger, P. Lithium-ion cells in automotive applications: Tesla 4680 cylindrical cell teardown and characterization. J. Electrochem. Soc. 2023, 170, 120536. [Google Scholar] [CrossRef]
  52. Sterzl, Y.; Pfleging, W. Extending the 3D-battery concept: Large areal ultrashort pulsed laser structuring of multilayered electrode coatings. In Proceedings of the Laser-based Micro-and Nanoprocessing XVII, San Francisco, CA, USA, 31 January–2 February 2023; pp. 114–122. [Google Scholar]
  53. Kwade, A.; Haselrieder, W.; Leithoff, R.; Modlinger, A.; Dietrich, F.; Droeder, K. Current status and challenges for automotive battery production technologies. Nat. Energy 2018, 3, 290–300. [Google Scholar] [CrossRef]
  54. Zhang, S.; Wang, X.; He, M.; Jiang, Y.; Zhang, B.; Hang, W.; Huang, B. Laser-induced plasma temperature. Spectrochim. Acta Part B At. Spectrosc. 2014, 97, 13–33. [Google Scholar] [CrossRef]
  55. Bolsinger, M.; Weller, M.; Ruck, S.; Kaya, P.; Riegel, H.; Knoblauch, V. Selective surface treatment by means of IR-laser–A new approach to enhance the rate capability of cathodes for Li-ion batteries. Electrochim. Acta 2020, 330, 135163. [Google Scholar] [CrossRef]
  56. Ku, H.H. Notes on the use of propagation of error formulas. J. Res. Natl. Bur. Stand. 1966, 70, 263–273. [Google Scholar] [CrossRef]
  57. Ogihara, N.; Itou, Y.; Sasaki, T.; Takeuchi, Y. Impedance spectroscopy characterization of porous electrodes under different electrode thickness using a symmetric cell for high-performance lithium-ion batteries. J. Phys. Chem. C 2015, 119, 4612–4619. [Google Scholar] [CrossRef]
  58. Nguyen, T.-T.; Demortière, A.; Fleutot, B.; Delobel, B.; Delacourt, C.; Cooper, S.J. The electrode tortuosity factor: Why the conventional tortuosity factor is not well suited for quantifying transport in porous Li-ion battery electrodes and what to use instead. npj Comput. Mater. 2020, 6, 123. [Google Scholar] [CrossRef]
  59. Neidhart, L.; Fröhlich, K.; Boz, B.; Winter, F.; Jahn, M. Layer by Layer: Improved Tortuosity in High Loading Aqueous NMC811 Electrodes. J. Electrochem. Soc. 2024, 171, 050532. [Google Scholar] [CrossRef]
  60. Landesfeind, J.; Gasteiger, H.A. Temperature and concentration dependence of the ionic transport properties of lithium-ion battery electrolytes. J. Electrochem. Soc. 2019, 166, A3079–A3097. [Google Scholar] [CrossRef]
  61. Song, Z.; Zhu, P.; Pfleging, W.; Sun, J. Electrochemical performance of thick-film Li(Ni0.6Mn0.2Co0.2)O2 cathode with hierarchic structures and laser ablation. Nanomaterials 2021, 11, 2962. [Google Scholar] [CrossRef]
  62. Hawley, W.B.; Parejiya, A.; Bai, Y.; Meyer, H.M., III; Wood, D.L., III; Li, J. Lithium and transition metal dissolution due to aqueous processing in lithium-ion battery cathode active materials. J. Power Sources 2020, 466, 228315. [Google Scholar] [CrossRef]
  63. Yu, X.; Manthiram, A. Electrode–electrolyte interfaces in lithium-based batteries. Energy Environ. Sci. 2018, 11, 527–543. [Google Scholar] [CrossRef]
  64. Landa-Medrano, I.; Eguia-Barrio, A.; Sananes-Israel, S.; Lijó-Pando, S.; Boyano, I.; Alcaide, F.; Urdampilleta, I.; de Meatza, I. In situ analysis of NMC∣graphite Li-ion batteries by means of complementary electrochemical methods. J. Electrochem. Soc. 2020, 167, 090528. [Google Scholar] [CrossRef]
  65. Plattard, T.; Barnel, N.; Assaud, L.; Franger, S.; Duffault, J.-M. Combining a fatigue model and an incremental capacity analysis on a commercial NMC/graphite cell under constant current cycling with and without calendar aging. Batteries 2019, 5, 36. [Google Scholar] [CrossRef]
  66. Jung, R.; Metzger, M.; Maglia, F.; Stinner, C.; Gasteiger, H.A. Oxygen release and its effect on the cycling stability of LiNixMnyCozO2 (NMC) cathode materials for Li-ion batteries. J. Electrochem. Soc. 2017, 164, A1361. [Google Scholar] [CrossRef]
  67. Weng, C.; Cui, Y.; Sun, J.; Peng, H. On-board state of health monitoring of lithium-ion batteries using incremental capacity analysis with support vector regression. J. Power Sources 2013, 235, 36–44. [Google Scholar] [CrossRef]
  68. Cui, Y.; Chen, J.; Zhao, J.; Ma, Z.; Tan, Y.; Xue, J.; Xu, H.; Nan, J. Aqueous Lithium Carboxymethyl Cellulose and Polyacrylic Acid/Acrylate Copolymer Composite Binder for the LiNi0.5Mn0.3Co0.2O2 Cathode of Lithium-Ion Batteries. J. Electrochem. Soc. 2022, 169, 010513. [Google Scholar] [CrossRef]
  69. Liang, L.; Hu, G.; Jiang, F.; Cao, Y. Electrochemical behaviours of SiO2-coated LiNi0.8Co0.1Mn0.1O2 cathode materials by a novel modification method. J. Alloys Compd. 2016, 657, 570–581. [Google Scholar] [CrossRef]
  70. An, S.J.; Li, J.; Du, Z.; Daniel, C.; Wood, D.L., III. Fast formation cycling for lithium ion batteries. J. Power Sources 2017, 342, 846–852. [Google Scholar] [CrossRef]
  71. Heinrich, M.; Wolff, N.; Harting, N.; Laue, V.; Röder, F.; Seitz, S.; Krewer, U. Physico-chemical Modeling of a lithium-ion battery: An ageing study with electrochemical impedance spectroscopy. Batter. Supercaps 2019, 2, 530–540. [Google Scholar] [CrossRef]
  72. Westerhoff, U.; Kurbach, K.; Lienesch, F.; Kurrat, M. Analysis of lithium-ion battery models based on electrochemical impedance spectroscopy. Energy Technol. 2016, 4, 1620–1630. [Google Scholar] [CrossRef]
  73. Middlemiss, L.A.; Rennie, A.J.; Sayers, R.; West, A.R. Characterisation of batteries by electrochemical impedance spectroscopy. Energy Rep. 2020, 6, 232–241. [Google Scholar] [CrossRef]
Figure 1. Schematic representation of the two laser structuring strategies using different laser powers to adjust the ablation width.
Batteries 10 00354 g001
Figure 2. Cross sectional analyses of laser structured NMC 622 cathodes with an average laser power of (a) 2.5 W and (b) 5.0 W, and double scans with 2.5 W laser power and an offset of (c) 30 µm, (d) 20 µm.
Batteries 10 00354 g002
Figure 3. Rate capability analyses of (a) cells containing laser structured PA-added NMC 622 cathodes with three different structuring strategies, and (b) the increase in specific discharge capacity of cells containing laser structured electrodes compared to those with unstructured PA-added electrodes.
Batteries 10 00354 g003
Figure 4. (a) Nyquist plot of EIS spectra (points) and respective fits (lines) of the symmetrical cells containing different types of laser structured and unstructured electrodes, and the equivalent circuit used for the data fitting, as well as the ionic resistance Rion derived from the EIS data; and (b) the acquired ionic resistance. The term “US” stands for “unstructured” electrodes.
Batteries 10 00354 g004
Figure 5. (a) specific discharge capacity of pouch cells (full-cells) containing different types of NMC 622 cathodes vs. graphite anodes with increasing C-rates from C/20 to 3C. (b) dQ/dV plots of the respective pouch cells from the third cycle during formation step at C/20.
Batteries 10 00354 g005
Figure 6. Ragone plots for the pouch cells containing unstructured or laser structured thick-film cathodes with PVDF binder or with water-soluble binder and PA addition. (a) Volumetric and (b) gravimetric energy density vs. power density are plotted, taking into account all cell components in a full-cell. A detailed description of the calculations can be found in Appendix A.
Batteries 10 00354 g006
Figure 7. Specific discharge capacities of pouch cells containing different types of electrodes at C/2 during lifetime analyses. After each 100 cycles at C/2, 3 cycles at C/5 were conducted to determine the capacity retention. The shaded areas indicate the deviations between cells containing the same type of electrodes.
Batteries 10 00354 g007
Figure 8. Nyquist plots of the pouch cells containing unstructured and laser structured thick-film NMC 622 cathodes with (a) water soluble binders and (b) PVDF binder at OCV of 3.6 V. EIS analyses were performed subsequently to rate capability and after every 100 cycles during the lifetime analyses. The respective fitting curves were related to the illustrated equivalent circuit model shown in (b) marked with red rectangle.
Batteries 10 00354 g008
Figure 9. Fitted charge transfer resistances. (a) R1 at higher frequency and (b) R2 at lower frequency of pouch cells containing different types of electrodes after different cycle numbers.
Batteries 10 00354 g009
Table 1. Laser structuring parameters for different types of electrodes used in cells.
ElectrodesAverage Laser Power [W]Laser Scan Speed [mm/s]Laser Repetition Rate [kHz]Line
Energy [J/m]
Laser Scans [-]Pitch [µm]
NMC 622 cathodes with PVDF as binder2.5500500522200
Aqueous processed NMC 622 cathodes2.5500500513200
Aqueous processed NMC 622 cathodes5.0500500107200
Graphite anodes3720,00010001.8592350
Table 2. Film thickness, active mass loading, and areal capacity of different types of electrodes.
Electrodes TypeFilm Thickness * [µm]Active Mass Loading [mg/cm2]Areal Capacity [mAh/cm2]
Ref. cathodes with PVDF150 ± 535.4 ± 0.66.1 ± 0.1
Cathodes with PA addition149 ± 435.5 ± 0.35.9 ± 0.1
Graphite anodes (thin)171 ± 319.5 ± 0.36.4 ± 0.1
Graphite anodes (thick)195 ± 422.0 ± 0.47.3 ± 0.2
* This film thickness does not contain the thickness of the current collector.
Table 3. Maximum width and FWHM of the groove structures in different types of electrodes and the respective active mass loading, areal capacity, and mass loss due to laser structuring.
Electrode TypeMax. Width [µm]FWHM [µm]Active Mass Loading [mg/cm2]Areal Capacity [mAh/cm2]Mass Loss [%]
Cathodes with PA addition, 2.5 W30 ± 313 ± 134.0 ± 0.15.6 ± 0.14.2 ± 1.3
Cathodes with PA addition, 5 W43 ± 426 ± 232.3 ± 0.35.3 ± 0.19.0 ± 1.5
Cathodes with PA addition, 2.5 W, with offset50 ± 425 ± 331.9 ± 0.25.3 ± 0.110.2 ± 1.9
Ref. cathodes with PVDF, 2.5 W33 ± 210 ± 233.6 ± 0.25.8 ± 0.23.4 ± 2.2
Anode (thick)46 ± 528 ± 219.4 ± 0.46.4 ± 0.112.0 ± 3.3
Table 4. Initial CE and discharge capacity of pouch cells containing different types of NMC 622 cathodes from the formation step at C/20.
Cathode TypeInitial CE [%]Initial Discharge Capacity [mAh/g]
PA, 2.5 W81.7 ± 0.7120 ± 4
PA, 2.5 W, offset84.3 ± 3.3125 ± 3
PA, US83.8 ± 1.697 ± 15
Ref. PVDF, 2.5 W86.0 ± 3.2157 ± 12
Ref. PVDF, US83.3 ± 3.1126 ± 23
Disclaimer/Publisher’s Note: The statements, opinions and data contained in all publications are solely those of the individual author(s) and contributor(s) and not of MDPI and/or the editor(s). MDPI and/or the editor(s) disclaim responsibility for any injury to people or property resulting from any ideas, methods, instructions or products referred to in the content.

